Generico Annual report 2007 Plotting the right course · Generico is a leading designer and...
79
Generico Annual report 2007 Plotting the right course
-
Upload
truongphuc -
Category
Documents
-
view
213 -
download
0
Transcript of Generico Annual report 2007 Plotting the right course · Generico is a leading designer and...
Generico Annual report 2007
Plotting the right course
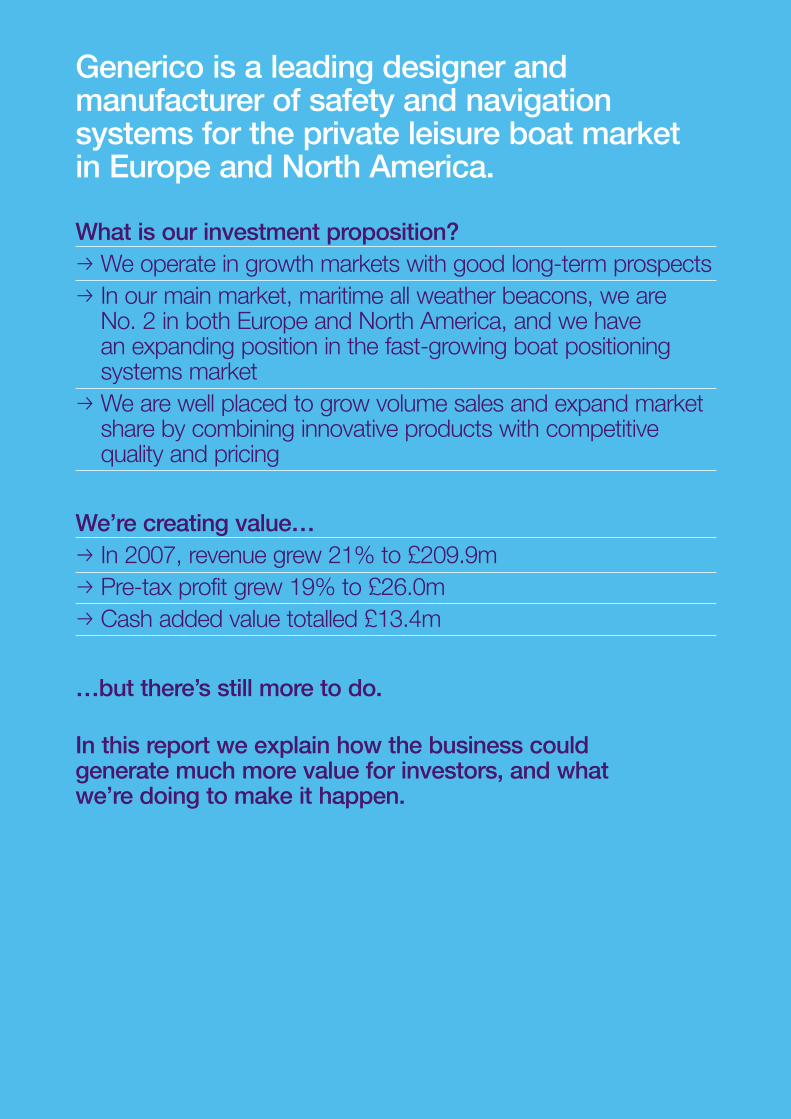
Generico is a leading designer andmanufacturer of safety and navigationsystems for the private leisure boat market in Europe and North America.
What is our investment proposition?p We operate in growth markets with good long-term prospectsp In our main market, maritime all weather beacons, we are
No. 2 in both Europe and North America, and we have an expanding position in the fast-growing boat positioningsystems market
p We are well placed to grow volume sales and expand marketshare by combining innovative products with competitivequality and pricing
We’re creating value…p In 2007, revenue grew 21% to £209.9mp Pre-tax profit grew 19% to £26.0mp Cash added value totalled £13.4m
…but there’s still more to do.
In this report we explain how the business could generate much more value for investors, and what we’re doing to make it happen.
Generico Annual report 2007 01O
verview01-11
Our
markets
12-17O
urgroup
strategy18-23
Our
strategyin
action24-37
Ourdelivery
ofvalue38-47
Our
accounts48-76
Overview
02 What do we do?04 What’s our strategy?05 How are we doing?06 Have we outperformed our markets?08 Chief Executive’s statement
Our markets
14 What are our markets?p Maritime all weather beaconsp Boat positioning systems
15 Why are these markets attractive?p Growth in leisure boat salesp Products fitted into new boats
16 Challenges and success factors
Our group strategy
20 How are we making the strategy a reality?22 Strategy progress statement
p Key performance indicatorsp Performance vs targets
Our strategy in action
26 All Weather Beaconsp Market competitivenessp Operational excellencep Outlook
34 Global Positioning Systems
Our delivery of value
40 How do we measure value creation?40 Have we created value in 2007?41 Overview of our economic performance42 What’s driving our revenue growth?43 Modelling the future45 How have we used the cash generated?
Contents
Our accounts
51 Profit and loss account52 Statement of total recognised income and expense (SORIE)53 Balance sheet54 Cash flow statement56 Notes to the financial statements
Additional information72 Glossary74 Reconciliation of Non-GAAP measures75 Index
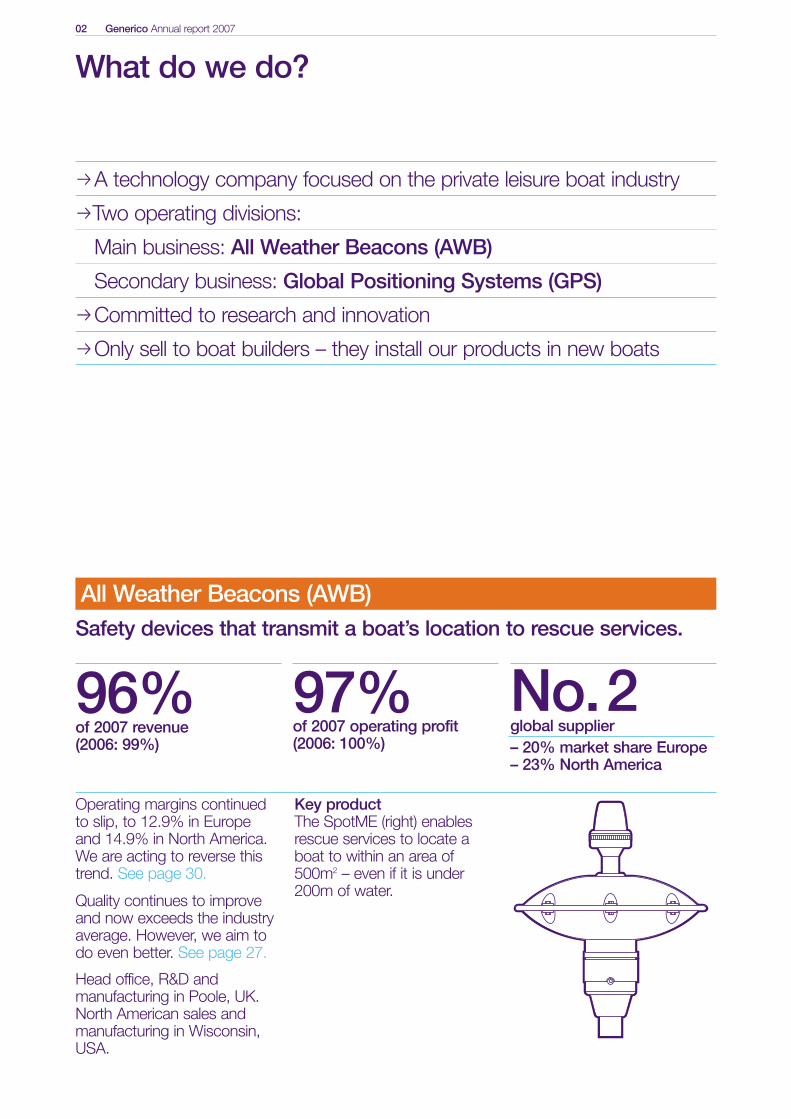
Operating margins continuedto slip, to 12.9% in Europeand 14.9% in North America.We are acting to reverse thistrend. See page 30.
Quality continues to improveand now exceeds the industryaverage. However, we aim todo even better. See page 27.
Head office, R&D andmanufacturing in Poole, UK. North American sales andmanufacturing in Wisconsin,USA.
Key productThe SpotME (right) enablesrescue services to locate aboat to within an area of500m2 – even if it is under200m of water.
02 Generico Annual report 2007
pA technology company focused on the private leisure boat industry
pTwo operating divisions:
Main business: All Weather Beacons (AWB)
Secondary business: Global Positioning Systems (GPS)
pCommitted to research and innovation
pOnly sell to boat builders – they install our products in new boats
What do we do?
All Weather Beacons (AWB)
97%96% No.2Safety devices that transmit a boat’s location to rescue services.
of 2007 revenue(2006: 99%)
of 2007 operating profit(2006: 100%)
global supplier– 20% market share Europe– 23% North America
A new division formed from the acquisition of Tracker Navigation, thepioneer in low-cost leisureboat positioning devices.
Operating margins continuedto improve, to 8.9% in 2007.See page 07.
Quality continues to improve:we beat our 2007 targets andhave set more aggressivetargets for the future. See page 35.
Head office, R&D andmanufacturing in Poole, UK.
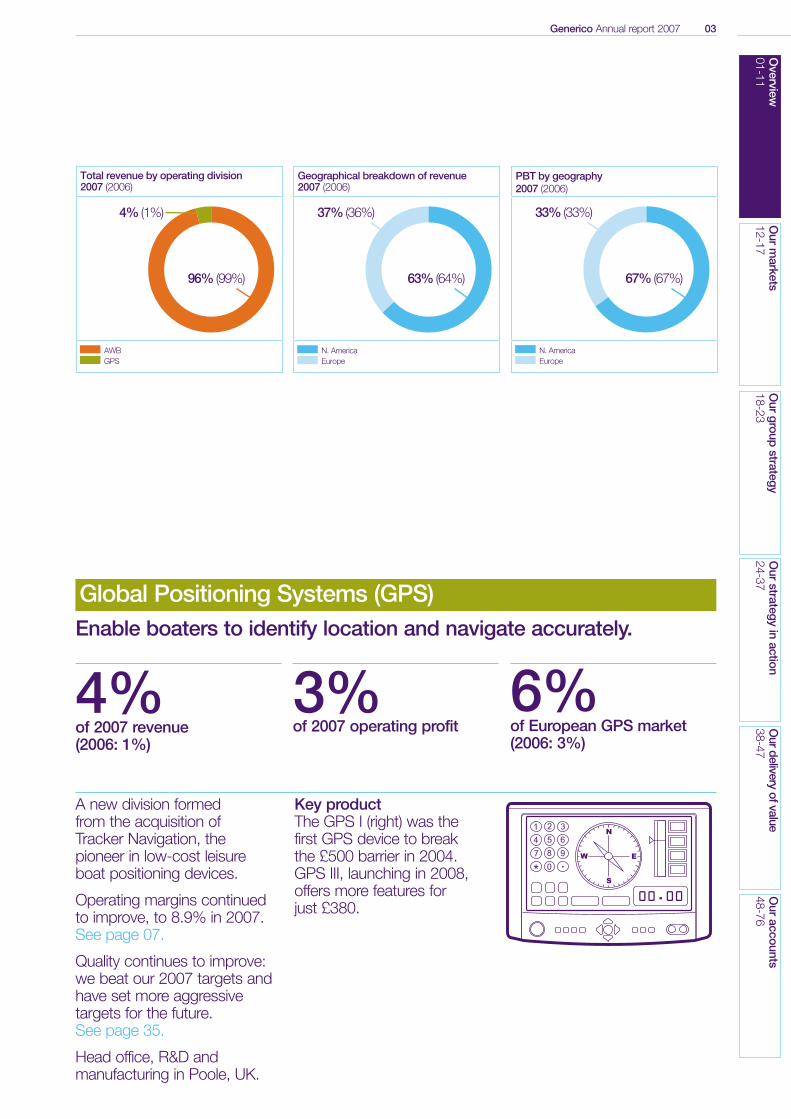
Key productThe GPS I (right) was the first GPS device to break the £500 barrier in 2004.GPS III, launching in 2008,offers more features for just £380.
Generico Annual report 2007 03O
verview01-11
Our m
arkets12-17
Our group
strategy18-23
Our strategy in action
24-37O
ur delivery of value38-47
Our accounts
48-76
Total revenue by operating division 2007 (2006)
96% (99%)
AWBGPS
Geographical breakdown of revenue2007 (2006)
63% (64%)
37% (36%)4% (1%)
N. AmericaEurope
Total PBT 2007 (2006)
98% (99%)
AWBGPS
PBT by geography 2007 (2006)
67% (67%)
33% (33%)2% (1%)
N. AmericaEurope
Global Positioning Systems (GPS)
3%4% 6%Enable boaters to identify location and navigate accurately.
of 2007 revenue(2006: 1%)
of 2007 operating profit of European GPS market(2006: 3%)
04 Generico Annual report 2007
What’s our strategy?
Market competitiveness
Meeting customerexpectations
Developingnext-generation products
1Operational excellence2
Shareholder value
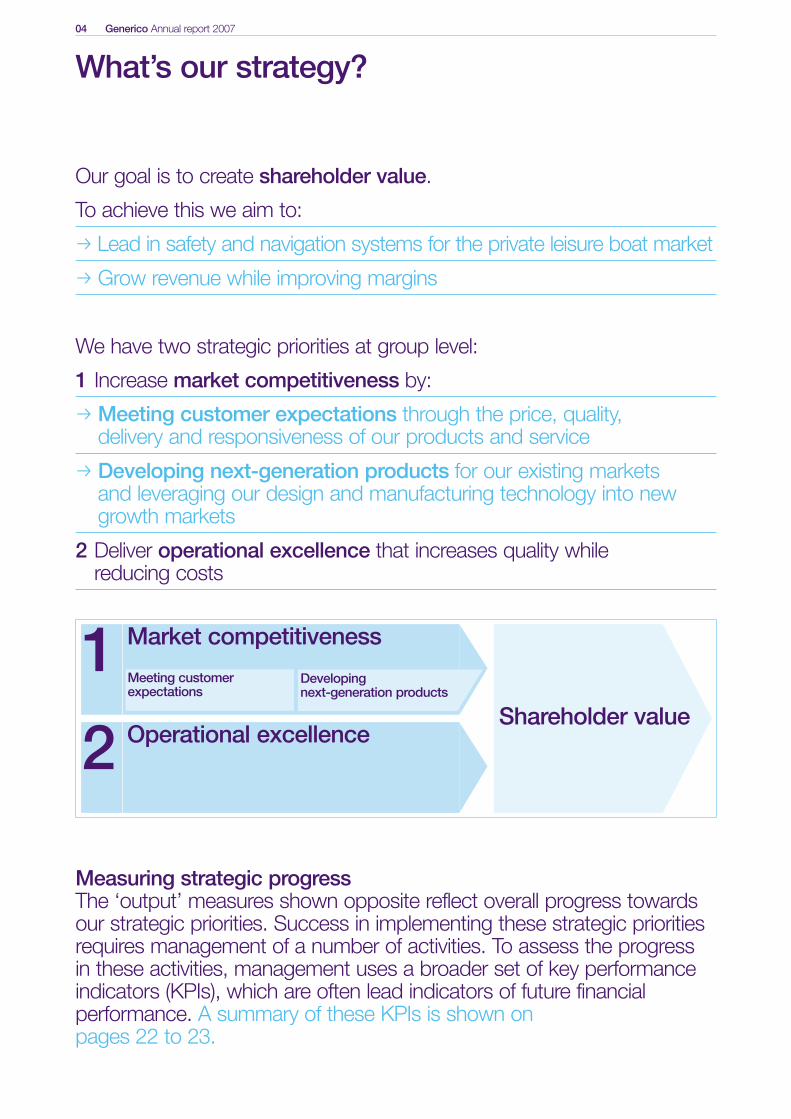
Our goal is to create shareholder value.
To achieve this we aim to:
p Lead in safety and navigation systems for the private leisure boat market
p Grow revenue while improving margins
We have two strategic priorities at group level:
1 Increase market competitiveness by:
p Meeting customer expectations through the price, quality,delivery and responsiveness of our products and service
p Developing next-generation products for our existing marketsand leveraging our design and manufacturing technology into new growth markets
2 Deliver operational excellence that increases quality while reducing costs
Measuring strategic progressThe ‘output’ measures shown opposite reflect overall progress towardsour strategic priorities. Success in implementing these strategic prioritiesrequires management of a number of activities. To assess the progressin these activities, management uses a broader set of key performanceindicators (KPIs), which are often lead indicators of future financialperformance. A summary of these KPIs is shown on pages 22 to 23.
Generico Annual report 2007 05O
verview01-11
Our m
arkets12-17
Our group
strategy18-23
Our strategy in action
24-37O
ur delivery of value38-47
Our accounts
48-76
2004 2005 2006 2007
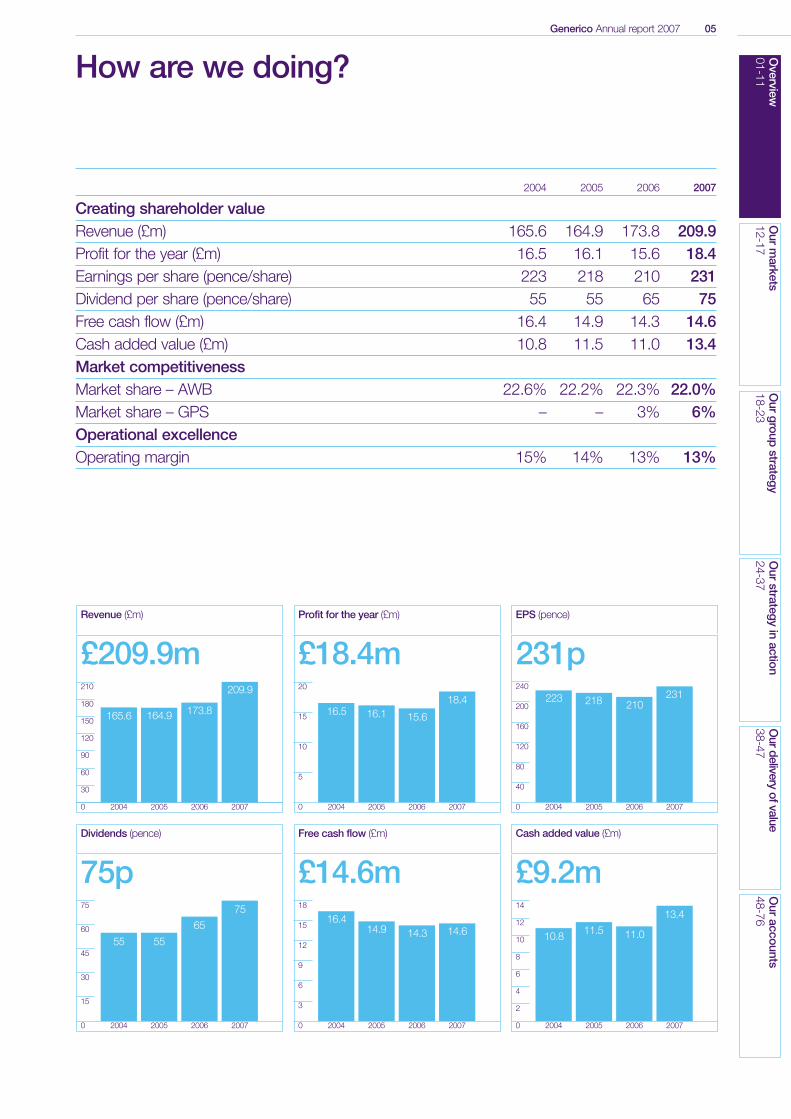
Creating shareholder valueRevenue (£m) 165.6 164.9 173.8 209.9Profit for the year (£m) 16.5 16.1 15.6 18.4Earnings per share (pence/share) 223 218 210 231Dividend per share (pence/share) 55 55 65 75Free cash flow (£m) 16.4 14.9 14.3 14.6Cash added value (£m) 10.8 11.5 11.0 13.4Market competitivenessMarket share – AWB 22.6% 22.2% 22.3% 22.0%Market share – GPS – – 3% 6%Operational excellenceOperating margin 15% 14% 13% 13%
How are we doing?
Revenue (£m)
210
180
150
120
90
60
30
0 2004 2005 2006 2007
£209.9m
165.6 164.9 173.8
209.9
2004 2005 2006 2007
2004 2005 2006 2007 2004 2005 2006 2007
16.5 16.1 15.6
18.4
2004 2005 2006 2007
2004 2005 2006 2007
223
Profit for the year (£m)
20
15
10
5
0
£18.4mEPS (pence)
240
160
200
120
80
40
0
231p
Dividends (pence)
75
60
45
30
15
0
75p
55 55
65
75
Free cash flow (£m)
18
15
12
9
6
3
0
£14.6m16.4
14.9 14.3 14.6
Cash added value (£m)
14
12
10
8
6
4
2
0
£9.2m
10.8 11.5 11.0
13.4
218 210231
06 Generico Annual report 2007
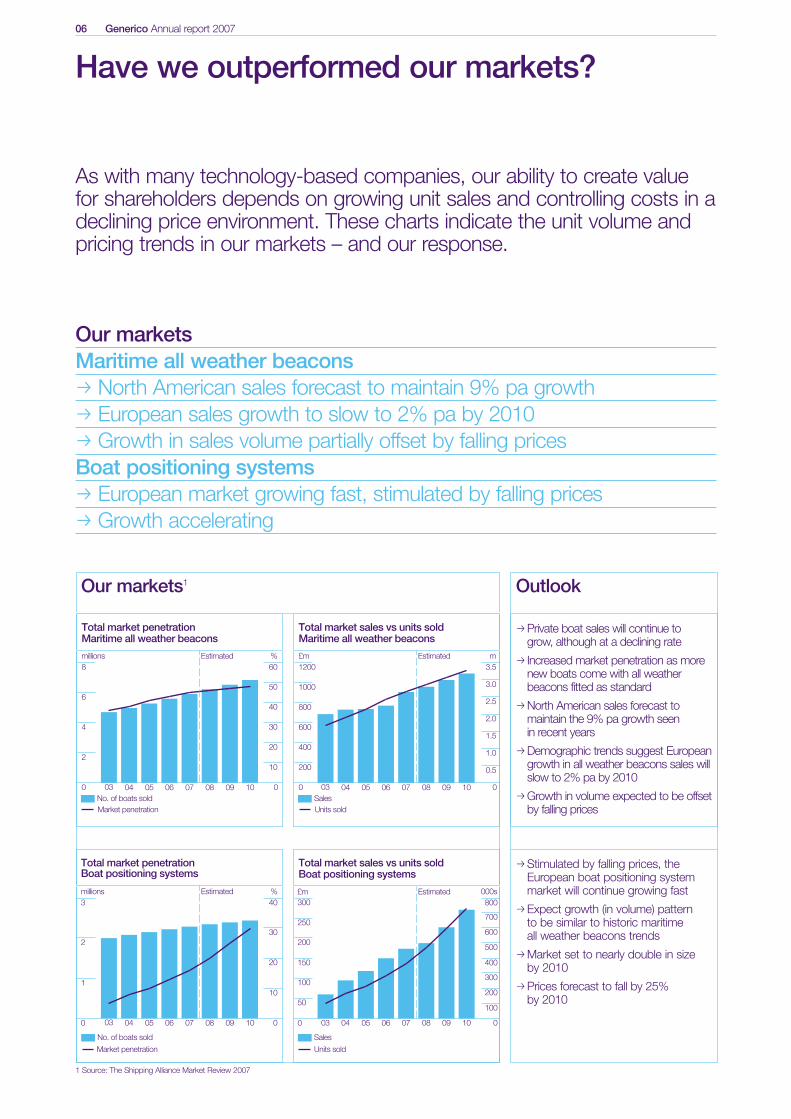
As with many technology-based companies, our ability to create valuefor shareholders depends on growing unit sales and controlling costs in adeclining price environment. These charts indicate the unit volume andpricing trends in our markets – and our response.
Our marketsMaritime all weather beaconsp North American sales forecast to maintain 9% pa growthp European sales growth to slow to 2% pa by 2010p Growth in sales volume partially offset by falling pricesBoat positioning systemsp European market growing fast, stimulated by falling pricesp Growth accelerating
Have we outperformed our markets?
Outlook
pPrivate boat sales will continue to grow, although at a declining rate
p Increased market penetration as morenew boats come with all weatherbeacons fitted as standard
pNorth American sales forecast tomaintain the 9% pa growth seen in recent years
pDemographic trends suggest Europeangrowth in all weather beacons sales willslow to 2% pa by 2010
pGrowth in volume expected to be offsetby falling prices
pStimulated by falling prices, theEuropean boat positioning systemmarket will continue growing fast
pExpect growth (in volume) pattern to be similar to historic maritime all weather beacons trends
pMarket set to nearly double in size by 2010
pPrices forecast to fall by 25%by 2010
1 Source: The Shipping Alliance Market Review 2007
Our markets1
Total market penetrationBoat positioning systems
3millions
2
1
0
40
30
20
10
0
050403 06 07 08 09 10
No. of boats sold
Estimated
Estimated
050403 06 07 08 09 10
Estimated
Total market sales vs units soldBoat positioning systems
800
700
600
000s
500
400
200
300
100
0050403 06 07 08 09 10
Sales
Units sold
£m%
Total market penetrationMaritime all weather beacons
8millions %
6
4
2
60
50
40
30
20
10
0 0No. of boats soldMarket penetration
050403 06 07 08 09 10
Estimated
Total market sales vs units soldMaritime all weather beacons
1200£m m
800
600
1000
400
200
3.5
3.0
2.5
2.0
1.5
1.0
0.5
0 0SalesUnits sold
Market penetration
300
250
200
150
50
0
100
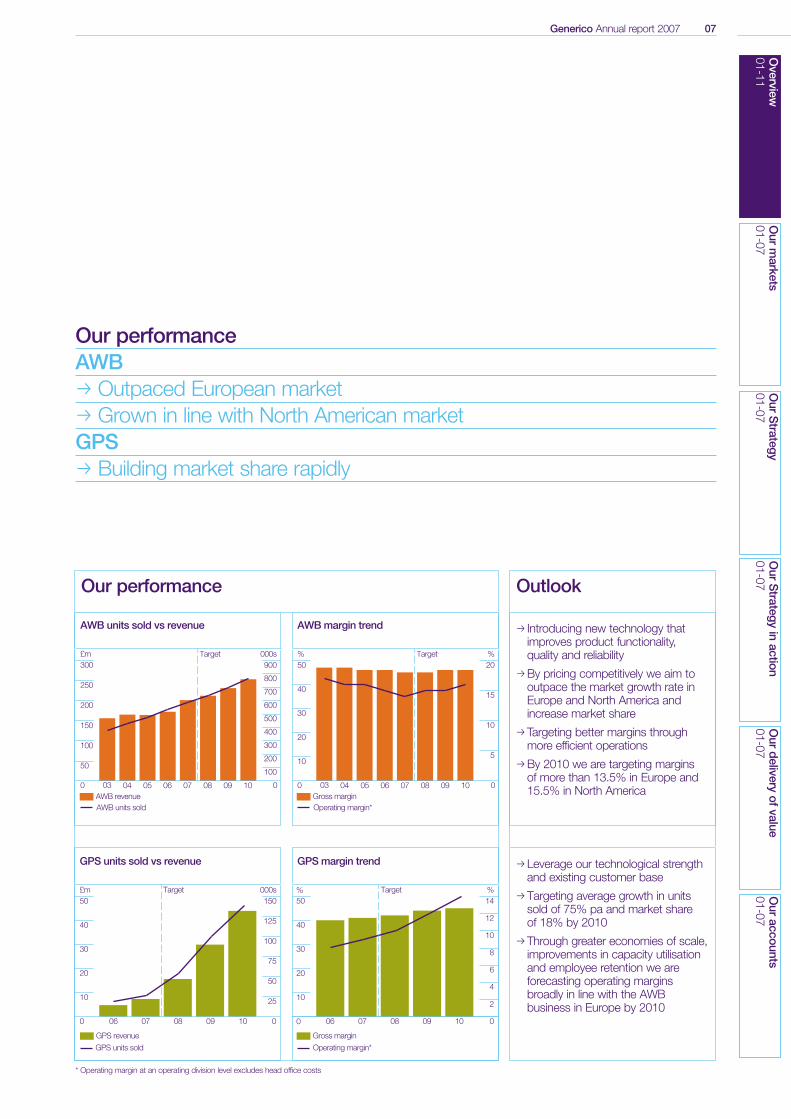
Our performanceAWBp Outpaced European marketp Grown in line with North American marketGPSp Building market share rapidly
* Operating margin at an operating division level excludes head office costs
Generico Annual report 2007 07
Our performance Outlook
p Introducing new technology thatimproves product functionality, quality and reliability
pBy pricing competitively we aim tooutpace the market growth rate inEurope and North America andincrease market share
pTargeting better margins throughmore efficient operations
pBy 2010 we are targeting margins of more than 13.5% in Europe and15.5% in North America
pLeverage our technological strengthand existing customer base
pTargeting average growth in unitssold of 75% pa and market share of 18% by 2010
pThrough greater economies of scale,improvements in capacity utilisationand employee retention we areforecasting operating marginsbroadly in line with the AWBbusiness in Europe by 2010
GPS units sold vs revenue
150
125
100
75
000s
50
25
0
50
40
30
20
10
0
050403 06 07 08 09 10
GPS revenue
Target
06 07 08 09 10 06 07 08 09 10
Target
GPS margin trend
Gross margin
Operating margin*
%£m14
12
10
8
6
4
2
0
Target %
AWB units sold vs revenue
300£m 000s
250
200
50
100
150
900
700
800
500
600
400
100
200
300
0 0
%20
15
10
5
0AWB revenueAWB units sold
050403 06 07 08 09 10
Target
AWB margin trend
50%
40
20
30
10
0Gross marginOperating margin*
GPS units sold
50
40
30
20
10
0
Overview
01-11O
ur markets
01-07O
ur Strategy
01-07O
ur Strategy in action
01-07O
ur delivery of value
01-07O
ur accounts01-07
08 Generico Annual report 2007
Chief Executive’s statement
We had a good year in 2007, but we have the potential to do much better.
We increased revenue by 21% and pre-taxprofit by 19%. We maintained the improvementin cash flow. And we increased our share of theEuropean maritime all weather beacon market.But it would be wrong to imply that everything in the garden is rosy. Of course, we want investors to note our strengths. But our future success will come not just from playing to our strengths, but also byaddressing our weaknesses.
Generico Annual report 2007 09O
verview01-11
Our m
arkets12-17
Our group
strategy18-23
Our strategy in action
24-37O
ur delivery of value38-47
Our accounts
48-76
CEOs tend not to dwell on their companies’ weak points. But I believe our most significant achievement in the past year is the actionwe have taken to identify and rectify vulnerabilities. This has not beenabout quick fixes. It has been about plotting a new course towardsmore rapid growth and more sustainable long-term success.
We have addressed the quality issues that have weakened ourposition in the huge North American market. We have invested in new technology and new product development to sustain marketcompetitiveness, create new market opportunities and reduce ourdependence on the maritime all weather beacon market. And we aredriving down costs so that we can reverse falling margins while alsopricing competitively. The benefits are already becoming evident in this year’s trading.
Financial resultsIn 2007 we increased revenue by 21% to £209.9m. This reflectedparticularly good growth in our core all weather beacon markets,exchange rate movements and a full year’s contribution from Tracker Navigation, which we acquired in October 2006. This business, now our GPS division, has fully met our expectations: its 2007 revenue was up 35% compared with the previous 12 months, albeit from a relatively small base.
Our North American revenue benefited from exceptional exchangerate fluctuations: the 11% increase in the average sterling to US dollarrate increased our reported sales by £15.0m.
Pre-tax profit grew 19% to £26.0m. This was a respectableperformance in a technology-based market where falling prices putrelentless pressure on margins.
Operating margins have continued to tighten. At the same time wehave been investing heavily for the future. Our spending on R&D morethan tripled to £4.9m last year, and will rise further: we aim to invest10% of revenue on R&D by 2010. As our revenue grew, workingcapital rose by £1.7m, excluding exchange-related movements.In addition, we invested £0.8m more than in 2006 in upgradingproduction facilities to increase capacity, quality and efficiency(from £5.7m to £6.5m). Despite this, through strong revenue growth,we achieved a 22% increase in cash added value, our preferredmeasure of value creation, to £13.4m. Our economic return increasedfrom 19% in 2006 to 23% – comfortably above our estimatedweighted average cost of capital (9.8%) and well above our historic levels. For more details on value creation, see page 40.
DividendImplementation of our strategy is progressing as planned, anddelivering the results we promised. We are therefore recommending a dividend of 75 pence/share, payable to ordinary shareholders, anincrease of 15%.
‘This was a respectable performance in a technology-based market where falling prices put relentless pressure on margins.’
‘Our most significant achievement in the past year is the action we have taken to identify and rectify vulnerablilities.’
10 Generico Annual report 2007
StrategyOur strategy aims to create shareholder value by increasingmarket competitiveness, by meeting customer expectations anddeveloping next-generation products, and delivering operationalexcellence – For details, see page 04.
I am delighted by the progress we have made on all fronts in the pastyear – particularly by our work to identify and remove impediments tofurther success through our Fast Forward programme. Launched in2007, this is designed to support both elements of our strategy by delivering improvements in quality and delivery while reducingoperating costs. For details, see page 20.
It is clear that we have not been meeting customer expectationsconsistently on quality – particularly in North America, where this hascost us our coveted market leadership. We have been taking rigorousaction on quality under our Fast Forward programme. As a result, ourAWB division is already ahead of industry quality norms in Europe andin line with the average in North America. Our goal is to move rapidlyto clear industry leadership. For details, see page 27.
Customers’ expectations are a moving target: to stay competitive we must keep developing next-generation products that offer everbetter performance and value. In recent years we have focused toomuch on improving our existing lines. We have begun to increase the percentage of revenue arising from new products, but it remainsfar too low. In 2007 we enhanced our new product developmentprocess: by 2012, our target is to generate 20% of revenue from new products less than two years old – compared with 8% in 2007.
The acquisition of Innovsea has given us exciting new technology toexploit. As a result, we are developing new all weather beacon modelsthat will make us more price competitive and have the potential totake us into new markets – including jet skis and skidoos, mountainbiking, climbing and hiking. For details, see page 29.
This could further advance the diversification of the business, which is already making good progress through the rapid growth of our GPS division. For details, see page 34. It makes sense for us tobroaden into new markets where our technology and skills arerelevant – not only to spread risk, but also because our ambition isultimately to grow the group at a faster pace than the growth rate ofthe maritime all weather beacon market will allow.
New technology will help us to keep offering more performance for less cost – a competitive necessity in markets where prices arealways trending downwards. But how will we protect our margins?Here, too, we must own up to not working hard enough.
Our margins have slipped for five years in a row. We do not have to accept this as a fact of life: our Fast Forward programme has identified ample opportunity for reducing production costs. We are targeting a steady increase in margins from 2008 onwards.For details, see page 07.
Chief Executive’s statement continued
‘To stay competitive we must keep developing next-generation products.’
Generico Annual report 2007 11O
verview01-11
Our m
arkets12-17
Our group
strategy18-23
Our strategy in action
24-37O
ur delivery of value38-47
Our accounts
48-76
AcquisitionsWe acquired Innovsea in July 2007 for £4m and have integrated it into our AWB division. It was a small business, employing just 40 people, but it has developed technology that will be invaluable for miniaturising our next generations of all weather beacon and,potentially, positioning system products. This technology is protected by several patents that should secure us significantcompetitive advantage.
PeopleThe skills, knowledge and dedication of our staff are important to us.We are grateful to them for what they have achieved this year, anddetermined to earn their loyalty. This is not philanthropy. We haveidentified our current levels of staff turnover as an unnecessary wasteof expertise and money: a single percentage point improvement in staff retention would bring a 0.75% increase in operating margin. We urgently need to increase staff commitment and loyalty, so tosupport Fast Forward we have introduced the ORTS employeeincentive scheme. For details, see page 20.
Corporate reportingThis year’s annual report looks very different from its predecessors. It reflects our desire to achieve the highest standards of governanceand openness with investors. We believe the International AccountingStandards Board’s Management Commentary Discussion Paper points the way forward in corporate reporting and we have used it as our guide. We hope this will help investors to assess our strategyand performance.
OutlookWe spent 2007 bolstering our strong points and addressing theweaker ones. As a result, Generico is now a considerably more robust business. Our markets continue to grow; and, although theyremain extremely competitive, we have honed our competitive edge.
We are not content to be No. 2 in our key markets: market leadership in maritime all weather beacons offers significant marketingand credibility benefits that we can use to support other businessstreams, particularly our GPS business. We are just one percentagepoint behind the all weather beacons leader in Europe, and two pointsbehind in North America. In both markets, leadership is within ourgrasp if we stay focused on our strategic objectives. In the newerpositioning systems market we are very much a challenger brand, but with rapidly growing sales and market share.
In the past year we have firmly established our new strategy, GPSdivision, product development process, Fast Forward programme and employee incentive scheme. The benefits will be increasinglyapparent from 2008 onwards, in both revenue growth and profitability.
‘In both markets, leadership is within our grasp if we stay focused on our strategic objectives.’
‘Our markets continue to grow; and, although they remain extremely competitive, we have honed our competitive edge.’
Gene RicoChief Executive
12 Generico Annual report 2007
Generico Annual report 2007 13O
verview01-11
Our m
arkets12-17
Our group
strategy18-23
Our strategy in action
24-37O
ur delivery of value38-47
Our accounts
48-76
Our markets
We operate in markets that offer excellent growth opportunities for innovative, efficient businesses.
In this section we address the following questions:
p What are our markets?
p Why are they attractive to us?
p What are the challenges – particularly in growing margins when prices are falling?
p What do we need to succeed?
Key points:
p Leisure boat sales are growing
p More new boats have weather beacons and positioning systems
p Cheaper technology means prices are falling
p Strong growth in sales volume but pressure on margins
14 Generico Annual report 2007
What are our markets?We operate in North America and Europe, with some 63% of ourrevenue and 67% of profits coming from North America.
Maritime all weather beacons Maritime all weather beacons enable rescue services to locate boatsrapidly and accurately in all weather conditions. They are vital safetyequipment for all types of leisure craft, both powered and sail. We sell them to leisure boat builders, who include them in theirspecifications to meet growing consumer demand and todemonstrate their commitment to boaters’ safety.
We are committed to offering products with the highest levels of faulttolerance and accuracy. Because of this we currently sell only tooriginal equipment manufacturers (OEMs) rather than targeting theretrofit market. As OEMs design their new boat lines with a specificbeacon in mind, this strategy gives us a degree of visibility in demand.
New technology is making it possible to design devices suitable forretrofitting that will meet our exacting performance standards. We arecurrently developing a device for the retrofit market – estimated to be about twice the size of the OEM market but with lower margins –for launch in 2010.
Demand is growing faster in North America than in Europe, wheredemographic trends are less favourable. As a result, we expect North America’s share of our AWB division’s revenue to reach 67%over the next three years.
Boat positioning systemsBoat positioning system devices operate in a similar way to thosemade for cars, enabling boaters to identify their location and navigate accurately to their chosen destination. In October 2006, we completed our acquisition of Tracker Navigation, a leadingmanufacturer of an innovative positioning system device designedspecifically for leisure boats. This formed the kernel of our growingGPS division, which currently serves the OEM segment of theEuropean leisure boat market.
Until relatively recently, the cost of positioning system devicesdiscouraged manufacturers from including them in the specifications of all but the most luxurious leisure boats. In 2004,Tracker Navigation changed the rules of the game by launching the first positioning system device to break the £500 price barrier. This has transformed OEMs’ interest in building positioning systemdevices into their designs.
Our GPS division maintains a leading position in accessibly pricedpositioning system technology, a growing proportion of the overallboat positioning system market.
Our markets
For more information, go to: www.generico.co.uk/ourmarkets
‘Demand is growing faster in North America than in Europe, where demographic trends are less favourable.’
‘Our GPS division maintains a leading position in accessibly priced positioning system technology,a growing proportion of the overall positioningsystem market.’
Generico Annual report 2007 15O
verview01-11
Our m
arkets12-17
Our group
strategy18-23
Our strategy in action
24-37O
ur delivery of value38-47
Our accounts
48-76
Why are these markets attractive?There are two key reasons why we believe these markets offer usattractive long-term opportunities:
i. The growth in leisure boat sales
ii. More new boats have all weather beacons and positioning systemsfitted as standard
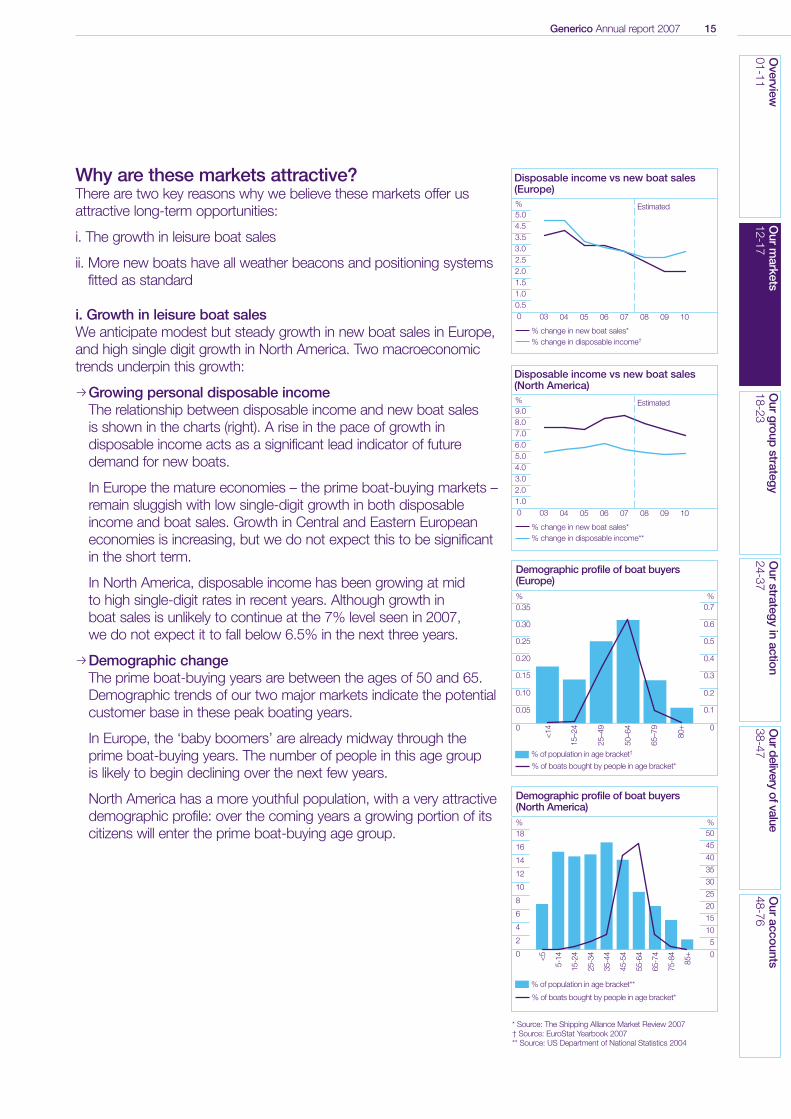
i. Growth in leisure boat salesWe anticipate modest but steady growth in new boat sales in Europe,and high single digit growth in North America. Two macroeconomictrends underpin this growth:
pGrowing personal disposable incomeThe relationship between disposable income and new boat sales is shown in the charts (right). A rise in the pace of growth indisposable income acts as a significant lead indicator of futuredemand for new boats.
In Europe the mature economies – the prime boat-buying markets –remain sluggish with low single-digit growth in both disposableincome and boat sales. Growth in Central and Eastern Europeaneconomies is increasing, but we do not expect this to be significantin the short term.
In North America, disposable income has been growing at mid to high single-digit rates in recent years. Although growth in boat sales is unlikely to continue at the 7% level seen in 2007, we do not expect it to fall below 6.5% in the next three years.
pDemographic change The prime boat-buying years are between the ages of 50 and 65.Demographic trends of our two major markets indicate the potentialcustomer base in these peak boating years.
In Europe, the ‘baby boomers’ are already midway through theprime boat-buying years. The number of people in this age group is likely to begin declining over the next few years.
North America has a more youthful population, with a very attractivedemographic profile: over the coming years a growing portion of itscitizens will enter the prime boat-buying age group.
Disposable income vs new boat sales(North America)
9.0%
7.0
5.0
3.0
1.0
% change in new boat sales*% change in disposable income**
8.0
6.0
4.0
2.0
Estimated
050403 06 07 08 09 100
Disposable income vs new boat sales(Europe)
5.0%
3.5
2.5
1.5
0.5
% change in new boat sales*% change in disposable income†
4.5
3.0
2.0
1.0
Estimated
050403 06 07 08 09 100
Demographic profile of boat buyers(North America)%
% of population in age bracket**
% of boats bought by people in age bracket*
%
Demographic profile of boat buyers(Europe)
0.35
0.30
0.25
%
0.20
0.15
0.05
0.10
0
% of population in age bracket†
% of boats bought by people in age bracket*
%
0
50
45
40
35
25
30
20
15
10
50
18
16
12
14
8
10
6
2
4
<5
5-14
15-2
4
25-3
4
35-4
4
45-5
4
55-6
4
65-7
4
75-8
4
85+
0.7
0.6
0.5
0.4
0.2
0.3
0.1
0
<14
15–2
4
25–4
9
50–6
4
65–7
9
80+
* Source: The Shipping Alliance Market Review 2007† Source: EuroStat Yearbook 2007** Source: US Department of National Statistics 2004
16 Generico Annual report 2007
ii. More new boats have these types of products fittedas standardThe proportion of new leisure boats fitted with all weather beaconsand positioning systems has been growing steadily. We expect thatgrowth to continue, albeit more slowly in Europe.
All weather beacons Several factors are increasing the proportion ofnew leisure boats fitted with all weather beacons as standard:p An increasing safety culturep A more litigious environment, particularly in the USp Significant reductions (>20%) in insurance premiums for boats
with all weather beaconsp Charter companies insisting on fitted all weather beacons.
Positioning systems In the automotive market, the falling price ofboat positioning system units has brought rapid growth in sales. We expect the leisure boat positioning systems market to follow asimilar trend. New players, including our GPS division, have beenapplying the advanced technology available in the auto industry todevelop reliable positioning systems devices costing under £500.In Europe, we expect the proportion of new boats fitted withpositioning systems to double from 15% in 2007 to 30% in 2010. This implies annual volume growth of over 20% for the next three years.
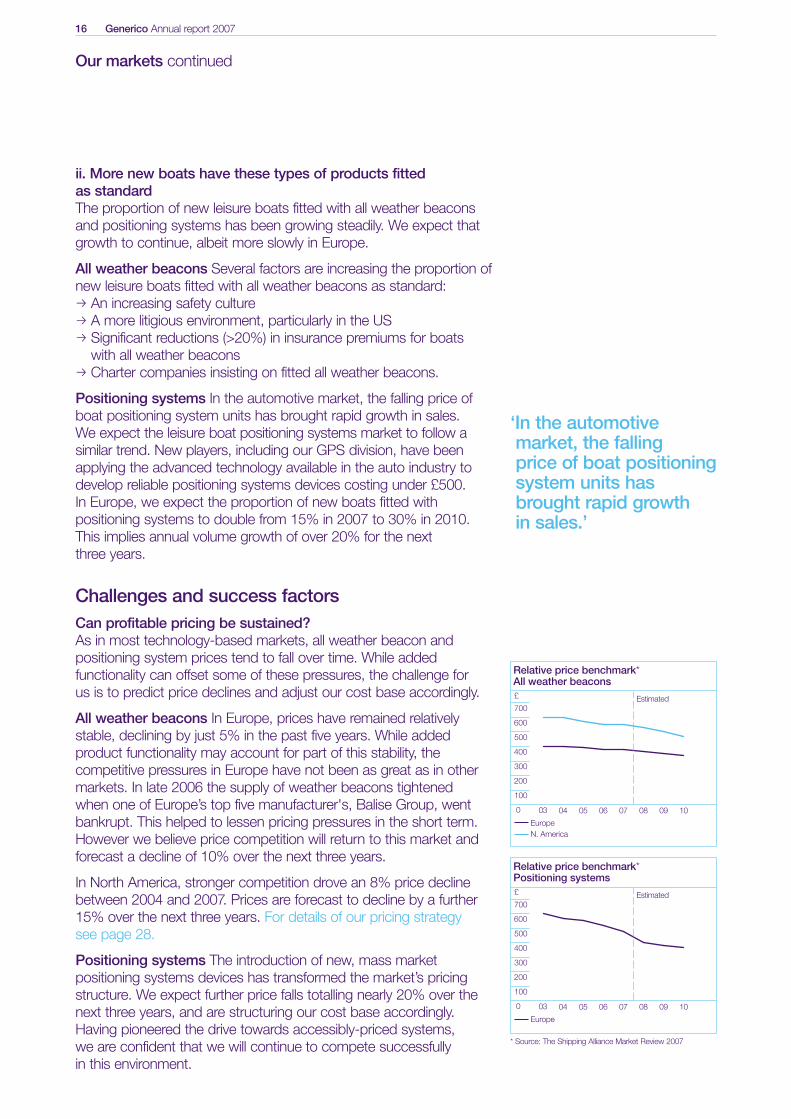
Challenges and success factorsCan profitable pricing be sustained?As in most technology-based markets, all weather beacon andpositioning system prices tend to fall over time. While addedfunctionality can offset some of these pressures, the challenge for us is to predict price declines and adjust our cost base accordingly.
All weather beacons In Europe, prices have remained relativelystable, declining by just 5% in the past five years. While addedproduct functionality may account for part of this stability, thecompetitive pressures in Europe have not been as great as in othermarkets. In late 2006 the supply of weather beacons tightened when one of Europe’s top five manufacturer's, Balise Group, wentbankrupt. This helped to lessen pricing pressures in the short term.However we believe price competition will return to this market andforecast a decline of 10% over the next three years.
In North America, stronger competition drove an 8% price declinebetween 2004 and 2007. Prices are forecast to decline by a further15% over the next three years. For details of our pricing strategysee page 28.
Positioning systems The introduction of new, mass marketpositioning systems devices has transformed the market’s pricingstructure. We expect further price falls totalling nearly 20% over thenext three years, and are structuring our cost base accordingly.Having pioneered the drive towards accessibly-priced systems, we are confident that we will continue to compete successfully in this environment.
Our markets continued
Relative price benchmark* Positioning systems
700
£
500
300
100
Europe
600
400
200
Estimated
050403 06 07 08 09 100
Relative price benchmark*All weather beacons
700
£
500
300
100
EuropeN. America
600
400
200
Estimated
050403 06 07 08 09 100
‘In the automotive market, the falling price of boat positioningsystem units hasbrought rapid growthin sales.’
* Source: The Shipping Alliance Market Review 2007
Generico Annual report 2007 17O
verview01-11
Our m
arkets12-17
Our group
strategy18-23
Our strategy in action
24-37O
ur delivery of value38-47
Our accounts
48-76
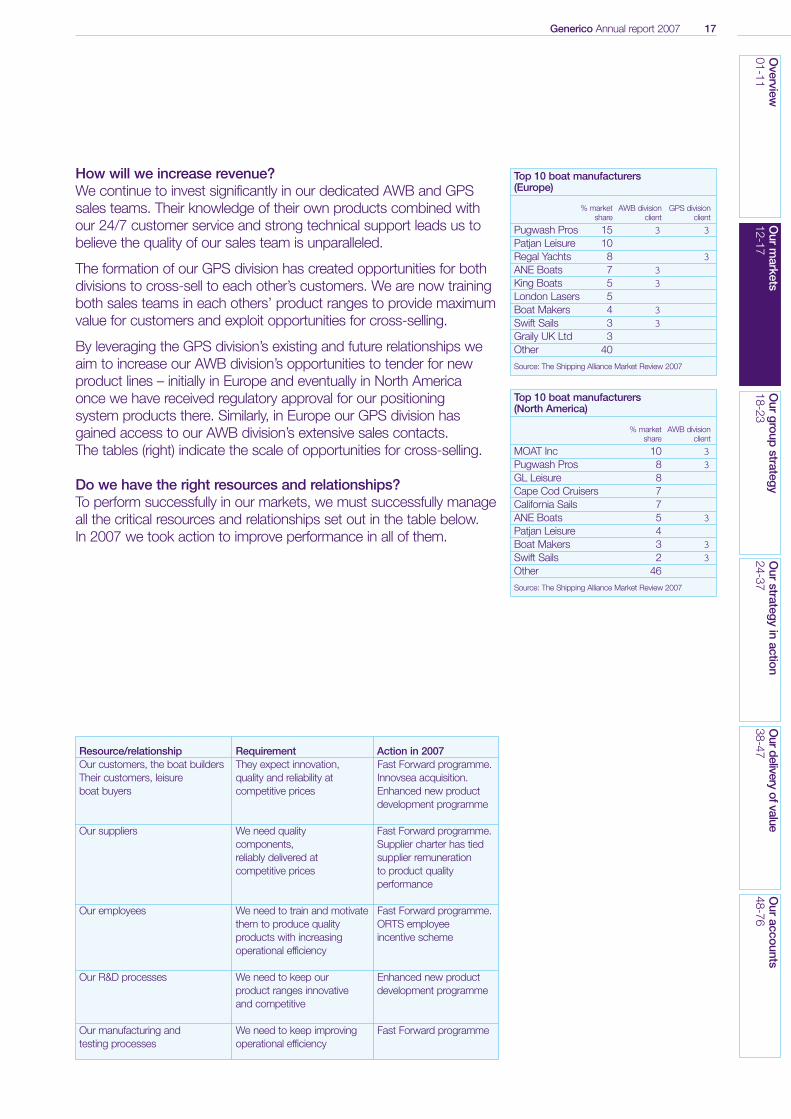
How will we increase revenue?We continue to invest significantly in our dedicated AWB and GPSsales teams. Their knowledge of their own products combined withour 24/7 customer service and strong technical support leads us tobelieve the quality of our sales team is unparalleled.
The formation of our GPS division has created opportunities for bothdivisions to cross-sell to each other’s customers. We are now trainingboth sales teams in each others’ product ranges to provide maximumvalue for customers and exploit opportunities for cross-selling.
By leveraging the GPS division’s existing and future relationships weaim to increase our AWB division’s opportunities to tender for newproduct lines – initially in Europe and eventually in North America once we have received regulatory approval for our positioning system products there. Similarly, in Europe our GPS division hasgained access to our AWB division’s extensive sales contacts. The tables (right) indicate the scale of opportunities for cross-selling.
Do we have the right resources and relationships?To perform successfully in our markets, we must successfully manageall the critical resources and relationships set out in the table below. In 2007 we took action to improve performance in all of them.
Resource/relationship Requirement Action in 2007Our customers, the boat builders They expect innovation, Fast Forward programme.Their customers, leisure quality and reliability at Innovsea acquisition.boat buyers competitive prices Enhanced new product
development programme
Our suppliers We need quality Fast Forward programme.components, Supplier charter has tied reliably delivered at supplier remuneration competitive prices to product quality
performance
Our employees We need to train and motivate Fast Forward programme.them to produce quality ORTS employee products with increasing incentive schemeoperational efficiency
Our R&D processes We need to keep our Enhanced new product product ranges innovative development programmeand competitive
Our manufacturing and We need to keep improving Fast Forward programmetesting processes operational efficiency
Top 10 boat manufacturers (North America)
% market AWB divisionshare client
MOAT Inc 10 3Pugwash Pros 8 3GL Leisure 8Cape Cod Cruisers 7California Sails 7ANE Boats 5 3Patjan Leisure 4Boat Makers 3 3Swift Sails 2 3Other 46
Source: The Shipping Alliance Market Review 2007
Top 10 boat manufacturers (Europe)
% market AWB division GPS divisionshare client client
Pugwash Pros 15 3 3Patjan Leisure 10Regal Yachts 8 3ANE Boats 7 3King Boats 5 3London Lasers 5Boat Makers 4 3Swift Sails 3 3Graily UK Ltd 3Other 40
Source: The Shipping Alliance Market Review 2007
18 Generico Annual report 2007
Generico Annual report 2007 19O
verview01-11
Our m
arkets12-17
Our group
strategy18-23
Our strategy in action
24-37O
ur delivery of value38-47
Our accounts
48-76
We’re confident about our prospects because we have a clear and straightforward strategy. See page 04.
In this section we address the following questions:
p How are we making the strategy a reality?
p How do we measure success?
p Are we making progress on our strategy?
p How are we addressing the risks that might derail our strategy?
Key points:
p Launched Fast Forward programme to transform culture
p Incentivised our people to excel
p Enhanced new product development
p Defined and now monitor key performance indicators vs targets
p Identified and addressed main risks
Our group strategy
20 Generico Annual report 2007
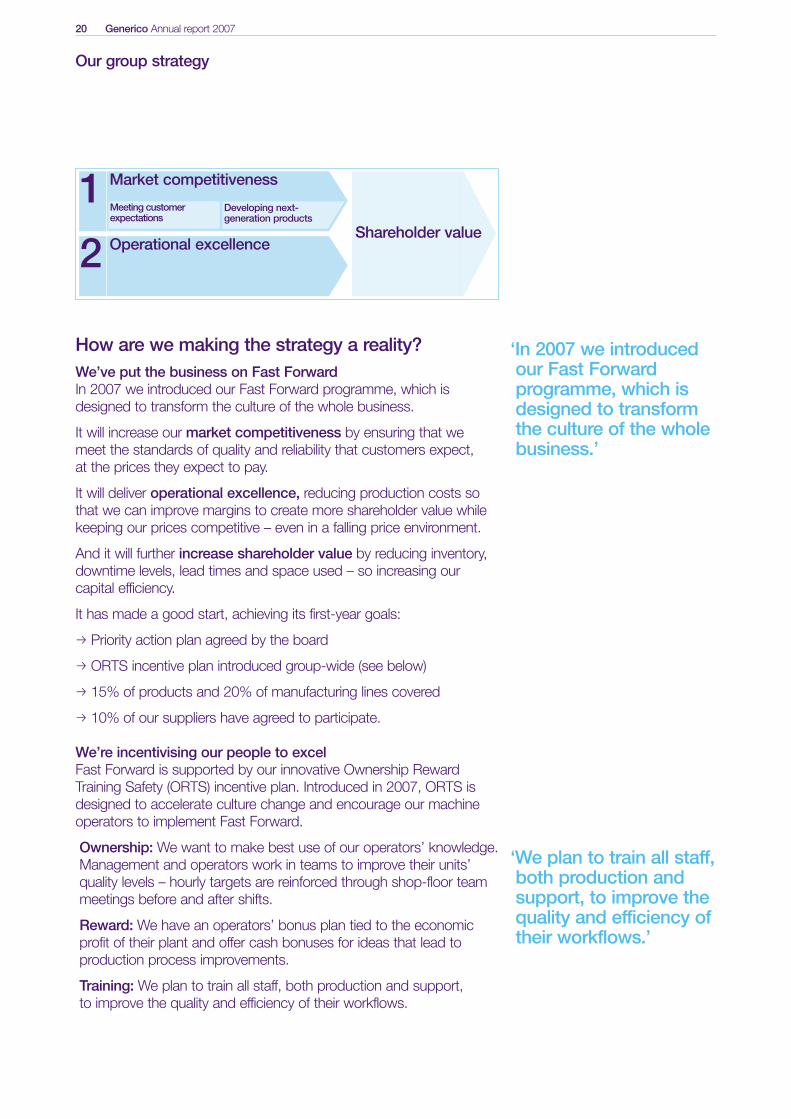
How are we making the strategy a reality?We’ve put the business on Fast ForwardIn 2007 we introduced our Fast Forward programme, which isdesigned to transform the culture of the whole business.
It will increase our market competitiveness by ensuring that we meet the standards of quality and reliability that customers expect, at the prices they expect to pay.
It will deliver operational excellence, reducing production costs so that we can improve margins to create more shareholder value whilekeeping our prices competitive – even in a falling price environment.
And it will further increase shareholder value by reducing inventory,downtime levels, lead times and space used – so increasing ourcapital efficiency.
It has made a good start, achieving its first-year goals:
p Priority action plan agreed by the board
p ORTS incentive plan introduced group-wide (see below)
p 15% of products and 20% of manufacturing lines covered
p 10% of our suppliers have agreed to participate.
We’re incentivising our people to excelFast Forward is supported by our innovative Ownership RewardTraining Safety (ORTS) incentive plan. Introduced in 2007, ORTS isdesigned to accelerate culture change and encourage our machineoperators to implement Fast Forward.
Ownership: We want to make best use of our operators’ knowledge.Management and operators work in teams to improve their units’quality levels – hourly targets are reinforced through shop-floor teammeetings before and after shifts.
Reward: We have an operators’ bonus plan tied to the economicprofit of their plant and offer cash bonuses for ideas that lead toproduction process improvements.
Training: We plan to train all staff, both production and support, to improve the quality and efficiency of their workflows.
Our group strategy
Market competitiveness
Developing next-generation products
1Operational excellence2
Shareholder value
Meeting customerexpectations
‘In 2007 we introduced our Fast Forward programme, which is designed to transform the culture of the whole business.’
‘We plan to train all staff,both production and support, to improve the quality and efficiency oftheir workflows.’
Generico Annual report 2007 21O
verview01-11
Our m
arkets12-17
Our group
strategy18-23
Our strategy in action
24-37O
ur delivery of value38-47
Our accounts
48-76
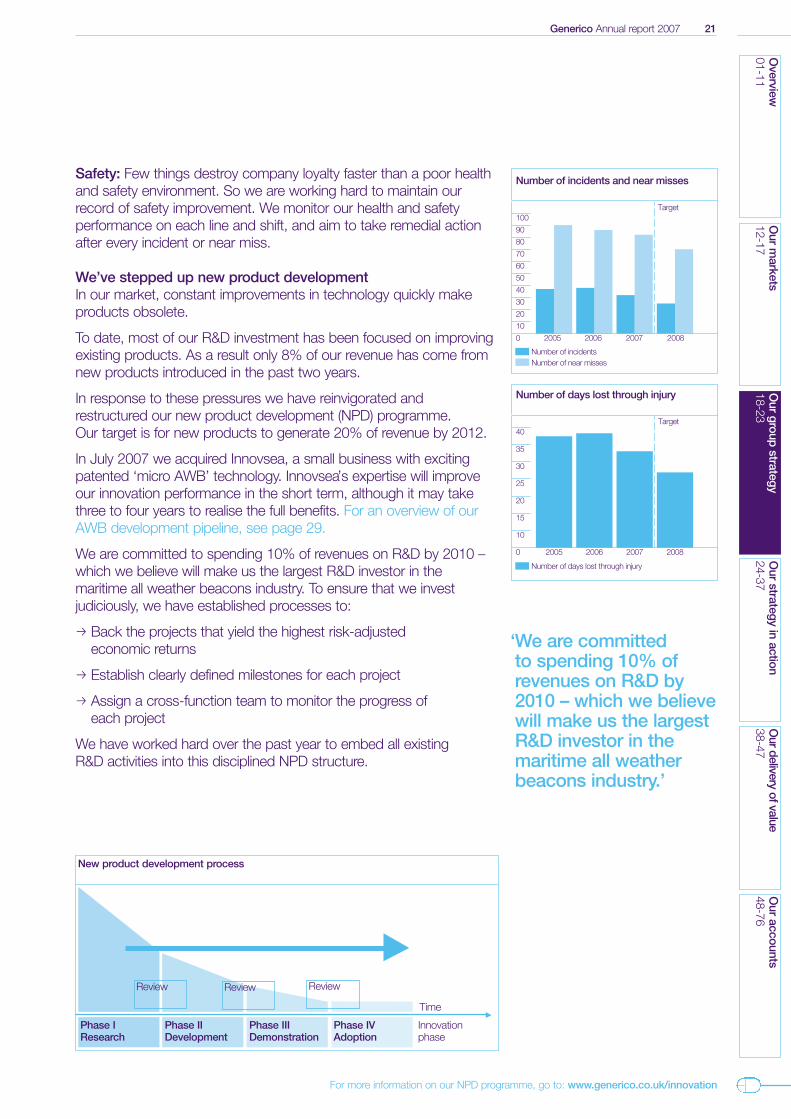
Safety: Few things destroy company loyalty faster than a poor healthand safety environment. So we are working hard to maintain ourrecord of safety improvement. We monitor our health and safetyperformance on each line and shift, and aim to take remedial actionafter every incident or near miss.
We’ve stepped up new product developmentIn our market, constant improvements in technology quickly makeproducts obsolete.
To date, most of our R&D investment has been focused on improvingexisting products. As a result only 8% of our revenue has come fromnew products introduced in the past two years.
In response to these pressures we have reinvigorated andrestructured our new product development (NPD) programme. Our target is for new products to generate 20% of revenue by 2012.
In July 2007 we acquired Innovsea, a small business with excitingpatented ‘micro AWB’ technology. Innovsea’s expertise will improve our innovation performance in the short term, although it may take three to four years to realise the full benefits. For an overview of ourAWB development pipeline, see page 29.
We are committed to spending 10% of revenues on R&D by 2010 –which we believe will make us the largest R&D investor in themaritime all weather beacons industry. To ensure that we investjudiciously, we have established processes to:
p Back the projects that yield the highest risk-adjusted economic returns
p Establish clearly defined milestones for each project
p Assign a cross-function team to monitor the progress of each project
We have worked hard over the past year to embed all existing R&D activities into this disciplined NPD structure.
Number of incidents and near misses
100
90
80
70
60
50
40
30
20
10
0 2005 2006 2007 2008
Number of incidentsNumber of near misses
Number of days lost through injury
40
35
30
25
20
15
10
0
Number of days lost through injury
Target
Target
2005 2006 2007 2008
For more information on our NPD programme, go to: www.generico.co.uk/innovation
‘We are committed to spending 10% of revenues on R&D by2010 – which we believewill make us the largestR&D investor in themaritime all weatherbeacons industry.’
New product development process
Phase IResearch
Phase IIDevelopment
Phase IIIDemonstration
Phase IVAdoption
Innovationphase
Time
Review Review Review
Based on our share of Europeanand North American sales byvolume, as reported by theShipping Alliance Market Review
22 Generico Annual report 2007
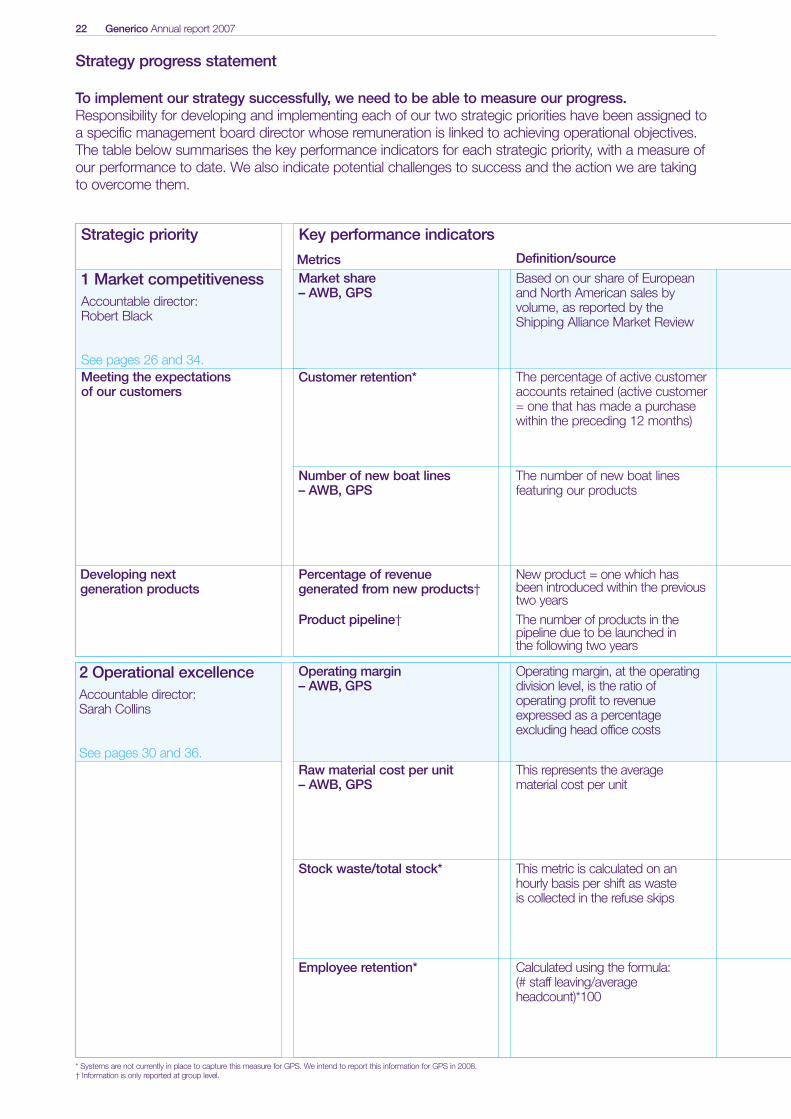
To implement our strategy successfully, we need to be able to measure our progress. Responsibility for developing and implementing each of our two strategic priorities have been assigned toa specific management board director whose remuneration is linked to achieving operational objectives. The table below summarises the key performance indicators for each strategic priority, with a measure ofour performance to date. We also indicate potential challenges to success and the action we are taking to overcome them.
Strategy progress statement
Strategic priority Key performance indicators
Market share – AWB, GPS
Operating margin – AWB, GPS
Raw material cost per unit – AWB, GPS
Stock waste/total stock*
Employee retention*
1 Market competitivenessAccountable director: Robert Black
See pages 26 and 34.Meeting the expectations of our customers
Customer retention*
Number of new boat lines – AWB, GPS
Percentage of revenuegenerated from new products†
Product pipeline†
2 Operational excellenceAccountable director: Sarah Collins
See pages 30 and 36.
Definition/sourceMetrics
The percentage of active customeraccounts retained (active customer= one that has made a purchasewithin the preceding 12 months)
The number of new boat linesfeaturing our products
New product = one which hasbeen introduced within the previoustwo yearsThe number of products in thepipeline due to be launched in the following two years
Operating margin, at the operatingdivision level, is the ratio of operating profit to revenueexpressed as a percentageexcluding head office costs
This represents the average material cost per unit
This metric is calculated on an hourly basis per shift as waste is collected in the refuse skips
Calculated using the formula: (# staff leaving/averageheadcount)*100
Developing next generation products
* Systems are not currently in place to capture this measure for GPS. We intend to report this information for GPS in 2008.† Information is only reported at group level.
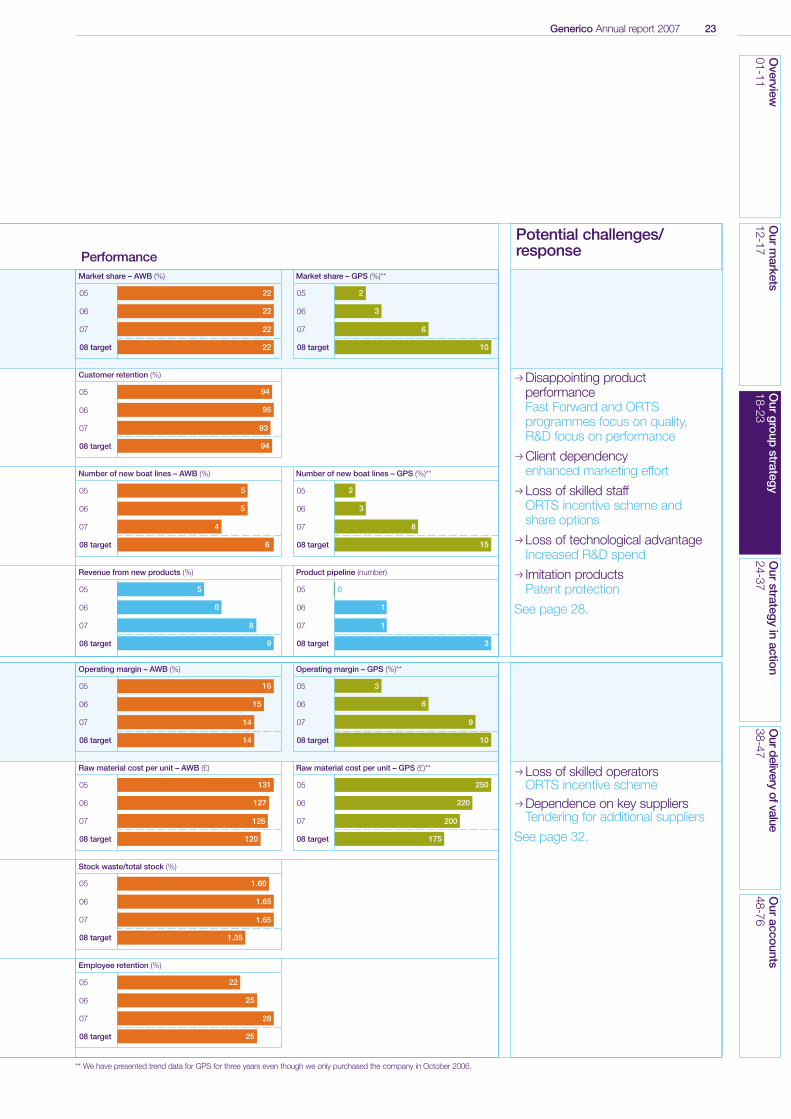
pDisappointing productperformanceFast Forward and ORTSprogrammes focus on quality, R&D focus on performance
pClient dependency enhanced marketing effort
pLoss of skilled staffORTS incentive scheme and share options
pLoss of technological advantageIncreased R&D spend
p Imitation productsPatent protection
See page 28.
pLoss of skilled operatorsORTS incentive scheme
pDependence on key suppliersTendering for additional suppliers
See page 32.
Generico Annual report 2007 23O
verview01-11
Our m
arkets12-17
Our group
strategy18-23
Our strategy in action
24-37O
ur delivery of value38-47
Our accounts
48-76
Potential challenges/response
** We have presented trend data for GPS for three years even though we only purchased the company in October 2006.
PerformanceMarket share – AWB (%)
05
06
07
08 target
05
06
07
08 target
05
06
07
08 target
05
06
07
08 target
05
06
07
08 target
05
06
07
08 target
05
06
07
08 target
05
06
07
08 target
05 0
06
07
08 target
05 3
06
07
08 target
05
06
07
08 target
05
06
07
08 target
05
06
07
08 target
Market share – GPS (%)**
Customer retention (%)
Number of new boat lines – AWB (%)
2
3
8
15
250
220
200
175
6
9
10
1
1
3
22
22
22
22
94
95
93
94
5
5
4
6
5
6
8
9
16
15
14
14
131
127
126
120
1.60
1.65
1.65
1.35
22
25
28
25
2
3
6
10
Number of new boat lines – GPS (%)**
Revenue from new products (%) Product pipeline (number)
Operating margin – AWB (%) Operating margin – GPS (%)**
Raw material cost per unit – AWB (£) Raw material cost per unit – GPS (£)**
Stock waste/total stock (%)
Employee retention (%)
Market share – AWB (%)
05
06
07
08 target
05
06
07
08 target
05
06
07
08 target
05
06
07
08 target
05
06
07
08 target
05
06
07
08 target
05
06
07
08 target
05
06
07
08 target
05 0
06
07
08 target
05 3
06
07
08 target
05
06
07
08 target
05
06
07
08 target
05
06
07
08 target
Market share – GPS (%)**
Customer retention (%)
Number of new boat lines – AWB (%)
2
3
8
15
250
220
200
175
6
9
10
1
1
3
22
22
22
22
94
95
93
94
5
5
4
6
5
6
8
9
16
15
14
14
131
127
126
120
1.60
1.65
1.65
1.35
22
25
28
25
2
3
6
10
Number of new boat lines – GPS (%)**
Revenue from new products (%) Product pipeline (number)
Operating margin – AWB (%) Operating margin – GPS (%)**
Raw material cost per unit – AWB (£) Raw material cost per unit – GPS (£)**
Stock waste/total stock (%)
Employee retention (%)
24 Generico Annual report 2007
Generico Annual report 2007 25O
verview01-11
Our
markets
12-17O
urgroup
strategy18-23
Our
strategyin
action24-37
Ourdelivery
ofvalue38-47
Our
accounts48-76
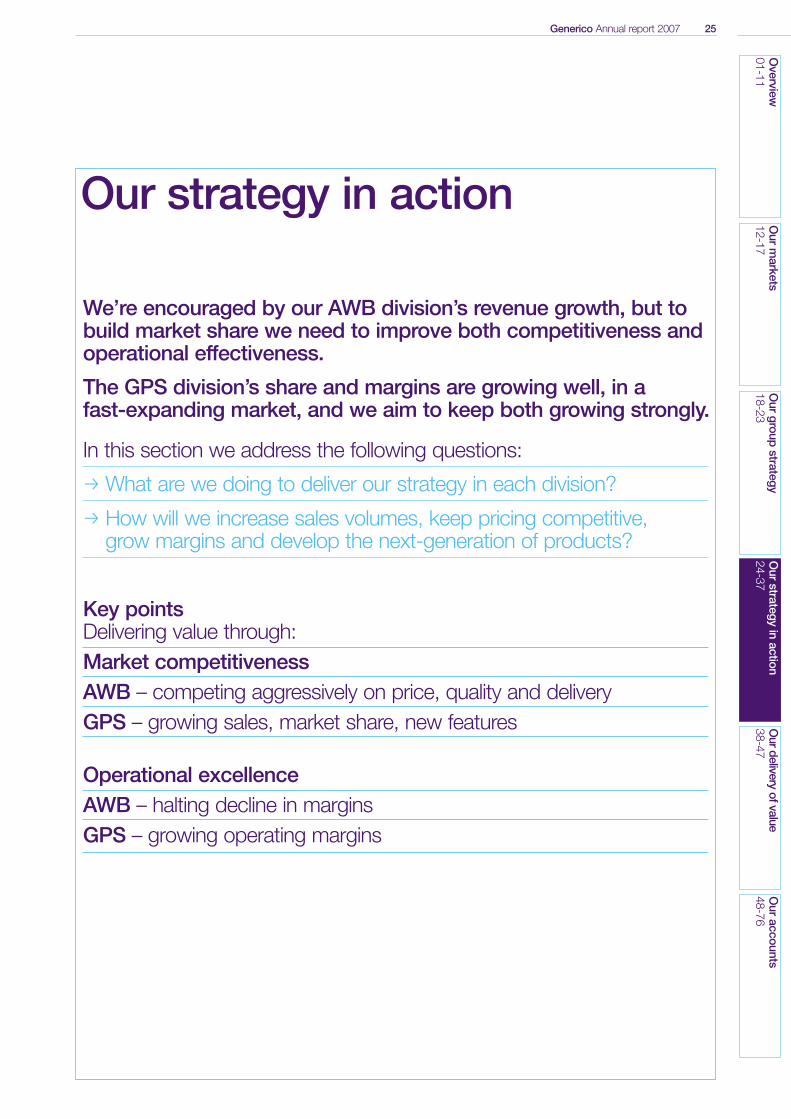
Our strategy in action
In this section we address the following questions:
p What are we doing to deliver our strategy in each division?
p How will we increase sales volumes, keep pricing competitive, grow margins and develop the next-generation of products?
Key pointsDelivering value through:Market competitivenessAWB – competing aggressively on price, quality and deliveryGPS – growing sales, market share, new features
Operational excellenceAWB – halting decline in marginsGPS – growing operating margins
We’re encouraged by our AWB division’s revenue growth, but to build market share we need to improve both competitiveness andoperational effectiveness.
The GPS division’s share and margins are growing well, in a fast-expanding market, and we aim to keep both growing strongly.
26 Generico Annual report 2007
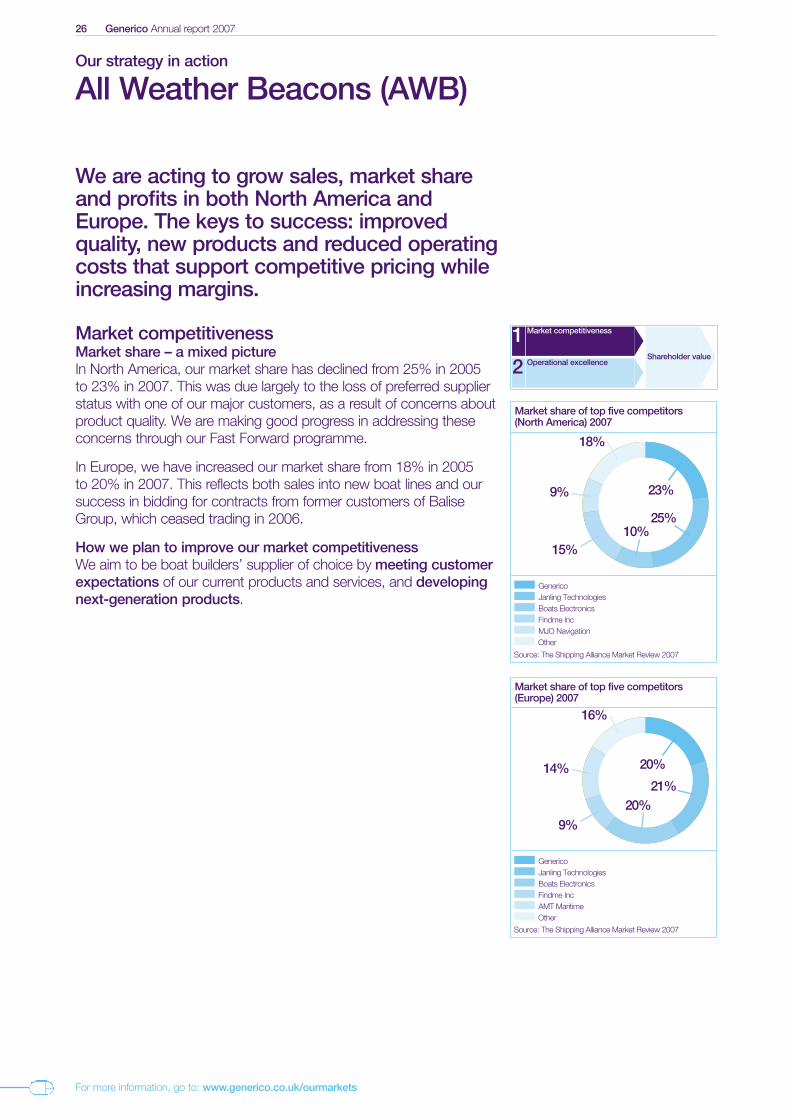
We are acting to grow sales, market shareand profits in both North America andEurope. The keys to success: improvedquality, new products and reduced operatingcosts that support competitive pricing whileincreasing margins.
Market competitivenessMarket share – a mixed pictureIn North America, our market share has declined from 25% in 2005to 23% in 2007. This was due largely to the loss of preferred supplierstatus with one of our major customers, as a result of concerns aboutproduct quality. We are making good progress in addressing theseconcerns through our Fast Forward programme.
In Europe, we have increased our market share from 18% in 2005to 20% in 2007. This reflects both sales into new boat lines and oursuccess in bidding for contracts from former customers of BaliseGroup, which ceased trading in 2006.
How we plan to improve our market competitivenessWe aim to be boat builders’ supplier of choice by meeting customerexpectations of our current products and services, and developingnext-generation products.
Our strategy in action
All Weather Beacons (AWB)
For more information, go to: www.generico.co.uk/ourmarkets
Market share of top five competitors(Europe) 2007
21%20%
9%
14%
16%
Generico
Findme Inc
Janling Technologies
AMT MaritimeOther
Source: The Shipping Alliance Market Review 2007
Boats Electronics
20%
Market share of top five competitors(North America) 2007
25%10%
15%
9%
18%
Generico
23%
Findme Inc
Janling Technologies
MJO NavigationOther
Source: The Shipping Alliance Market Review 2007
Boats Electronics
Market competitiveness1Operational excellence2
Shareholder value
Generico Annual report 2007 27O
verview01-11
Our m
arkets12-17
Our group
strategy18-23
Our strategy in action
– AW
B24-37
Our delivery of value
38-47O
ur accounts48-76
Meeting customer expectationsWe use our customer retention rate and the number of new boat lineslaunched with our products fitted as standard to measure our successin meeting customer expectations.
As our strategy progress statement on pages 22 and 23 illustrates,on both measures we are doing well in Europe but need to do betterin North America.
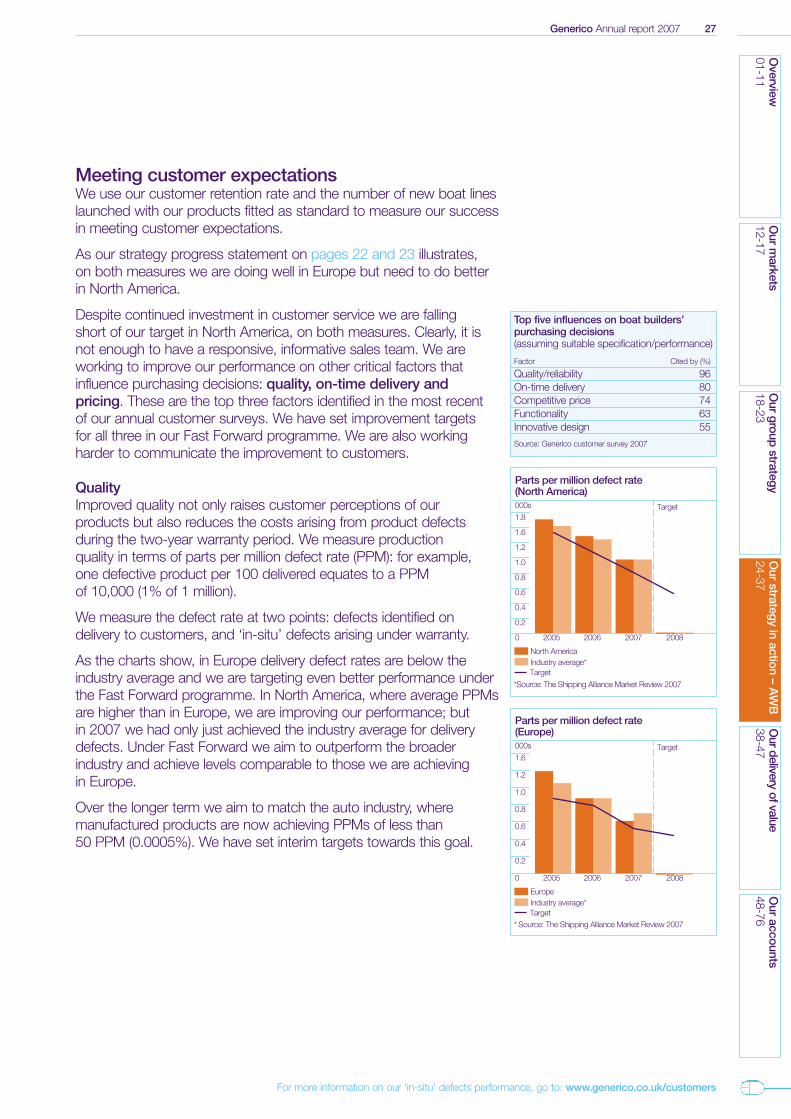
Despite continued investment in customer service we are falling short of our target in North America, on both measures. Clearly, it is not enough to have a responsive, informative sales team. We areworking to improve our performance on other critical factors thatinfluence purchasing decisions: quality, on-time delivery andpricing. These are the top three factors identified in the most recent of our annual customer surveys. We have set improvement targets for all three in our Fast Forward programme. We are also workingharder to communicate the improvement to customers.
QualityImproved quality not only raises customer perceptions of our products but also reduces the costs arising from product defectsduring the two-year warranty period. We measure production quality in terms of parts per million defect rate (PPM): for example,one defective product per 100 delivered equates to a PPMof 10,000 (1% of 1 million).
We measure the defect rate at two points: defects identified ondelivery to customers, and ‘in-situ’ defects arising under warranty.
As the charts show, in Europe delivery defect rates are below theindustry average and we are targeting even better performance underthe Fast Forward programme. In North America, where average PPMsare higher than in Europe, we are improving our performance; but in 2007 we had only just achieved the industry average for deliverydefects. Under Fast Forward we aim to outperform the broaderindustry and achieve levels comparable to those we are achievingin Europe.
Over the longer term we aim to match the auto industry, wheremanufactured products are now achieving PPMs of less than 50 PPM (0.0005%). We have set interim targets towards this goal.
Top five influences on boat builders’purchasing decisions(assuming suitable specification/performance)
Factor Cited by (%)
Quality/reliability 96On-time delivery 80Competitive price 74Functionality 63Innovative design 55
Source: Generico customer survey 2007
Parts per million defect rate(North America)
1.8
1.6
1.2
1.0
0.8
0.6
0.4
0.2
0 2005 2006 2007 2008
North AmericaIndustry average*
Parts per million defect rate(Europe)
1.6
1.2
1.0
0.8
0.6
0.4
0.2
0 2005 2006 2007 2008
EuropeIndustry average*
Target
Target
000s
Target
*Source: The Shipping Alliance Market Review 2007
* Source: The Shipping Alliance Market Review 2007
000s
Target
For more information on our ‘in-situ’ defects performance, go to: www.generico.co.uk/customers
28 Generico Annual report 2007
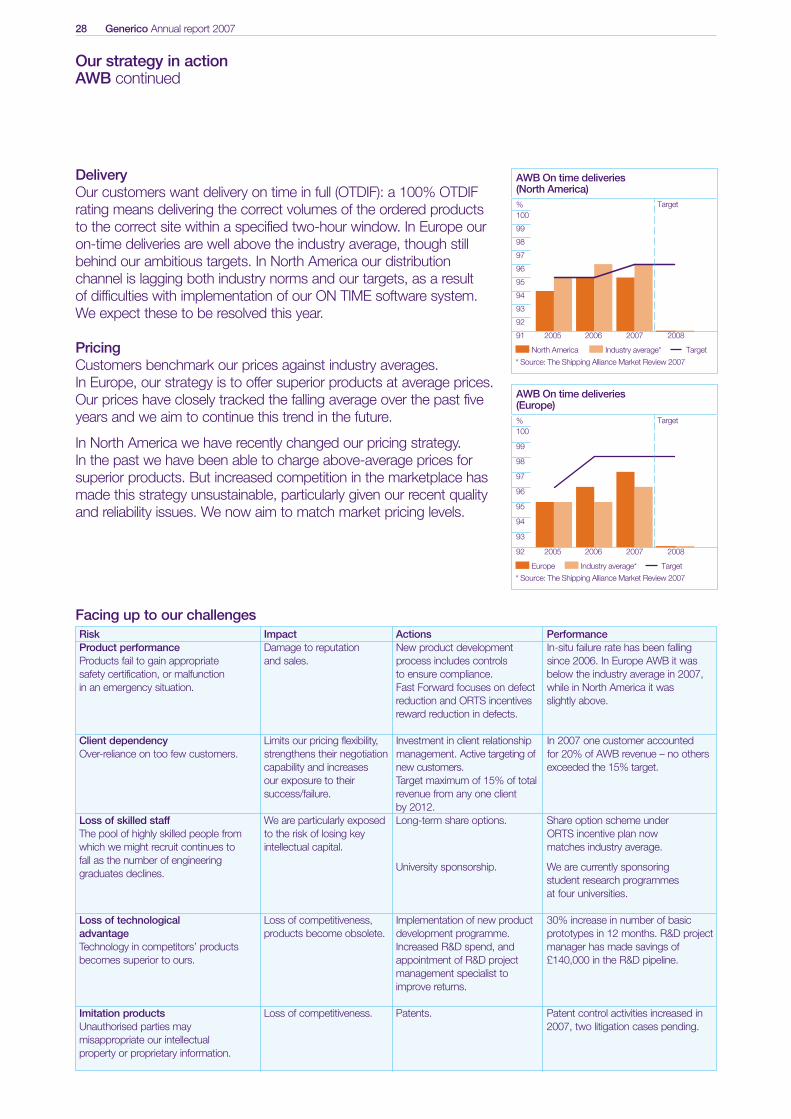
DeliveryOur customers want delivery on time in full (OTDIF): a 100% OTDIFrating means delivering the correct volumes of the ordered productsto the correct site within a specified two-hour window. In Europe ouron-time deliveries are well above the industry average, though stillbehind our ambitious targets. In North America our distributionchannel is lagging both industry norms and our targets, as a result of difficulties with implementation of our ON TIME software system.We expect these to be resolved this year.
PricingCustomers benchmark our prices against industry averages. In Europe, our strategy is to offer superior products at average prices.Our prices have closely tracked the falling average over the past fiveyears and we aim to continue this trend in the future.
In North America we have recently changed our pricing strategy. In the past we have been able to charge above-average prices forsuperior products. But increased competition in the marketplace hasmade this strategy unsustainable, particularly given our recent qualityand reliability issues. We now aim to match market pricing levels.
Our strategy in actionAWB continued
AWB On time deliveries(North America)
100%
97
98
99
96
95
94
93
92
91 2005 2006 2007 2008
North America Industry average* Target
AWB On time deliveries(Europe)
100%
97
98
99
96
95
94
93
92 2005 2006 2007 2008
Europe Industry average* Target
Target
Target
* Source: The Shipping Alliance Market Review 2007
* Source: The Shipping Alliance Market Review 2007
Facing up to our challengesRisk Impact Actions PerformanceProduct performance Damage to reputation New product development In-situ failure rate has been falling Products fail to gain appropriate and sales. process includes controls since 2006. In Europe AWB it wassafety certification, or malfunction to ensure compliance. below the industry average in 2007, in an emergency situation. Fast Forward focuses on defect while in North America it was
reduction and ORTS incentives slightly above. reward reduction in defects.
Client dependency Limits our pricing flexibility, Investment in client relationship In 2007 one customer accounted Over-reliance on too few customers. strengthens their negotiation management. Active targeting of for 20% of AWB revenue – no others
capability and increases new customers. exceeded the 15% target.our exposure to their Target maximum of 15% of total success/failure. revenue from any one client
by 2012.Loss of skilled staff We are particularly exposed Long-term share options. Share option scheme under The pool of highly skilled people from to the risk of losing key ORTS incentive plan now which we might recruit continues to intellectual capital. matches industry average.fall as the number of engineering
University sponsorship. We are currently sponsoringgraduates declines.
student research programmesat four universities.
Loss of technological Loss of competitiveness, Implementation of new product 30% increase in number of basic advantage products become obsolete. development programme. prototypes in 12 months. R&D project Technology in competitors’ products Increased R&D spend, and manager has made savings of becomes superior to ours. appointment of R&D project £140,000 in the R&D pipeline.
management specialist to improve returns.
Imitation products Loss of competitiveness. Patents. Patent control activities increased in Unauthorised parties may 2007, two litigation cases pending.misappropriate our intellectual property or proprietary information.
Generico Annual report 2007 29O
verview01-11
Our m
arkets12-17
Our group
strategy18-23
Our strategy in action
– AW
B24-37
Our delivery of value
38-47O
ur accounts48-76
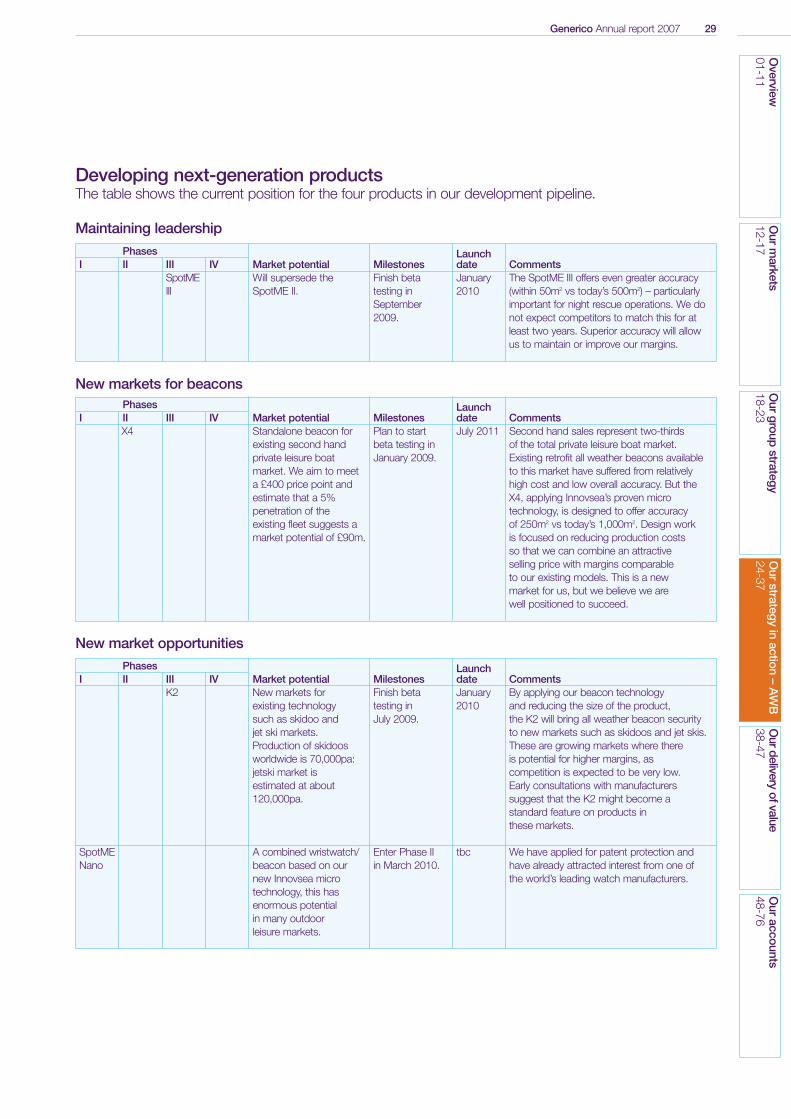
Developing next-generation productsThe table shows the current position for the four products in our development pipeline.
Maintaining leadership
New markets for beacons
New market opportunities
Phases LaunchI II III IV Market potential Milestones date Comments
X4 Standalone beacon for Plan to start July 2011 Second hand sales represent two-thirds existing second hand beta testing in of the total private leisure boat market. private leisure boat January 2009. Existing retrofit all weather beacons availablemarket. We aim to meet to this market have suffered from relatively a £400 price point and high cost and low overall accuracy. But the estimate that a 5% X4, applying Innovsea’s proven micro penetration of the technology, is designed to offer accuracy existing fleet suggests a of 250m2 vs today’s 1,000m2. Design work market potential of £90m. is focused on reducing production costs
so that we can combine an attractive selling price with margins comparable to our existing models. This is a new market for us, but we believe we are well positioned to succeed.
Phases LaunchI II III IV Market potential Milestones date Comments
K2 New markets for Finish beta January By applying our beacon technology existing technology testing in 2010 and reducing the size of the product, such as skidoo and July 2009. the K2 will bring all weather beacon securityjet ski markets. to new markets such as skidoos and jet skis. Production of skidoos These are growing markets where there worldwide is 70,000pa: is potential for higher margins, as jetski market is competition is expected to be very low. estimated at about Early consultations with manufacturers 120,000pa. suggest that the K2 might become a
standard feature on products inthese markets.
SpotME A combined wristwatch/ Enter Phase II tbc We have applied for patent protection and Nano beacon based on our in March 2010. have already attracted interest from one of
new Innovsea micro the world’s leading watch manufacturers.technology, this has enormous potentialin many outdoor leisure markets.
Phases LaunchI II III IV Market potential Milestones date Comments
SpotME Will supersede the Finish beta January The SpotME III offers even greater accuracy III SpotME II. testing in 2010 (within 50m2 vs today’s 500m2) – particularly
September important for night rescue operations. We do2009. not expect competitors to match this for at
least two years. Superior accuracy will allowus to maintain or improve our margins.
30 Generico Annual report 2007
Our strategy in actionAWB continued
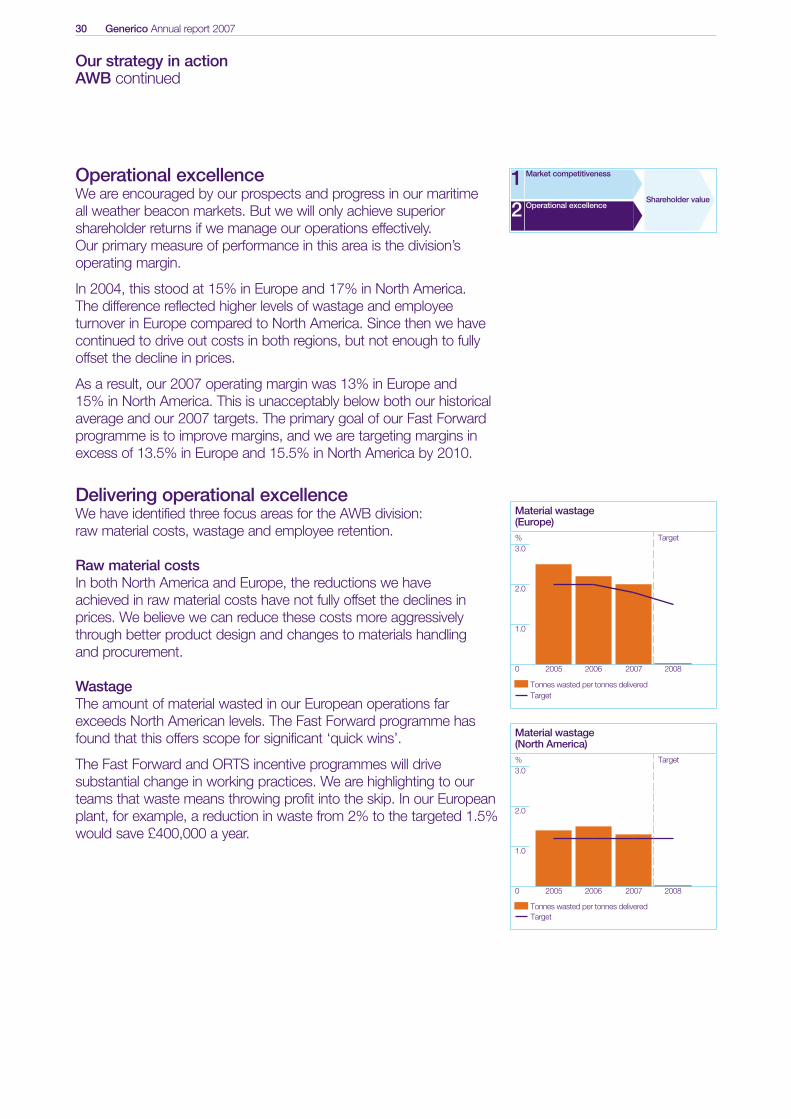
Operational excellenceWe are encouraged by our prospects and progress in our maritime all weather beacon markets. But we will only achieve superiorshareholder returns if we manage our operations effectively. Our primary measure of performance in this area is the division’soperating margin.
In 2004, this stood at 15% in Europe and 17% in North America. The difference reflected higher levels of wastage and employeeturnover in Europe compared to North America. Since then we havecontinued to drive out costs in both regions, but not enough to fullyoffset the decline in prices.
As a result, our 2007 operating margin was 13% in Europe and 15% in North America. This is unacceptably below both our historicalaverage and our 2007 targets. The primary goal of our Fast Forwardprogramme is to improve margins, and we are targeting margins inexcess of 13.5% in Europe and 15.5% in North America by 2010.
Delivering operational excellenceWe have identified three focus areas for the AWB division: raw material costs, wastage and employee retention.
Raw material costsIn both North America and Europe, the reductions we have achieved in raw material costs have not fully offset the declines inprices. We believe we can reduce these costs more aggressivelythrough better product design and changes to materials handling and procurement.
WastageThe amount of material wasted in our European operations farexceeds North American levels. The Fast Forward programme hasfound that this offers scope for significant ‘quick wins’.
The Fast Forward and ORTS incentive programmes will drivesubstantial change in working practices. We are highlighting to ourteams that waste means throwing profit into the skip. In our Europeanplant, for example, a reduction in waste from 2% to the targeted 1.5%would save £400,000 a year.
Material wastage(Europe)
3.0% Target
2.0
1.0
0 2005 2006 2007 2008
Tonnes wasted per tonnes deliveredTarget
Market competitiveness1Operational excellence2
Shareholder value
Material wastage(North America)
3.0%
2.0
1.0
0 2005 2006 2007 2008
Tonnes wasted per tonnes deliveredTarget
Target
Generico Annual report 2007 31O
verview01-11
Our m
arkets12-17
Our group
strategy18-23
Our strategy in action
– AW
B24-37
Our delivery of value
38-47O
ur accounts48-76
For more information on our performance in delivering operational excellence, go to: www.generico.co.uk/opex
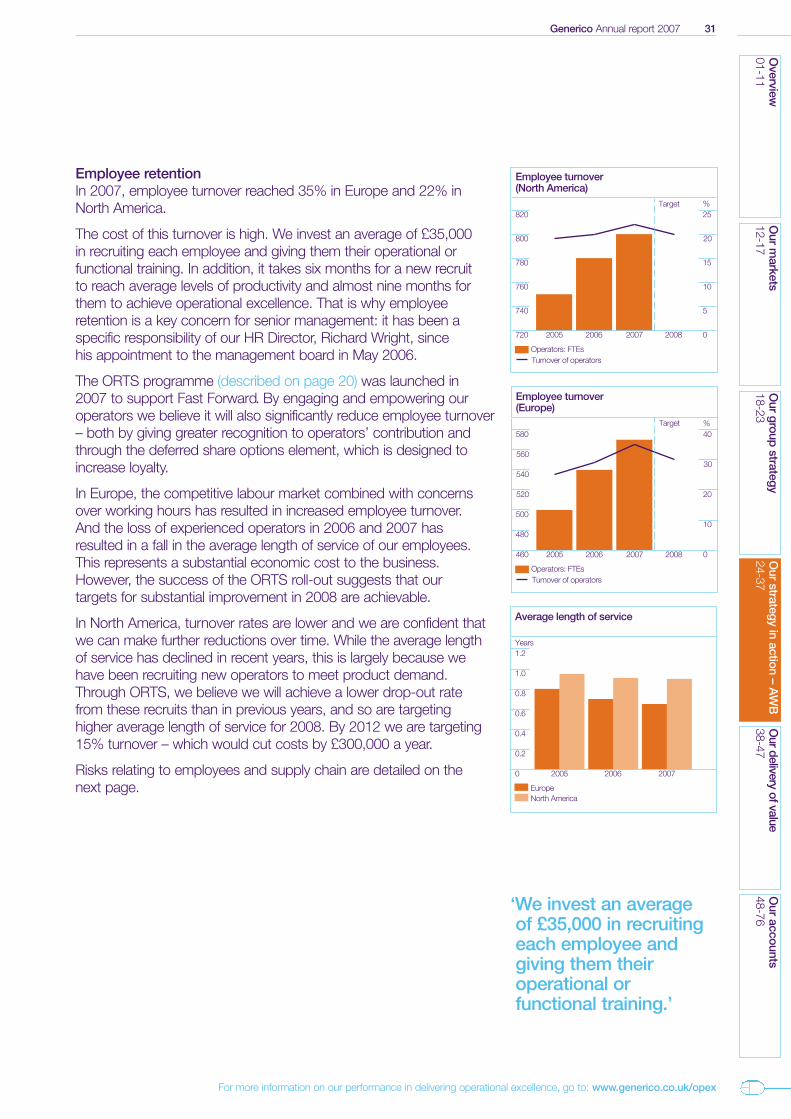
Employee retentionIn 2007, employee turnover reached 35% in Europe and 22% in North America.
The cost of this turnover is high. We invest an average of £35,000 in recruiting each employee and giving them their operational orfunctional training. In addition, it takes six months for a new recruit to reach average levels of productivity and almost nine months forthem to achieve operational excellence. That is why employeeretention is a key concern for senior management: it has been aspecific responsibility of our HR Director, Richard Wright, since his appointment to the management board in May 2006.
The ORTS programme (described on page 20) was launched in 2007 to support Fast Forward. By engaging and empowering ouroperators we believe it will also significantly reduce employee turnover– both by giving greater recognition to operators’ contribution andthrough the deferred share options element, which is designed toincrease loyalty.
In Europe, the competitive labour market combined with concernsover working hours has resulted in increased employee turnover. And the loss of experienced operators in 2006 and 2007 has resulted in a fall in the average length of service of our employees.This represents a substantial economic cost to the business.However, the success of the ORTS roll-out suggests that our targets for substantial improvement in 2008 are achievable.
In North America, turnover rates are lower and we are confident thatwe can make further reductions over time. While the average length of service has declined in recent years, this is largely because we have been recruiting new operators to meet product demand.Through ORTS, we believe we will achieve a lower drop-out rate from these recruits than in previous years, and so are targeting higher average length of service for 2008. By 2012 we are targeting15% turnover – which would cut costs by £300,000 a year.
Risks relating to employees and supply chain are detailed on the next page.
Employee turnover(North America)
820
800
780
760
740
720
25%
20
5
10
15
02005 2006 2007 2008
Operators: FTEsTurnover of operators
Target
Average length of service
1.2Years
1.0
0.8
0.6
0.4
0.2
0 2005 2006 2007
EuropeNorth America
Employee turnover(Europe)
580
500
520
540
560
480
460
40%
20
30
10
02005 2006 2007 2008
Operators: FTEsTurnover of operators
Target
‘We invest an average of £35,000 in recruitingeach employee and giving them their operational or functional training.’
32 Generico Annual report 2007
Our strategy in actionAWB continued
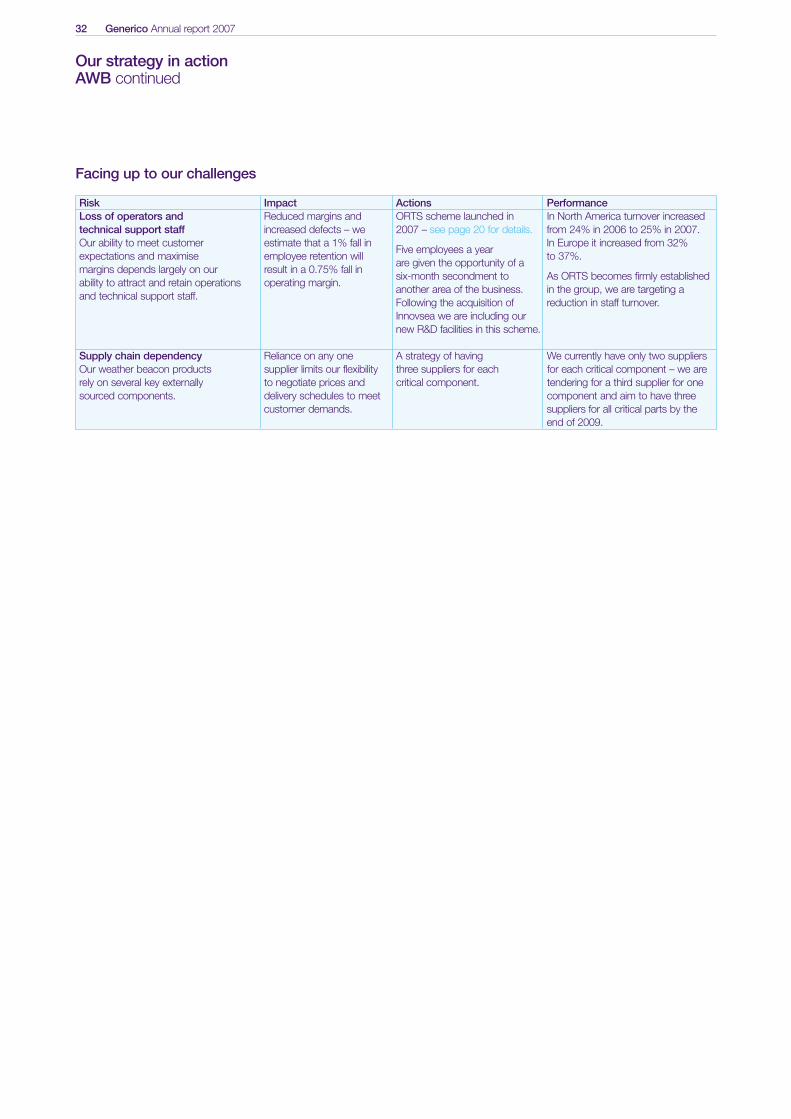
Risk Impact Actions PerformanceLoss of operators and Reduced margins and ORTS scheme launched in In North America turnover increasedtechnical support staff increased defects – we 2007 – see page 20 for details. from 24% in 2006 to 25% in 2007.Our ability to meet customer estimate that a 1% fall in
Five employees a yearIn Europe it increased from 32%
expectations and maximise employee retention will are given the opportunity of a
to 37%.margins depends largely on our result in a 0.75% fall in
six-month secondment to As ORTS becomes firmly establishedability to attract and retain operations operating margin.
another area of the business. in the group, we are targeting a and technical support staff.
Following the acquisition of reduction in staff turnover.Innovsea we are including ournew R&D facilities in this scheme.
Supply chain dependency Reliance on any one A strategy of having We currently have only two suppliersOur weather beacon products supplier limits our flexibility three suppliers for each for each critical component – we are rely on several key externally to negotiate prices and critical component. tendering for a third supplier for one sourced components. delivery schedules to meet component and aim to have three
customer demands. suppliers for all critical parts by theend of 2009.
Facing up to our challenges
Generico Annual report 2007 33O
verview01-11
Our m
arkets12-17
Our group
strategy18-23
Our strategy in action
– AW
B24-37
Our delivery of value
38-47O
ur accounts48-76
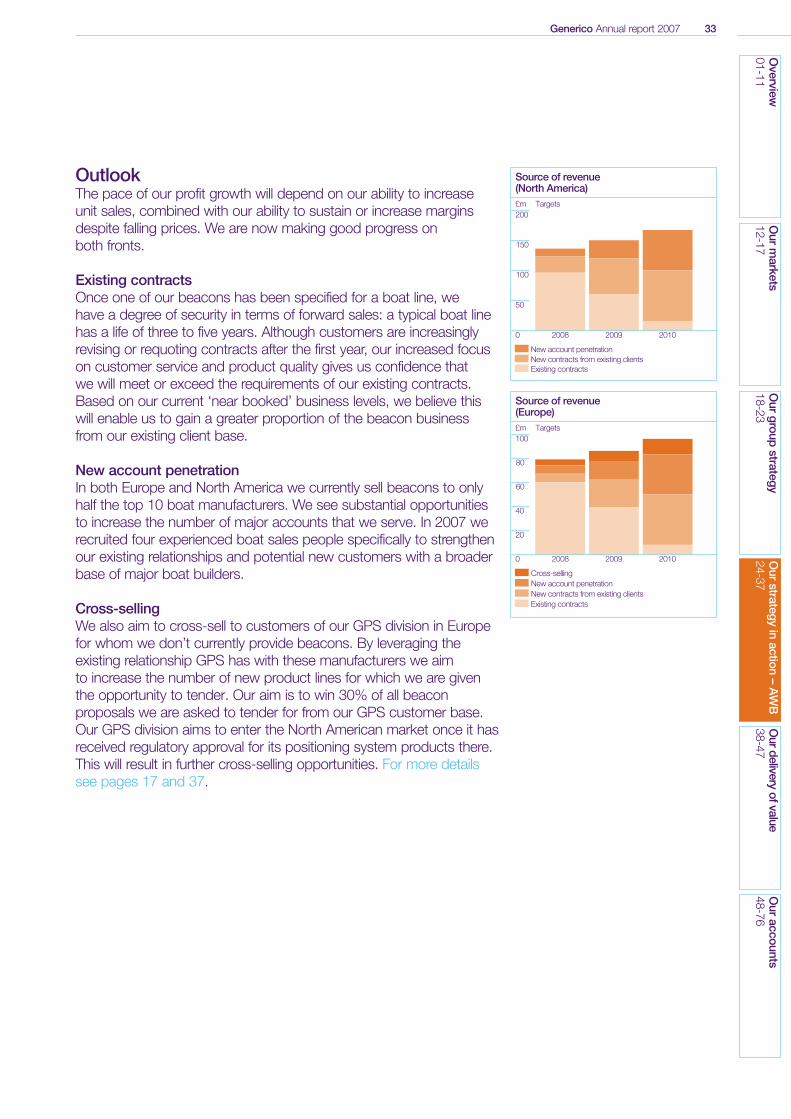
OutlookThe pace of our profit growth will depend on our ability to increaseunit sales, combined with our ability to sustain or increase marginsdespite falling prices. We are now making good progress on both fronts.
Existing contractsOnce one of our beacons has been specified for a boat line, we have a degree of security in terms of forward sales: a typical boat linehas a life of three to five years. Although customers are increasinglyrevising or requoting contracts after the first year, our increased focuson customer service and product quality gives us confidence that we will meet or exceed the requirements of our existing contracts.Based on our current ‘near booked’ business levels, we believe thiswill enable us to gain a greater proportion of the beacon businessfrom our existing client base.
New account penetrationIn both Europe and North America we currently sell beacons to onlyhalf the top 10 boat manufacturers. We see substantial opportunitiesto increase the number of major accounts that we serve. In 2007 werecruited four experienced boat sales people specifically to strengthenour existing relationships and potential new customers with a broaderbase of major boat builders.
Cross-sellingWe also aim to cross-sell to customers of our GPS division in Europefor whom we don’t currently provide beacons. By leveraging theexisting relationship GPS has with these manufacturers we aim to increase the number of new product lines for which we are giventhe opportunity to tender. Our aim is to win 30% of all beaconproposals we are asked to tender for from our GPS customer base.Our GPS division aims to enter the North American market once it hasreceived regulatory approval for its positioning system products there.This will result in further cross-selling opportunities. For more detailssee pages 17 and 37.
Source of revenue(North America)
200£m Targets
50
100
150
0 2008 2009 2010
New account penetrationNew contracts from existing clientsExisting contracts
Source of revenue (Europe)
100£m Targets
20
40
60
80
0 2008 2009 2010
Cross-sellingNew account penetrationNew contracts from existing clientsExisting contracts
34 Generico Annual report 2007
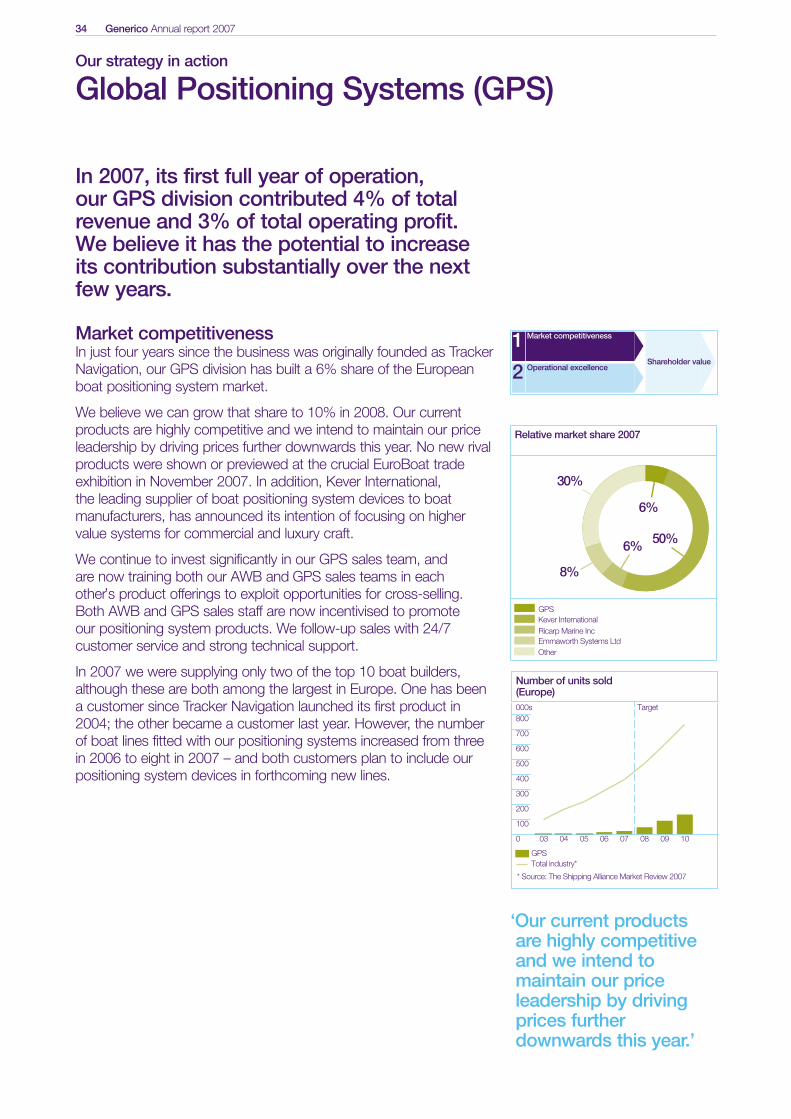
In 2007, its first full year of operation, our GPS division contributed 4% of totalrevenue and 3% of total operating profit. We believe it has the potential to increase its contribution substantially over the nextfew years.
Market competitivenessIn just four years since the business was originally founded as TrackerNavigation, our GPS division has built a 6% share of the Europeanboat positioning system market.
We believe we can grow that share to 10% in 2008. Our currentproducts are highly competitive and we intend to maintain our priceleadership by driving prices further downwards this year. No new rivalproducts were shown or previewed at the crucial EuroBoat tradeexhibition in November 2007. In addition, Kever International, the leading supplier of boat positioning system devices to boatmanufacturers, has announced its intention of focusing on highervalue systems for commercial and luxury craft.
We continue to invest significantly in our GPS sales team, and are now training both our AWB and GPS sales teams in each other’s product offerings to exploit opportunities for cross-selling. Both AWB and GPS sales staff are now incentivised to promote our positioning system products. We follow-up sales with 24/7customer service and strong technical support.
In 2007 we were supplying only two of the top 10 boat builders,although these are both among the largest in Europe. One has been a customer since Tracker Navigation launched its first product in2004; the other became a customer last year. However, the numberof boat lines fitted with our positioning systems increased from three in 2006 to eight in 2007 – and both customers plan to include ourpositioning system devices in forthcoming new lines.
Our strategy in action
Global Positioning Systems (GPS)
Relative market share 2007
50%6%
8%
30%
GPS
Ricarp Marine IncEmmaworth Systems Ltd
Kever International
Other
6%
Number of units sold(Europe)
800
700
600
500
000s
400
300
200
100
0 050403 06 07 08
Target
09 10
GPSTotal industry*
* Source: The Shipping Alliance Market Review 2007
Market competitiveness1Operational excellence2
Shareholder value
‘Our current products are highly competitive and we intend to maintain our price leadership by driving prices furtherdownwards this year.’
Generico Annual report 2007 35O
verview01-11
Our m
arkets12-17
Our group
strategy18-23
Our strategy in action
– GP
S24-37
Our delivery of value
38-47O
ur accounts48-76
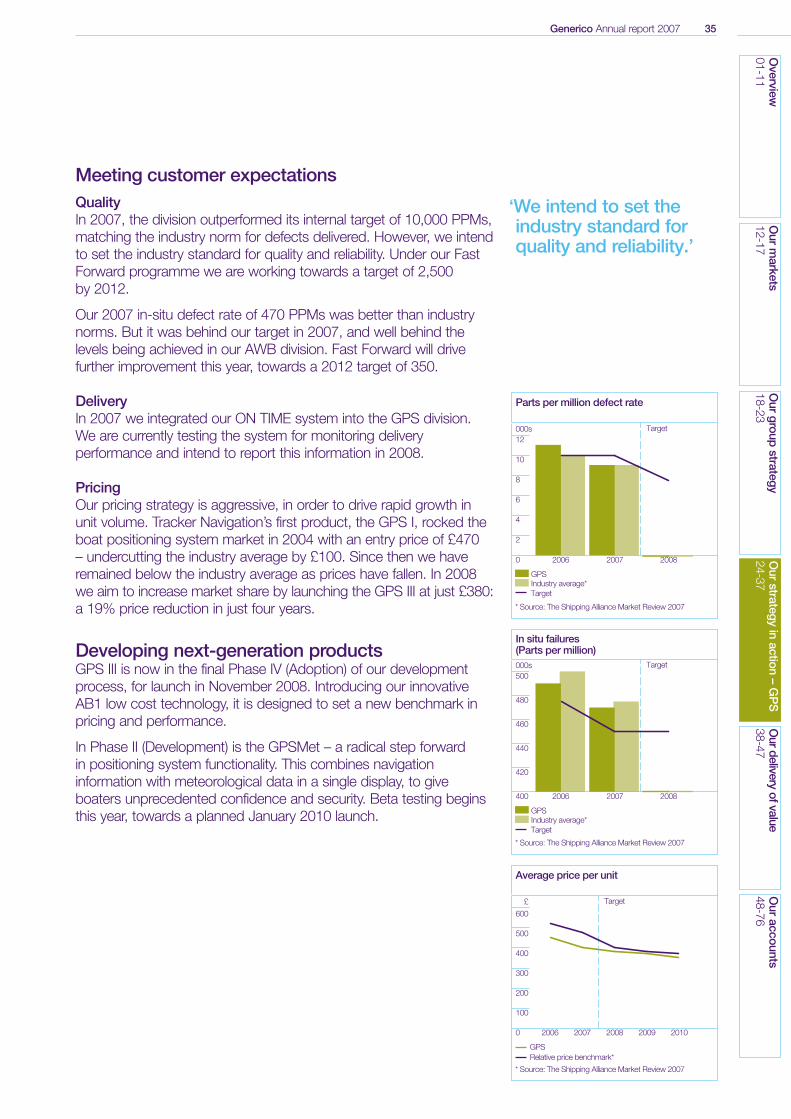
Meeting customer expectationsQualityIn 2007, the division outperformed its internal target of 10,000 PPMs,matching the industry norm for defects delivered. However, we intendto set the industry standard for quality and reliability. Under our FastForward programme we are working towards a target of 2,500 by 2012.
Our 2007 in-situ defect rate of 470 PPMs was better than industrynorms. But it was behind our target in 2007, and well behind thelevels being achieved in our AWB division. Fast Forward will drivefurther improvement this year, towards a 2012 target of 350.
DeliveryIn 2007 we integrated our ON TIME system into the GPS division. We are currently testing the system for monitoring deliveryperformance and intend to report this information in 2008.
PricingOur pricing strategy is aggressive, in order to drive rapid growth in unit volume. Tracker Navigation’s first product, the GPS I, rocked theboat positioning system market in 2004 with an entry price of £470 – undercutting the industry average by £100. Since then we haveremained below the industry average as prices have fallen. In 2008we aim to increase market share by launching the GPS III at just £380:a 19% price reduction in just four years.
Developing next-generation productsGPS III is now in the final Phase IV (Adoption) of our developmentprocess, for launch in November 2008. Introducing our innovativeAB1 low cost technology, it is designed to set a new benchmark inpricing and performance.
In Phase II (Development) is the GPSMet – a radical step forward in positioning system functionality. This combines navigationinformation with meteorological data in a single display, to giveboaters unprecedented confidence and security. Beta testing beginsthis year, towards a planned January 2010 launch.
Parts per million defect rate
12000s
10
8
6
2
4
0 2006 2007 2008
Target
GPSIndustry average*Target
* Source: The Shipping Alliance Market Review 2007
* Source: The Shipping Alliance Market Review 2007
* Source: The Shipping Alliance Market Review 2007
In situ failures(Parts per million)
500000s
480
460
440
420
400 2006 2007 2008
Target
GPSIndustry average*Target
Average price per unit
600
£
500
400
300
200
100
0 2006 2008 20102007 2009
Target
Relative price benchmark*GPS
‘We intend to set the industry standard for quality and reliability.’
36 Generico Annual report 2007
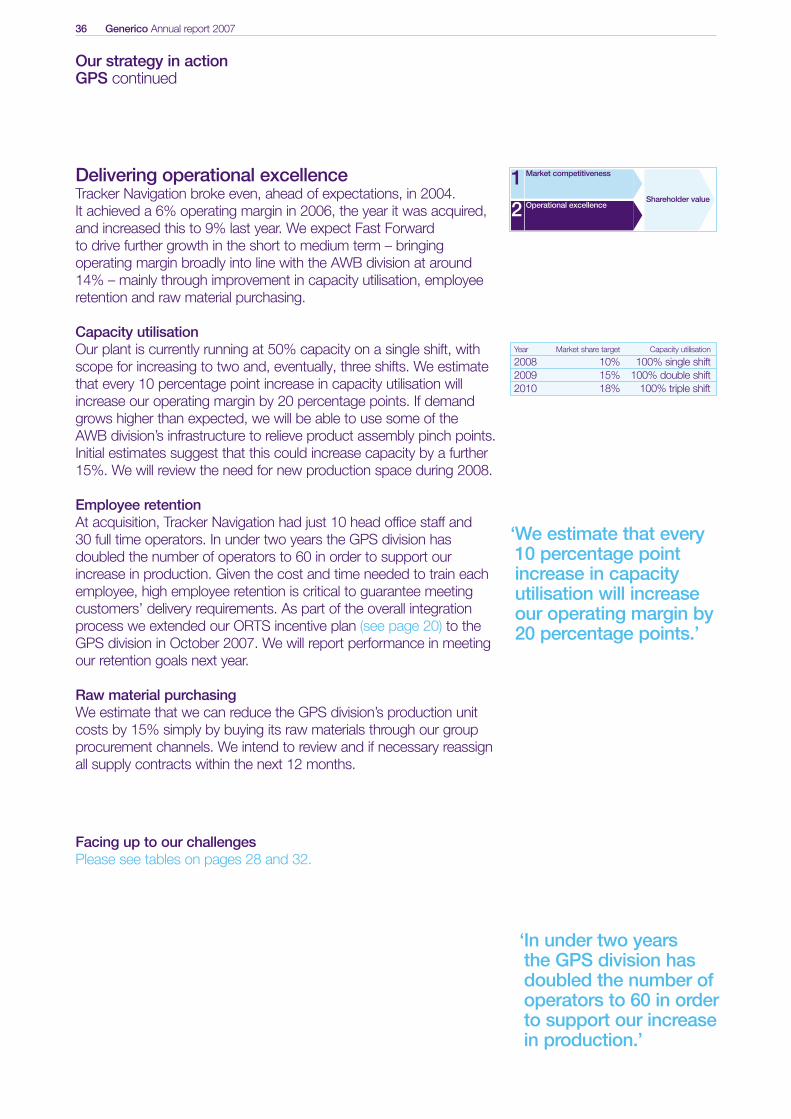
Delivering operational excellenceTracker Navigation broke even, ahead of expectations, in 2004. It achieved a 6% operating margin in 2006, the year it was acquired,and increased this to 9% last year. We expect Fast Forward to drive further growth in the short to medium term – bringingoperating margin broadly into line with the AWB division at around14% – mainly through improvement in capacity utilisation, employeeretention and raw material purchasing.
Capacity utilisationOur plant is currently running at 50% capacity on a single shift, withscope for increasing to two and, eventually, three shifts. We estimatethat every 10 percentage point increase in capacity utilisation willincrease our operating margin by 20 percentage points. If demandgrows higher than expected, we will be able to use some of the AWB division’s infrastructure to relieve product assembly pinch points.Initial estimates suggest that this could increase capacity by a further15%. We will review the need for new production space during 2008.
Employee retentionAt acquisition, Tracker Navigation had just 10 head office staff and 30 full time operators. In under two years the GPS division hasdoubled the number of operators to 60 in order to support ourincrease in production. Given the cost and time needed to train eachemployee, high employee retention is critical to guarantee meetingcustomers’ delivery requirements. As part of the overall integrationprocess we extended our ORTS incentive plan (see page 20) to theGPS division in October 2007. We will report performance in meetingour retention goals next year.
Raw material purchasingWe estimate that we can reduce the GPS division’s production unitcosts by 15% simply by buying its raw materials through our groupprocurement channels. We intend to review and if necessary reassignall supply contracts within the next 12 months.
Facing up to our challengesPlease see tables on pages 28 and 32.
Our strategy in actionGPS continued
Year Market share target Capacity utilisation
2008 10% 100% single shift2009 15% 100% double shift2010 18% 100% triple shift
Market competitiveness1Operational excellence2
Shareholder value
‘We estimate that every 10 percentage point increase in capacity utilisation will increase our operating margin by20 percentage points.’
‘In under two years the GPS division has doubled the number of operators to 60 in orderto support our increasein production.’
Generico Annual report 2007 37O
verview01-11
Our m
arkets12-17
Our group
strategy18-23
Our strategy in action
– GP
S24-37
Our delivery of value
38-47O
ur accounts48-76
OutlookThe boat positioning systems market looks exceptionally attractive,and our products lead the technological revolution that is drivinggrowth in demand.
In its first few years after start-up, Tracker Navigation struggled to buildthe resources required to grow sales as rapidly as this exciting newmarket might allow. By joining Generico, it has gained access to ourextensive network of sales contacts in many of Europe’s major boatbuilders. Combined with an aggressive pricing policy and continuedquality improvement, this offers the prospect of significant increases in unit volumes and market share.
At the same time, the Fast Forward programme and introduction ofour new AB1 technology will allow continued good margin growthalongside competitive pricing.
We are currently seeking approval for our positioning systemsproducts in North America, with a view to entering that market in2010. Initially we intend to sell through our existing AWB division sales team and we plan to cross-sell between both divisions’ existing and new customers. As with all weather beacons, the largeNorth American market has the potential to provide around twice as much of our revenue as Europe, at significantly higher margins. To date there has been less intense competition in the North American market, and this is reflected in significantly higher prices.
‘Our products lead the technological revolution that is driving growth in demand.’
‘The boat positioning systems market looks exceptionally attractive.’
38 Generico Annual report 2007
Generico Annual report 2007 39O
verview01-11
Our
markets
12-17O
urgroup
strategy18-23
Our
strategyin
action24-37
Ourdelivery
ofvalue38-47
Our
accounts48-76
Our delivery of value
In this section we address the following questions:
p How do we measure value creation?
p Have we created value for shareholders?
p What has driven our revenue growth?
p How sensitive are our forecasts?
p What have we done with the cash generated?
Key points:
p Significant increase in revenues
p Decline in margins
p Continued increase in value created
p Committed to investing for future growth
We’re achieving our goal of creating value, so that we can fund investment in further growth while paying a fair return to shareholders.
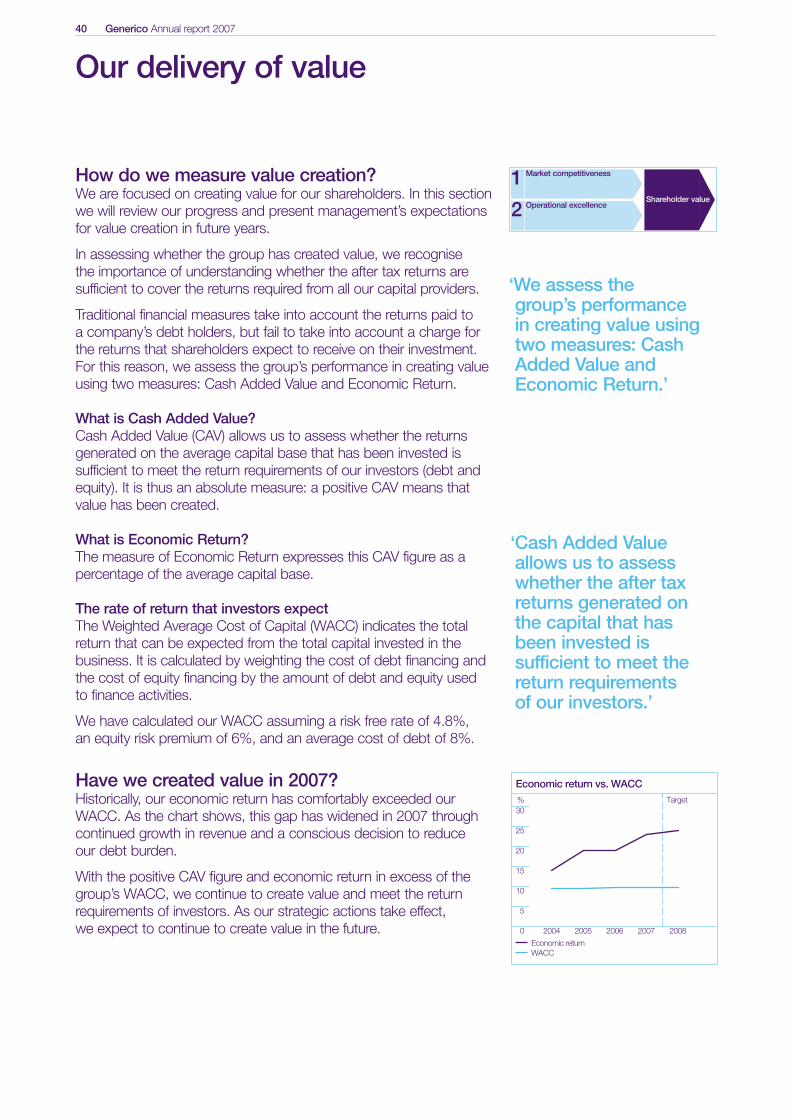
40 Generico Annual report 2007
How do we measure value creation?We are focused on creating value for our shareholders. In this sectionwe will review our progress and present management’s expectationsfor value creation in future years.
In assessing whether the group has created value, we recognise the importance of understanding whether the after tax returns aresufficient to cover the returns required from all our capital providers.
Traditional financial measures take into account the returns paid toa company’s debt holders, but fail to take into account a charge forthe returns that shareholders expect to receive on their investment.For this reason, we assess the group’s performance in creating valueusing two measures: Cash Added Value and Economic Return.
What is Cash Added Value?Cash Added Value (CAV) allows us to assess whether the returns generated on the average capital base that has been invested issufficient to meet the return requirements of our investors (debt andequity). It is thus an absolute measure: a positive CAV means thatvalue has been created.
What is Economic Return?The measure of Economic Return expresses this CAV figure as apercentage of the average capital base.
The rate of return that investors expectThe Weighted Average Cost of Capital (WACC) indicates the totalreturn that can be expected from the total capital invested in thebusiness. It is calculated by weighting the cost of debt financing andthe cost of equity financing by the amount of debt and equity usedto finance activities.
We have calculated our WACC assuming a risk free rate of 4.8%, an equity risk premium of 6%, and an average cost of debt of 8%.
Have we created value in 2007?Historically, our economic return has comfortably exceeded ourWACC. As the chart shows, this gap has widened in 2007 throughcontinued growth in revenue and a conscious decision to reduce our debt burden.
With the positive CAV figure and economic return in excess of thegroup’s WACC, we continue to create value and meet the returnrequirements of investors. As our strategic actions take effect, we expect to continue to create value in the future.
Our delivery of value
Market competitiveness1Operational excellence2
Shareholder value
‘We assess thegroup’s performancein creating value usingtwo measures: CashAdded Value andEconomic Return.’
‘Cash Added Value allows us to assesswhether the after taxreturns generated on the capital that has been invested issufficient to meet thereturn requirementsof our investors.’
Economic returnWACC
2004 2005 20072006 2008
30
25
20
15
10
5
0
Economic return vs. WACC% Target
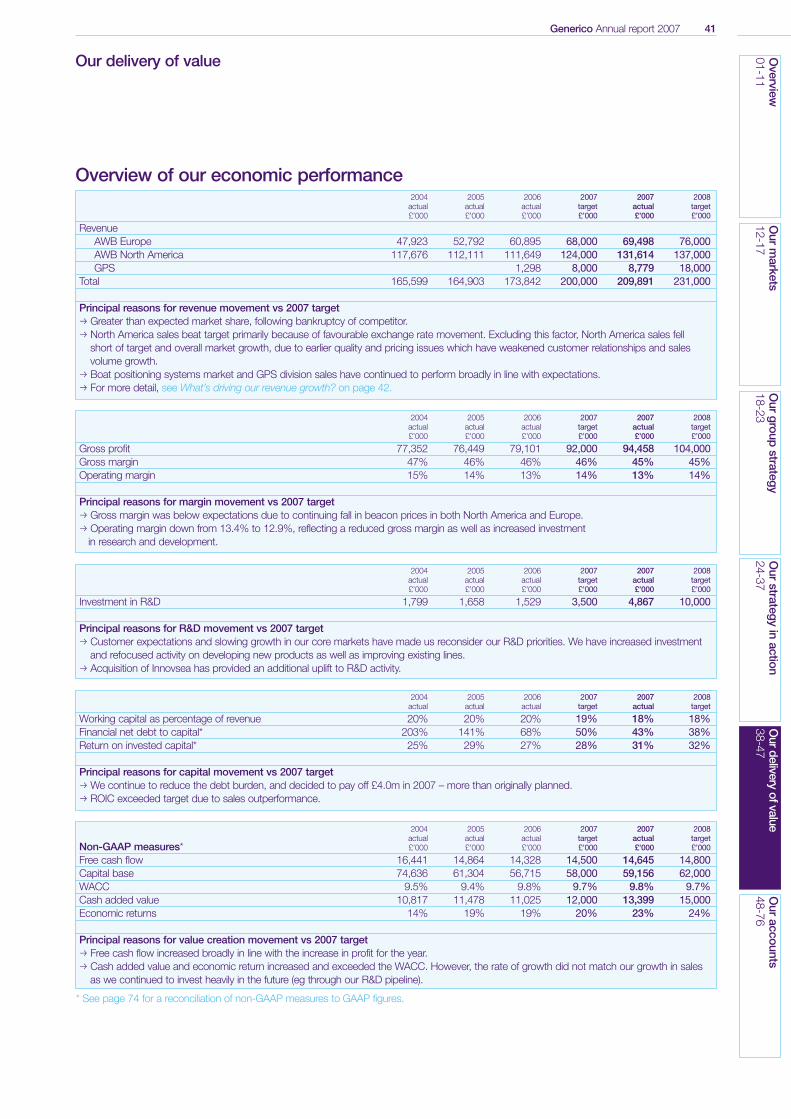
Overview of our economic performance
Our delivery of value
Generico Annual report 2007 41O
verview01-11
Our
markets
12-17O
urgroup
strategy18-23
Our
strategyin
action24-37
Ourdelivery
ofvalue38-47
Our
accounts48-76
2004 2005 2006 2007 2007 2008actual actual actual target actual target£’000 £’000 £’000 £’000 £’000 £’000
RevenueAWB Europe 47,923 52,792 60,895 68,000 69,498 76,000AWB North America 117,676 112,111 111,649 124,000 131,614 137,000GPS 1,298 8,000 8,779 18,000
Total 165,599 164,903 173,842 200,000 209,891 231,000
Principal reasons for revenue movement vs 2007 targetp Greater than expected market share, following bankruptcy of competitor.p North America sales beat target primarily because of favourable exchange rate movement. Excluding this factor, North America sales fell
short of target and overall market growth, due to earlier quality and pricing issues which have weakened customer relationships and salesvolume growth.
p Boat positioning systems market and GPS division sales have continued to perform broadly in line with expectations.p For more detail, see What’s driving our revenue growth? on page 42.
2004 2005 2006 2007 2007 2008actual actual actual target actual target
Working capital as percentage of revenue 20% 20% 20% 19% 18% 18%Financial net debt to capital* 203% 141% 68% 50% 43% 38%Return on invested capital* 25% 29% 27% 28% 31% 32%
Principal reasons for capital movement vs 2007 targetp We continue to reduce the debt burden, and decided to pay off £4.0m in 2007 – more than originally planned.p ROIC exceeded target due to sales outperformance.
2004 2005 2006 2007 2007 2008actual actual actual target actual target
Non-GAAP measures* £’000 £’000 £’000 £’000 £’000 £’000
Free cash flow 16,441 14,864 14,328 14,500 14,645 14,800Capital base 74,636 61,304 56,715 58,000 59,156 62,000WACC 9.5% 9.4% 9.8% 9.7% 9.8% 9.7%Cash added value 10,817 11,478 11,025 12,000 13,399 15,000Economic returns 14% 19% 19% 20% 23% 24%
Principal reasons for value creation movement vs 2007 targetp Free cash flow increased broadly in line with the increase in profit for the year.p Cash added value and economic return increased and exceeded the WACC. However, the rate of growth did not match our growth in sales
as we continued to invest heavily in the future (eg through our R&D pipeline).
2004 2005 2006 2007 2007 2008actual actual actual target actual target£’000 £’000 £’000 £’000 £’000 £’000
Gross profit 77,352 76,449 79,101 92,000 94,458 104,000Gross margin 47% 46% 46% 46% 45% 45%Operating margin 15% 14% 13% 14% 13% 14%
Principal reasons for margin movement vs 2007 targetp Gross margin was below expectations due to continuing fall in beacon prices in both North America and Europe.p Operating margin down from 13.4% to 12.9%, reflecting a reduced gross margin as well as increased investment
in research and development.
2004 2005 2006 2007 2007 2008actual actual actual target actual target£’000 £’000 £’000 £’000 £’000 £’000
Investment in R&D 1,799 1,658 1,529 3,500 4,867 10,000
Principal reasons for R&D movement vs 2007 targetp Customer expectations and slowing growth in our core markets have made us reconsider our R&D priorities. We have increased investment
and refocused activity on developing new products as well as improving existing lines.p Acquisition of Innovsea has provided an additional uplift to R&D activity.
* See page 74 for a reconciliation of non-GAAP measures to GAAP figures.
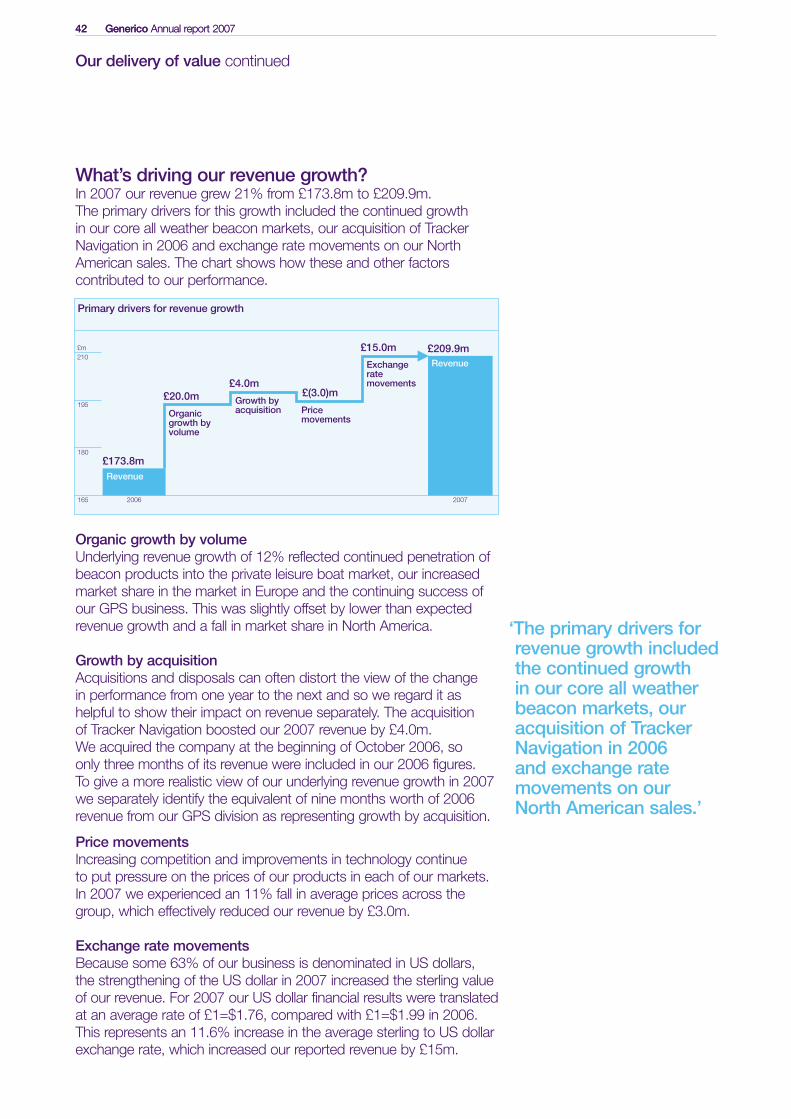
42 Generico Annual report 2007
Our delivery of value continued
42 Generico Annual report 2007
What’s driving our revenue growth?In 2007 our revenue grew 21% from £173.8m to £209.9m. The primary drivers for this growth included the continued growth in our core all weather beacon markets, our acquisition of TrackerNavigation in 2006 and exchange rate movements on our NorthAmerican sales. The chart shows how these and other factorscontributed to our performance.
Organic growth by volume Underlying revenue growth of 12% reflected continued penetration ofbeacon products into the private leisure boat market, our increasedmarket share in the market in Europe and the continuing success ofour GPS business. This was slightly offset by lower than expectedrevenue growth and a fall in market share in North America.
Growth by acquisitionAcquisitions and disposals can often distort the view of the change in performance from one year to the next and so we regard it ashelpful to show their impact on revenue separately. The acquisition of Tracker Navigation boosted our 2007 revenue by £4.0m. We acquired the company at the beginning of October 2006, so only three months of its revenue were included in our 2006 figures.To give a more realistic view of our underlying revenue growth in 2007we separately identify the equivalent of nine months worth of 2006revenue from our GPS division as representing growth by acquisition.
Price movementsIncreasing competition and improvements in technology continueto put pressure on the prices of our products in each of our markets.In 2007 we experienced an 11% fall in average prices across thegroup, which effectively reduced our revenue by £3.0m.
Exchange rate movementsBecause some 63% of our business is denominated in US dollars, the strengthening of the US dollar in 2007 increased the sterling valueof our revenue. For 2007 our US dollar financial results were translated at an average rate of £1=$1.76, compared with £1=$1.99 in 2006. This represents an 11.6% increase in the average sterling to US dollarexchange rate, which increased our reported revenue by £15m.
Primary drivers for revenue growth
210£m
195
180
165 2006 2007
Revenue
Organic growth byvolume
£173.8m
£20.0m£4.0m
£(3.0)m
£15.0m £209.9m
Growth byacquisition Price
movements
Exchangeratemovements
Revenue
‘The primary drivers forrevenue growth includedthe continued growth in our core all weatherbeacon markets, ouracquisition of TrackerNavigation in 2006 and exchange ratemovements on our North American sales.’
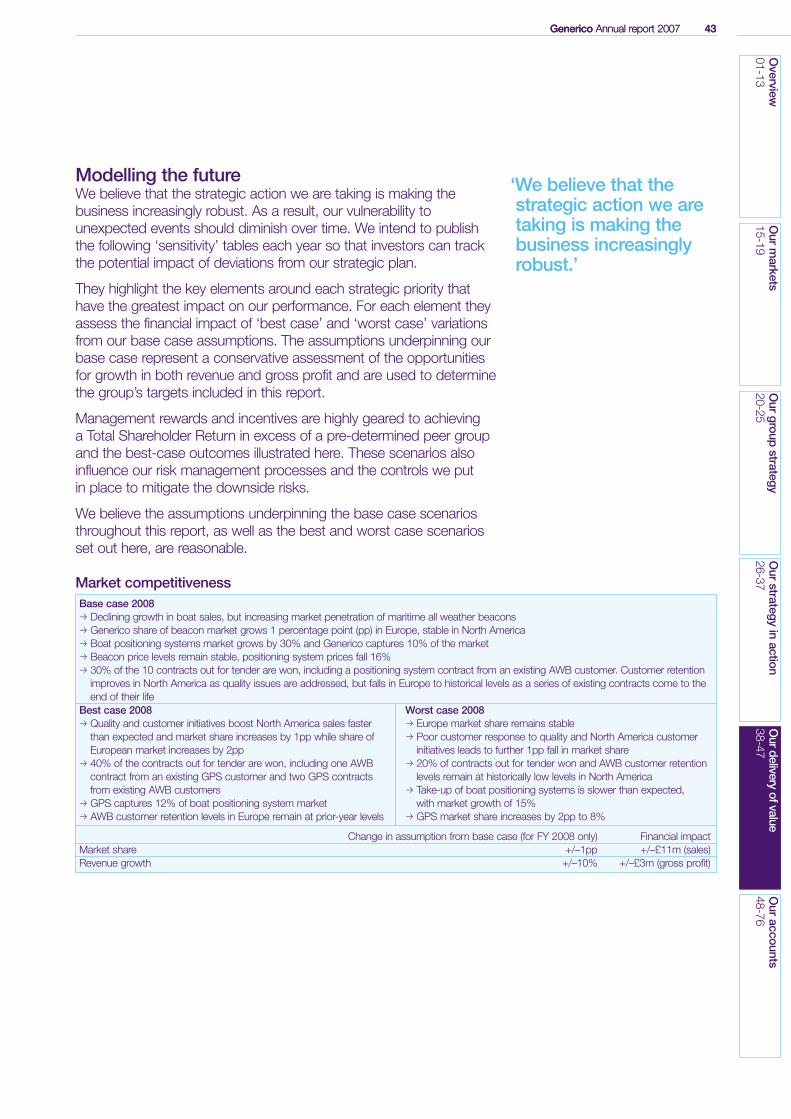
Generico Annual report 2007 43O
verview01-13
Our
markets
15-19O
urgroup
strategy20-25
Our
strategyin
action26-37
Ourdelivery
ofvalue38-47
Our
accounts48-76
Generico Annual report 2007 43
Modelling the futureWe believe that the strategic action we are taking is making thebusiness increasingly robust. As a result, our vulnerability tounexpected events should diminish over time. We intend to publishthe following ‘sensitivity’ tables each year so that investors can trackthe potential impact of deviations from our strategic plan.
They highlight the key elements around each strategic priority thathave the greatest impact on our performance. For each element theyassess the financial impact of ‘best case’ and ‘worst case’ variationsfrom our base case assumptions. The assumptions underpinning ourbase case represent a conservative assessment of the opportunitiesfor growth in both revenue and gross profit and are used to determinethe group’s targets included in this report.
Management rewards and incentives are highly geared to achievinga Total Shareholder Return in excess of a pre-determined peer groupand the best-case outcomes illustrated here. These scenarios alsoinfluence our risk management processes and the controls we put in place to mitigate the downside risks.
We believe the assumptions underpinning the base case scenariosthroughout this report, as well as the best and worst case scenariosset out here, are reasonable.
Market competitivenessBase case 2008p Declining growth in boat sales, but increasing market penetration of maritime all weather beaconsp Generico share of beacon market grows 1 percentage point (pp) in Europe, stable in North Americap Boat positioning systems market grows by 30% and Generico captures 10% of the marketp Beacon price levels remain stable, positioning system prices fall 16%p 30% of the 10 contracts out for tender are won, including a positioning system contract from an existing AWB customer. Customer retention
improves in North America as quality issues are addressed, but falls in Europe to historical levels as a series of existing contracts come to theend of their life
‘We believe that the strategic action we are taking is making the business increasingly robust.’
Best case 2008p Quality and customer initiatives boost North America sales faster
than expected and market share increases by 1pp while share ofEuropean market increases by 2pp
p 40% of the contracts out for tender are won, including one AWBcontract from an existing GPS customer and two GPS contractsfrom existing AWB customers
p GPS captures 12% of boat positioning system marketp AWB customer retention levels in Europe remain at prior-year levels
Worst case 2008p Europe market share remains stablep Poor customer response to quality and North America customer
initiatives leads to further 1pp fall in market sharep 20% of contracts out for tender won and AWB customer retention
levels remain at historically low levels in North Americap Take-up of boat positioning systems is slower than expected,
with market growth of 15%p GPS market share increases by 2pp to 8%
Change in assumption from base case (for FY 2008 only) Financial impactMarket share +/–1pp +/–£11m (sales)Revenue growth +/–10% +/–£3m (gross profit)
44 Generico Annual report 2007
Our delivery of value continued
44 Generico Annual report 2007
Operational effectiveness
Currency
Base case 2008p Operational effectiveness initiatives begin to have a positive impact on the margins in AWB and they begin to stabilise after five years of declinep Raw material costs fall to £80 per unit in Europe and $160 per unit in North America, but the fall in Europe is not enough to offset the fall in
prices so margins tightenp Continuing economies of scale in the GPS division result in 1pp margin improvement
Base case 2008p Average sterling to US dollar exchange rate remains stable in 2008Best case 2008p The average exchange rate increases by 5%
Worst case 2008p The average exchange rate decreases by 5%
For more information, go to: www.generico.co.uk/ir/sensitivitymodel
Best case 2008p Operational effectiveness initiatives have greater than expected
impact: cost savings from better material handling and employeeretention bring 0.5pp and 1pp improvement in the AWB division’sgross and operating margins respectively
p Greater economies of scale from integrating our GPS division’spractices with those of AWB result in 3pp improvement in GPSoperating margins
Worst case 2008p Operational effectiveness initiatives cost more than expected
to implement and take longer to deliver results, so AWB gross and operating margins continue to fall – down 1pp and 1.5pp respectively
p GPS gross and operating margins remain at historic levels as aresult of delay in consolidating GPS and AWB purchasing systemsand capacity utilisation levels stall at 50%
Change in assumption from base case (for FY 2008 only) Financial impactOperating margin +/–1pp +/–£2.3m (gross profit)
Change in assumption from base case (for FY 2008 only) Financial impactUS dollar exchange rate +5% +£2.3m (gross profit)
–5% –£1.9m (gross profit)
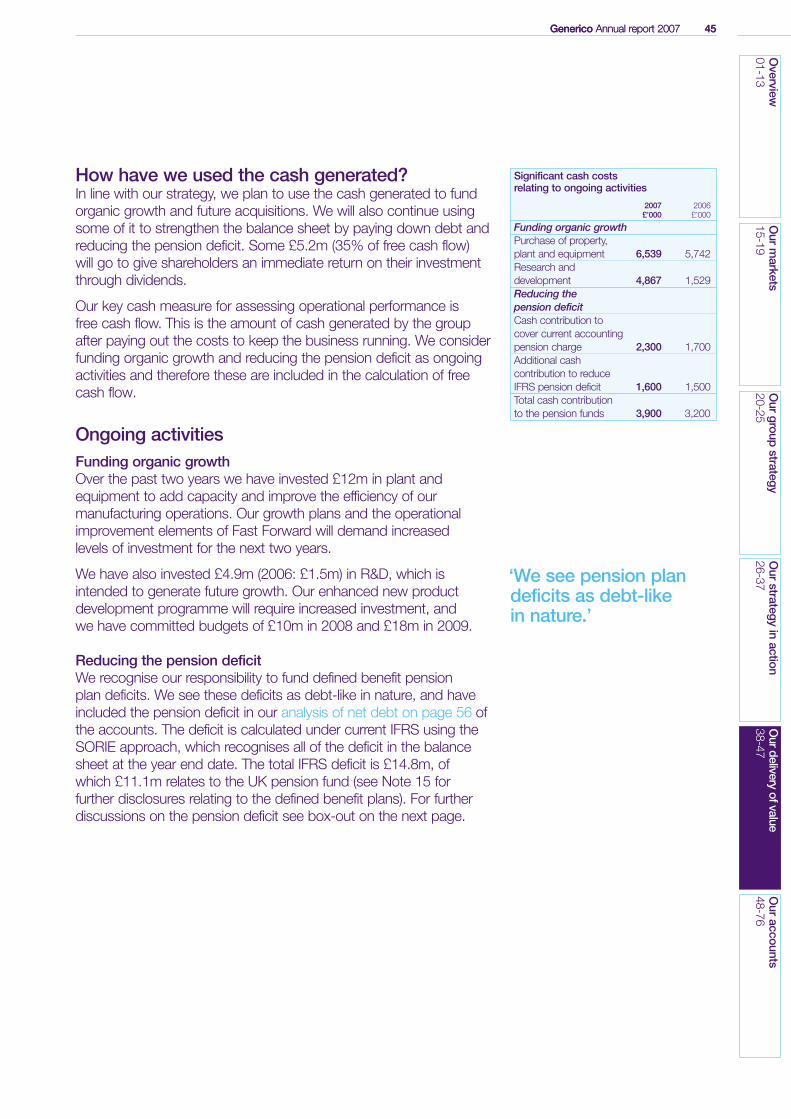
Generico Annual report 2007 45O
verview01-13
Our
markets
15-19O
urgroup
strategy20-25
Our
strategyin
action26-37
Ourdelivery
ofvalue38-47
Our
accounts48-76
Generico Annual report 2007 45
How have we used the cash generated?In line with our strategy, we plan to use the cash generated to fundorganic growth and future acquisitions. We will also continue usingsome of it to strengthen the balance sheet by paying down debt andreducing the pension deficit. Some £5.2m (35% of free cash flow) will go to give shareholders an immediate return on their investmentthrough dividends.
Our key cash measure for assessing operational performance is free cash flow. This is the amount of cash generated by the groupafter paying out the costs to keep the business running. We considerfunding organic growth and reducing the pension deficit as ongoingactivities and therefore these are included in the calculation of freecash flow.
Ongoing activitiesFunding organic growthOver the past two years we have invested £12m in plant andequipment to add capacity and improve the efficiency of ourmanufacturing operations. Our growth plans and the operationalimprovement elements of Fast Forward will demand increased levels of investment for the next two years.
We have also invested £4.9m (2006: £1.5m) in R&D, which isintended to generate future growth. Our enhanced new productdevelopment programme will require increased investment, and we have committed budgets of £10m in 2008 and £18m in 2009.
Reducing the pension deficitWe recognise our responsibility to fund defined benefit pension plan deficits. We see these deficits as debt-like in nature, and haveincluded the pension deficit in our analysis of net debt on page 56 ofthe accounts. The deficit is calculated under current IFRS using theSORIE approach, which recognises all of the deficit in the balancesheet at the year end date. The total IFRS deficit is £14.8m, of which £11.1m relates to the UK pension fund (see Note 15 for further disclosures relating to the defined benefit plans). For furtherdiscussions on the pension deficit see box-out on the next page.
Significant cash costs relating to ongoing activities
2007 2006£’000 £’000
Funding organic growthPurchase of property, plant and equipment 6,539 5,742Research and development 4,867 1,529Reducing the pension deficitCash contribution to cover current accounting pension charge 2,300 1,700Additional cash contribution to reduce IFRS pension deficit 1,600 1,500Total cash contribution to the pension funds 3,900 3,200
‘We see pension plandeficits as debt-like in nature.’
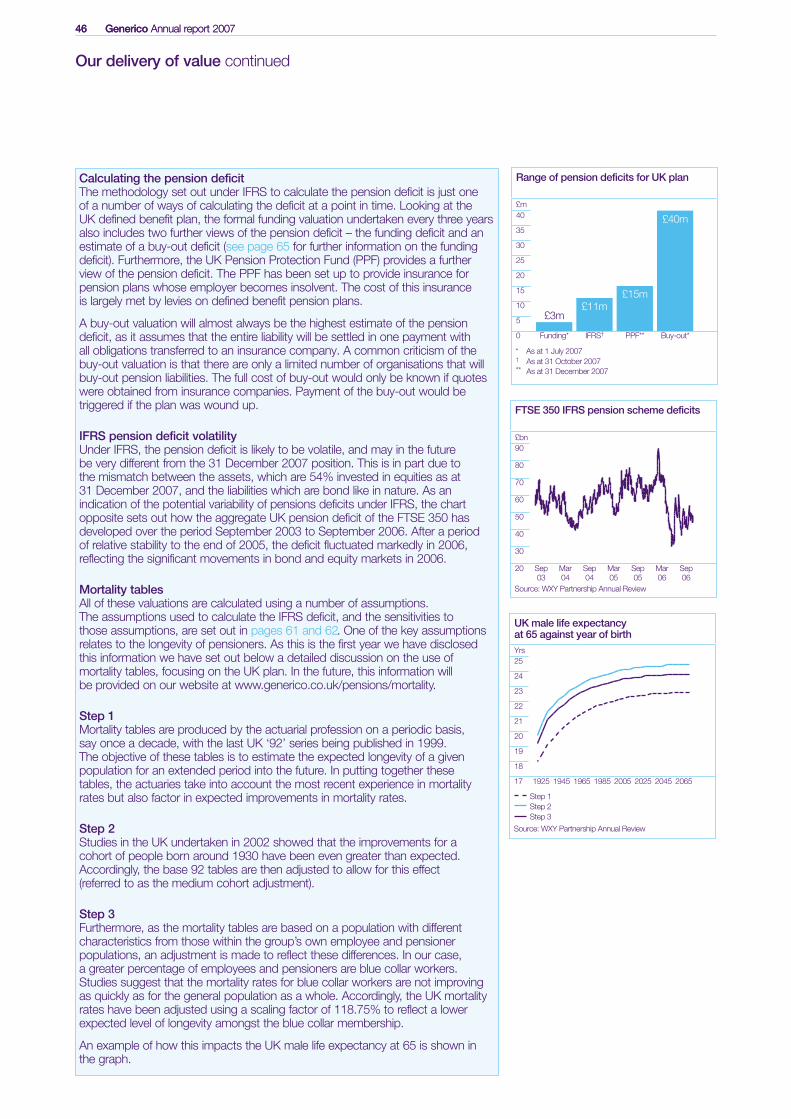
46 Generico Annual report 2007
Our delivery of value continued
46 Generico Annual report 2007
Range of pension deficits for UK plan
40
35
£m
30
25
20
15
10
5
0 Funding*
£3m
IFRS†
£11m
PPF**
£15m
Buy-out*
£40m
* As at 1 July 2007† As at 31 October 2007** As at 31 December 2007
Step 1Step 2Step 3
1925 1945 1965 2005 204520251985 2065
25
24
23
22
21
20
19
18
17
UK male life expectancy at 65 against year of birthYrs
Source: WXY Partnership Annual Review
Sep 03
Source: WXY Partnership Annual Review
Mar 04
Sep 04
Sep 05
Mar 06
Mar 05
Sep 06
90
80
70
60
50
40
30
20
FTSE 350 IFRS pension scheme deficits
£bn
Calculating the pension deficitThe methodology set out under IFRS to calculate the pension deficit is just one of a number of ways of calculating the deficit at a point in time. Looking at the UK defined benefit plan, the formal funding valuation undertaken every three yearsalso includes two further views of the pension deficit – the funding deficit and anestimate of a buy-out deficit (see page 65 for further information on the fundingdeficit). Furthermore, the UK Pension Protection Fund (PPF) provides a furtherview of the pension deficit. The PPF has been set up to provide insurance forpension plans whose employer becomes insolvent. The cost of this insurance is largely met by levies on defined benefit pension plans.
A buy-out valuation will almost always be the highest estimate of the pensiondeficit, as it assumes that the entire liability will be settled in one payment with all obligations transferred to an insurance company. A common criticism of thebuy-out valuation is that there are only a limited number of organisations that willbuy-out pension liabilities. The full cost of buy-out would only be known if quoteswere obtained from insurance companies. Payment of the buy-out would betriggered if the plan was wound up.
IFRS pension deficit volatilityUnder IFRS, the pension deficit is likely to be volatile, and may in the future be very different from the 31 December 2007 position. This is in part due to the mismatch between the assets, which are 54% invested in equities as at 31 December 2007, and the liabilities which are bond like in nature. As anindication of the potential variability of pensions deficits under IFRS, the chartopposite sets out how the aggregate UK pension deficit of the FTSE 350 hasdeveloped over the period September 2003 to September 2006. After a period of relative stability to the end of 2005, the deficit fluctuated markedly in 2006,reflecting the significant movements in bond and equity markets in 2006.
Mortality tablesAll of these valuations are calculated using a number of assumptions.The assumptions used to calculate the IFRS deficit, and the sensitivities to those assumptions, are set out in pages 61 and 62. One of the key assumptionsrelates to the longevity of pensioners. As this is the first year we have disclosedthis information we have set out below a detailed discussion on the use ofmortality tables, focusing on the UK plan. In the future, this information will be provided on our website at www.generico.co.uk/pensions/mortality.
Step 1Mortality tables are produced by the actuarial profession on a periodic basis, say once a decade, with the last UK ‘92’ series being published in 1999. The objective of these tables is to estimate the expected longevity of a givenpopulation for an extended period into the future. In putting together these tables, the actuaries take into account the most recent experience in mortalityrates but also factor in expected improvements in mortality rates.
Step 2Studies in the UK undertaken in 2002 showed that the improvements for a cohort of people born around 1930 have been even greater than expected.Accordingly, the base 92 tables are then adjusted to allow for this effect(referred to as the medium cohort adjustment).
Step 3Furthermore, as the mortality tables are based on a population with differentcharacteristics from those within the group’s own employee and pensionerpopulations, an adjustment is made to reflect these differences. In our case, a greater percentage of employees and pensioners are blue collar workers.Studies suggest that the mortality rates for blue collar workers are not improvingas quickly as for the general population as a whole. Accordingly, the UK mortalityrates have been adjusted using a scaling factor of 118.75% to reflect a lowerexpected level of longevity amongst the blue collar membership.
An example of how this impacts the UK male life expectancy at 65 is shown inthe graph.
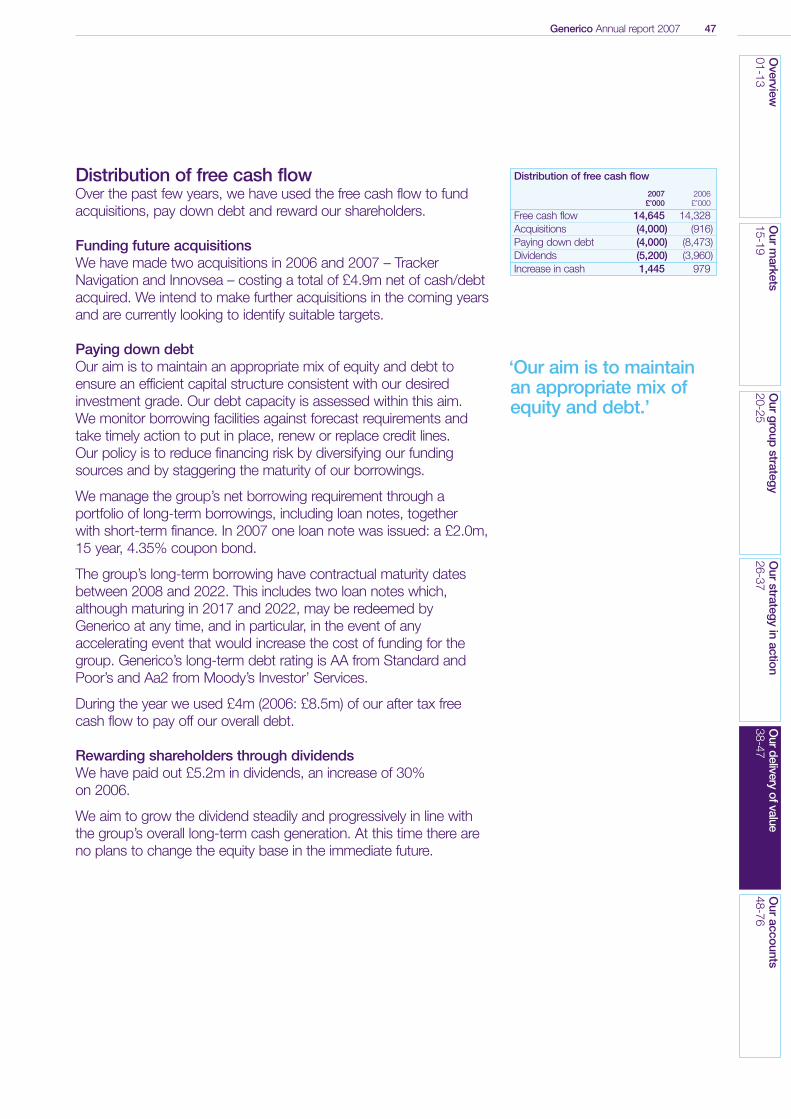
Generico Annual report 2007 47O
verview01-13
Our
markets
15-19O
urgroup
strategy20-25
Our
strategyin
action26-37
Ourdelivery
ofvalue38-47
Our
accounts48-76
Distribution of free cash flowOver the past few years, we have used the free cash flow to fundacquisitions, pay down debt and reward our shareholders.
Funding future acquisitionsWe have made two acquisitions in 2006 and 2007 – TrackerNavigation and Innovsea – costing a total of £4.9m net of cash/debtacquired. We intend to make further acquisitions in the coming yearsand are currently looking to identify suitable targets.
Paying down debtOur aim is to maintain an appropriate mix of equity and debt to ensure an efficient capital structure consistent with our desiredinvestment grade. Our debt capacity is assessed within this aim.We monitor borrowing facilities against forecast requirements and take timely action to put in place, renew or replace credit lines.Our policy is to reduce financing risk by diversifying our fundingsources and by staggering the maturity of our borrowings.
We manage the group’s net borrowing requirement through a portfolio of long-term borrowings, including loan notes, together with short-term finance. In 2007 one loan note was issued: a £2.0m,15 year, 4.35% coupon bond.
The group’s long-term borrowing have contractual maturity datesbetween 2008 and 2022. This includes two loan notes which,although maturing in 2017 and 2022, may be redeemed by Generico at any time, and in particular, in the event of any accelerating event that would increase the cost of funding for thegroup. Generico’s long-term debt rating is AA from Standard andPoor’s and Aa2 from Moody’s Investor’ Services.
During the year we used £4m (2006: £8.5m) of our after tax free cash flow to pay off our overall debt.
Rewarding shareholders through dividendsWe have paid out £5.2m in dividends, an increase of 30% on 2006.
We aim to grow the dividend steadily and progressively in line with the group’s overall long-term cash generation. At this time there are no plans to change the equity base in the immediate future.
Distribution of free cash flow
2007 2006£’000 £’000
Free cash flow 14,645 14,328Acquisitions (4,000) (916)Paying down debt (4,000) (8,473)Dividends (5,200) (3,960)Increase in cash 1,445 979
‘Our aim is to maintain an appropriate mix ofequity and debt.’
48 Generico Annual report 2007
Generico Annual report 2007 49O
verview01-11
Our
markets
12-17O
urgroup
strategy18-23
Our
strategyin
action24-37
Ourdelivery
ofvalue38-47
Our
accounts48-76
Our accounts
51 Profit and loss account52 Statement of total recognised income and expense (SORIE)53 Balance sheet54 Cash flow statement56 Notes to the financial statements
Key pointsp Revenues increased by 21% to £209.9m
p Profit for the year up by 28% to £18.5m
p Continuing decrease in net debt
50 Generico Annual report 2007
Special features of our accountsp Notes provided are those relevant to illustrating specific proposals
for disclosure
p The notes featured are highlighted in bold
p Box-outs presented to provide further analysis of figures or explaintechnical terms
p Used box-outs sparingly to avoid clutter
p Accounts feature a number of non-GAAP measures used bymanagement which are clearly identified using the icon
p Analysis of debt provided to give a clear summary of management’sview of the group’s net indebtedness
p Greater granularity of segmental analysis and costs
p In-depth discussion to allow the reader to understand the group’spension liabilities and the sensitivities underlying them
NON-GAAP
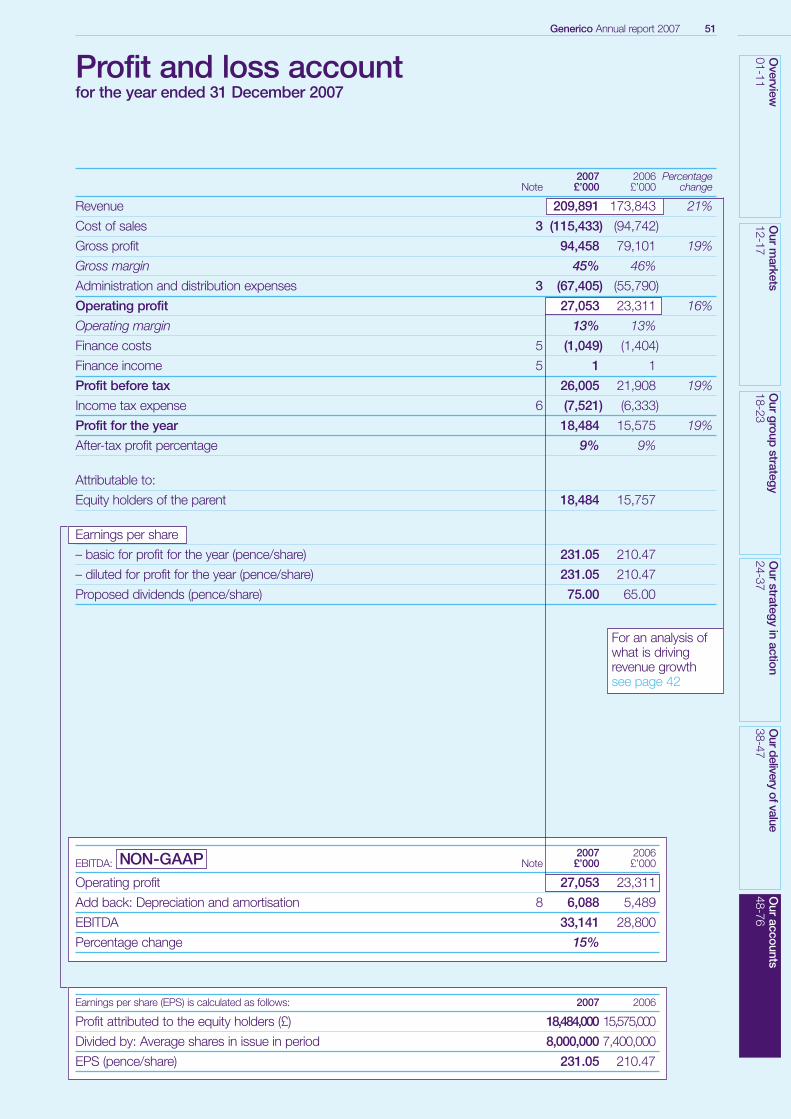
Generico Annual report 2007 51O
verview01-11
Our
markets
12-17O
urgroup
strategy18-23
Our
strategyin
action24-37
Ourdelivery
ofvalue38-47
Our
accounts48-76
Profit and loss account for the year ended 31 December 2007
For an analysis ofwhat is drivingrevenue growthsee page 42
2007 2006 PercentageNote £’000 £’000 change
Revenue 209,891 173,843 21%
Cost of sales 3 (115,433) (94,742)
Gross profit 94,458 79,101 19%
Gross margin 45% 46%
Administration and distribution expenses 3 (67,405) (55,790)
Operating profit 27,053 23,311 16%
Operating margin 13% 13%
Finance costs 5 (1,049) (1,404)
Finance income 5 1 1
Profit before tax 26,005 21,908 19%
Income tax expense 6 (7,521) (6,333)
Profit for the year 18,484 15,575 19%
After-tax profit percentage 9% 9%
Attributable to:
Equity holders of the parent 18,484 15,757
Earnings per share
– basic for profit for the year (pence/share) 231.05 210.47
– diluted for profit for the year (pence/share) 231.05 210.47
Proposed dividends (pence/share) 75.00 65.00
2007 2006EBITDA: Note £’000 £’000
Operating profit 27,053 23,311
Add back: Depreciation and amortisation 8 6,088 5,489
EBITDA 33,141 28,800
Percentage change 15%
Earnings per share (EPS) is calculated as follows: 2007 2006
Profit attributed to the equity holders (£) 18,484,000 15,575,000
Divided by: Average shares in issue in period 8,000,000 7,400,000
EPS (pence/share) 231.05 210.47
NON-GAAP
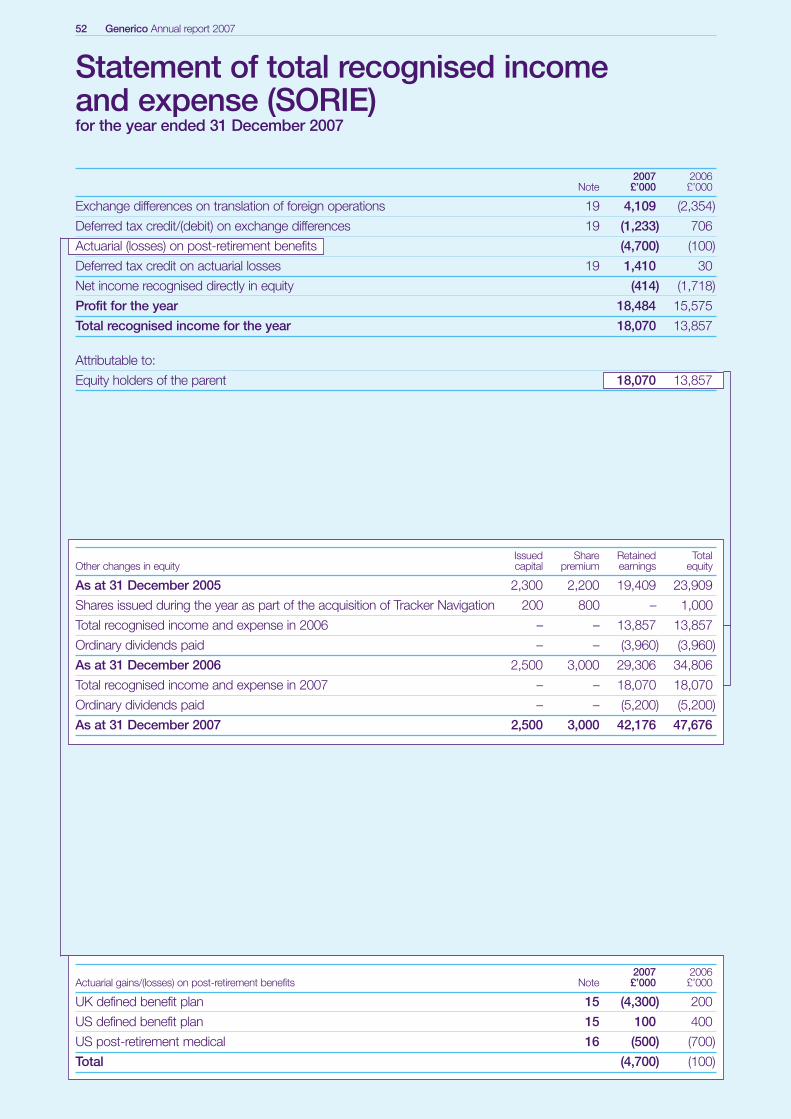
52 Generico Annual report 2007
Statement of total recognised income and expense (SORIE) for the year ended 31 December 2007
2007 2006Actuarial gains/(losses) on post-retirement benefits Note £’000 £’000
UK defined benefit plan 15 (4,300) 200
US defined benefit plan 15 100 400
US post-retirement medical 16 (500) (700)
Total (4,700) (100)
Issued Share Retained Total Other changes in equity capital premium earnings equity
As at 31 December 2005 2,300 2,200 19,409 23,909
Shares issued during the year as part of the acquisition of Tracker Navigation 200 800 – 1,000
Total recognised income and expense in 2006 – – 13,857 13,857
Ordinary dividends paid – – (3,960) (3,960)
As at 31 December 2006 2,500 3,000 29,306 34,806
Total recognised income and expense in 2007 – – 18,070 18,070
Ordinary dividends paid – – (5,200) (5,200)
As at 31 December 2007 2,500 3,000 42,176 47,676
2007 2006Note £’000 £’000
Exchange differences on translation of foreign operations 19 4,109 (2,354)
Deferred tax credit/(debit) on exchange differences 19 (1,233) 706
Actuarial (losses) on post-retirement benefits (4,700) (100)
Deferred tax credit on actuarial losses 19 1,410 30
Net income recognised directly in equity (414) (1,718)
Profit for the year 18,484 15,575
Total recognised income for the year 18,070 13,857
Attributable to:
Equity holders of the parent 18,070 13,857
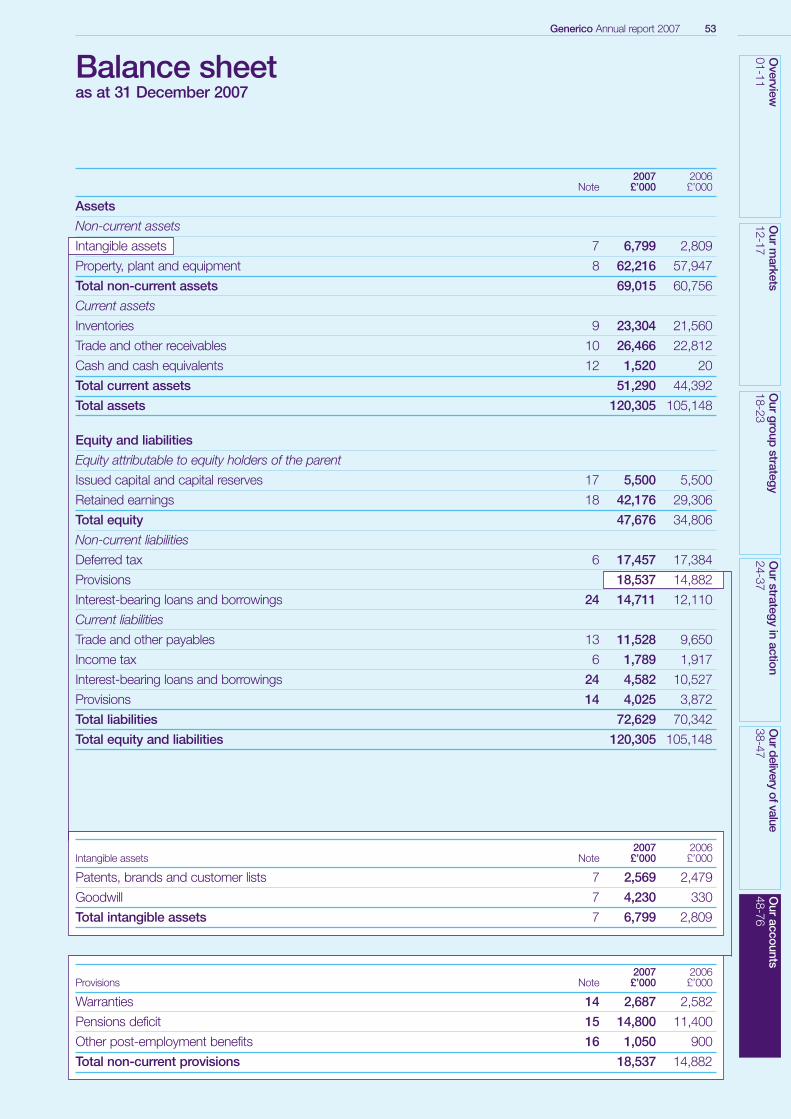
Generico Annual report 2007 53O
verview01-11
Our
markets
12-17O
urgroup
strategy18-23
Our
strategyin
action24-37
Ourdelivery
ofvalue38-47
Our
accounts48-76
Balance sheet as at 31 December 2007
2007 2006Intangible assets Note £’000 £’000
Patents, brands and customer lists 7 2,569 2,479
Goodwill 7 4,230 330
Total intangible assets 7 6,799 2,809
2007 2006Provisions Note £’000 £’000
Warranties 14 2,687 2,582
Pensions deficit 15 14,800 11,400
Other post-employment benefits 16 1,050 900
Total non-current provisions 18,537 14,882
2007 2006Note £’000 £’000
Assets
Non-current assets
Intangible assets 7 6,799 2,809
Property, plant and equipment 8 62,216 57,947
Total non-current assets 69,015 60,756
Current assets
Inventories 9 23,304 21,560
Trade and other receivables 10 26,466 22,812
Cash and cash equivalents 12 1,520 20
Total current assets 51,290 44,392
Total assets 120,305 105,148
Equity and liabilities
Equity attributable to equity holders of the parent
Issued capital and capital reserves 17 5,500 5,500
Retained earnings 18 42,176 29,306
Total equity 47,676 34,806
Non-current liabilities
Deferred tax 6 17,457 17,384
Provisions 18,537 14,882
Interest-bearing loans and borrowings 24 14,711 12,110
Current liabilities
Trade and other payables 13 11,528 9,650
Income tax 6 1,789 1,917
Interest-bearing loans and borrowings 24 4,582 10,527
Provisions 14 4,025 3,872
Total liabilities 72,629 70,342
Total equity and liabilities 120,305 105,148
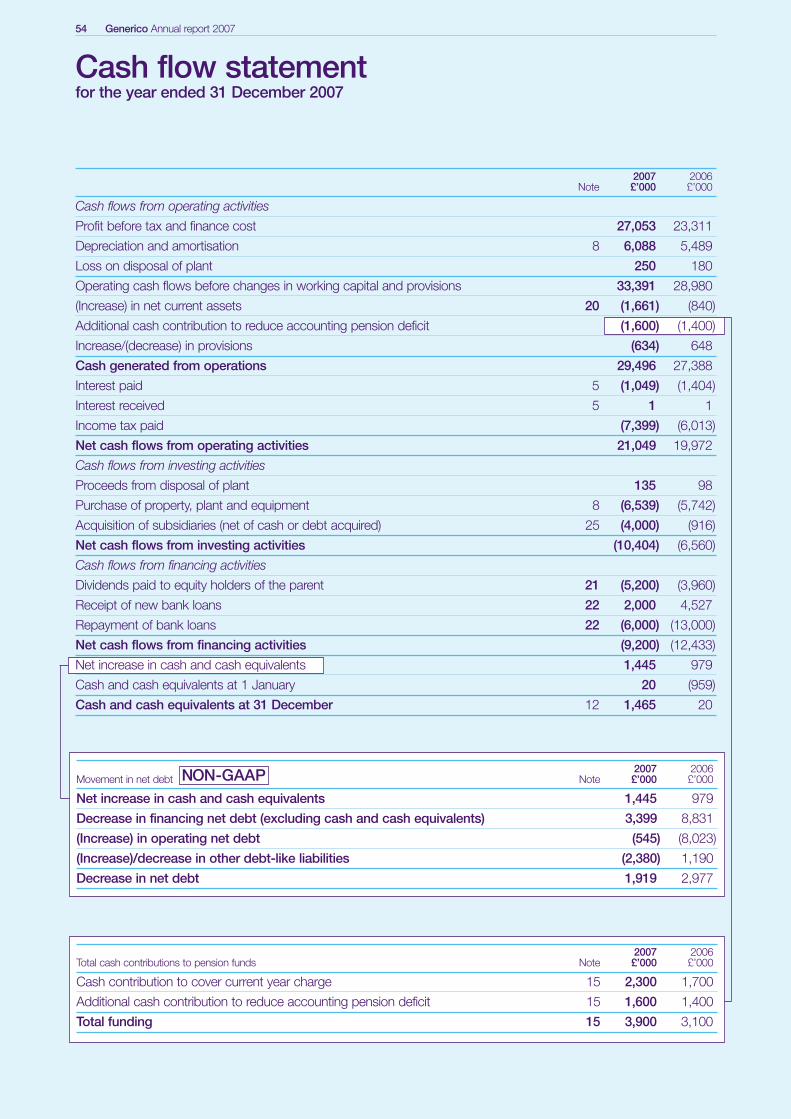
54 Generico Annual report 2007
Cash flow statement for the year ended 31 December 2007
2007 2006Total cash contributions to pension funds Note £’000 £’000
Cash contribution to cover current year charge 15 2,300 1,700
Additional cash contribution to reduce accounting pension deficit 15 1,600 1,400
Total funding 15 3,900 3,100
2007 2006Movement in net debt Note £’000 £’000
Net increase in cash and cash equivalents 1,445 979
Decrease in financing net debt (excluding cash and cash equivalents) 3,399 8,831
(Increase) in operating net debt (545) (8,023)
(Increase)/decrease in other debt-like liabilities (2,380) 1,190
Decrease in net debt 1,919 2,977
NON-GAAP
2007 2006Note £’000 £’000
Cash flows from operating activities
Profit before tax and finance cost 27,053 23,311
Depreciation and amortisation 8 6,088 5,489
Loss on disposal of plant 250 180
Operating cash flows before changes in working capital and provisions 33,391 28,980
(Increase) in net current assets 20 (1,661) (840)
Additional cash contribution to reduce accounting pension deficit (1,600) (1,400)
Increase/(decrease) in provisions (634) 648
Cash generated from operations 29,496 27,388
Interest paid 5 (1,049) (1,404)
Interest received 5 1 1
Income tax paid (7,399) (6,013)
Net cash flows from operating activities 21,049 19,972
Cash flows from investing activities
Proceeds from disposal of plant 135 98
Purchase of property, plant and equipment 8 (6,539) (5,742)
Acquisition of subsidiaries (net of cash or debt acquired) 25 (4,000) (916)
Net cash flows from investing activities (10,404) (6,560)
Cash flows from financing activities
Dividends paid to equity holders of the parent 21 (5,200) (3,960)
Receipt of new bank loans 22 2,000 4,527
Repayment of bank loans 22 (6,000) (13,000)
Net cash flows from financing activities (9,200) (12,433)
Net increase in cash and cash equivalents 1,445 979
Cash and cash equivalents at 1 January 20 (959)
Cash and cash equivalents at 31 December 12 1,465 20
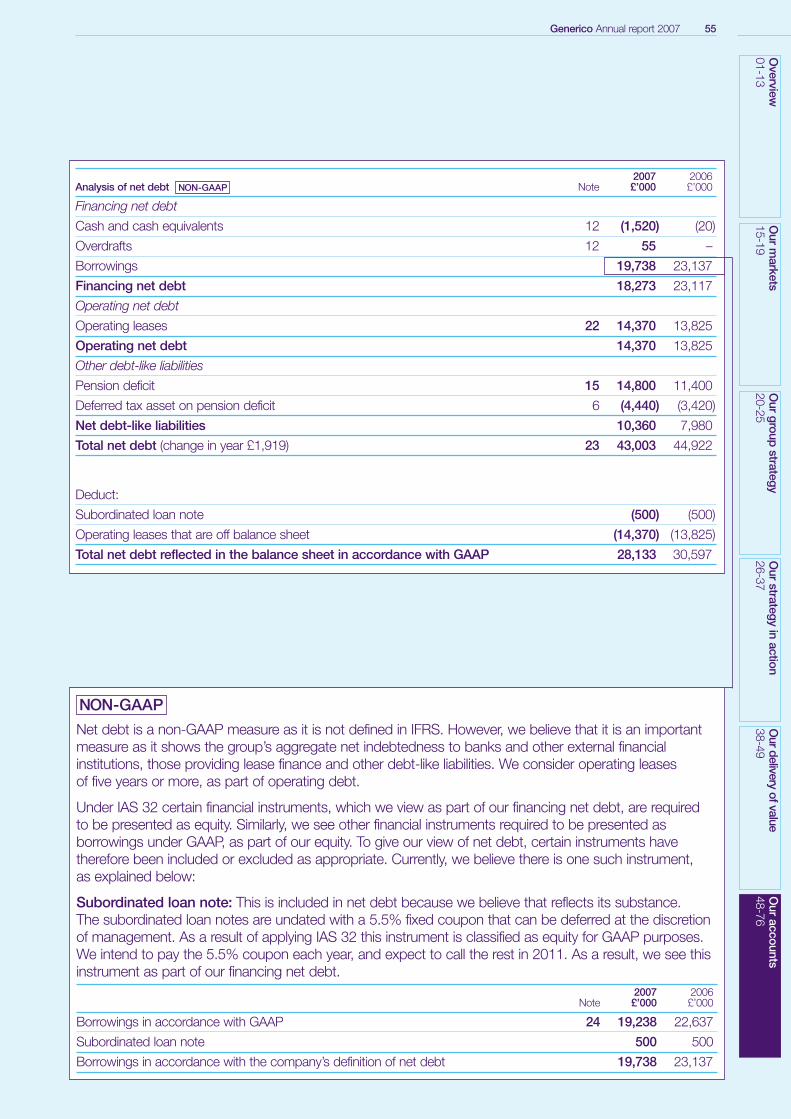
Generico Annual report 2007 55O
verview01-13
Our
markets
15-19O
urgroup
strategy20-25
Our
strategyin
action26-37
Ourdelivery
ofvalue38-49
Our
accounts48-76
NON-GAAP
NON-GAAP
Net debt is a non-GAAP measure as it is not defined in IFRS. However, we believe that it is an importantmeasure as it shows the group’s aggregate net indebtedness to banks and other external financialinstitutions, those providing lease finance and other debt-like liabilities. We consider operating leasesof five years or more, as part of operating debt.
Under IAS 32 certain financial instruments, which we view as part of our financing net debt, are required to be presented as equity. Similarly, we see other financial instruments required to be presented asborrowings under GAAP, as part of our equity. To give our view of net debt, certain instruments havetherefore been included or excluded as appropriate. Currently, we believe there is one such instrument, as explained below:
Subordinated loan note: This is included in net debt because we believe that reflects its substance. The subordinated loan notes are undated with a 5.5% fixed coupon that can be deferred at the discretionof management. As a result of applying IAS 32 this instrument is classified as equity for GAAP purposes.We intend to pay the 5.5% coupon each year, and expect to call the rest in 2011. As a result, we see thisinstrument as part of our financing net debt.
2007 2006Note £’000 £’000
Borrowings in accordance with GAAP 24 19,238 22,637
Subordinated loan note 500 500
Borrowings in accordance with the company’s definition of net debt 19,738 23,137
2007 2006Analysis of net debt Note £’000 £’000
Financing net debt
Cash and cash equivalents 12 (1,520) (20)
Overdrafts 12 55 –
Borrowings 19,738 23,137
Financing net debt 18,273 23,117
Operating net debt
Operating leases 22 14,370 13,825
Operating net debt 14,370 13,825
Other debt-like liabilities
Pension deficit 15 14,800 11,400
Deferred tax asset on pension deficit 6 (4,440) (3,420)
Net debt-like liabilities 10,360 7,980
Total net debt (change in year £1,919) 23 43,003 44,922
Deduct:
Subordinated loan note (500) (500)
Operating leases that are off balance sheet (14,370) (13,825)
Total net debt reflected in the balance sheet in accordance with GAAP 28,133 30,597
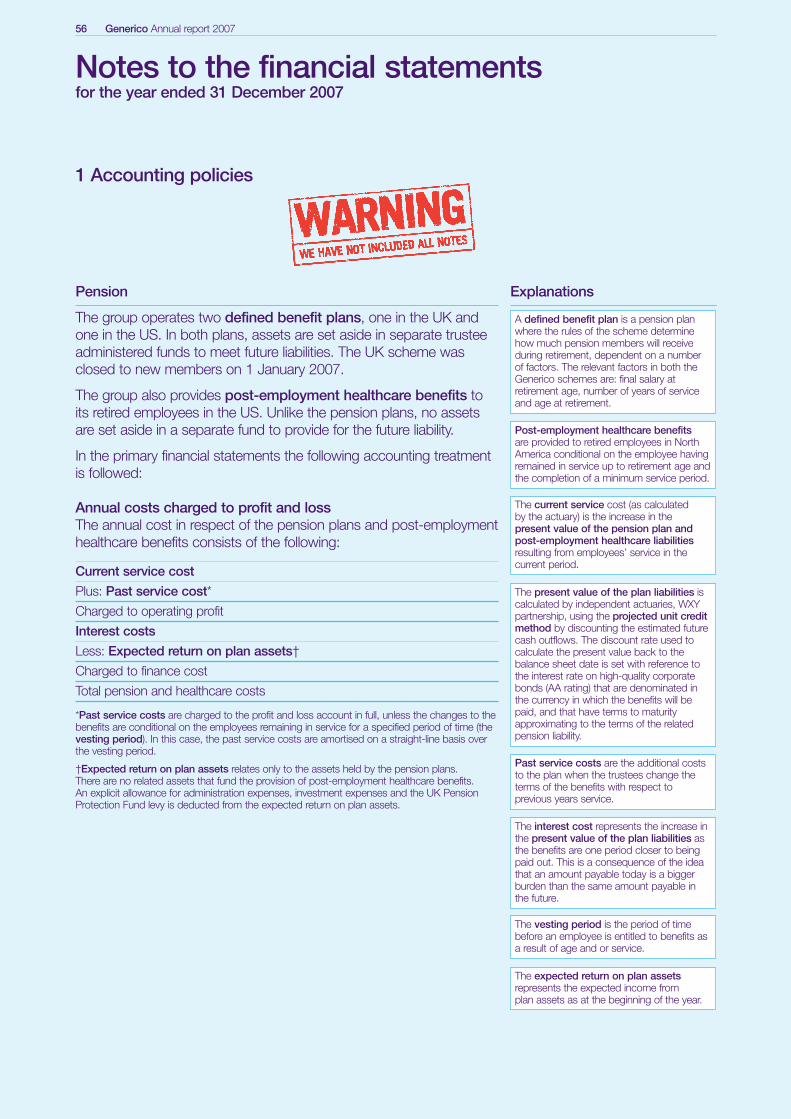
56 Generico Annual report 2007
Notes to the financial statementsfor the year ended 31 December 2007
1 Accounting policies
Pension
The group operates two defined benefit plans, one in the UK andone in the US. In both plans, assets are set aside in separate trusteeadministered funds to meet future liabilities. The UK scheme wasclosed to new members on 1 January 2007.
The group also provides post-employment healthcare benefits toits retired employees in the US. Unlike the pension plans, no assetsare set aside in a separate fund to provide for the future liability.
In the primary financial statements the following accounting treatmentis followed:
Annual costs charged to profit and lossThe annual cost in respect of the pension plans and post-employmenthealthcare benefits consists of the following:
Current service cost
Plus: Past service cost*
Charged to operating profit
Interest costs
Less: Expected return on plan assets†
Charged to finance cost
Total pension and healthcare costs
*Past service costs are charged to the profit and loss account in full, unless the changes to thebenefits are conditional on the employees remaining in service for a specified period of time (thevesting period). In this case, the past service costs are amortised on a straight-line basis overthe vesting period.
†Expected return on plan assets relates only to the assets held by the pension plans. There are no related assets that fund the provision of post-employment healthcare benefits.An explicit allowance for administration expenses, investment expenses and the UK PensionProtection Fund levy is deducted from the expected return on plan assets.
Explanations
A defined benefit plan is a pension planwhere the rules of the scheme determinehow much pension members will receiveduring retirement, dependent on a numberof factors. The relevant factors in both theGenerico schemes are: final salary atretirement age, number of years of serviceand age at retirement.
Post-employment healthcare benefitsare provided to retired employees in NorthAmerica conditional on the employee havingremained in service up to retirement age andthe completion of a minimum service period.
The current service cost (as calculated by the actuary) is the increase in the present value of the pension plan andpost-employment healthcare liabilitiesresulting from employees’ service in thecurrent period.
The present value of the plan liabilities iscalculated by independent actuaries, WXYpartnership, using the projected unit creditmethod by discounting the estimated futurecash outflows. The discount rate used tocalculate the present value back to thebalance sheet date is set with reference tothe interest rate on high-quality corporatebonds (AA rating) that are denominated inthe currency in which the benefits will bepaid, and that have terms to maturityapproximating to the terms of the relatedpension liability.
The vesting period is the period of timebefore an employee is entitled to benefits asa result of age and or service.
The expected return on plan assetsrepresents the expected income from plan assets as at the beginning of the year.
The interest cost represents the increase inthe present value of the plan liabilities asthe benefits are one period closer to beingpaid out. This is a consequence of the ideathat an amount payable today is a biggerburden than the same amount payable inthe future.
Past service costs are the additional coststo the plan when the trustees change theterms of the benefits with respect toprevious years service.
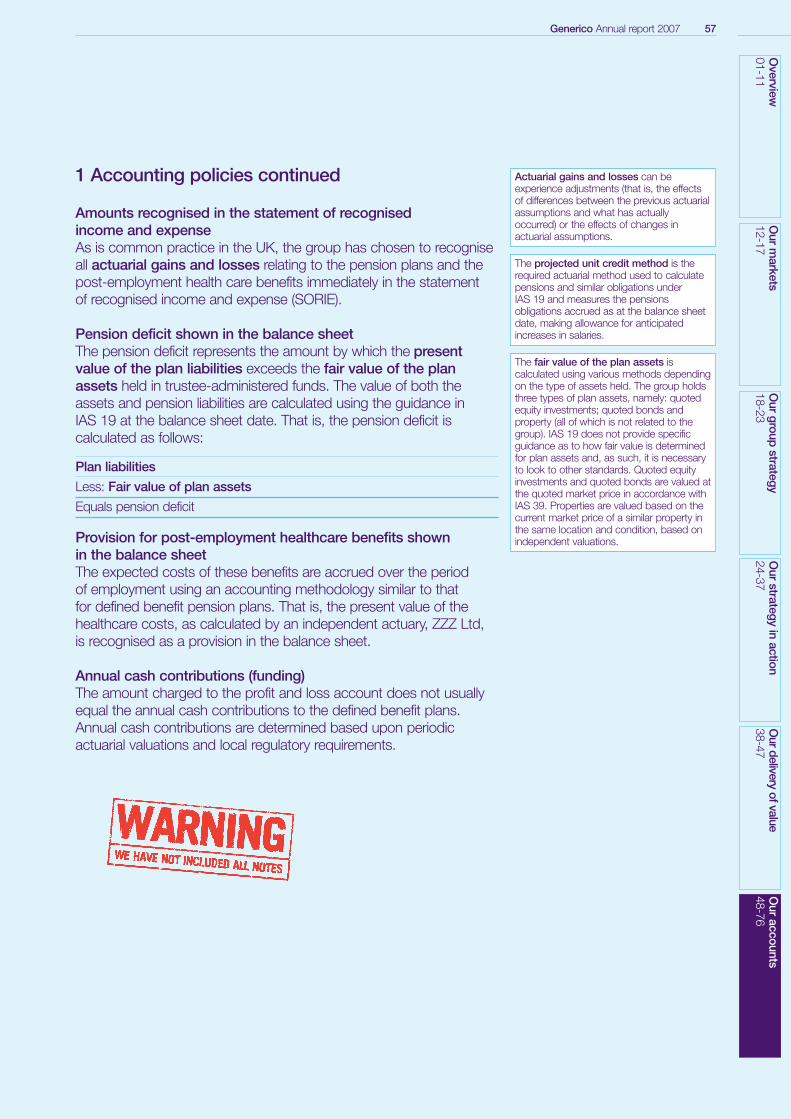
Generico Annual report 2007 57
1 Accounting policies continued
Amounts recognised in the statement of recognised income and expenseAs is common practice in the UK, the group has chosen to recogniseall actuarial gains and losses relating to the pension plans and thepost-employment health care benefits immediately in the statement of recognised income and expense (SORIE).
Pension deficit shown in the balance sheet The pension deficit represents the amount by which the presentvalue of the plan liabilities exceeds the fair value of the planassets held in trustee-administered funds. The value of both theassets and pension liabilities are calculated using the guidance in IAS 19 at the balance sheet date. That is, the pension deficit iscalculated as follows:
Plan liabilities
Less: Fair value of plan assets
Equals pension deficit
Provision for post-employment healthcare benefits shown in the balance sheet The expected costs of these benefits are accrued over the period of employment using an accounting methodology similar to that for defined benefit pension plans. That is, the present value of thehealthcare costs, as calculated by an independent actuary, ZZZ Ltd, is recognised as a provision in the balance sheet.
Annual cash contributions (funding) The amount charged to the profit and loss account does not usuallyequal the annual cash contributions to the defined benefit plans.Annual cash contributions are determined based upon periodicactuarial valuations and local regulatory requirements.
Actuarial gains and losses can beexperience adjustments (that is, the effectsof differences between the previous actuarialassumptions and what has actuallyoccurred) or the effects of changes inactuarial assumptions.
The projected unit credit method is therequired actuarial method used to calculatepensions and similar obligations under IAS 19 and measures the pensionsobligations accrued as at the balance sheetdate, making allowance for anticipatedincreases in salaries.
The fair value of the plan assets iscalculated using various methods dependingon the type of assets held. The group holdsthree types of plan assets, namely: quotedequity investments; quoted bonds andproperty (all of which is not related to thegroup). IAS 19 does not provide specificguidance as to how fair value is determinedfor plan assets and, as such, it is necessaryto look to other standards. Quoted equityinvestments and quoted bonds are valued atthe quoted market price in accordance withIAS 39. Properties are valued based on thecurrent market price of a similar property inthe same location and condition, based onindependent valuations.
Overview
01-11O
urm
arkets12-17
Our
groupstrategy
18-23O
urstrategy
inaction
24-37O
urdeliveryofvalue
38-47O
uraccounts
48-76
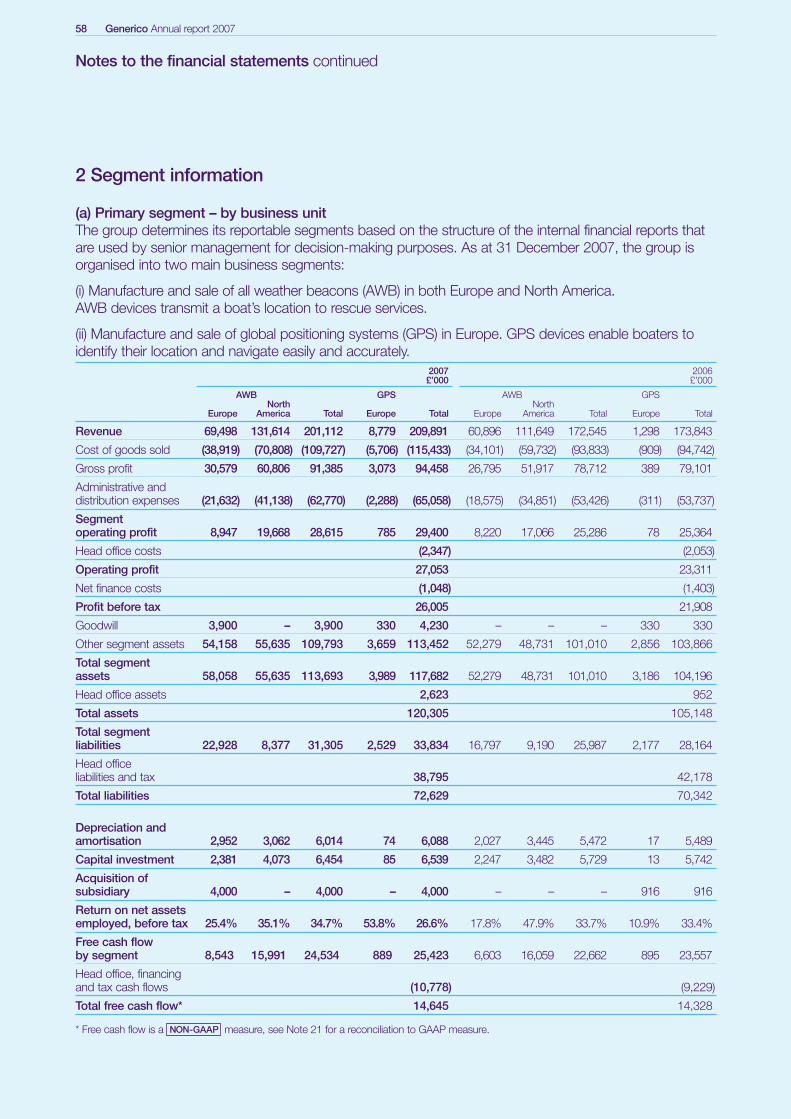
58 Generico Annual report 2007
Notes to the financial statements continued
2 Segment information
(a) Primary segment – by business unitThe group determines its reportable segments based on the structure of the internal financial reports thatare used by senior management for decision-making purposes. As at 31 December 2007, the group isorganised into two main business segments:
(i) Manufacture and sale of all weather beacons (AWB) in both Europe and North America. AWB devices transmit a boat’s location to rescue services.
(ii) Manufacture and sale of global positioning systems (GPS) in Europe. GPS devices enable boaters toidentify their location and navigate easily and accurately.
2007 2006£’000 £’000
AWB GPS AWB GPSNorth North
Europe America Total Europe Total Europe America Total Europe Total
Revenue 69,498 131,614 201,112 8,779 209,891 60,896 111,649 172,545 1,298 173,843
Cost of goods sold (38,919) (70,808) (109,727) (5,706) (115,433) (34,101) (59,732) (93,833) (909) (94,742)
Gross profit 30,579 60,806 91,385 3,073 94,458 26,795 51,917 78,712 389 79,101
Administrative and distribution expenses (21,632) (41,138) (62,770) (2,288) (65,058) (18,575) (34,851) (53,426) (311) (53,737)
Segment operating profit 8,947 19,668 28,615 785 29,400 8,220 17,066 25,286 78 25,364
Head office costs (2,347) (2,053)
Operating profit 27,053 23,311
Net finance costs (1,048) (1,403)
Profit before tax 26,005 21,908
Goodwill 3,900 – 3,900 330 4,230 – – – 330 330
Other segment assets 54,158 55,635 109,793 3,659 113,452 52,279 48,731 101,010 2,856 103,866
Total segment assets 58,058 55,635 113,693 3,989 117,682 52,279 48,731 101,010 3,186 104,196
Head office assets 2,623 952
Total assets 120,305 105,148
Total segment liabilities 22,928 8,377 31,305 2,529 33,834 16,797 9,190 25,987 2,177 28,164
Head office liabilities and tax 38,795 42,178
Total liabilities 72,629 70,342
Depreciation and amortisation 2,952 3,062 6,014 74 6,088 2,027 3,445 5,472 17 5,489
Capital investment 2,381 4,073 6,454 85 6,539 2,247 3,482 5,729 13 5,742
Acquisition of subsidiary 4,000 – 4,000 – 4,000 – – – 916 916
Return on net assets employed, before tax 25.4% 35.1% 34.7% 53.8% 26.6% 17.8% 47.9% 33.7% 10.9% 33.4%
Free cash flow by segment 8,543 15,991 24,534 889 25,423 6,603 16,059 22,662 895 23,557
Head office, financingand tax cash flows (10,778) (9,229)
Total free cash flow* 14,645 14,328
* Free cash flow is a measure, see Note 21 for a reconciliation to GAAP measure.NON-GAAP
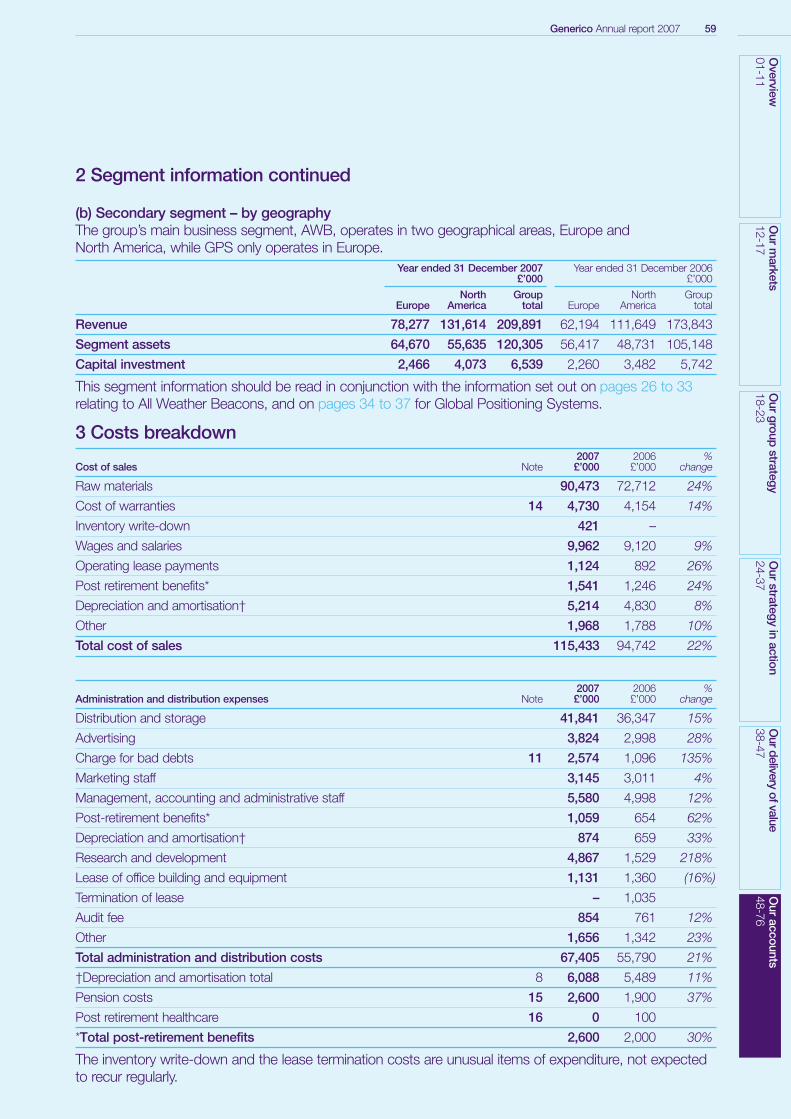
Generico Annual report 2007 59
2 Segment information continued
(b) Secondary segment – by geographyThe group’s main business segment, AWB, operates in two geographical areas, Europe andNorth America, while GPS only operates in Europe.
Year ended 31 December 2007 Year ended 31 December 2006£’000 £’000
North Group North Group Europe America total Europe America total
Revenue 78,277 131,614 209,891 62,194 111,649 173,843
Segment assets 64,670 55,635 120,305 56,417 48,731 105,148
Capital investment 2,466 4,073 6,539 2,260 3,482 5,742
This segment information should be read in conjunction with the information set out on pages 26 to 33relating to All Weather Beacons, and on pages 34 to 37 for Global Positioning Systems.
3 Costs breakdown2007 2006 %
Cost of sales Note £’000 £’000 change
Raw materials 90,473 72,712 24%
Cost of warranties 14 4,730 4,154 14%
Inventory write-down 421 –
Wages and salaries 9,962 9,120 9%
Operating lease payments 1,124 892 26%
Post retirement benefits* 1,541 1,246 24%
Depreciation and amortisation† 5,214 4,830 8%
Other 1,968 1,788 10%
Total cost of sales 115,433 94,742 22%
2007 2006 %Administration and distribution expenses Note £’000 £’000 change
Distribution and storage 41,841 36,347 15%
Advertising 3,824 2,998 28%
Charge for bad debts 11 2,574 1,096 135%
Marketing staff 3,145 3,011 4%
Management, accounting and administrative staff 5,580 4,998 12%
Post-retirement benefits* 1,059 654 62%
Depreciation and amortisation† 874 659 33%
Research and development 4,867 1,529 218%
Lease of office building and equipment 1,131 1,360 (16%)
Termination of lease – 1,035
Audit fee 854 761 12%
Other 1,656 1,342 23%
Total administration and distribution costs 67,405 55,790 21%
†Depreciation and amortisation total 8 6,088 5,489 11%
Pension costs 15 2,600 1,900 37%
Post retirement healthcare 16 0 100
*Total post-retirement benefits 2,600 2,000 30%
The inventory write-down and the lease termination costs are unusual items of expenditure, not expectedto recur regularly.
Overview
01-11O
urm
arkets12-17
Our
groupstrategy
18-23O
urstrategy
inaction
24-37O
urdeliveryofvalue
38-47O
uraccounts
48-76
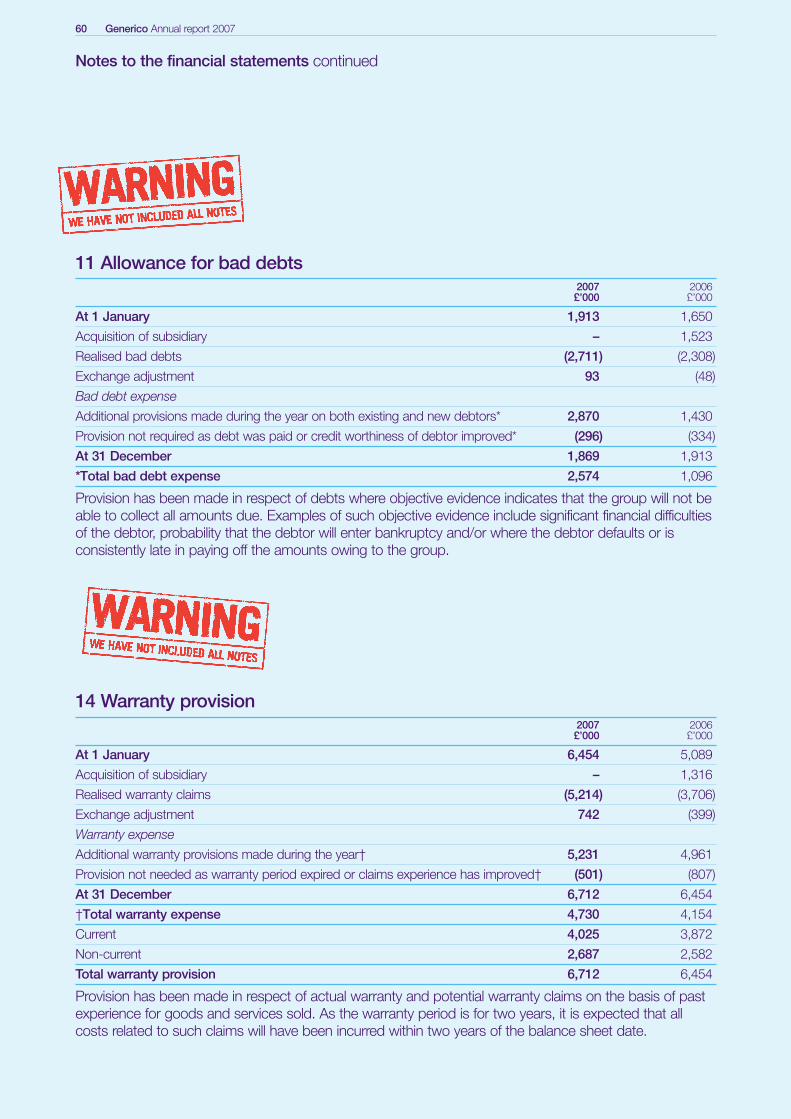
60 Generico Annual report 2007
Notes to the financial statements continued
11 Allowance for bad debts 2007 2006£’000 £’000
At 1 January 1,913 1,650
Acquisition of subsidiary – 1,523
Realised bad debts (2,711) (2,308)
Exchange adjustment 93 (48)
Bad debt expense
Additional provisions made during the year on both existing and new debtors* 2,870 1,430
Provision not required as debt was paid or credit worthiness of debtor improved* (296) (334)
At 31 December 1,869 1,913
*Total bad debt expense 2,574 1,096
Provision has been made in respect of debts where objective evidence indicates that the group will not beable to collect all amounts due. Examples of such objective evidence include significant financial difficultiesof the debtor, probability that the debtor will enter bankruptcy and/or where the debtor defaults or isconsistently late in paying off the amounts owing to the group.
14 Warranty provision 2007 2006£’000 £’000
At 1 January 6,454 5,089
Acquisition of subsidiary – 1,316
Realised warranty claims (5,214) (3,706)
Exchange adjustment 742 (399)
Warranty expense
Additional warranty provisions made during the year† 5,231 4,961
Provision not needed as warranty period expired or claims experience has improved† (501) (807)
At 31 December 6,712 6,454
†Total warranty expense 4,730 4,154
Current 4,025 3,872
Non-current 2,687 2,582
Total warranty provision 6,712 6,454
Provision has been made in respect of actual warranty and potential warranty claims on the basis of pastexperience for goods and services sold. As the warranty period is for two years, it is expected that allcosts related to such claims will have been incurred within two years of the balance sheet date.
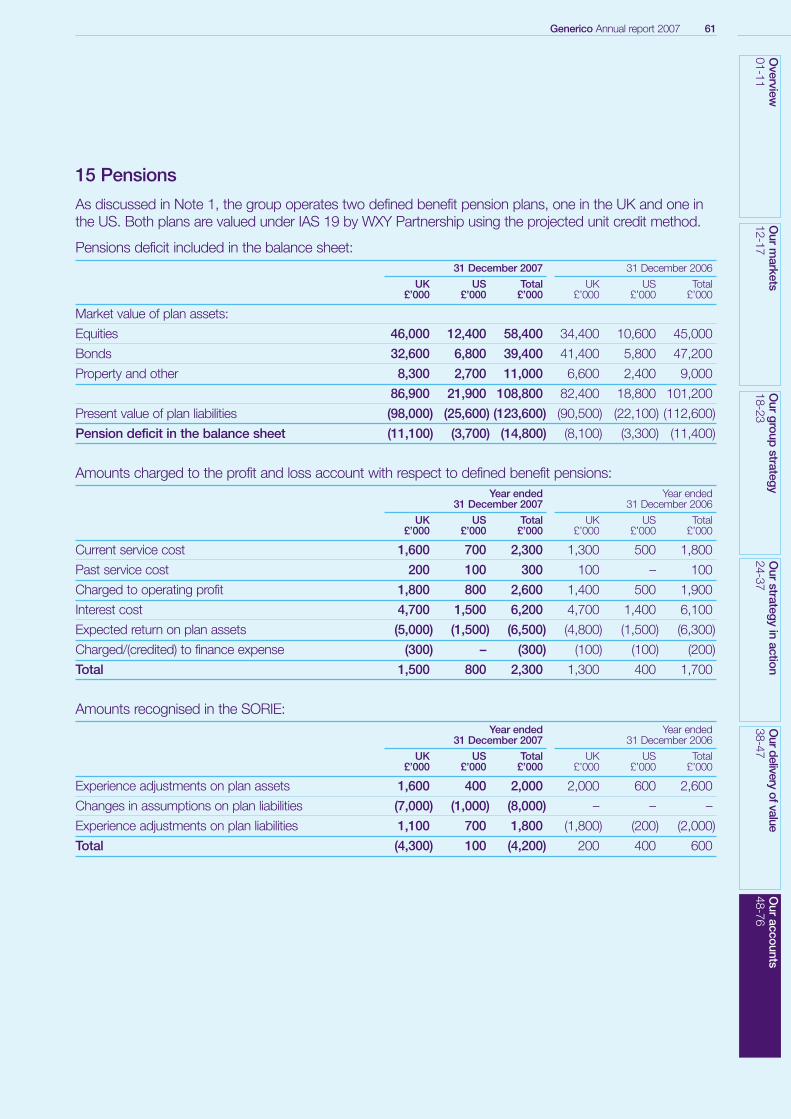
Generico Annual report 2007 61O
verview01-11
Our
markets
12-17O
urgroup
strategy18-23
Our
strategyin
action24-37
Ourdelivery
ofvalue38-47
Our
accounts48-76
15 Pensions
As discussed in Note 1, the group operates two defined benefit pension plans, one in the UK and one inthe US. Both plans are valued under IAS 19 by WXY Partnership using the projected unit credit method.
Pensions deficit included in the balance sheet:31 December 2007 31 December 2006
UK US Total UK US Total £’000 £’000 £’000 £’000 £’000 £’000
Market value of plan assets:
Equities 46,000 12,400 58,400 34,400 10,600 45,000
Bonds 32,600 6,800 39,400 41,400 5,800 47,200
Property and other 8,300 2,700 11,000 6,600 2,400 9,000
86,900 21,900 108,800 82,400 18,800 101,200
Present value of plan liabilities (98,000) (25,600) (123,600) (90,500) (22,100) (112,600)
Pension deficit in the balance sheet (11,100) (3,700) (14,800) (8,100) (3,300) (11,400)
Amounts charged to the profit and loss account with respect to defined benefit pensions:Year ended Year ended
31 December 2007 31 December 2006
UK US Total UK US Total £’000 £’000 £’000 £’000 £’000 £’000
Current service cost 1,600 700 2,300 1,300 500 1,800
Past service cost 200 100 300 100 – 100
Charged to operating profit 1,800 800 2,600 1,400 500 1,900
Interest cost 4,700 1,500 6,200 4,700 1,400 6,100
Expected return on plan assets (5,000) (1,500) (6,500) (4,800) (1,500) (6,300)
Charged/(credited) to finance expense (300) – (300) (100) (100) (200)
Total 1,500 800 2,300 1,300 400 1,700
Amounts recognised in the SORIE:Year ended Year ended
31 December 2007 31 December 2006
UK US Total UK US Total £’000 £’000 £’000 £’000 £’000 £’000
Experience adjustments on plan assets 1,600 400 2,000 2,000 600 2,600
Changes in assumptions on plan liabilities (7,000) (1,000) (8,000) – – –
Experience adjustments on plan liabilities 1,100 700 1,800 (1,800) (200) (2,000)
Total (4,300) 100 (4,200) 200 400 600
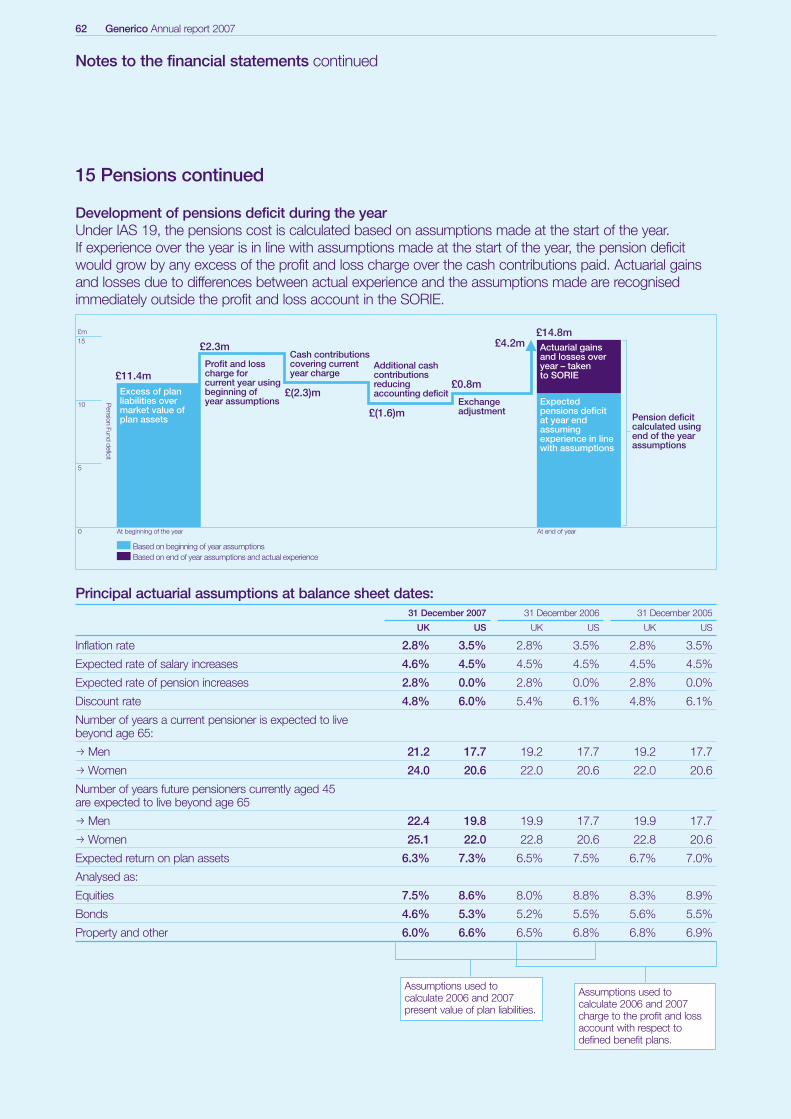
62 Generico Annual report 2007
Notes to the financial statements continued
15 Pensions continued
Development of pensions deficit during the yearUnder IAS 19, the pensions cost is calculated based on assumptions made at the start of the year. If experience over the year is in line with assumptions made at the start of the year, the pension deficitwould grow by any excess of the profit and loss charge over the cash contributions paid. Actuarial gainsand losses due to differences between actual experience and the assumptions made are recognisedimmediately outside the profit and loss account in the SORIE.
Principal actuarial assumptions at balance sheet dates:31 December 2007 31 December 2006 31 December 2005
UK US UK US UK US
Inflation rate 2.8% 3.5% 2.8% 3.5% 2.8% 3.5%
Expected rate of salary increases 4.6% 4.5% 4.5% 4.5% 4.5% 4.5%
Expected rate of pension increases 2.8% 0.0% 2.8% 0.0% 2.8% 0.0%
Discount rate 4.8% 6.0% 5.4% 6.1% 4.8% 6.1%
Number of years a current pensioner is expected to live beyond age 65:
p Men 21.2 17.7 19.2 17.7 19.2 17.7
p Women 24.0 20.6 22.0 20.6 22.0 20.6
Number of years future pensioners currently aged 45 are expected to live beyond age 65
p Men 22.4 19.8 19.9 17.7 19.9 17.7
p Women 25.1 22.0 22.8 20.6 22.8 20.6
Expected return on plan assets 6.3% 7.3% 6.5% 7.5% 6.7% 7.0%
Analysed as:
Equities 7.5% 8.6% 8.0% 8.8% 8.3% 8.9%
Bonds 4.6% 5.3% 5.2% 5.5% 5.6% 5.5%
Property and other 6.0% 6.6% 6.5% 6.8% 6.8% 6.9%
Assumptions used tocalculate 2006 and 2007present value of plan liabilities.
Assumptions used tocalculate 2006 and 2007charge to the profit and lossaccount with respect todefined benefit plans.
Based on beginning of year assumptionsBased on end of year assumptions and actual experience
15£m
10
5
0 At beginning of the year
Pension
Funddeficit
At end of year
Excess of plan liabilities over market value of plan assets
£11.4m
Expected pensions deficit at year end assuming experience in line with assumptions
Actuarial gains and losses over year – taken to SORIE
Profit and loss charge for current year using beginning of year assumptions
£2.3mCash contributions covering current year charge
Additional cash contributions reducing accounting deficit
Exchange adjustment
Pension deficit calculated using end of the year assumptions
£(2.3)m
£(1.6)m
£0.8m
£14.8m£4.2m
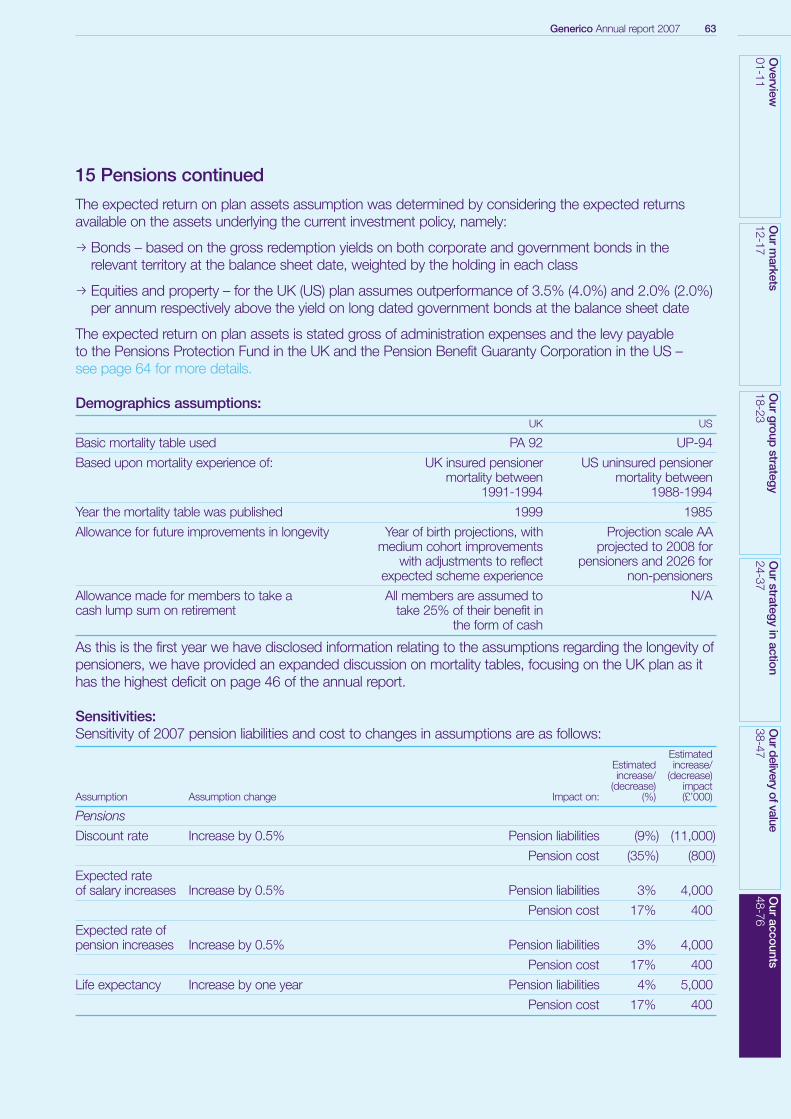
Generico Annual report 2007 63O
verview01-11
Our
markets
12-17O
urgroup
strategy18-23
Our
strategyin
action24-37
Ourdelivery
ofvalue38-47
Our
accounts48-76
15 Pensions continued
The expected return on plan assets assumption was determined by considering the expected returnsavailable on the assets underlying the current investment policy, namely:
p Bonds – based on the gross redemption yields on both corporate and government bonds in therelevant territory at the balance sheet date, weighted by the holding in each class
p Equities and property – for the UK (US) plan assumes outperformance of 3.5% (4.0%) and 2.0% (2.0%)per annum respectively above the yield on long dated government bonds at the balance sheet date
The expected return on plan assets is stated gross of administration expenses and the levy payable to the Pensions Protection Fund in the UK and the Pension Benefit Guaranty Corporation in the US – see page 64 for more details.
Demographics assumptions:UK US
Basic mortality table used PA 92 UP-94
Based upon mortality experience of: UK insured pensioner US uninsured pensioner mortality between mortality between
1991-1994 1988-1994
Year the mortality table was published 1999 1985
Allowance for future improvements in longevity Year of birth projections, with Projection scale AA medium cohort improvements projected to 2008 for
with adjustments to reflect pensioners and 2026 forexpected scheme experience non-pensioners
Allowance made for members to take a All members are assumed to N/Acash lump sum on retirement take 25% of their benefit in
the form of cash
As this is the first year we have disclosed information relating to the assumptions regarding the longevity ofpensioners, we have provided an expanded discussion on mortality tables, focusing on the UK plan as ithas the highest deficit on page 46 of the annual report.
Sensitivities:Sensitivity of 2007 pension liabilities and cost to changes in assumptions are as follows:
Estimated Estimated increase/increase/ (decrease)
(decrease) impact Assumption Assumption change Impact on: (%) (£’000)
Pensions
Discount rate Increase by 0.5% Pension liabilities (9%) (11,000)
Pension cost (35%) (800)
Expected rate of salary increases Increase by 0.5% Pension liabilities 3% 4,000
Pension cost 17% 400
Expected rate of pension increases Increase by 0.5% Pension liabilities 3% 4,000
Pension cost 17% 400
Life expectancy Increase by one year Pension liabilities 4% 5,000
Pension cost 17% 400
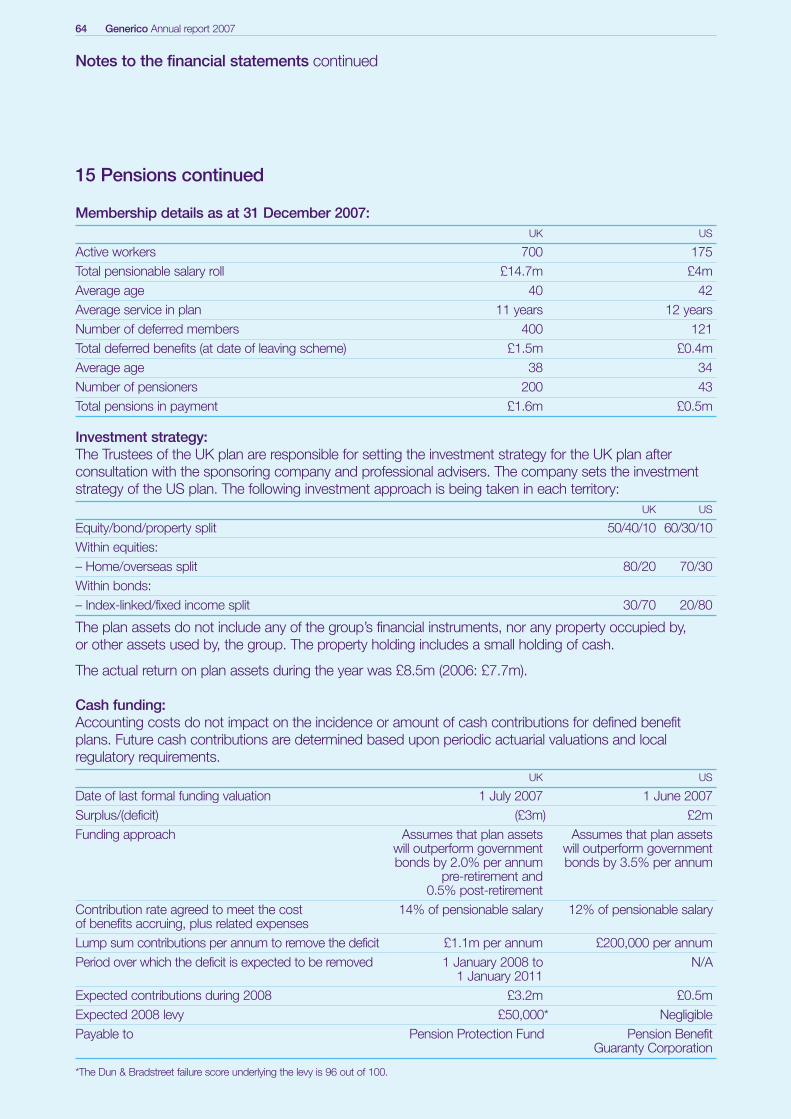
64 Generico Annual report 2007
Notes to the financial statements continued
15 Pensions continued
Membership details as at 31 December 2007:UK US
Active workers 700 175Total pensionable salary roll £14.7m £4mAverage age 40 42Average service in plan 11 years 12 yearsNumber of deferred members 400 121Total deferred benefits (at date of leaving scheme) £1.5m £0.4mAverage age 38 34Number of pensioners 200 43Total pensions in payment £1.6m £0.5m
Investment strategy:The Trustees of the UK plan are responsible for setting the investment strategy for the UK plan afterconsultation with the sponsoring company and professional advisers. The company sets the investmentstrategy of the US plan. The following investment approach is being taken in each territory:
UK US
Equity/bond/property split 50/40/10 60/30/10Within equities:– Home/overseas split 80/20 70/30Within bonds:– Index-linked/fixed income split 30/70 20/80
The plan assets do not include any of the group’s financial instruments, nor any property occupied by, or other assets used by, the group. The property holding includes a small holding of cash.
The actual return on plan assets during the year was £8.5m (2006: £7.7m).
Cash funding:Accounting costs do not impact on the incidence or amount of cash contributions for defined benefitplans. Future cash contributions are determined based upon periodic actuarial valuations and local regulatory requirements.
UK US
Date of last formal funding valuation 1 July 2007 1 June 2007Surplus/(deficit) (£3m) £2mFunding approach Assumes that plan assets Assumes that plan assets
will outperform government will outperform governmentbonds by 2.0% per annum bonds by 3.5% per annum
pre-retirement and 0.5% post-retirement
Contribution rate agreed to meet the cost 14% of pensionable salary 12% of pensionable salaryof benefits accruing, plus related expensesLump sum contributions per annum to remove the deficit £1.1m per annum £200,000 per annumPeriod over which the deficit is expected to be removed 1 January 2008 to N/A
1 January 2011Expected contributions during 2008 £3.2m £0.5mExpected 2008 levy £50,000* NegligiblePayable to Pension Protection Fund Pension Benefit
Guaranty Corporation
*The Dun & Bradstreet failure score underlying the levy is 96 out of 100.
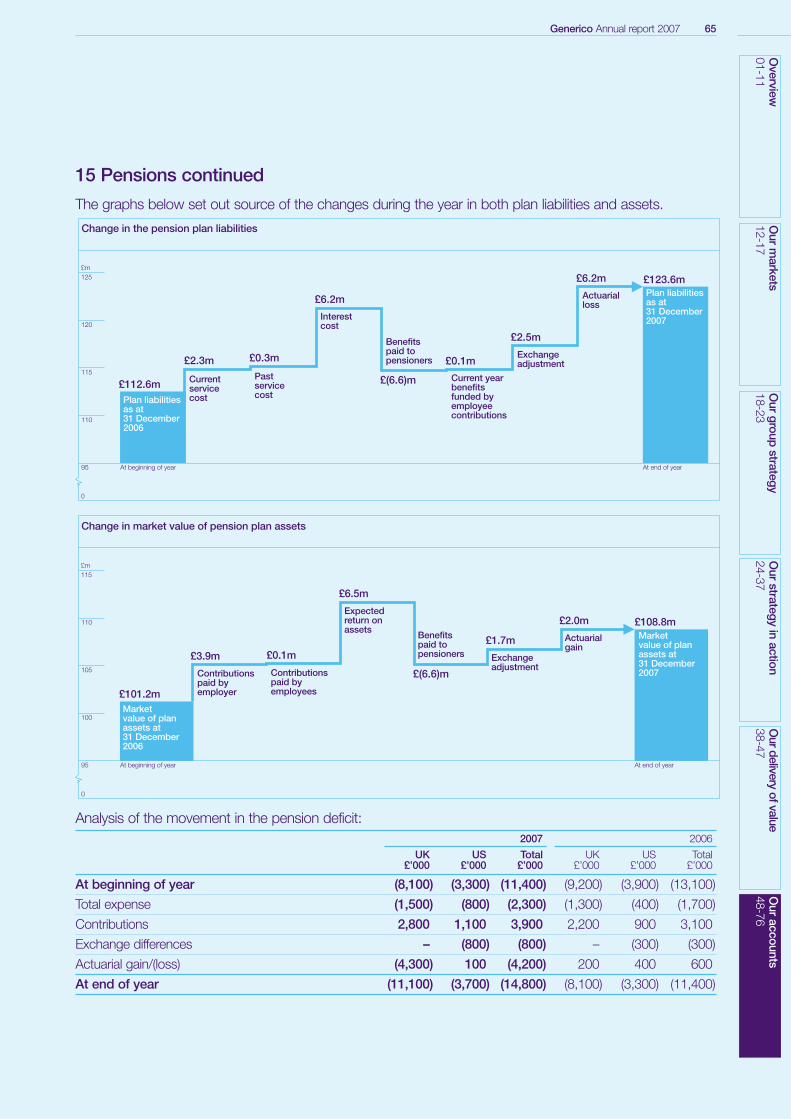
15 Pensions continued
The graphs below set out source of the changes during the year in both plan liabilities and assets.
Analysis of the movement in the pension deficit:2007 2006
UK US Total UK US Total £’000 £’000 £’000 £’000 £’000 £’000
At beginning of year (8,100) (3,300) (11,400) (9,200) (3,900) (13,100)
Total expense (1,500) (800) (2,300) (1,300) (400) (1,700)
Contributions 2,800 1,100 3,900 2,200 900 3,100
Exchange differences – (800) (800) – (300) (300)
Actuarial gain/(loss) (4,300) 100 (4,200) 200 400 600
At end of year (11,100) (3,700) (14,800) (8,100) (3,300) (11,400)
Generico Annual report 2007 65O
verview01-11
Our
markets
12-17O
urgroup
strategy18-23
Our
strategyin
action24-37
Ourdelivery
ofvalue38-47
Our
accounts48-76
Change in market value of pension plan assets
115£m
110
105
100
95 At beginning of year At end of year
Market value of plan assets at 31 December2006
Contributionspaid byemployer£101.2m
£3.9m £0.1m
£6.5m
£(6.6)m
£1.7m
£2.0m £108.8m
Contributionspaid byemployees
Expectedreturn onassets
Benefitspaid topensioners Exchange
adjustment
Actuarialgain
Market value of planassets at31 December2007
0
Change in the pension plan liabilities
125£m
120
115
110
95 At beginning of year At end of year
Plan liabilitiesas at 31 December2006
Current service cost
£112.6m
£2.3m £0.3m
£6.2m
£(6.6)m
£0.1m
£2.5m
£6.2m £123.6m
Past servicecost
Interest cost
Benefitspaid topensioners
Current year benefits funded by employee contributions
Exchangeadjustment
Actuarialloss
Plan liabilitiesas at 31 December2007
0
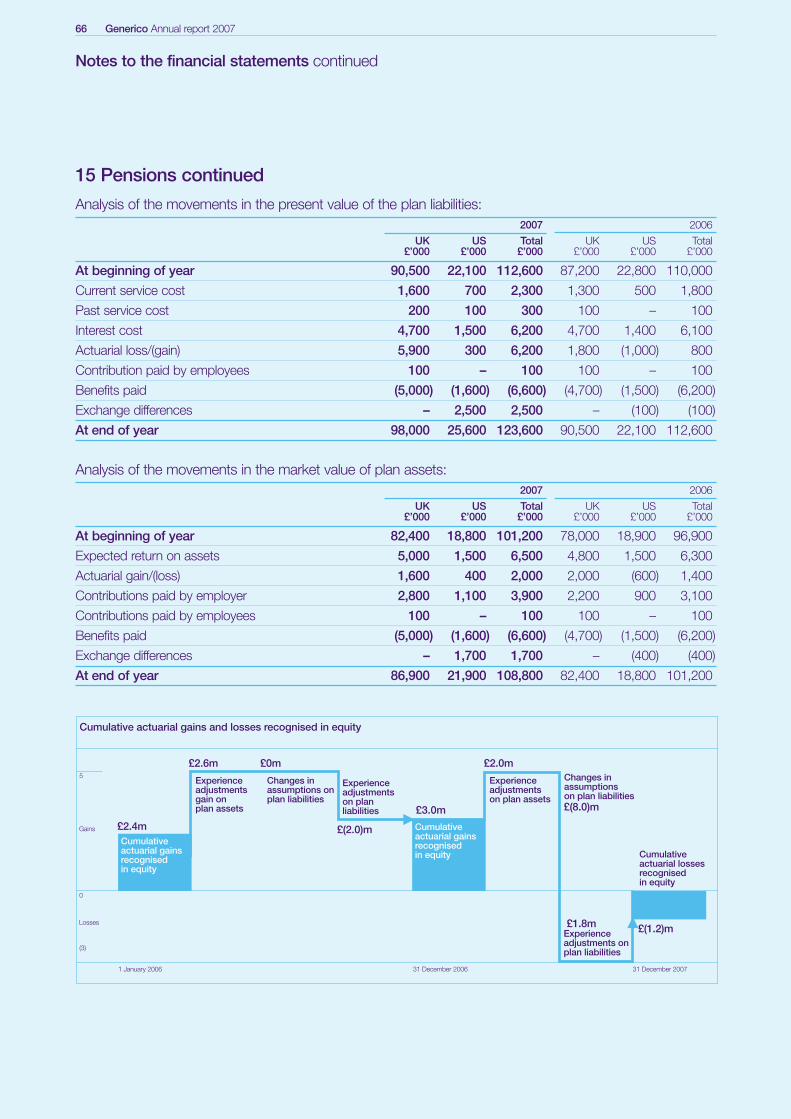
66 Generico Annual report 2007
Notes to the financial statements continued
15 Pensions continued
Analysis of the movements in the present value of the plan liabilities:2007 2006
UK US Total UK US Total £’000 £’000 £’000 £’000 £’000 £’000
At beginning of year 90,500 22,100 112,600 87,200 22,800 110,000
Current service cost 1,600 700 2,300 1,300 500 1,800
Past service cost 200 100 300 100 – 100
Interest cost 4,700 1,500 6,200 4,700 1,400 6,100
Actuarial loss/(gain) 5,900 300 6,200 1,800 (1,000) 800
Contribution paid by employees 100 – 100 100 – 100
Benefits paid (5,000) (1,600) (6,600) (4,700) (1,500) (6,200)
Exchange differences – 2,500 2,500 – (100) (100)
At end of year 98,000 25,600 123,600 90,500 22,100 112,600
Analysis of the movements in the market value of plan assets:2007 2006
UK US Total UK US Total £’000 £’000 £’000 £’000 £’000 £’000
At beginning of year 82,400 18,800 101,200 78,000 18,900 96,900
Expected return on assets 5,000 1,500 6,500 4,800 1,500 6,300
Actuarial gain/(loss) 1,600 400 2,000 2,000 (600) 1,400
Contributions paid by employer 2,800 1,100 3,900 2,200 900 3,100
Contributions paid by employees 100 – 100 100 – 100
Benefits paid (5,000) (1,600) (6,600) (4,700) (1,500) (6,200)
Exchange differences – 1,700 1,700 – (400) (400)
At end of year 86,900 21,900 108,800 82,400 18,800 101,200
Cumulative actuarial gains and losses recognised in equity
Gains
Losses
0
5
(3)
1 January 2006 31 December 2006 31 December 2007
Cumulative actuarial gains recognised in equity
Cumulative actuarial gains recognised in equity
Experience adjustments gain on plan assets
£2.4m
£2.6m
Changes in assumptions on plan liabilities
£0m
£(2.0)m
£3.0m
£2.0m
£1.8m
£(8.0)m
£(1.2)m
Experience adjustments on plan liabilities
Experience adjustments on plan assets
Changes in assumptions on plan liabilities
Experience adjustments on plan liabilities
Cumulative actuarial losses recognised in equity
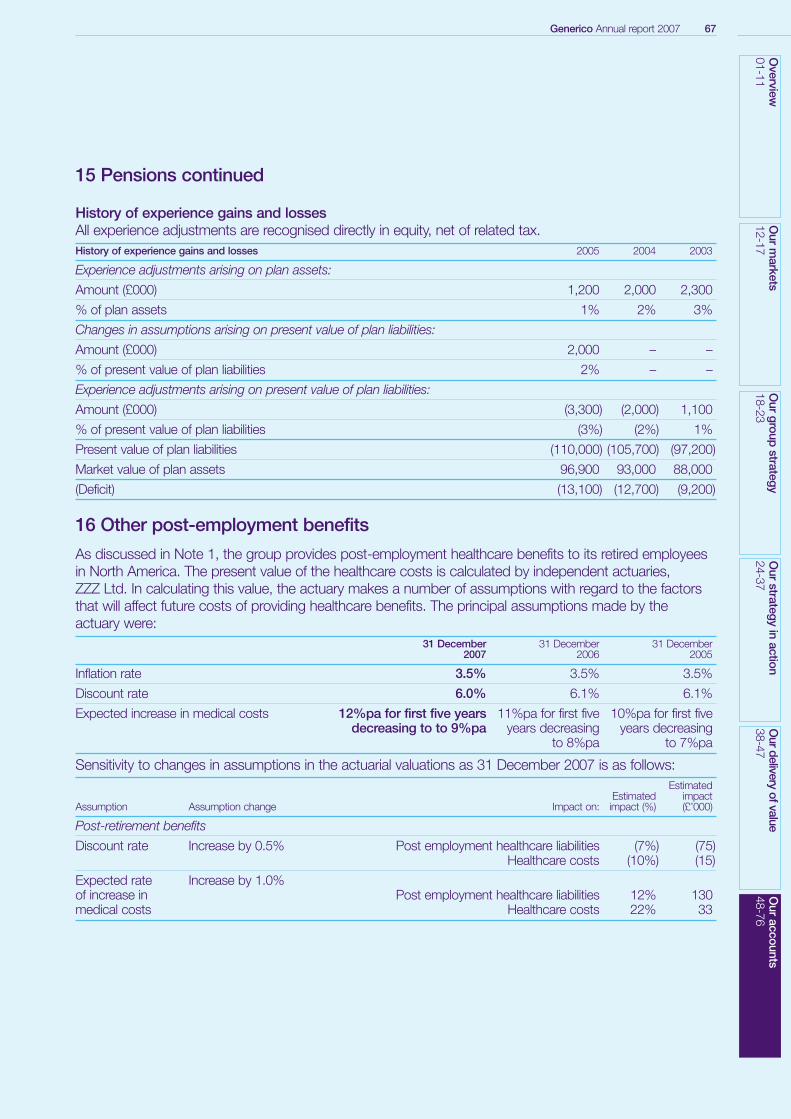
Generico Annual report 2007 67O
verview01-11
Our
markets
12-17O
urgroup
strategy18-23
Our
strategyin
action24-37
Ourdelivery
ofvalue38-47
Our
accounts48-76
15 Pensions continued
History of experience gains and lossesAll experience adjustments are recognised directly in equity, net of related tax.History of experience gains and losses 2005 2004 2003
Experience adjustments arising on plan assets:
Amount (£000) 1,200 2,000 2,300
% of plan assets 1% 2% 3%
Changes in assumptions arising on present value of plan liabilities:
Amount (£000) 2,000 – –
% of present value of plan liabilities 2% – –
Experience adjustments arising on present value of plan liabilities:
Amount (£000) (3,300) (2,000) 1,100
% of present value of plan liabilities (3%) (2%) 1%
Present value of plan liabilities (110,000) (105,700) (97,200)
Market value of plan assets 96,900 93,000 88,000
(Deficit) (13,100) (12,700) (9,200)
16 Other post-employment benefits
As discussed in Note 1, the group provides post-employment healthcare benefits to its retired employeesin North America. The present value of the healthcare costs is calculated by independent actuaries, ZZZ Ltd. In calculating this value, the actuary makes a number of assumptions with regard to the factorsthat will affect future costs of providing healthcare benefits. The principal assumptions made by the actuary were:
31 December 31 December 31 December 2007 2006 2005
Inflation rate 3.5% 3.5% 3.5%
Discount rate 6.0% 6.1% 6.1%
Expected increase in medical costs 12%pa for first five years 11%pa for first five 10%pa for first fivedecreasing to to 9%pa years decreasing years decreasing
to 8%pa to 7%pa
Sensitivity to changes in assumptions in the actuarial valuations as 31 December 2007 is as follows:Estimated
Estimated impact Assumption Assumption change Impact on: impact (%) (£’000)
Post-retirement benefits
Discount rate Increase by 0.5% Post employment healthcare liabilities (7%) (75)Healthcare costs (10%) (15)
Expected rate Increase by 1.0%of increase in Post employment healthcare liabilities 12% 130medical costs Healthcare costs 22% 33
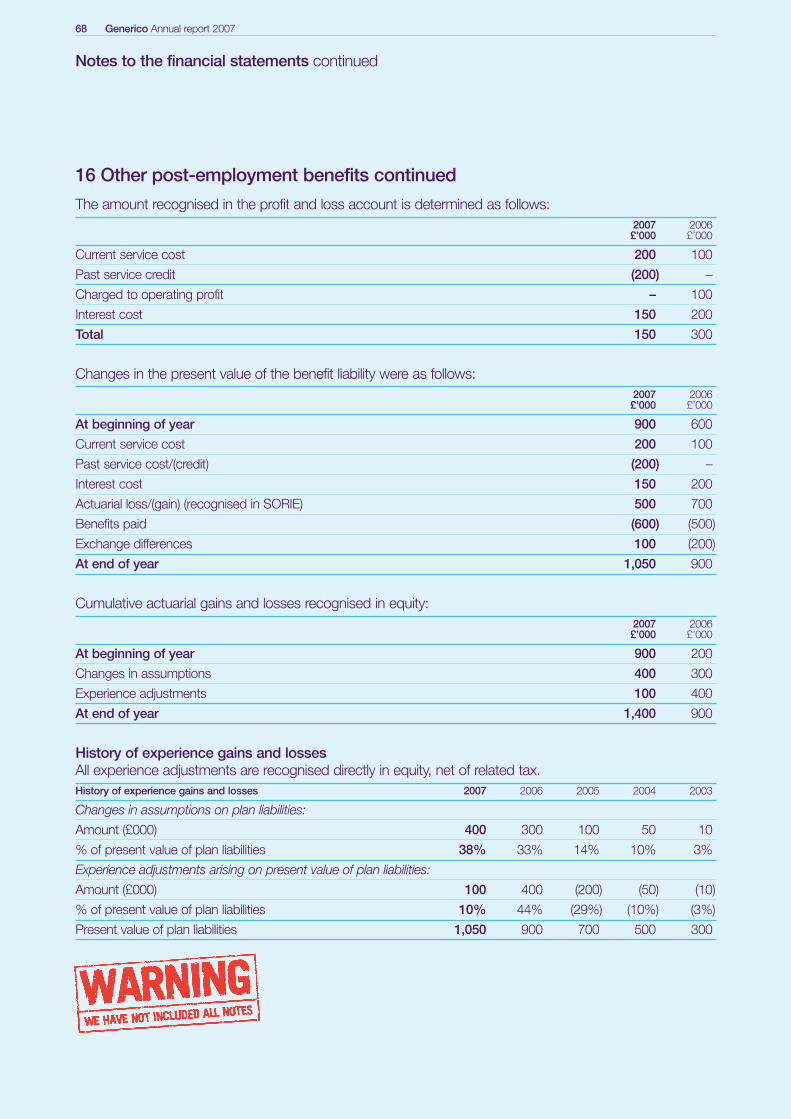
68 Generico Annual report 2007
Notes to the financial statements continued
16 Other post-employment benefits continued
The amount recognised in the profit and loss account is determined as follows:2007 2006£’000 £’000
Current service cost 200 100
Past service credit (200) –
Charged to operating profit – 100
Interest cost 150 200
Total 150 300
Changes in the present value of the benefit liability were as follows:2007 2006£’000 £’000
At beginning of year 900 600
Current service cost 200 100
Past service cost/(credit) (200) –
Interest cost 150 200
Actuarial loss/(gain) (recognised in SORIE) 500 700
Benefits paid (600) (500)
Exchange differences 100 (200)
At end of year 1,050 900
Cumulative actuarial gains and losses recognised in equity:2007 2006£’000 £’000
At beginning of year 900 200
Changes in assumptions 400 300
Experience adjustments 100 400
At end of year 1,400 900
History of experience gains and lossesAll experience adjustments are recognised directly in equity, net of related tax.History of experience gains and losses 2007 2006 2005 2004 2003
Changes in assumptions on plan liabilities:
Amount (£000) 400 300 100 50 10
% of present value of plan liabilities 38% 33% 14% 10% 3%
Experience adjustments arising on present value of plan liabilities:
Amount (£000) 100 400 (200) (50) (10)
% of present value of plan liabilities 10% 44% (29%) (10%) (3%)
Present value of plan liabilities 1,050 900 700 500 300
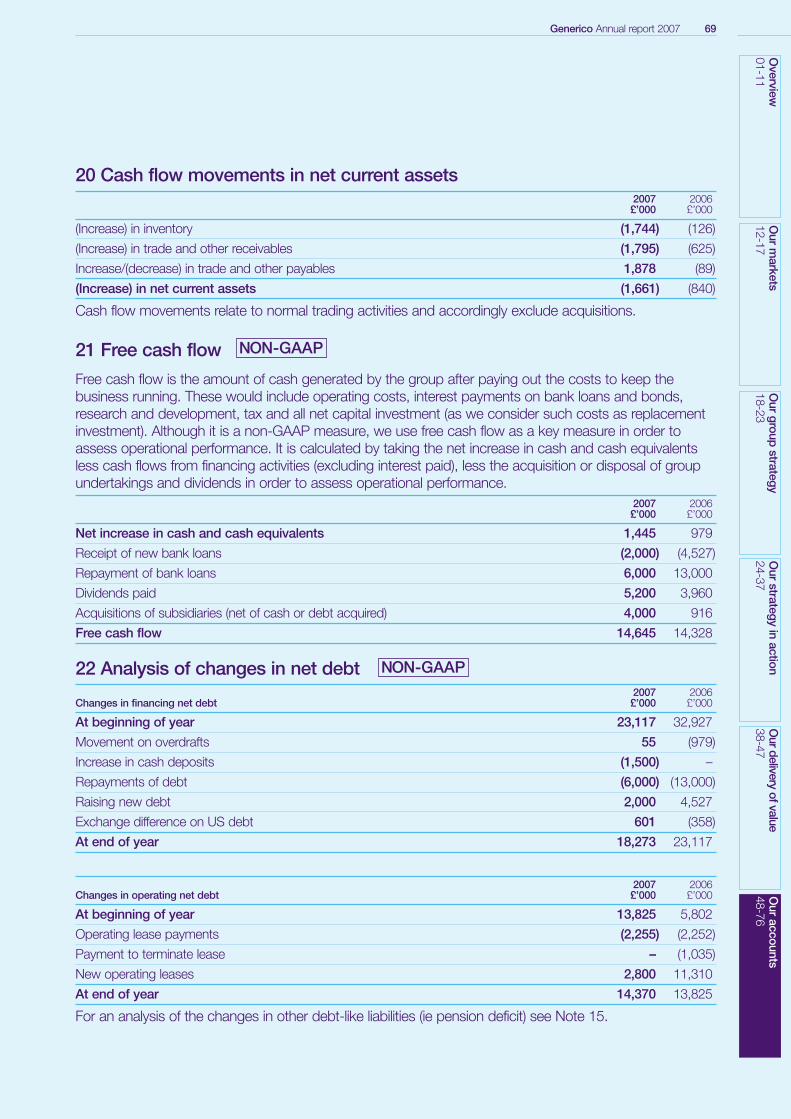
Generico Annual report 2007 69O
verview01-11
Our
markets
12-17O
urgroup
strategy18-23
Our
strategyin
action24-37
Ourdelivery
ofvalue38-47
Our
accounts48-76
20 Cash flow movements in net current assets2007 2006£’000 £’000
(Increase) in inventory (1,744) (126)
(Increase) in trade and other receivables (1,795) (625)
Increase/(decrease) in trade and other payables 1,878 (89)
(Increase) in net current assets (1,661) (840)
Cash flow movements relate to normal trading activities and accordingly exclude acquisitions.
21 Free cash flow
Free cash flow is the amount of cash generated by the group after paying out the costs to keep thebusiness running. These would include operating costs, interest payments on bank loans and bonds,research and development, tax and all net capital investment (as we consider such costs as replacementinvestment). Although it is a non-GAAP measure, we use free cash flow as a key measure in order toassess operational performance. It is calculated by taking the net increase in cash and cash equivalentsless cash flows from financing activities (excluding interest paid), less the acquisition or disposal of groupundertakings and dividends in order to assess operational performance.
2007 2006£’000 £’000
Net increase in cash and cash equivalents 1,445 979
Receipt of new bank loans (2,000) (4,527)
Repayment of bank loans 6,000 13,000
Dividends paid 5,200 3,960
Acquisitions of subsidiaries (net of cash or debt acquired) 4,000 916
Free cash flow 14,645 14,328
22 Analysis of changes in net debt2007 2006
Changes in financing net debt £’000 £’000
At beginning of year 23,117 32,927
Movement on overdrafts 55 (979)
Increase in cash deposits (1,500) –
Repayments of debt (6,000) (13,000)
Raising new debt 2,000 4,527
Exchange difference on US debt 601 (358)
At end of year 18,273 23,117
2007 2006Changes in operating net debt £’000 £’000
At beginning of year 13,825 5,802
Operating lease payments (2,255) (2,252)
Payment to terminate lease – (1,035)
New operating leases 2,800 11,310
At end of year 14,370 13,825
For an analysis of the changes in other debt-like liabilities (ie pension deficit) see Note 15.
NON-GAAP
NON-GAAP
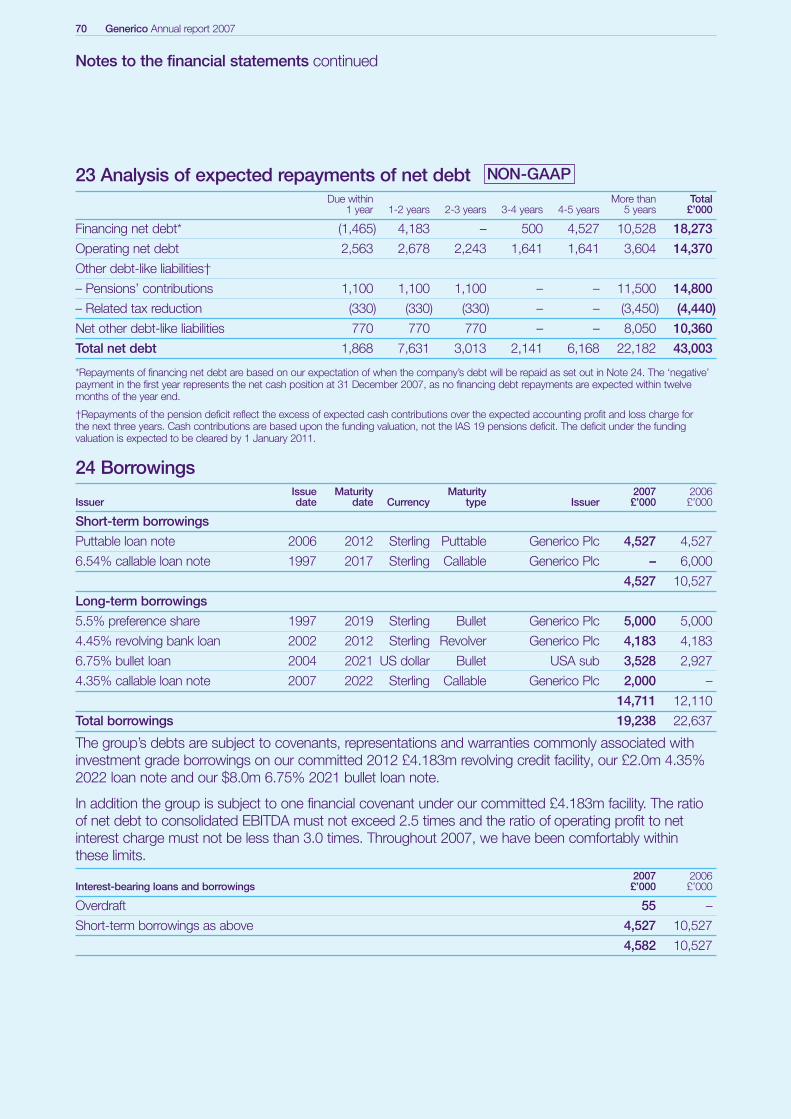
70 Generico Annual report 2007
Notes to the financial statements continued
23 Analysis of expected repayments of net debtDue within More than Total
1 year 1-2 years 2-3 years 3-4 years 4-5 years 5 years £’000
Financing net debt* (1,465) 4,183 – 500 4,527 10,528 18,273
Operating net debt 2,563 2,678 2,243 1,641 1,641 3,604 14,370
Other debt-like liabilities†
– Pensions’ contributions 1,100 1,100 1,100 – – 11,500 14,800
– Related tax reduction (330) (330) (330) – – (3,450) (4,440)
Net other debt-like liabilities 770 770 770 – – 8,050 10,360
Total net debt 1,868 7,631 3,013 2,141 6,168 22,182 43,003
*Repayments of financing net debt are based on our expectation of when the company’s debt will be repaid as set out in Note 24. The ‘negative’payment in the first year represents the net cash position at 31 December 2007, as no financing debt repayments are expected within twelvemonths of the year end.
†Repayments of the pension deficit reflect the excess of expected cash contributions over the expected accounting profit and loss charge for the next three years. Cash contributions are based upon the funding valuation, not the IAS 19 pensions deficit. The deficit under the fundingvaluation is expected to be cleared by 1 January 2011.
24 BorrowingsIssue Maturity Maturity 2007 2006
Issuer date date Currency type Issuer £’000 £’000
Short-term borrowings
Puttable loan note 2006 2012 Sterling Puttable Generico Plc 4,527 4,527
6.54% callable loan note 1997 2017 Sterling Callable Generico Plc – 6,000
4,527 10,527
Long-term borrowings
5.5% preference share 1997 2019 Sterling Bullet Generico Plc 5,000 5,000
4.45% revolving bank loan 2002 2012 Sterling Revolver Generico Plc 4,183 4,183
6.75% bullet loan 2004 2021 US dollar Bullet USA sub 3,528 2,927
4.35% callable loan note 2007 2022 Sterling Callable Generico Plc 2,000 –
14,711 12,110
Total borrowings 19,238 22,637
The group’s debts are subject to covenants, representations and warranties commonly associated withinvestment grade borrowings on our committed 2012 £4.183m revolving credit facility, our £2.0m 4.35%2022 loan note and our $8.0m 6.75% 2021 bullet loan note.
In addition the group is subject to one financial covenant under our committed £4.183m facility. The ratio of net debt to consolidated EBITDA must not exceed 2.5 times and the ratio of operating profit to netinterest charge must not be less than 3.0 times. Throughout 2007, we have been comfortably within these limits.
2007 2006Interest-bearing loans and borrowings £’000 £’000
Overdraft 55 –
Short-term borrowings as above 4,527 10,527
4,582 10,527
NON-GAAP
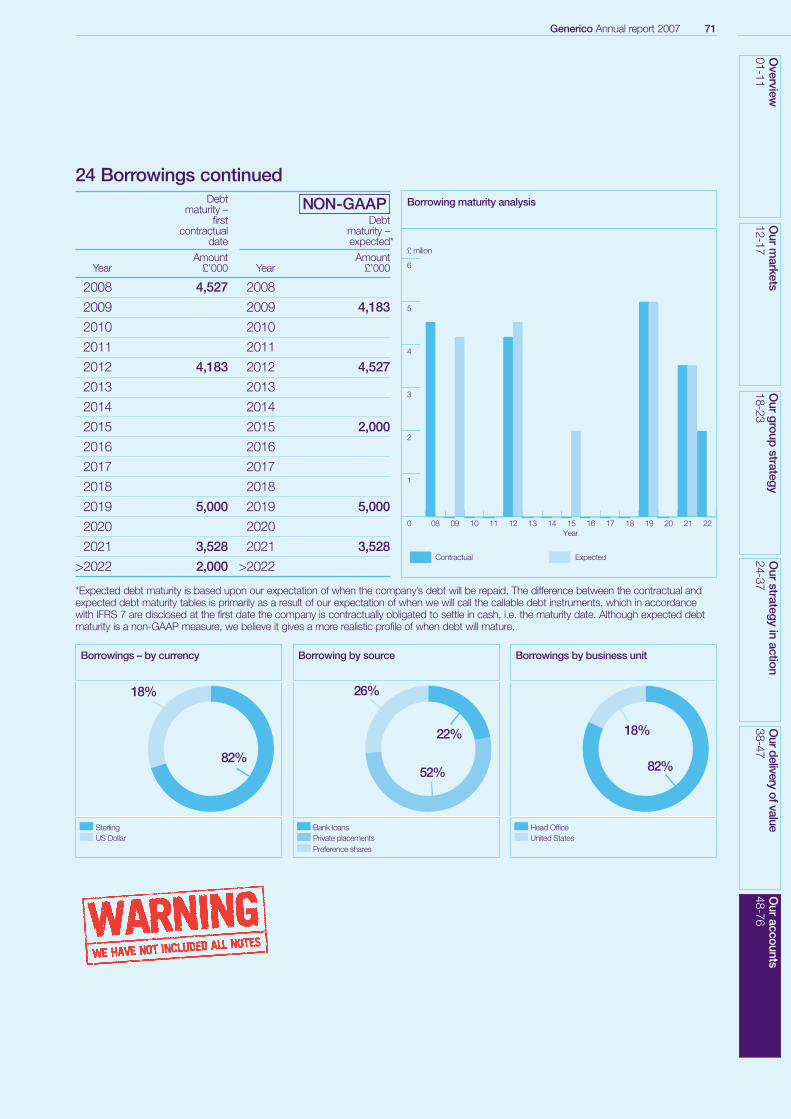
Generico Annual report 2007 71O
verview01-11
Our
markets
12-17O
urgroup
strategy18-23
Our
strategyin
action24-37
Ourdelivery
ofvalue38-47
Our
accounts48-76
24 Borrowings continuedDebt
maturity – first Debt
contractual maturity – date expected*
Amount AmountYear £’000 Year £’000
2008 4,527 2008
2009 2009 4,183
2010 2010
2011 2011
2012 4,183 2012 4,527
2013 2013
2014 2014
2015 2015 2,000
2016 2016
2017 2017
2018 2018
2019 5,000 2019 5,000
2020 2020
2021 3,528 2021 3,528
>2022 2,000 >2022
*Expected debt maturity is based upon our expectation of when the company’s debt will be repaid. The difference between the contractual andexpected debt maturity tables is primarily as a result of our expectation of when we will call the callable debt instruments, which in accordancewith IFRS 7 are disclosed at the first date the company is contractually obligated to settle in cash, i.e. the maturity date. Although expected debtmaturity is a non-GAAP measure, we believe it gives a more realistic profile of when debt will mature.
Borrowings – by currency
18%
82%
SterlingUS Dollar
Borrowing by source
26%
52%
22%
Bank loansPrivate placementsPreference shares
Borrowings by business unit
18%
82%
Head OfficeUnited States
NON-GAAP Borrowing maturity analysis
6
£ milion
5
4
3
2
1
0 12 1310 1108 09 14 15Year
16 17 18 19 20 21 22
Contractual Expected
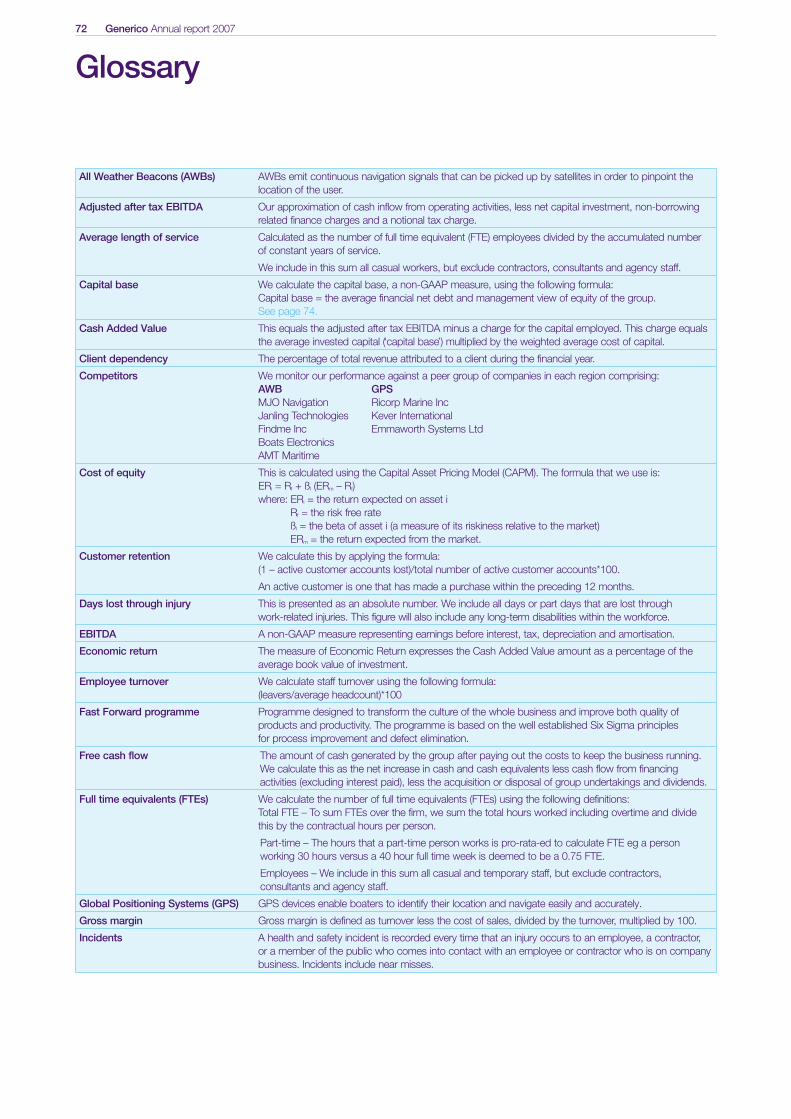
72 Generico Annual report 2007
Glossary
All Weather Beacons (AWBs) AWBs emit continuous navigation signals that can be picked up by satellites in order to pinpoint thelocation of the user.
Adjusted after tax EBITDA Our approximation of cash inflow from operating activities, less net capital investment, non-borrowingrelated finance charges and a notional tax charge.
Average length of service Calculated as the number of full time equivalent (FTE) employees divided by the accumulated number of constant years of service.
We include in this sum all casual workers, but exclude contractors, consultants and agency staff.
Capital base We calculate the capital base, a non-GAAP measure, using the following formula:Capital base = the average financial net debt and management view of equity of the group. See page 74.
Cash Added Value This equals the adjusted after tax EBITDA minus a charge for the capital employed. This charge equalsthe average invested capital (‘capital base’) multiplied by the weighted average cost of capital.
Client dependency The percentage of total revenue attributed to a client during the financial year.
Competitors We monitor our performance against a peer group of companies in each region comprising:AWB GPSMJO Navigation Ricorp Marine IncJanling Technologies Kever InternationalFindme Inc Emmaworth Systems LtdBoats ElectronicsAMT Maritime
Cost of equity This is calculated using the Capital Asset Pricing Model (CAPM). The formula that we use is:ERi = Rf + ßl (ERm – Rf)where: ERi = the return expected on asset i
Rf = the risk free rateßl = the beta of asset i (a measure of its riskiness relative to the market)ERm = the return expected from the market.
Customer retention We calculate this by applying the formula: (1 – active customer accounts lost)/total number of active customer accounts*100.
An active customer is one that has made a purchase within the preceding 12 months.
Days lost through injury This is presented as an absolute number. We include all days or part days that are lost through work-related injuries. This figure will also include any long-term disabilities within the workforce.
EBITDA A non-GAAP measure representing earnings before interest, tax, depreciation and amortisation.
Economic return The measure of Economic Return expresses the Cash Added Value amount as a percentage of theaverage book value of investment.
Employee turnover We calculate staff turnover using the following formula:(leavers/average headcount)*100
Fast Forward programme Programme designed to transform the culture of the whole business and improve both quality ofproducts and productivity. The programme is based on the well established Six Sigma principles for process improvement and defect elimination.
Free cash flow The amount of cash generated by the group after paying out the costs to keep the business running.We calculate this as the net increase in cash and cash equivalents less cash flow from financingactivities (excluding interest paid), less the acquisition or disposal of group undertakings and dividends.
Full time equivalents (FTEs) We calculate the number of full time equivalents (FTEs) using the following definitions: Total FTE – To sum FTEs over the firm, we sum the total hours worked including overtime and divide this by the contractual hours per person.
Part-time – The hours that a part-time person works is pro-rata-ed to calculate FTE eg a personworking 30 hours versus a 40 hour full time week is deemed to be a 0.75 FTE.
Employees – We include in this sum all casual and temporary staff, but exclude contractors, consultants and agency staff.
Global Positioning Systems (GPS) GPS devices enable boaters to identify their location and navigate easily and accurately.
Gross margin Gross margin is defined as turnover less the cost of sales, divided by the turnover, multiplied by 100.
Incidents A health and safety incident is recorded every time that an injury occurs to an employee, a contractor,or a member of the public who comes into contact with an employee or contractor who is on companybusiness. Incidents include near misses.
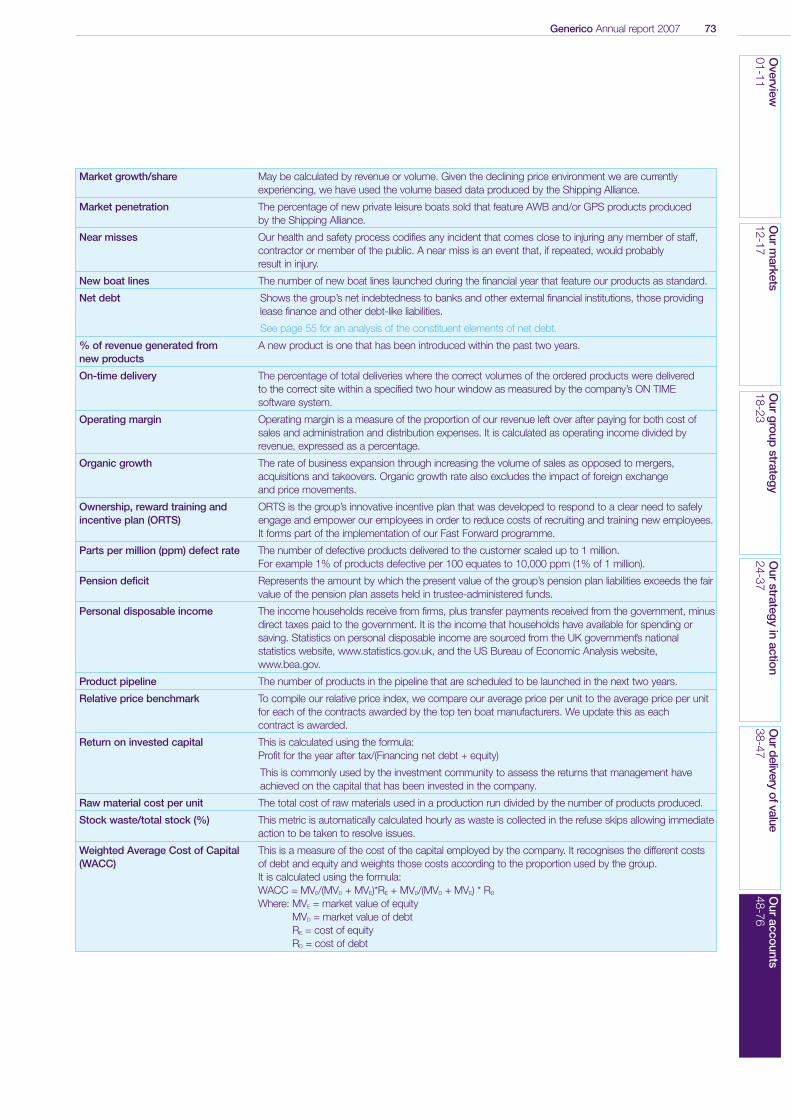
Generico Annual report 2007 73O
verview01-11
Our
markets
12-17O
urgroup
strategy18-23
Our
strategyin
action24-37
Ourdelivery
ofvalue38-47
Our
accounts48-76
Market growth/share May be calculated by revenue or volume. Given the declining price environment we are currentlyexperiencing, we have used the volume based data produced by the Shipping Alliance.
Market penetration The percentage of new private leisure boats sold that feature AWB and/or GPS products produced by the Shipping Alliance.
Near misses Our health and safety process codifies any incident that comes close to injuring any member of staff,contractor or member of the public. A near miss is an event that, if repeated, would probably result in injury.
New boat lines The number of new boat lines launched during the financial year that feature our products as standard.
Net debt Shows the group’s net indebtedness to banks and other external financial institutions, those providinglease finance and other debt-like liabilities.
See page 55 for an analysis of the constituent elements of net debt.
% of revenue generated from A new product is one that has been introduced within the past two years.new products
On-time delivery The percentage of total deliveries where the correct volumes of the ordered products were delivered to the correct site within a specified two hour window as measured by the company’s ON TIME software system.
Operating margin Operating margin is a measure of the proportion of our revenue left over after paying for both cost ofsales and administration and distribution expenses. It is calculated as operating income divided byrevenue, expressed as a percentage.
Organic growth The rate of business expansion through increasing the volume of sales as opposed to mergers,acquisitions and takeovers. Organic growth rate also excludes the impact of foreign exchange and price movements.
Ownership, reward training and ORTS is the group’s innovative incentive plan that was developed to respond to a clear need to safelyincentive plan (ORTS) engage and empower our employees in order to reduce costs of recruiting and training new employees.
It forms part of the implementation of our Fast Forward programme.
Parts per million (ppm) defect rate The number of defective products delivered to the customer scaled up to 1 million. For example 1% of products defective per 100 equates to 10,000 ppm (1% of 1 million).
Pension deficit Represents the amount by which the present value of the group’s pension plan liabilities exceeds the fairvalue of the pension plan assets held in trustee-administered funds.
Personal disposable income The income households receive from firms, plus transfer payments received from the government, minusdirect taxes paid to the government. It is the income that households have available for spending orsaving. Statistics on personal disposable income are sourced from the UK government’s nationalstatistics website, www.statistics.gov.uk, and the US Bureau of Economic Analysis website,www.bea.gov.
Product pipeline The number of products in the pipeline that are scheduled to be launched in the next two years.
Relative price benchmark To compile our relative price index, we compare our average price per unit to the average price per unitfor each of the contracts awarded by the top ten boat manufacturers. We update this as each contract is awarded.
Return on invested capital This is calculated using the formula:Profit for the year after tax/(Financing net debt + equity)
This is commonly used by the investment community to assess the returns that management haveachieved on the capital that has been invested in the company.
Raw material cost per unit The total cost of raw materials used in a production run divided by the number of products produced.
Stock waste/total stock (%) This metric is automatically calculated hourly as waste is collected in the refuse skips allowing immediateaction to be taken to resolve issues.
Weighted Average Cost of Capital This is a measure of the cost of the capital employed by the company. It recognises the different costs (WACC) of debt and equity and weights those costs according to the proportion used by the group.
It is calculated using the formula:WACC = MVE/(MVD + MVE)*RE + MVD/(MVD + MVE) * RD
Where: MVE = market value of equityMVD = market value of debtRE = cost of equityRD = cost of debt
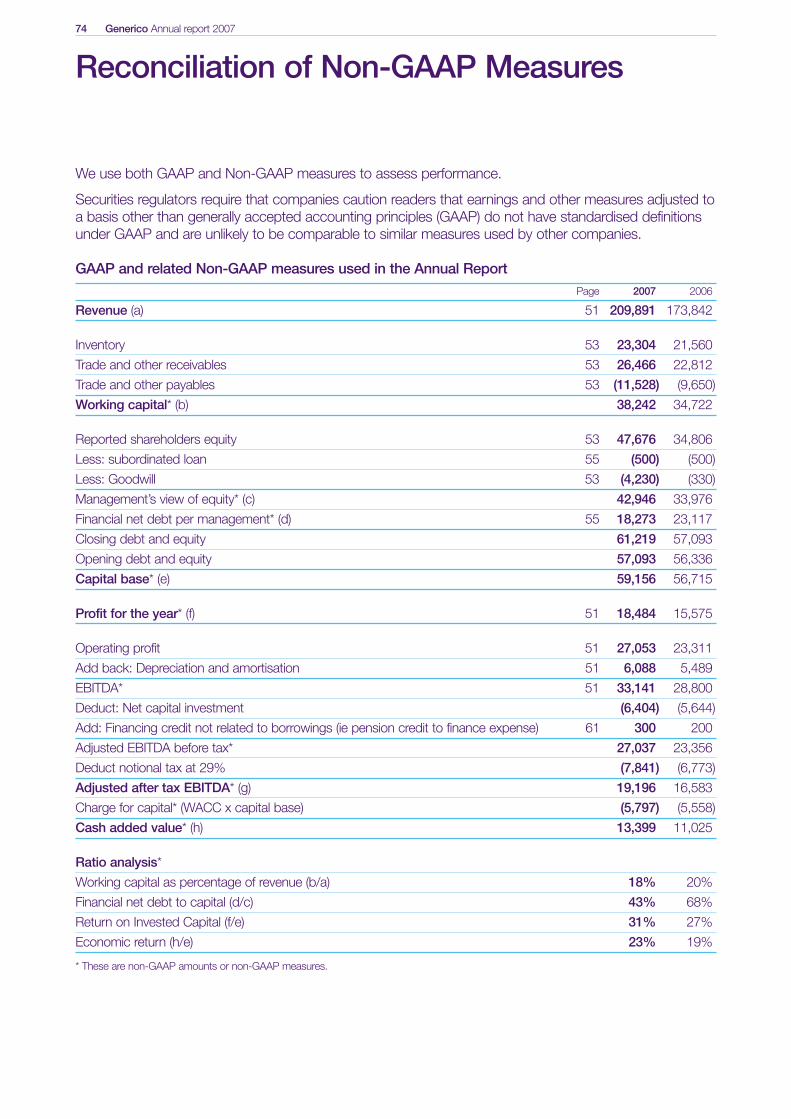
74 Generico Annual report 2007
We use both GAAP and Non-GAAP measures to assess performance.
Securities regulators require that companies caution readers that earnings and other measures adjusted toa basis other than generally accepted accounting principles (GAAP) do not have standardised definitionsunder GAAP and are unlikely to be comparable to similar measures used by other companies.
GAAP and related Non-GAAP measures used in the Annual ReportPage 2007 2006
Revenue (a) 51 209,891 173,842
Inventory 53 23,304 21,560
Trade and other receivables 53 26,466 22,812
Trade and other payables 53 (11,528) (9,650)
Working capital* (b) 38,242 34,722
Reported shareholders equity 53 47,676 34,806
Less: subordinated loan 55 (500) (500)
Less: Goodwill 53 (4,230) (330)
Management’s view of equity* (c) 42,946 33,976
Financial net debt per management* (d) 55 18,273 23,117
Closing debt and equity 61,219 57,093
Opening debt and equity 57,093 56,336
Capital base* (e) 59,156 56,715
Profit for the year* (f) 51 18,484 15,575
Operating profit 51 27,053 23,311
Add back: Depreciation and amortisation 51 6,088 5,489
EBITDA* 51 33,141 28,800
Deduct: Net capital investment (6,404) (5,644)
Add: Financing credit not related to borrowings (ie pension credit to finance expense) 61 300 200
Adjusted EBITDA before tax* 27,037 23,356
Deduct notional tax at 29% (7,841) (6,773)
Adjusted after tax EBITDA* (g) 19,196 16,583
Charge for capital* (WACC x capital base) (5,797) (5,558)
Cash added value* (h) 13,399 11,025
Ratio analysis*
Working capital as percentage of revenue (b/a) 18% 20%
Financial net debt to capital (d/c) 43% 68%
Return on Invested Capital (f/e) 31% 27%
Economic return (h/e) 23% 19%
* These are non-GAAP amounts or non-GAAP measures.
Reconciliation of Non-GAAP Measures
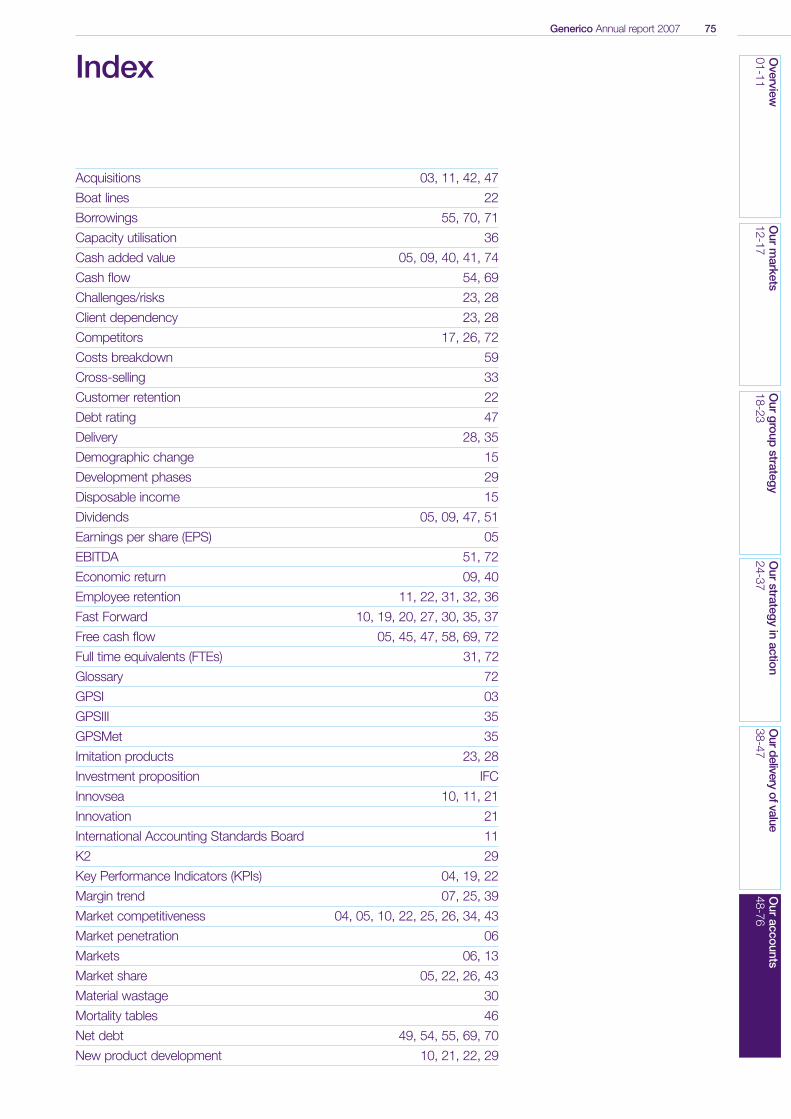
Generico Annual report 2007 75O
verview01-11
Our
markets
12-17O
urgroup
strategy18-23
Our
strategyin
action24-37
Ourdelivery
ofvalue38-47
Our
accounts48-76
Acquisitions 03, 11, 42, 47
Boat lines 22
Borrowings 55, 70, 71
Capacity utilisation 36
Cash added value 05, 09, 40, 41, 74
Cash flow 54, 69
Challenges/risks 23, 28
Client dependency 23, 28
Competitors 17, 26, 72
Costs breakdown 59
Cross-selling 33
Customer retention 22
Debt rating 47
Delivery 28, 35
Demographic change 15
Development phases 29
Disposable income 15
Dividends 05, 09, 47, 51
Earnings per share (EPS) 05
EBITDA 51, 72
Economic return 09, 40
Employee retention 11, 22, 31, 32, 36
Fast Forward 10, 19, 20, 27, 30, 35, 37
Free cash flow 05, 45, 47, 58, 69, 72
Full time equivalents (FTEs) 31, 72
Glossary 72
GPSI 03
GPSIII 35
GPSMet 35
Imitation products 23, 28
Investment proposition IFC
Innovsea 10, 11, 21
Innovation 21
International Accounting Standards Board 11
K2 29
Key Performance Indicators (KPIs) 04, 19, 22
Margin trend 07, 25, 39
Market competitiveness 04, 05, 10, 22, 25, 26, 34, 43
Market penetration 06
Markets 06, 13
Market share 05, 22, 26, 43
Material wastage 30
Mortality tables 46
Net debt 49, 54, 55, 69, 70
New product development 10, 21, 22, 29
Index
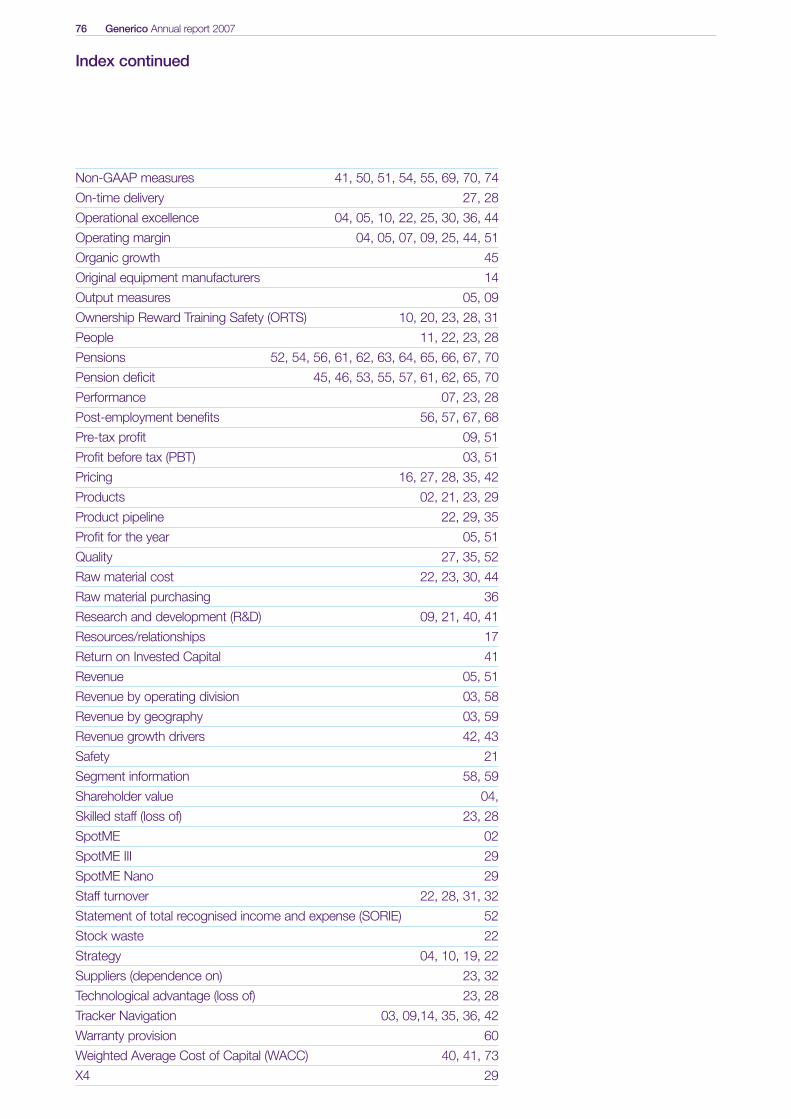
76 Generico Annual report 2007
Index continued
Non-GAAP measures 41, 50, 51, 54, 55, 69, 70, 74
On-time delivery 27, 28
Operational excellence 04, 05, 10, 22, 25, 30, 36, 44
Operating margin 04, 05, 07, 09, 25, 44, 51
Organic growth 45
Original equipment manufacturers 14
Output measures 05, 09
Ownership Reward Training Safety (ORTS) 10, 20, 23, 28, 31
People 11, 22, 23, 28
Pensions 52, 54, 56, 61, 62, 63, 64, 65, 66, 67, 70
Pension deficit 45, 46, 53, 55, 57, 61, 62, 65, 70
Performance 07, 23, 28
Post-employment benefits 56, 57, 67, 68
Pre-tax profit 09, 51
Profit before tax (PBT) 03, 51
Pricing 16, 27, 28, 35, 42
Products 02, 21, 23, 29
Product pipeline 22, 29, 35
Profit for the year 05, 51
Quality 27, 35, 52
Raw material cost 22, 23, 30, 44
Raw material purchasing 36
Research and development (R&D) 09, 21, 40, 41
Resources/relationships 17
Return on Invested Capital 41
Revenue 05, 51
Revenue by operating division 03, 58
Revenue by geography 03, 59
Revenue growth drivers 42, 43
Safety 21
Segment information 58, 59
Shareholder value 04,
Skilled staff (loss of) 23, 28
SpotME 02
SpotME III 29
SpotME Nano 29
Staff turnover 22, 28, 31, 32
Statement of total recognised income and expense (SORIE) 52
Stock waste 22
Strategy 04, 10, 19, 22
Suppliers (dependence on) 23, 32
Technological advantage (loss of) 23, 28
Tracker Navigation 03, 09,14, 35, 36, 42
Warranty provision 60
Weighted Average Cost of Capital (WACC) 40, 41, 73
X4 29

Generico Annual report 2007
Designed and produced by Radley Yeldar (London)Text by Lang Communications – creating content for effective corporate communicationPrinted by CTD – specialists in annual report and accounts printing© 2006 All rights reserved