Generative classifiers: The Gaussian classifier
19
Generative classifiers: The Gaussian classifier Ata Kaban School of Computer Science University of Birmingham
-
Upload
jackson-daniel -
Category
Documents
-
view
42 -
download
0
description
Generative classifiers: The Gaussian classifier. Ata Kaban School of Computer Science University of Birmingham. Outline. We have already seen how Bayes rule can be turned into a classifier In all our examples so far we had discrete valued attributes (e.g. in {‘ sunny’,’rainy ’}, {+,-}) - PowerPoint PPT Presentation
Transcript of Generative classifiers: The Gaussian classifier

Generative classifiers: The Gaussian classifier
Ata KabanSchool of Computer Science
University of Birmingham

Outline
• We have already seen how Bayes rule can be turned into a classifier
• In all our examples so far we had discrete valued attributes (e.g. in {‘sunny’,’rainy’}, {+,-})
• Today we learn how to do this when the data attributes are continuous valued

Example
• Task: predict gender of individuals based on their heights
• Given
• 100 height examples of women
• 100 height examples of man
1.1 1.2 1.3 1.4 1.5 1.6 1.7 1.8 1.9 20
5
10
15
20
25
30
35
40
Empirical data for male
Empirical data for female
Height (meters)
Freq
uenc
y

Class priors
• We can encode the values of the hypothesis (class) as 1 (male) and 0 (female). So,
• Since in this example we had the same number of males and females, we have P(h=1)=P(h=0)=0.5. These are the prior probabilities of class membership because they can be set before measuring any data.
• Note that in cases when the class proportions are imbalanced, we can use the priors to make predictions even before seeing any data.

Class-conditional likelihood
• Our measurements are heights. This is our data, .
• Class-conditional likelihoods:p(x|h=1): probability that a male has height x metersp(x|h=0):
Class posterior
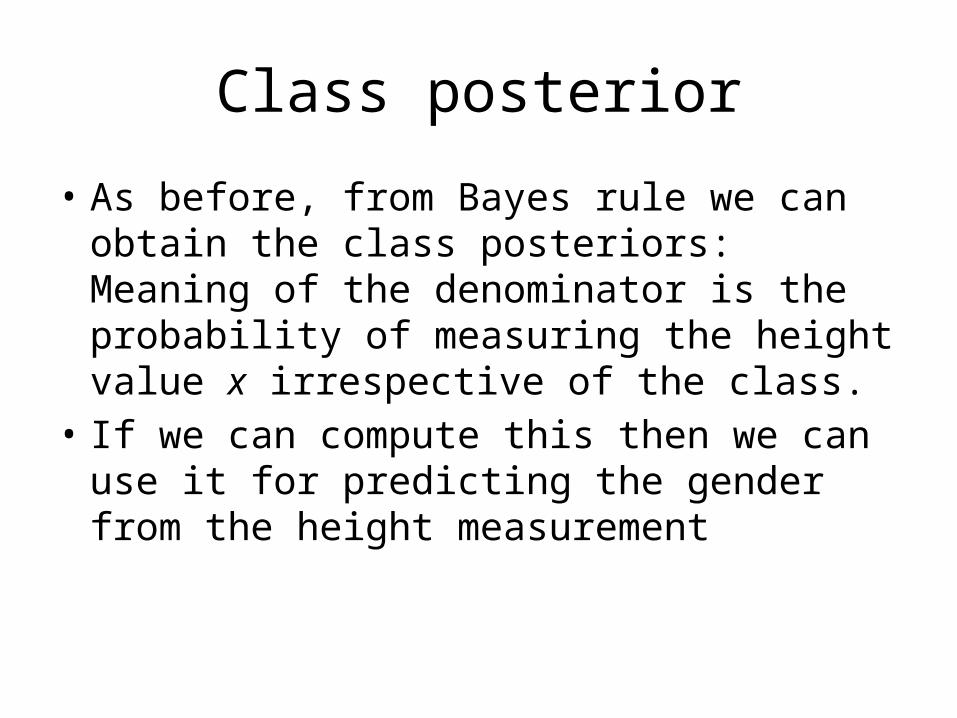
• As before, from Bayes rule we can obtain the class posteriors: Meaning of the denominator is the probability of measuring the height value x irrespective of the class.
• If we can compute this then we can use it for predicting the gender from the height measurement

Discriminant function• When does our prediction switch from predicting h=0 vs predicting h=1?
• • … more precisely
1.1 1.2 1.3 1.4 1.5 1.6 1.7 1.8 1.9 20
5
10
15
20
25
30
35
40Empirical data for male
Empirical data for female
Height (meters)
Freq
uenc
y
Discriminant function
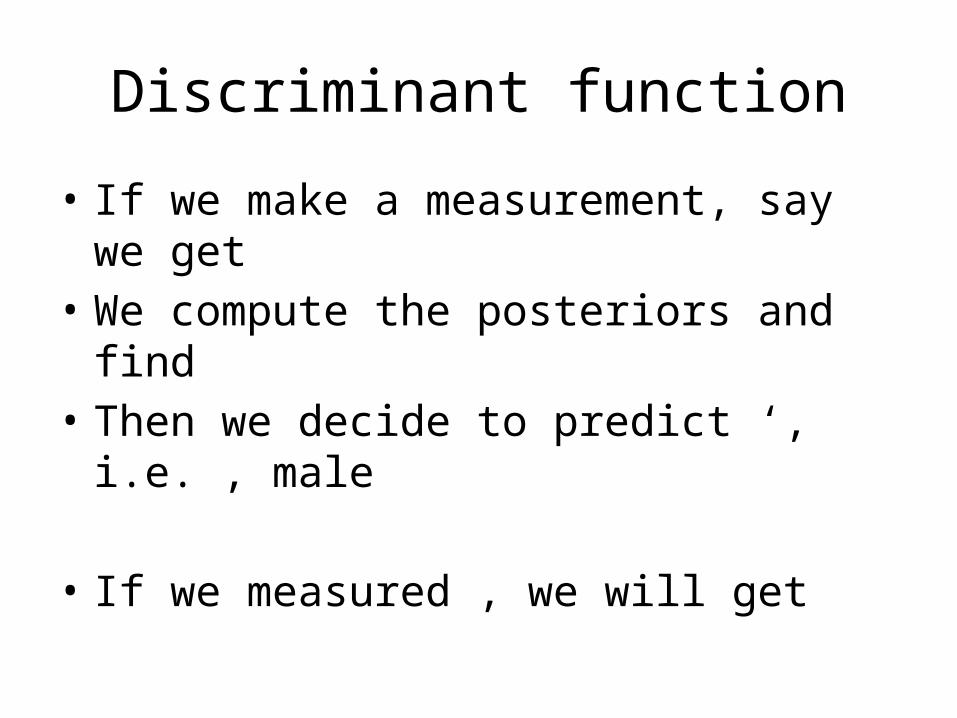
• If we make a measurement, say we get • We compute the posteriors and find • Then we decide to predict ‘, i.e. , male
• If we measured , we will get

Discriminant function
• We can define a discriminant function as:
and compare the function value to 1.
• More convenient to have the switching at 0 rather than at 1. Define discriminant function as the log of f1:
• Then the sign of this function defines the prediction (if f(x)>0 => male, if f(x)<0 => female)
How do we compute it?
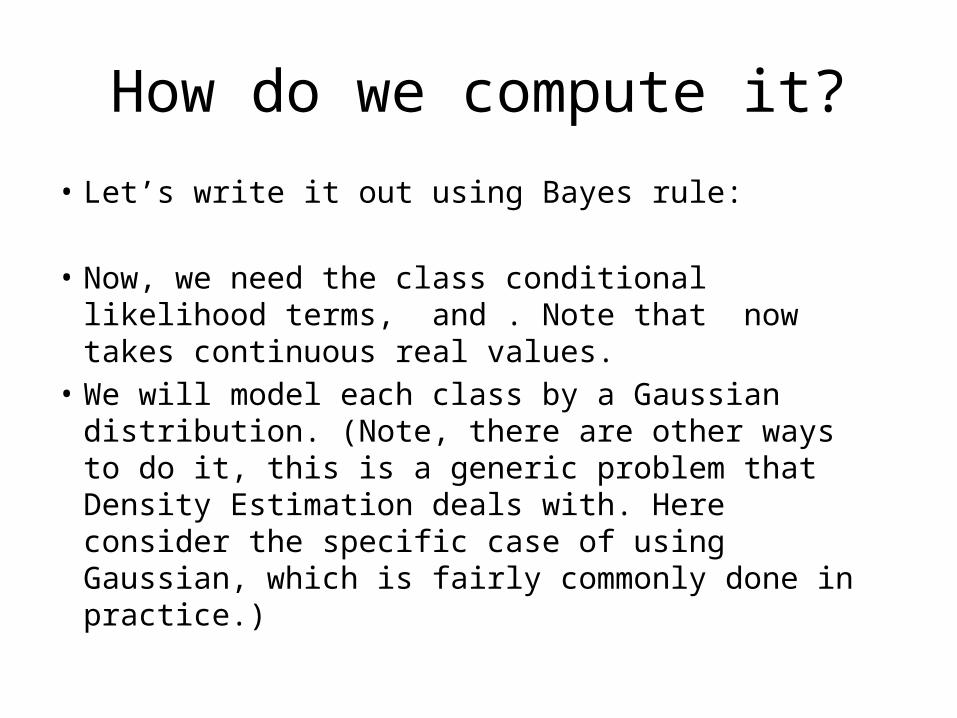
• Let’s write it out using Bayes rule:
• Now, we need the class conditional likelihood terms, and . Note that now takes continuous real values.
• We will model each class by a Gaussian distribution. (Note, there are other ways to do it, this is a generic problem that Density Estimation deals with. Here consider the specific case of using Gaussian, which is fairly commonly done in practice.)

Illustration – our 1D example
Height (meters)
Freq
uenc
y
1.1 1.2 1.3 1.4 1.5 1.6 1.7 1.8 1.9 20
5
10
15
20
25
30
35
40
Empirical data for maleFitted distributionfor maleEmpirical data for femaleFitted distribution for female

Gaussian - univariate
𝑝 (𝑥 )= 1
√2𝜋 𝜎2exp {− (𝑥−𝑚)
2𝜎2
2}Where is the mean (center), and is the variance (spread). These are the parameters that describe the distributions.
We will have a separate Gaussian for each class. So, the female class will have mean, and as its variance. The male class will have mean, and as its variance. We need to estimate these parameters from the data.

Gaussian - multivariate
Let . So x has d attributes.Let k in {0,1}.=
Where the mean vectors, andis the covariance matrices. These are the parameters that describe the distributions, and they are estimated from the data.

Gaussian - multivariate

2D example with 2 classes
Attribute 1
Attrib
ute
2

Naïve Bayes
• Notice the full covariances are • In many situations there is not enough data to
estimate the full covariance – e.g. when d is large.• The Naïve Bayes assumption is again an easy
simplification that we can make and tends to work well in practice. In the Gaussian model it means that the covariance matrix is diagonal.
• For the brave: Check this last statement for yourself! – 3% extra credit if you hand in a correct solution to me before next Thursday’s class!

Are we done?
• How do we estimate the parameters, i.e. the means and the variance/ covariance?
• If we use the Naïve Bayes assumption, we can compute the estimates of the mean and variance in each class separately for each feature.
• If d is small, and you have many points in your training set, then working with full covariance is expected to work better.
• In MatLab there are built-in functions that you can use: mean, cov, var.
Multi-class classification
• We may have more than 2 classes – e.g. ‘healthy’, ‘disease type 1’, ‘disease type 2’.
• Our Gaussian classifier is easy to use in multi-class problems.
• We compute the posterior probability for each of the classes
• We predict the class whose posterior probability is highest.

Summing up
• This type of classifier is called ‘generative’, because it rests on the assumption that the cloud of points in each class can be seen as generated by some distribution, e.g. a Gaussian, and works out its decisions based on estimating these distributions.
• One could instead model the discriminant function directly! That type of classifier is called ‘discriminative’.
• For the brave: Try to work out the form of the discriminant function by plugging into it the form of the Gaussian class conditional densities. You will get a quadratic function of x in general. When does it reduce to a linear functon?
• Recommended reading: Rogers & Girolami, Chapter 5.