Generation Connection Capacity Assessment of the 2016 ... · HV busbar High Voltage busbar of a...
32
Generation Connection Capacity Assessment of the 2016 Transmission Network ( GCCA-2016 ) October 2013
Transcript of Generation Connection Capacity Assessment of the 2016 ... · HV busbar High Voltage busbar of a...

Generation Connection Capacity Assessment of
the 2016 Transmission Network (GCCA-2016)
October 2013
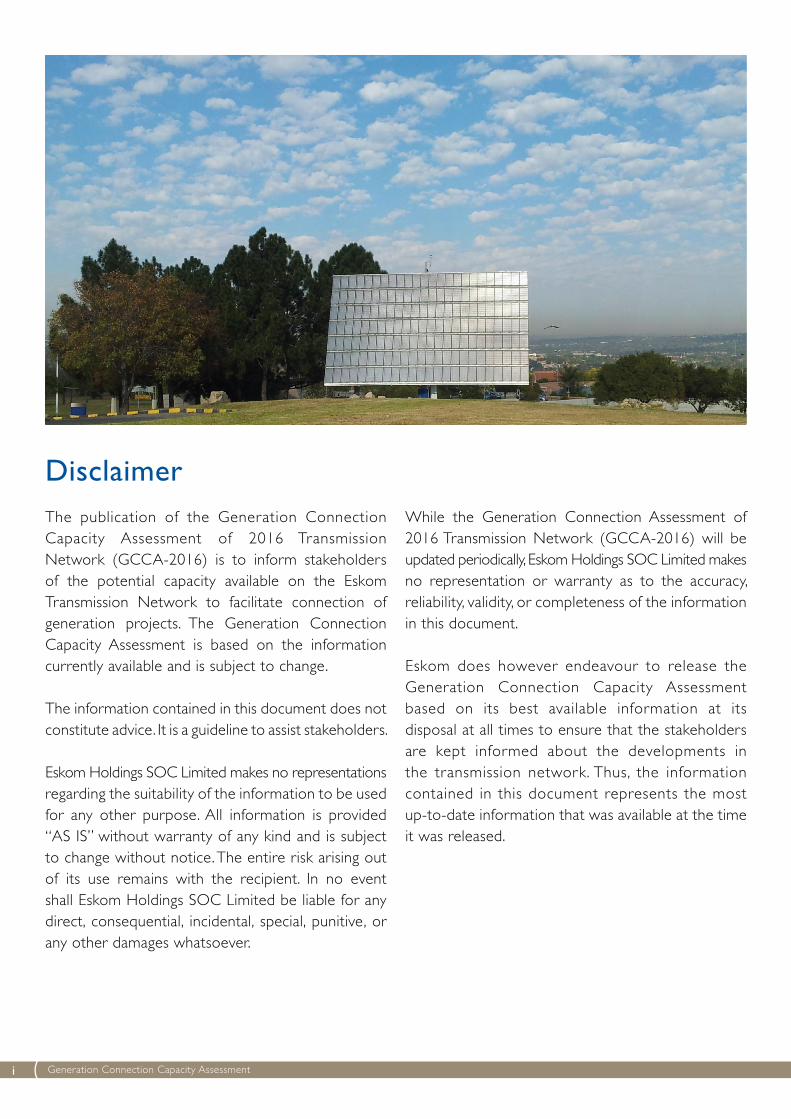
DisclaimerThe publication of the Generation Connection Capacity Assessment of 2016 Transmission Network (GCCA-2016) is to inform stakeholders of the potential capacity available on the Eskom Transmission Network to facilitate connection of generation projects. The Generation Connection Capacity Assessment is based on the information currently available and is subject to change.
The information contained in this document does not constitute advice. It is a guideline to assist stakeholders.
Eskom Holdings SOC Limited makes no representations regarding the suitability of the information to be used for any other purpose. All information is provided “AS IS” without warranty of any kind and is subject to change without notice. The entire risk arising out of its use remains with the recipient. In no event shall Eskom Holdings SOC Limited be liable for any direct, consequential, incidental, special, punitive, or any other damages whatsoever.
While the Generation Connection Assessment of 2016 Transmission Network (GCCA-2016) will be updated periodically, Eskom Holdings SOC Limited makes no representation or warranty as to the accuracy, reliability, validity, or completeness of the information in this document.
Eskom does however endeavour to release the Generation Connection Capacity Assessment based on its best available information at its disposal at all times to ensure that the stakeholders are kept informed about the developments in the transmission network. Thus, the information contained in this document represents the most up-to-date information that was available at the time it was released.
Generation Connection Capacity Assessmenti

Executive SummaryThe Intergraded Resource Plan (IRP 2010-2030) has allocated 17 800 MW of solar and wind generation projects in line with the Government’s commitment to reducing emissions. One of the challenges for the integration of renewable energy (RE) generation has always been the cost of integration and the time-lines for creating grid capacity to accommodate RE generation, therefore the location of the RE plants in relation to the grid is very impor tant. However, the proximity of the plant on its own is not sufficient if the grid does not have the capacity to connect the RE generated. This study was commissioned to determine the grid’s capacity to connect all types of generation plant at high-voltage (HV) busbars of the Main Transmission System (MTS) substations in 2016. Although most RE connections will be at Distribution level, the lack of capacity in the Transmission network may delay the connection of new generation.
A previous study was done to determine the 2012 connection capacity of the Transmission grid, where the study focused on the Eastern Cape, Western Cape and Northern Cape. This 2016 study was extended to include all MTS substations in the country. Studies on both steady-state and transient stability limits were conducted to determine the grid’s connection capacity. Stability limits are typically impor tant when considering the integration of multiple RE generation sources in an area, but for individual applications the steady-state limit could be sufficient.
MTS substations supply specific geographic areas, and this fact was taken into account when considering the connection capacity, based on the assumption that RE plants in a supply area will probably be connected to the MTS substation supplying that area. The MTS is divided into 27 supply areas located in all 9 provinces.
The geographic location of the supply areas and their generation connection capacity, indicating both the steady-state N-1 limit and the stability limit, are shown in Figure A.
The generation connection capacities in Figure A indicate what capacity the Transmission grid can connect without violating the Grid Code’s technical criteria for generation integration. The Grid Code states that the National Transmission Company (NTC) shall provide quotations for connection. The grid connection capacity will provide a guideline for the generation capacity that the grid can connect for Independent Power Producers (IPPs) and for Eskom. This study will also assist the NTC with determining the requirements for the new capacity that should be created in cer tain areas to cater for the applications received from IPPs.
The results indicate that the grid has the capacity to connect high levels of RE generation, provided that the RE points are spread around the country. Although the grid appears to have enough capacity to integrate all the IRP requirements, care will have to be taken to ensure that, at a local level where IPP applications are concentrated in cer tain areas, the grid will have enough capacity, while highlighting areas with available grid capacity to connect with IPPs.
Stability limits for large-area integration indicate that Limpopo and North West combined will be transiently stable for 10 GW of new generation, the entire KwaZulu-Natal area can connect 17 GW, and the Cape area (Northern, Southern and Western) will be stable for 15 GW.
GCCA-2016 © Eskom 2013 ii

Figure A: Generation Connection Capacities (steady-state/stability) for the 2016 Grid
List of abbreviationsCSP Concentrating Solar Power
DoE Depar tment of Energy (Government of South Africa)
GCCA Grid Connection Capacity Assessment
HV busbar High Voltage busbar of a substation (> 132 kV at Transmission level)
IPP Independent Power Producer
LV busbar Low Voltage busbar of a substation (<=132 kV at Transmission level)
MTS Main Transmission System
NTC National Transmission Company
PV Photovoltaic
RE Renewable energy
TNSP Transmission Network Service Provider
Generation Connection Capacity Assessmentiii

ContentsExecutive Summary ii
1 Introduction 1
1.1 Context of the Generation Connection Capacity 1
1.2 Structure of the document 1
2 Background 2
3 Methodology and Interpretation 3
3.1 Methodology of calculation 3
3.2 Interpretation of the connection capacity value 4
4 Definition of Transmission Connection Capacity 5
5 Supply Areas by Province: Connection Capacity 6
5.1 Eastern Cape 7
5.2 Free State 8
5.3 Gauteng 9
5.4 KwaZulu-Natal 10
5.5 Limpopo 11
5.6 Mpumalanga 12
5.7 North West Province 13
5.8 Northern Cape 14
5.9 Western Cape 15
6 Generation Connection Capacity by Supply Area 16
6.1 Bloemfontein area 16
6.2 Carltonville area 17
6.3 East London Bisho area 17
GCCA-2016 © Eskom 2013 iv

6.4 Empangeni area 17
6.5 Highveld North area 17
6.6 Highveld South area 17
6.7 Johannesburg area 18
6.8 Karoo area 18
6.9 Kimberly area 18
6.10 Ladysmith area 18
6.11 Lowveld area 19
6.12 Namaqualand area 19
6.13 Newcastle area 19
6.14 Nigel area 19
6.15 Peninsula area 20
6.16 Pinetown area 20
6.17 Polokwane area 20
6.18 Por t Elizabeth area 20
6.19 Pretoria area 21
6.20 Rustenburg area 21
6.21 Southern Cape area 21
6.22 Vaal Triangle area 21
6.23 Warmbad area 22
6.24 Waterberg area 22
6.25 Welkom area 22
6.26 West Coast area 22
6.27 West Rand area 22
6.28 Large-Area Integration Stability limits 23
7 High-Level Connection Estimates 24
Appendix A: Renewable Energy IPPs - Round 1 and 2 Preferred Bidders 24
Generation Connection Capacity Assessmentv
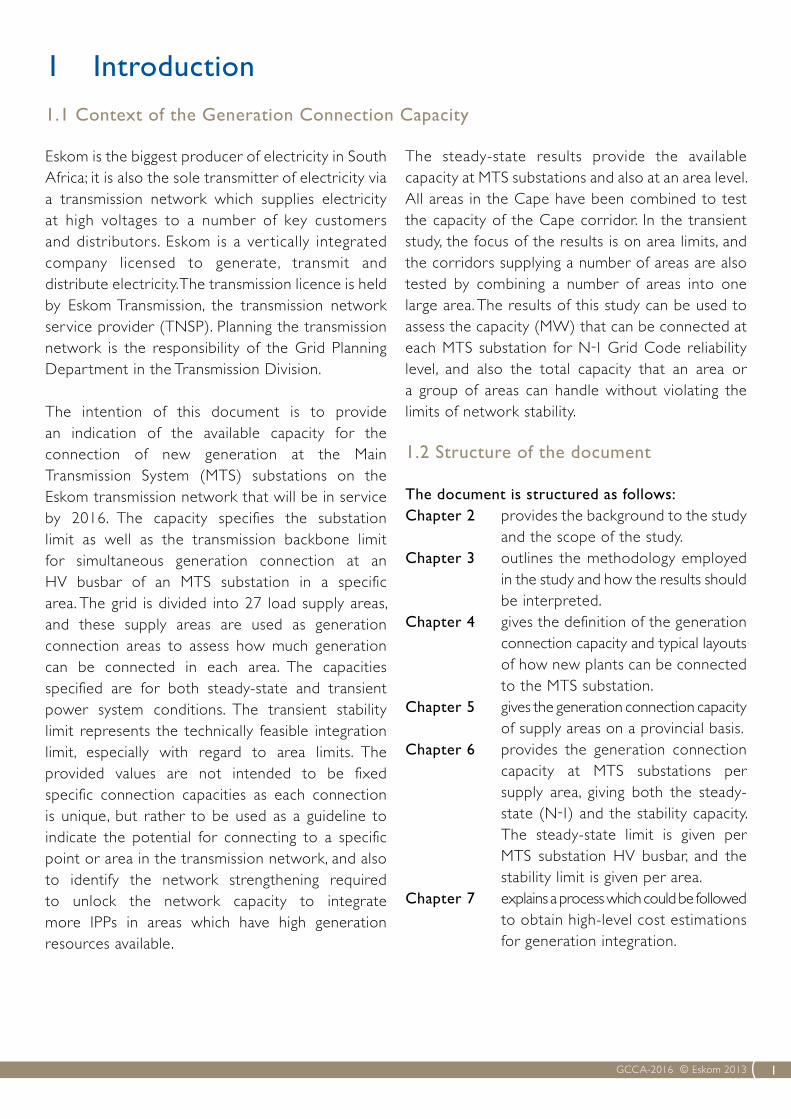
1 Introduction
1.1 Context of the Generation Connection Capacity
Eskom is the biggest producer of electricity in South Africa; it is also the sole transmitter of electricity via a transmission network which supplies electricity at high voltages to a number of key customers and distributors. Eskom is a ver tically integrated company licensed to generate, transmit and distribute electricity. The transmission licence is held by Eskom Transmission, the transmission network service provider (TNSP). Planning the transmission network is the responsibility of the Grid Planning Depar tment in the Transmission Division.
The intention of this document is to provide an indication of the available capacity for the connection of new generation at the Main Transmission System (MTS) substations on the Eskom transmission network that will be in service by 2016. The capacity specifies the substation limit as well as the transmission backbone limit for simultaneous generation connection at an HV busbar of an MTS substation in a specific area. The grid is divided into 27 load supply areas, and these supply areas are used as generation connection areas to assess how much generation can be connected in each area. The capacities specified are for both steady-state and transient power system conditions. The transient stability limit represents the technically feasible integration limit, especially with regard to area limits. The provided values are not intended to be fixed specific connection capacities as each connection is unique, but rather to be used as a guideline to indicate the potential for connecting to a specific point or area in the transmission network, and also to identify the network strengthening required to unlock the network capacity to integrate more IPPs in areas which have high generation resources available.
The steady-state results provide the available capacity at MTS substations and also at an area level. All areas in the Cape have been combined to test the capacity of the Cape corridor. In the transient study, the focus of the results is on area limits, and the corridors supplying a number of areas are also tested by combining a number of areas into one large area. The results of this study can be used to assess the capacity (MW) that can be connected at each MTS substation for N-1 Grid Code reliability level, and also the total capacity that an area or a group of areas can handle without violating the limits of network stability.
1.2 Structure of the document
The document is structured as follows:Chapter 2 provides the background to the study
and the scope of the study.Chapter 3 outlines the methodology employed
in the study and how the results should be interpreted.
Chapter 4 gives the definition of the generation connection capacity and typical layouts of how new plants can be connected to the MTS substation.Chapter 5 gives the generation connection capacity of supply areas on a provincial basis.Chapter 6 provides the generation connection
capacity at MTS substations per supply area, giving both the steady-state (N-1) and the stability capacity. The steady-state limit is given per MTS substation HV busbar, and the stability limit is given per area.
Chapter 7 explains a process which could be followed to obtain high-level cost estimations for generation integration.
GCCA-2016 © Eskom 2013 1

2 BackgroundEskom released the document on Generation Connection Capacity Assessment for the 2012 Transmission Grid (GCCA-2012) early in 2011 in response to the Government’s REBID programme and the large number of renewable generation applications and enquiries received by Eskom. This document only covered the Cape provinces because of time constraints and the prioritisation of the locations where enquiries were made.
The GCCA-2012 focused on the connection at the Lower Voltage (LV) busbars of the Main Transmission System (MTS) substations and took into account the limitation of the transformers, as the emphasis was on connecting to the existing transmission infrastructure.
This version of the GCCA document not only considers the Transmission Grid that is expected to be in place by 2016, but now also includes the entire country. The focus is now on the generation that can be connected to the High Voltage (HV) busbar
at the MTS substation without the limitations of the transformers, i.e. on what can be first absorbed for supplying the local MTS supply area and what in addition can be transpor ted into the Transmission Grid to supply more distant loads. The requirement is that the Transmission grid should still meet the single condition (N-1) criteria of the Grid Code.
The Transmission Gr id is divided into 27 Transmission supply areas which contain a number of MTS substations to supply the demand in the area. These supply areas are grouped into the 9 provinces of the country. The supply areas have been analysed to determine the generation connection capacities of the MTS substations within each supply area. An overview of each province and the provinces’ supply areas is given in Section 5. An alphabetical list of MTS substations and their connection capacities per supply area is provided in Chapter 6.
Generation Connection Capacity Assessment2

This chapter explains how the generation connection capacities were calculated for the MTS substations and how this value can be interpreted.
3.1 Methodology of calculation
Connection capacity is determined by the available Transmission infrastructure in service to which a proposed generation project can connect and then transpor t the generated power to the loads. The document considers the connection capacity that will be available on the Transmission grid for the year 2016, taking into account the Transmission infrastructure that is expected to be in service in 2016, based on the approved Transmission Development Plan for the period 2013 to 2022.
The Distribution infrastructure is not considered in this document because of the sheer volume of infrastructure and the rapid changes that can be implemented at the lower voltages. All generation integration requirements will have to be considered at a local level and the direct connections can in general be implemented relatively quickly. The real issue that this document addresses is how much generation can be integrated and transported to the point where it is required at the Transmission level.
The Transmission Connection Capacity provides the overall capacity that can be absorbed at a specific MTS connection point without requiring any reinforcement, either directly connected to the MTS substation or via the distribution network supplied by the MTS substation. In other words, it is the indicative capacity for connecting new generation within the geographical supply area of that par ticular MTS substation.
Cer tain assumptions were made regarding the potential allocation of the downstream load in order to determine the connection capacity at the MTS substations. Essentially, the new generation will first supply the local load within the supply area of the MTS substation and send the excess into the Transmission network via the MTS substation transformers and connecting Transmission lines.
The difference between the previous GCCA document, GCCA-2012, and this one, GCCA-2016, is that in this case the amount of generation is considered to be modelled at the High-Voltage busbar of the substation, i.e. the 400-kV, 275-kV or 220-kV busbar. The generation value at the HV busbar was increased until the Grid Code criteria were breached for single contingency(N-1)conditions on the Transmission level grid. This value determined the individual generation limit at the MTS substation.
The MTS substation is connected within a Transmission load supply area system, however, in total there are 27 such areas, and the limit of the supply area dictates the potential limit at the individual MTS substation. The limit at each MTS substation within a supply area provides an indication of the propor tional allocation of the supply area limit to the substations. The studies are then rerun, increasing the generation of the supply area with each substation at their relative propor tional contribution until the area’s N-1 limit is reached. This is then the generation connection capacity value for each MTS substation in the supply area.
The capacities are determined for both steady-state and transient power system conditions. In effect, the transient stability limit represents the technically feasible integration limit with regard to area limits.
3 Methodology and Interpretation
GCCA-2016 © Eskom 2013 3

3.2 Interpretation of the connection capacity value
Based on the connection capacity of a specific MTS substation, a developer is able to make a high level assessment of what is likely to be required to connect his/her generation project to this point on the Eskom Transmission network.
This would be done by first identifying in which MTS substation supply area the generation project will be located and relating it to the approximate distance to that MTS substation or the nearest Distribution substation within that supply area. The maps indicating the supply areas are provided by province in Chapter 6 of this document.
Using the proposed total MW output of the generation plant, the connection requirements and timing assessment can be done as follows:
Project MW output less than MTS connection capacityThe generation project should be able to connect to the Transmission network without requiring any additional deep transformation reinforcement. Only shallow connection works should be required, either via the distribution network or by connecting directly to the HV or LV busbar of the MTS substation.
Project MW output is around MTS connection capacityIf the MW output of the generation project is of the same order as the MTS substation’s connection capacity, around a ± 10% variation, then it may be possible to connect the project without requiring any additional deep reinforcement and only shallow connection works will be required.
Project MW output greater than MTS connection capacityThe generation project will not be able to connect without requiring some form of additional deep Transmission reinforcement (e.g. Transmission line, transformer) in addition to the shallow connection works. The deep reinforcement is likely to place a time constraint on connecting the generation plant project, depending on the nature and size of the transmission reinforcement works required.
Generation Connection Capacity Assessment4

4 DefinitionofTransmissionConnectionCapacityA “Transmission Connection” is defined for the purposes of this document as the direct or indirect connection to an MTS substation at either the LV or the HV busbar.
A direct connection at the HV busbar would require the construction of a Transmission voltage level line (400 kV, 275 kV or 220 kV) from the generation plant directly to the MTS substation. The connection to the MTS substation’s LV busbar can be made in number of ways, namely:
• Direct connection from the generation plant substation to the MTS substation via a dedicated transmission line.
• Looping in an existing distribution line which is connected to the MTS substation into the generation plant substation.
• Direct connection from the generation plant’s substation to a Distribution substation which is supplied by the MTS substation.
The 3 LV busbar connection options are shown diagrammatically in Figure 4.1.
Figure 4.1: Generation plant connection to the LV busbar options
400 kV (HV)
132 kV (LV)
Direct Connection to an MTS Substation
Loop-in Connection to an existing transmission line
Direct Connection to a Distribution Substation
132 kV (LV)
22 kV (LV)
MTS Substation
Gen
Pl
ant
Gen Plant
Distribution SubstationGen Plant
132
kV (
LV)
22 k
V (
LV)
Dis
trib
utio
n Su
bsta
tio
n
GCCA-2016 © Eskom 2013 5
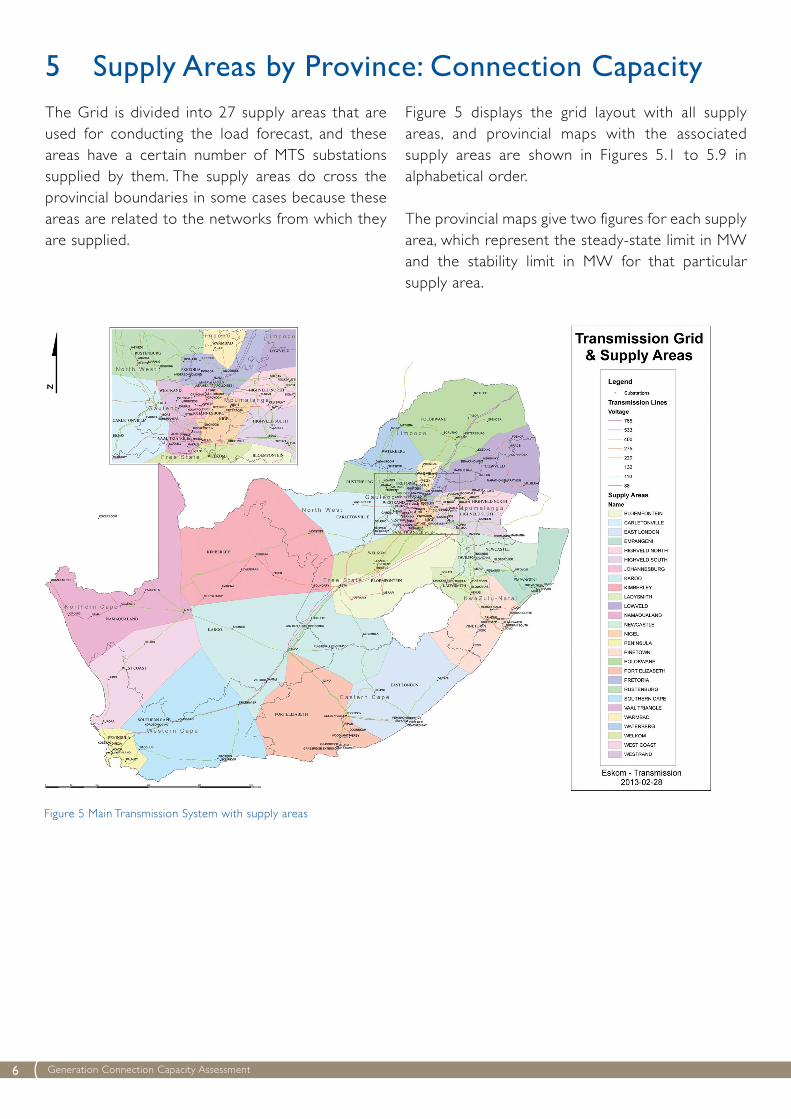
5 Supply Areas by Province: Connection CapacityThe Grid is divided into 27 supply areas that are used for conducting the load forecast, and these areas have a cer tain number of MTS substations supplied by them. The supply areas do cross the provincial boundaries in some cases because these areas are related to the networks from which they are supplied.
Figure 5 displays the grid layout with all supply areas, and provincial maps with the associated supply areas are shown in Figures 5.1 to 5.9 in alphabetical order.
The provincial maps give two figures for each supply area, which represent the steady-state limit in MW and the stability limit in MW for that par ticular supply area.
Figure 5 Main Transmission System with supply areas
Generation Connection Capacity Assessment6
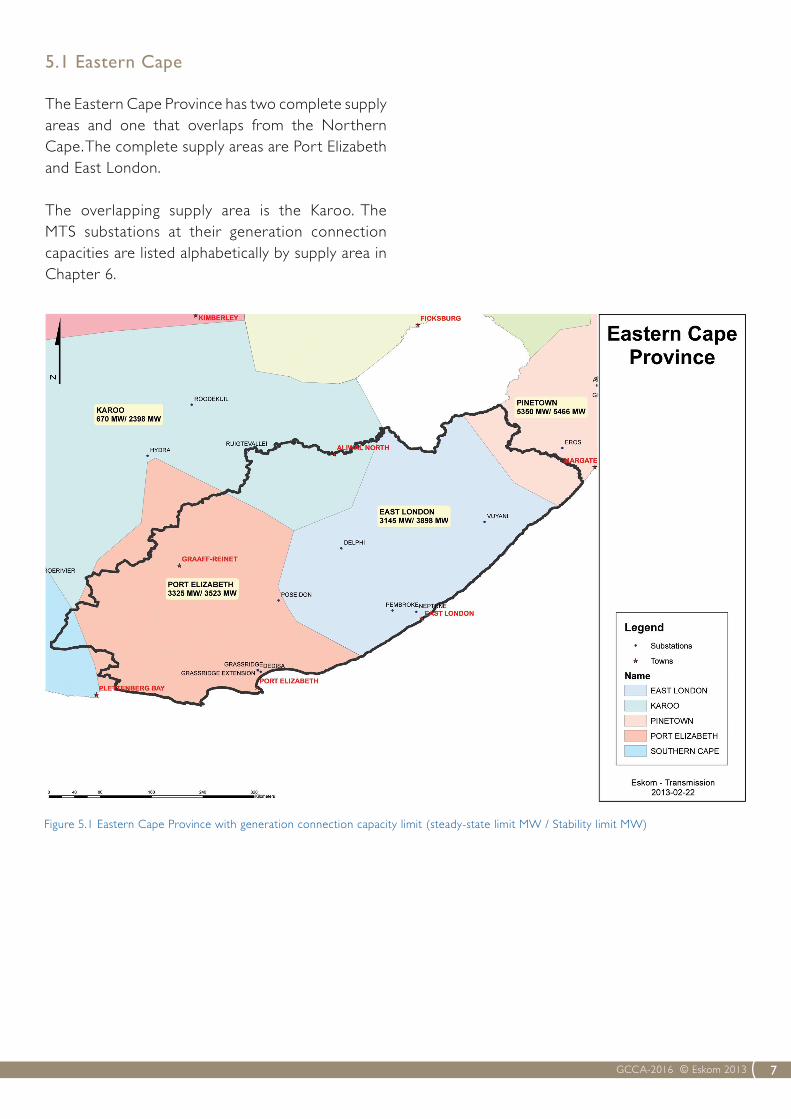
Figure 5.1 Eastern Cape Province with generation connection capacity limit (steady-state limit MW / Stability limit MW)
5.1 Eastern Cape
The Eastern Cape Province has two complete supply areas and one that overlaps from the Northern Cape. The complete supply areas are Por t Elizabeth and East London.
The overlapping supply area is the Karoo. The MTS substations at their generation connection capacities are listed alphabetically by supply area in Chapter 6.
GCCA-2016 © Eskom 2013 7

Figure 5.2 Free State Province with generation connection capacity limit (steady-state limit MW / Stability limit MW)
5.2 Free State
The Free State Province has two complete supply areas and several overlapping supply areas, namely two from the Northern Cape, one from the North West Province, one from Gauteng and one from KwaZulu-Natal. The complete supply areas are Bloemfontein and Welkom. The overlapping supply areas are Kimberley, Karoo, Carltonville, Vaal Triangle and Tugela.
The MTS substations at their generation connection capacities are listed alphabetically by supply area in Chapter 6.
Please note that the Serumula substation is only a series capacitor switching station.
Generation Connection Capacity Assessment8
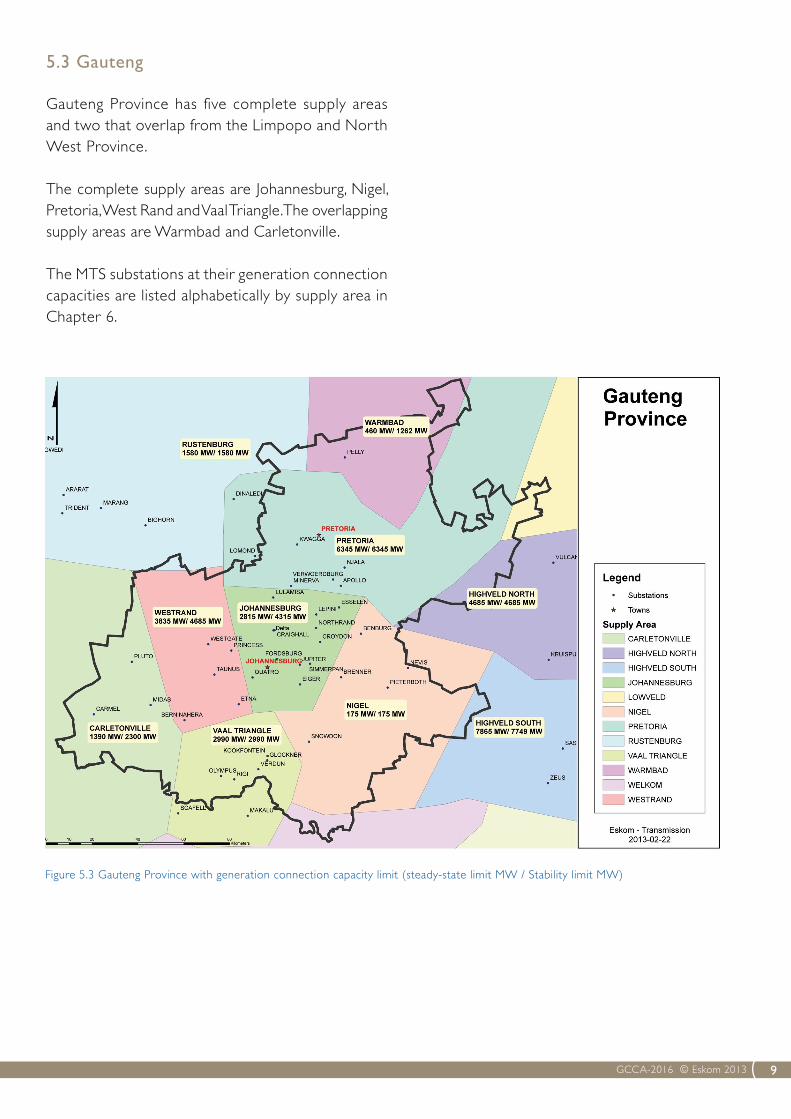
Figure 5.3 Gauteng Province with generation connection capacity limit (steady-state limit MW / Stability limit MW)
5.3 Gauteng
Gauteng Province has five complete supply areas and two that overlap from the Limpopo and North West Province.
The complete supply areas are Johannesburg, Nigel, Pretoria, West Rand and Vaal Triangle. The overlapping supply areas are Warmbad and Carletonville.
The MTS substations at their generation connection capacities are listed alphabetically by supply area in Chapter 6.
GCCA-2016 © Eskom 2013 9

Figure 5.4 KwaZulu-Natal Province with generation connection capacity limit (steady-state limit MW / Stability limit MW)
5.4 KwaZulu-Natal
KwaZulu-Natal Province has four complete supply areas and no overlapping supply areas. The complete supply areas are Empangeni, Pinetown, Newcastle and Tugela.
The MTS substations at their generation connection capacities are listed alphabetically by supply area in Chapter 6.
Generation Connection Capacity Assessment10
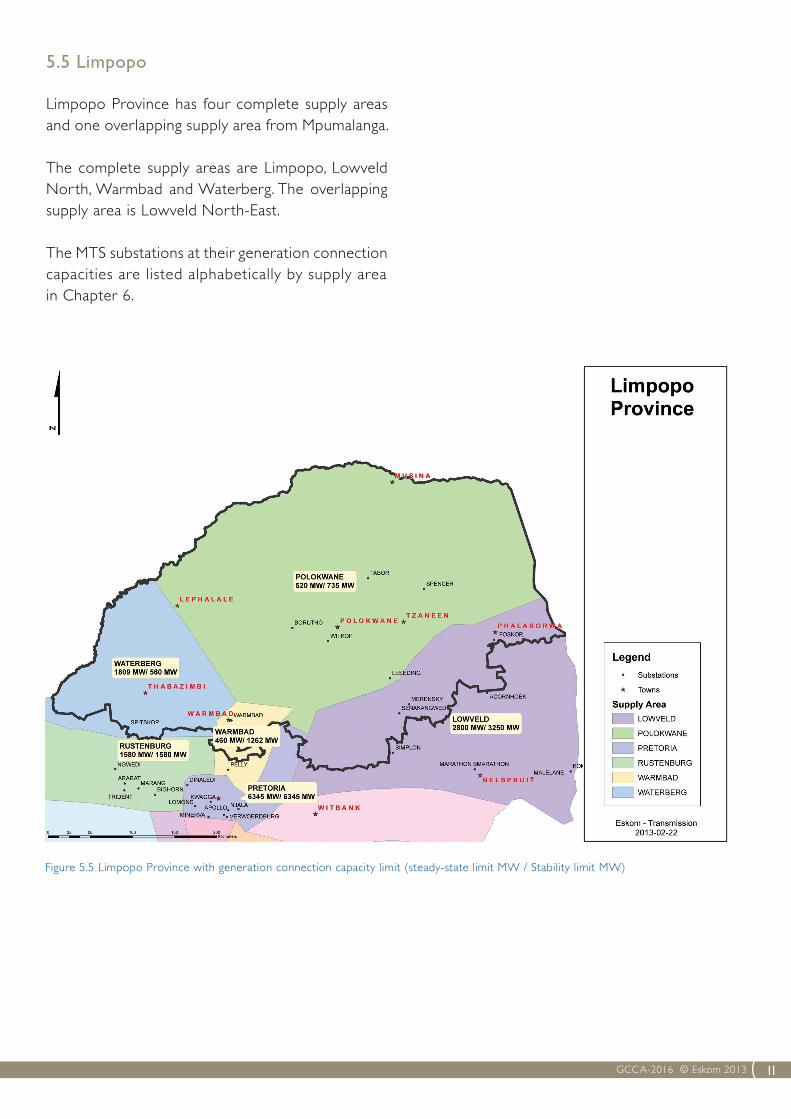
Figure 5.5 Limpopo Province with generation connection capacity limit (steady-state limit MW / Stability limit MW)
5.5 Limpopo
Limpopo Province has four complete supply areas and one overlapping supply area from Mpumalanga.
The complete supply areas are Limpopo, Lowveld North, Warmbad and Waterberg. The overlapping supply area is Lowveld North-East.
The MTS substations at their generation connection capacities are listed alphabetically by supply area in Chapter 6.
GCCA-2016 © Eskom 2013 11
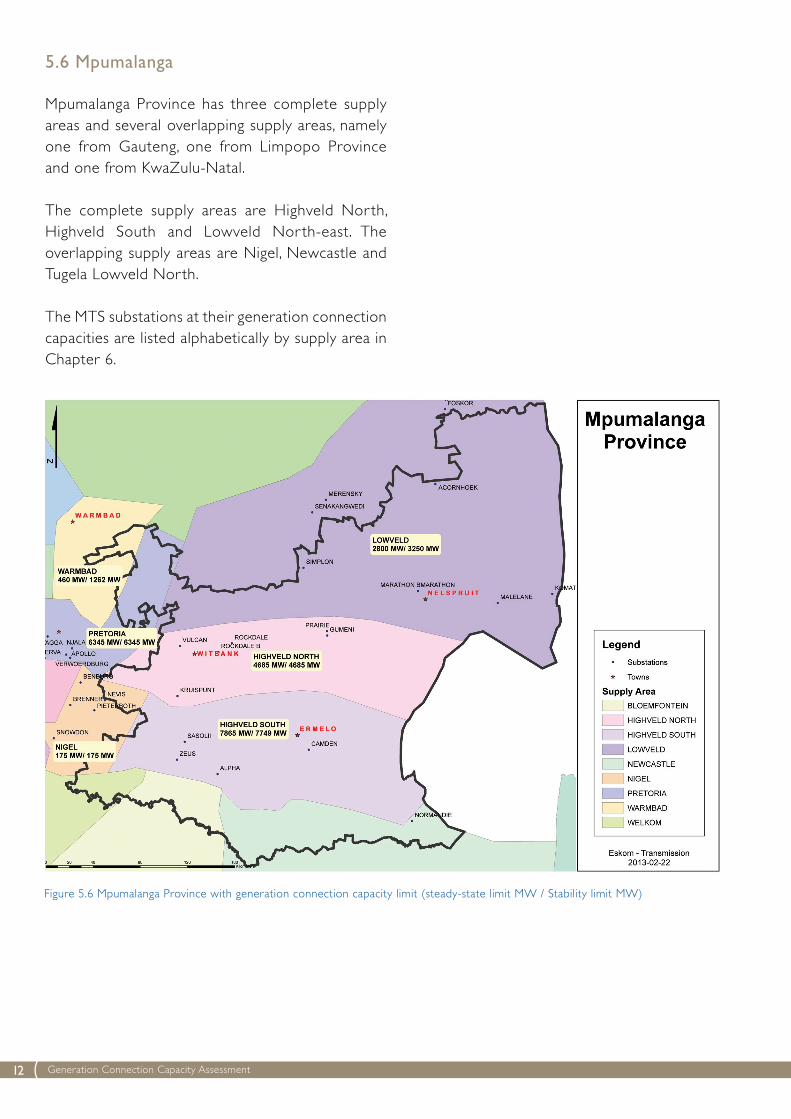
Figure 5.6 Mpumalanga Province with generation connection capacity limit (steady-state limit MW / Stability limit MW)
5.6 Mpumalanga
Mpumalanga Province has three complete supply areas and several overlapping supply areas, namely one from Gauteng, one from Limpopo Province and one from KwaZulu-Natal.
The complete supply areas are Highveld Nor th, Highveld South and Lowveld Nor th-east. The overlapping supply areas are Nigel, Newcastle and Tugela Lowveld North.
The MTS substations at their generation connection capacities are listed alphabetically by supply area in Chapter 6.
Generation Connection Capacity Assessment12

Figure 5.7 North West Province with generation connection capacity limit (steady-state limit MW / Stability limit MW)
5.7 North West Province
North West Province has two complete supply areas and no overlapping supply areas. The complete supply areas are Rustenburg and Carltonville.
The MTS substations at their generation connection capacities are listed alphabetically by supply area in Chapter 6.
GCCA-2016 © Eskom 2013 13

Figure 5.8 Northern Cape Province with generation connection capacity limit (steady-state (N-1) limit MW / Stability limit MW)
5.8 Northern Cape
The Northern Cape Province has three complete supply areas and two overlapping supply areas from the Western Cape Province. The complete supply areas are Kimberley, Karoo and Namaqualand. The overlapping supply areas are the Western Coast and Southern Cape.
The MTS substations at their generation connection capacities are listed alphabetically by supply area in Chapter 6.
Please note that the Victoria, Komsberg, Kronos and Helios substations are only 400-kV series capacitor switching stations.
The MTS substations at their generation connectioncapacities are listed alphabetically by supply area in Chapter 6.
Generation Connection Capacity Assessment14

Figure 5.9 Western Cape Province with generation connection capacity limit (steady-state (N-1) limit MW / Stability limit MW)
5.9 Western Cape
The Western Cape Province has three complete supply areas and no overlapping supply areas. The complete supply areas are Peninsula, Western Cape and Southern Cape.
The MTS substations at their generation connection capacities are listed alphabetically by supply area in Chapter 6.
Please note that the Komsberg substation is only a 400-kV series capacitor switching station and that the Kappa (Koruson) and Omega (Sterrekus) substations are the new 765-/400-kV substations.
GCCA-2016 © Eskom 2013 15

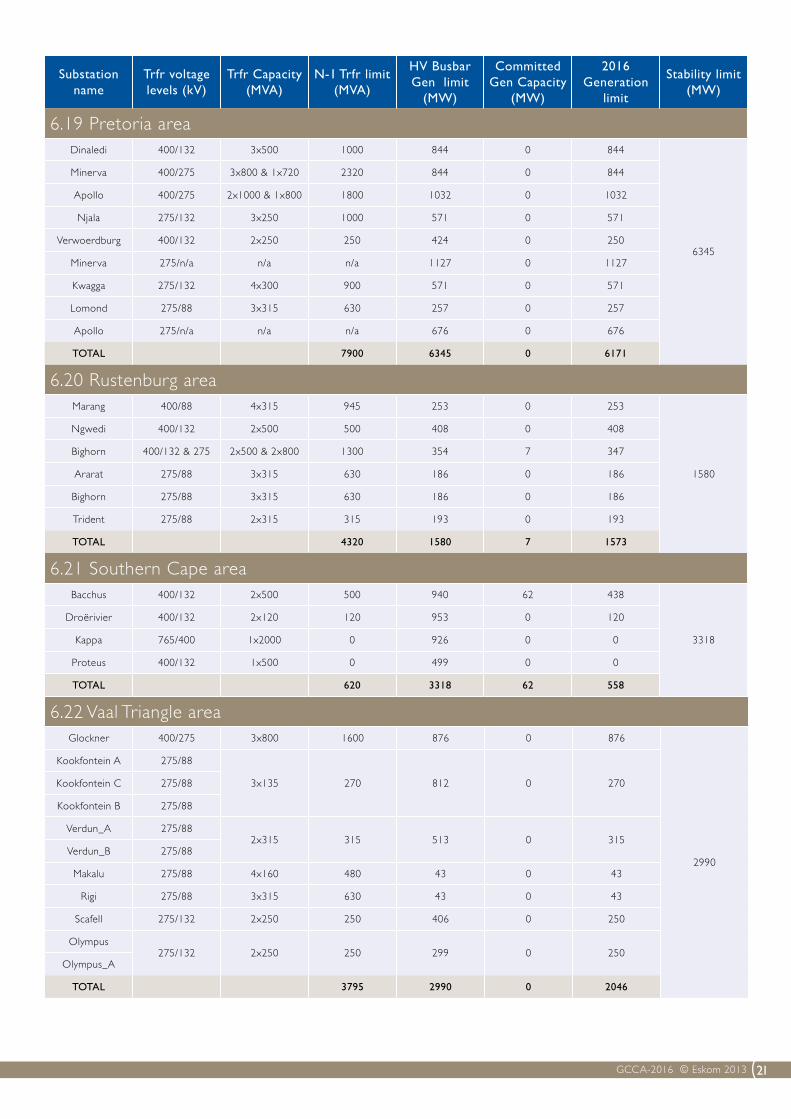
6 Generation Connection Capacity by Supply AreaThe MTS substations are grouped by supply area and listed alphabetically in a single table for each supply area. The tables provide the transformer voltage levels, the 2016 installed transformer capacity, the N-1 transformer MVA level, the calculated HV busbar generation limit in MW and the committed new generation to be connected by 2016 per substation. Then the available generation connection capacity of each substation is given in MW, referred to as the “2016 Generation Limit” in the table, taking into account the committed generation. Then the capacities are totalled to give the overall area steady-state (N-1) limit for the supply area.
“2016 Generation limit” = [the lower of the “Trfr N-1 limit” or “HV Busbar Gen limit”] – [Committed Gen Capacity]
The final column indicates the system stability limit in MW for the whole supply area.
The geographic location of the committed generation, the RE IPP Round 1 and 2 preferred bidders is given in Appendix A.
In some substations, transformers will have to be introduced to either increase the capacity or to introduce an MV voltage (132 kV) for IPP integration. The total area steady-state (N-1) limit (i.e. the HV busbar generation limit total) and the system stability limit for a supply area indicate the following:
• If the total area 2016 Generation limit > stability limit then the supply area network has stability constraints and therefore the area’s stability studies will be critical before a large amount of generation is connected in the entire area.
• If the total area 2016 Generation limit < stability limit then the supply area has thermal or voltage limits which have to be resolved in order to connect more generation and the area does not have stability constraints.
The supply area tables are listed alphabetically. Please note that in the case of 765-/400-kV substations, the HV busbar generation limit refers to the 400-kV busbar.
Substation name
Trfr voltage levels (kV)
Trfr Capacity (MVA)
N-1 Trfr limit (MVA)
HV Busbar Gen limit
(MW)
Committed Gen Capacity
(MW)
2016 Generation
limit
Stability limit (MW)
6.1 Bloemfontein areaBeta 765/400 2x2000 2000 884 0 884
4745
Harvard 275/132 2x500 500 701 64 436
Merapi 275/132 2x250 250 472 0 250
Perseus 400/275 2x400 & 1x800 800 808 0 800
TOTAL 3550 2865 64 2370
Generation Connection Capacity Assessment16

Substation name
Trfr voltage levels (kV)
Trfr Capacity (MVA)
N-1 Trfr limit (MVA)
HV Busbar Gen limit
(MW)
Committed Gen Capacity
(MW)
2016 Generation
limit
Stability limit (MW)
6.2 Carltonville areaMidas 400/132 2x500 500 243 0 243
2300
Pluto 400/275 2x750 750 367 0 367
Hermes 400/132 3x500 1000 243 0 243
Mercury 400/132 2x500 500 311 0 311
Carmel_A 275/1322x500 500 90 0 90
Carmel_B 275/132
Watershed275/132 &
275/882x315 & 1x250 315 136 0 136
TOTAL 3565 1390 0 1390
6.3 East London Bisho areaNeptune 400/132 2x500 500 790 0 500
3898
Vuyani 400/132 2x250 250 1079 0 250
Delphi 400/132 2x120 120 967 97 23
Pembroke 220/132 & 66 2x250 & 2x90 340 310 21 289
TOTAL 1210 3145 118 1062
6.4 Empangeni areaInvubu 400/275 3x800 1600 427 0 427
2115
Invubu 275/n/a n/a n/a 445 0 445
Rabbit 275/33 n/a n/a 319 0 319
Impala 275/33 4x250 750 436 0 436
Athene 400/275 & 132 4x500 1500 418 0 418
TOTAL 3850 2045 0 2045
6.5 Highveld North areaGumeni 400/132 1x500 0 1193 0 0
4685
Vulcan 400/1322x500 & 2x300
& 1x2501350 1561 0 1350
Rockdale 400/132 2x500 500 708 0 500
Kruispunt 275/132 4x250 750 206 0 206
Rockdale_1 275/132 2x500 500 256 0 256
Prairie 275/132 2x240 240 507 0 240
Rockdale_2 275/132 n/a n/a 256 0 256
TOTAL 3340 4685 0 2808
6.6 Highveld South areaSol 400/132 4x500 1500 203 0 203
7749Zeus 765/400 3x2000 4000 4287 0 4000
Alpha 765/400 3x2000 4000 3375 0 3375
TOTAL 9500 7865 0 7578
GCCA-2016 © Eskom 2013 17

Substation name
Trfr voltage levels (kV)
Trfr Capacity (MVA)
N-1 Trfr limit (MVA)
HV Busbar Gen limit
(MW)
Committed Gen Capacity
(MW)
2016 Generation
limit
Stability limit (MW)
6.10 Ladysmith areaVenus 400/275 2x800 800 707 0 707
3261
Tugela 275/132 2x180 180 371 4 176
Venus 275/N/A n/a n/a 531 0 531
Danskraal 275/132 2x125 125 298 0 125
Bloukrans 275/132 2x250 250 444 0 250
TOTAL 1355 2350 4 1789
6.7 Johannesburg areaLulamisa 400/88 3x315 630 217 0 217
4315
Craighall 275/88 3x315 630 281 0 281
Jupiter 275/88 3x180 360 221 0 221
Simmerpan 275/88 2x180 180 261 0 180
Croydon 275/132 3x250 500 225 0 225
Esselen275/132 &
275/882x180 & 1x250
& 2x315925 389 0 389
Northrand 275/132 2x500 500 393 0 393
Eiger 275/88 3x315 630 229 0 229
Lepini 275/88 4x315 945 357 0 357
Quattro 275/132 2x132 500 245 0 245
TOTAL 5800 2815 0 2734
6.8 Karoo areaHydra 400/220 2x315 315
5270 315
2398
400/132 2x240 240 391 -151
Ruigtevallei 220/132 & 66 1x250 0 28 70 -70
Roodekuil 220/66 1x125 0 43 0 0
Hydra 220/N/A n/a n/a 73 0 73
TOTAL 555 670 461 167
6.9 Kimberly areaMookodi 400/132 2x250 250 210 0 210
2580
Ferrum 400/132 2x500 500 176 149 27
Olien 275/132 2x150 150 143 139 4
Boundary 275/132 2x250 250 140 96 44
Ferrum 275/132 2x250 250 118 0 118
Garona 275/132 1x125 0 44 109 -109
TOTAL 1400 830 493 293
Generation Connection Capacity Assessment18

Substation name
Trfr voltage levels (kV)
Trfr Capacity (MVA)
N-1 Trfr limit (MVA)
HV Busbar Gen limit
(MW)
Committed Gen Capacity
(MW)
2016 Generation
limit
Stability limit (MW)
6.11 Lowveld areaMerensky 400/275 & 132 2x 800 & 1x500 0 395 0 0
3250
Marathon B 400/275 1x800 0 47 0 0
Simplon 275/132 2x250 250 124 0 124
Foskor 275/132 3x250 500 260 0 260
Archonhoek 275/132 3x125 250 328 0 250
Malelane 275/132 1x250 0 302 0 0
Marathon 275/132 2x500 500 557 0 500
Senakangwedi 275/33 3x180 360 175 0 175
Merensky 275/132 2x250 250 421 0 250
Komatipoor t 275/132 2x125 125 192 0 125
TOTAL 2235 2800 0 1683
6.12 Namaqualand areaAries 400/22 1x45 0 116 10 -10
1235
Aggeneis 400/220 2x315 315 121 0 121
Oranjemond 220/66 2x80 80 33 0 33
Gromis 220/66 2x40 80 33 0 33
Nama 220/66 2x80 80 37 0 37
Aggeneis 220/66 2x80 80 98 0 80
Paulputs 220/132 1x125 0 33 120 -120
TOTAL 635 470 130 174
6.13 Newcastle areaUmfolozi 400/88 2x160 160 304 0 160
1498
Chivelston 400/275 1x800 0 252 0 0
Incandu 400/132 1x500 & 2x315 630 230 0 230
Normandi 400/132 & 88 2x250 & 2x160 570 178 0 178
Bloedrivier 275/88 2x160 160 178 0 160
Ingangane 275/88 2x160 570 215 0 160
Chivelston 275/n/a n/a n/a 141 0 141
TOTAL 1680 1496 0 1028
6.14 Nigel areaPieterboth 275/88 2x315 315 27 0 27
175
Snowdon 275/88 3x160 320 16 0 16
Brenner 275/88 3x315 630 38 0 38
Benburg 275/88 3x250 500 61 0 61
Nevis 275/132 2x500 500 33 0 33
TOTAL 2265 175 0 175
GCCA-2016 © Eskom 2013 19

6.18 Por t Elizabeth area
Poseidon400/220 1x500 0
8810 0
3523
400/220 & 132 2x500 500 161 339
Grassridge 400/132 2x500 500 905 393 107
Dedisa 400/132 2x500 500 797 0 500
Poseidon220/132 2x125 125 329 0 125
220/66 1x80 & 1x40 0 0 0 0
Grassridge 220/132 2x360 360 413 0 360
TOTAL 1985 3325 554 1431
Substation name
Trfr voltage levels (kV)
Trfr Capacity (MVA)
N-1 Trfr limit (MVA)
HV Busbar Gen limit
(MW)
Committed Gen Capacity
(MW)
2016 Generation
limit
Stability limit (MW)
6.15 Peninsula areaStikland 400/132 2x500 500 512 0 500
3251
Acacia 400/132 3x500 1000 706 0 706
Philippi 400/132 3x500 1000 706 0 706
Omega (Sterrekus)
765/400 1x2000 0 544 0 0
Muldersvlei 400/132 3x500 1000 706 135 571
TOTAL 3500 3251 135 2484
6.16 Pinetown areaMersey 400/275 3x800 1600 1093 0 1093
5466
Ariadne 400/132 3x250 500 473 0 473
Hector 400/275 2x500 500 562 0 500
Klaarwater 275/132 3x800 1600 309 0 309
Georgedale 275/132 4x315 945 688 0 688
Mersey 275/132 3x250 500 271 0 271
Avon 275/132 3x250 500 549 0 500
Hector 275/n/a n/a n/a 182 0 182
Eros 275/132 2x500 500 713 0 500
Illovo 275/132 2x250 250 511 0 250
TOTAL 6895 5350 0 4765
6.17 Polokwane areaBorutho 400/132 2x500 500 97 0 97
735
Leseding 400/132 2x500 500 85 0 85
Tabor 400/132 1x500 0 73 28 -28
Witkop 400/275 & 132 2x400 3x500 1000 95 30 65
Tabor 275/132 2x250 250 58 0 58
Witkop 275/N/A 2x400 400 56 0 56
Spencer 275/132 2x250 250 56 0 56
TOTAL 2900 520 58 390
Generation Connection Capacity Assessment20
Substation name
Trfr voltage levels (kV)
Trfr Capacity (MVA)
N-1 Trfr limit (MVA)
HV Busbar Gen limit
(MW)
Committed Gen Capacity
(MW)
2016 Generation
limit
Stability limit (MW)
6.19 Pretoria areaDinaledi 400/132 3x500 1000 844 0 844
6345
Minerva 400/275 3x800 & 1x720 2320 844 0 844
Apollo 400/275 2x1000 & 1x800 1800 1032 0 1032
Njala 275/132 3x250 1000 571 0 571
Verwoerdburg 400/132 2x250 250 424 0 250
Minerva 275/n/a n/a n/a 1127 0 1127
Kwagga 275/132 4x300 900 571 0 571
Lomond 275/88 3x315 630 257 0 257
Apollo 275/n/a n/a n/a 676 0 676
TOTAL 7900 6345 0 6171
6.20 Rustenburg areaMarang 400/88 4x315 945 253 0 253
1580
Ngwedi 400/132 2x500 500 408 0 408
Bighorn 400/132 & 275 2x500 & 2x800 1300 354 7 347
Ararat 275/88 3x315 630 186 0 186
Bighorn 275/88 3x315 630 186 0 186
Trident 275/88 2x315 315 193 0 193
TOTAL 4320 1580 7 1573
6.21 Southern Cape areaBacchus 400/132 2x500 500 940 62 438
3318
Droërivier 400/132 2x120 120 953 0 120
Kappa 765/400 1x2000 0 926 0 0
Proteus 400/132 1x500 0 499 0 0
TOTAL 620 3318 62 558
6.22 Vaal Triangle areaGlockner 400/275 3x800 1600 876 0 876
2990
Kookfontein A 275/88
3x135 270 812 0 270Kookfontein C 275/88
Kookfontein B 275/88
Verdun_A 275/882x315 315 513 0 315
Verdun_B 275/88
Makalu 275/88 4x160 480 43 0 43
Rigi 275/88 3x315 630 43 0 43
Scafell 275/132 2x250 250 406 0 250
Olympus275/132 2x250 250 299 0 250
Olympus_A
TOTAL 3795 2990 0 2046
GCCA-2016 © Eskom 2013 21
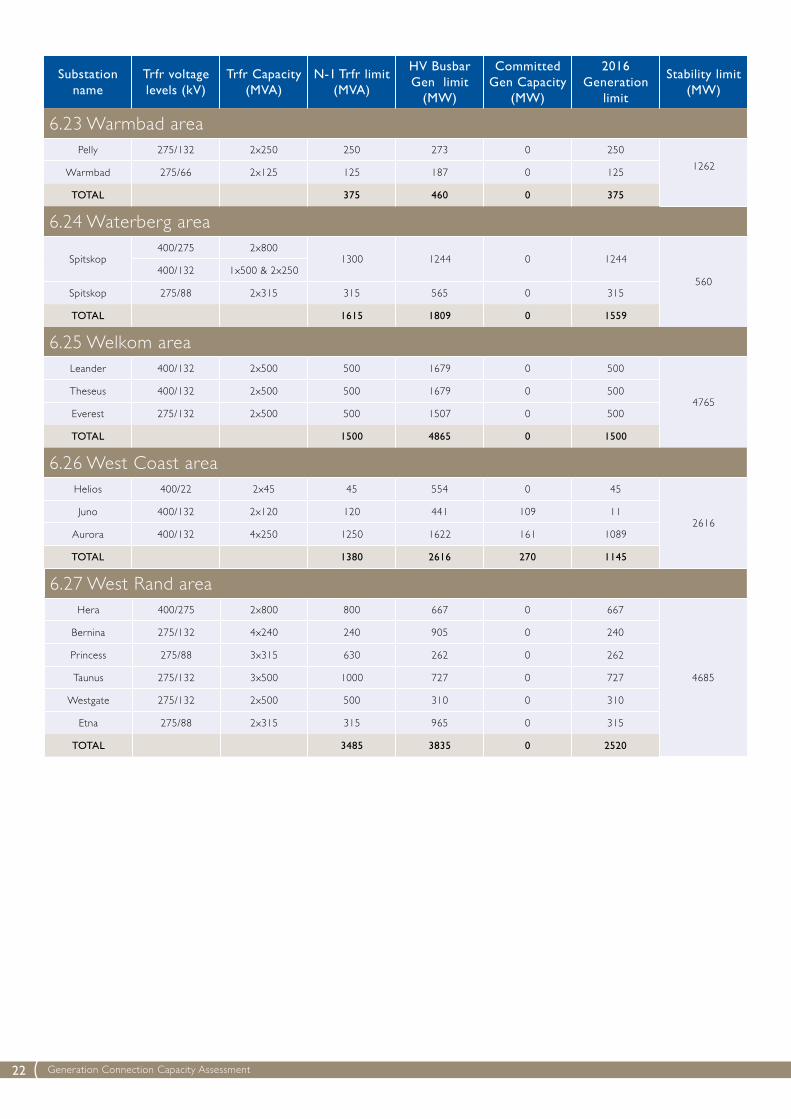
6.27 West Rand areaHera 400/275 2x800 800 667 0 667
4685
Bernina 275/132 4x240 240 905 0 240
Princess 275/88 3x315 630 262 0 262
Taunus 275/132 3x500 1000 727 0 727
Westgate 275/132 2x500 500 310 0 310
Etna 275/88 2x315 315 965 0 315
TOTAL 3485 3835 0 2520
Substation name
Trfr voltage levels (kV)
Trfr Capacity (MVA)
N-1 Trfr limit (MVA)
HV Busbar Gen limit
(MW)
Committed Gen Capacity
(MW)
2016 Generation
limit
Stability limit (MW)
6.23 Warmbad areaPelly 275/132 2x250 250 273 0 250
1262Warmbad 275/66 2x125 125 187 0 125
TOTAL 375 460 0 375
6.24 Waterberg area
Spitskop400/275 2x800
1300 1244 0 1244
560400/132 1x500 & 2x250
Spitskop 275/88 2x315 315 565 0 315
TOTAL 1615 1809 0 1559
6.25 Welkom areaLeander 400/132 2x500 500 1679 0 500
4765Theseus 400/132 2x500 500 1679 0 500
Everest 275/132 2x500 500 1507 0 500
TOTAL 1500 4865 0 1500
6.26 West Coast area Helios 400/22 2x45 45 554 0 45
2616Juno 400/132 2x120 120 441 109 11
Aurora 400/132 4x250 1250 1622 161 1089
TOTAL 1380 2616 270 1145
Generation Connection Capacity Assessment22

6.28 Large-Area Integration Stability Limits
The simultaneous integration of generation at HV busbars in the areas that are grouped together as indicted in the table below, was simulated to derive a stability limit for wide-area integration.
Simulations were done for each area individually. The stability limit given is a good indicator of the highest possible integration limit if no restrictions are imposed by network overloading in an area.
Larger area Transmission supply areas Stability limit (MW)
KwaZulu-Natal Empangeni, Ladysmith, Newcastle, Pinetown 17 000
CapeKimberley, East London, Karoo, Por t Elizabeth, Peninsula, Namaqualand, Southern Cape and
West Coast15 000
Limpopo and North WestPolokwane, Waterberg, Warmbad, Rustenburg
and Carltonville10 000
Figure 6.28 Geographic location of larger areas and the stability limits
GCCA-2016 © Eskom 2013 23

Generation Connection Capacity Assessment24
7 High-Level Connection Estimates
Appendix A: Renewable Energy IPPs - Round 1 and 2 Preferred Bidders
The location and Generation Connection Capacity of the closest MTS substation will give a developer some indication of what will be required to connect his/her proposed generation plant to the Eskom Transmission Grid. If the MW output of the generation plant is less than or about the same as the Generation Connection Capacity of the relevant MTS substation, the connection requirements would probably be only a shallow connection. If the MW output exceeds the Generation Connection Capacity, some form of transmission reinforcement would probably be required and Eskom should be engaged to discuss the potential integration requirements of the project.
Consulting engineers and equipment manufacturers or suppliers can provide some unit costs of the transmission infrastructure for the simple calculation of estimates, so as to provide an order-of-magnitude value of the cost of a possible shallow connection. Eskom can also provide a free cost-estimate letter (non-binding) for all IPPs that apply to Eskom for connection. The cost-estimate letter will provide an indicative cost which is non-binding, but will give the IPP a good indication of the costs.
Appendix A: Renewable Energy IPPs - Round 1 and 2 Preferred Bidders


Eskom Transmission Division
Megawatt Park Maxwell Drive Sunninghill SandtonPO Box 1091 Johannesburg 2000 SA
www.eskom.co.za
Eskom Holdings SOC Limited Reg No 2002/015527/06