Generating evidence- based conclusion without complete ...
54
Generating evidence- based conclusion without complete biological knowledge
Transcript of Generating evidence- based conclusion without complete ...

Generating evidence-based conclusion without complete biological knowledge

adapted from: https://cebma.org/faq/scientific-evidence/
What is meant by evidence from the scientific literature
Evidence in general means information, facts or data supporting (or contradicting) a claim, prediction assumption or hypothesis.
When referring to “evidence from the scientific literature”, people generally mean the empirical studies published in peer-reviewed scholarly journals.
But not only the scientific literature is relevant to science-based evidence. Many government and non-governmental reports are also relevant (e.g., The Intergovernmental Panel on Climate Change (IPCC) from the United Nations).

Types of scientific evidence
Source: https://www.sciencemediacentre.co.nz/coveringscience/types-of-scientific-evidence/

Humans are predominantly right handed. Do other animals exhibit handedness as well? Bisazza et al. (1996) tested this possibility on the common toad.
They sampled (randomly) 18 toads from the wild. They wrapped a balloon around each individual’s head and recorded which forelimb each toad used to remove the balloon.
Statistical hypothesis testing as a quantitative framework to generate evidence for or against a biological phenomenon

What is a research hypothesis?!
A hypothesis is a supposition or proposed explanation made on the basis of limited evidence as a starting point for further investigation (Oxford dictionary); e.g.,
“animals, other than humans, also have a preferred limb (handedness)”.
Hypotheses [plural form] can be thought as educated guesses that have not been supported by data yet.
Hypotheses cannot be proven right or wrong from the data. Hypotheses can be said to be either supported (or not supported) by the data at hands (and can be potentially refuted by future data).

Hypotheses, Theories and Laws: three different components
Research hypotheses cannot be proven right or wrong from the data. Hypotheses can be said to be either supported by the data at at hands (and can be potentially refuted by future data).
Strong research evidence is generated when several studies support (or refute) a particular hypothesis.
“A hypothesis is an idea that is offered or assumed with the intent of being tested. A theory is intended to explain processes already supported or substantiated by data and experimentation” (Marshall Sheperd):https://www.forbes.com/sites/marshallshepherd/2019/06/15/theory-hypothesis-and-law-debunking-a-climate-change-contrarian-tactic/#37a3ce047ca7.
A scientific theory is a well-substantiated explanation for why something (a natural phenomenon) happens. And a scientific law (gravity) describes what happens (objects fall towards the ground).

Tackling research hypotheses using the framework of statistical hypothesis testing
The statistical hypothesis framework (most often involving statistical testing) is a quantitative method of statistical inference that allows to generate evidence for or against a research hypothesis.
The research hypothesis is translated into a statistical question. The statistical question is then stated as two mutually exclusive hypotheses called null hypothesis (H0) and alternative hypothesis (H1 or HA).
The framework most often involves estimating a probability value that serves as a quantitative indicator of support for or against the research hypothesis (e.g., generate evidence for or against handedness in toads).

Humans are predominantly right handed. Do other animals exhibit handedness as well? Bisazza et al. (1996) tested this possibility on the common toad.
They sampled (randomly) 18 toads from the wild. They wrapped a balloon around each individual’s head and recorded which forelimb each toad used to remove the balloon.
Translating the research question into a statistical question:
Do right-handed and left-handed toads occur with equal frequency in the toad (statistical) population, or is one type more frequent than the other?
RESULTS: 14 toads were right-handed and four were left-handed. Are these results sufficient to generate evidence of handedness in toads?
Back to statistically testing the hypothesis of handedness

Right Right Left Left
RightRight Left Left
Right Right Left Left
RightRight Left Left
Right Right Left Left
RightRight Left Left
You can generate evidence for or against a hypothesis (handedness) using a computational thought experiment based on paper and a bag. All you need is to assume a particular hypothesis as true (null hypothesis) and then reject it (or not) is support of an alternative hypothesis!
TODAY: A road map for understanding evidence-based conclusions without complete knowledge
The intuition behind the framework of statistical hypothesis testing
Null hypothesis (H0): the proportion of right- and left-handed toads in the population ARE equal.
Alternative hypothesis (HA): the proportion of right- and left-handed toads in the population ARE NOT equal.
Statistical hypothesis testing versus estimation
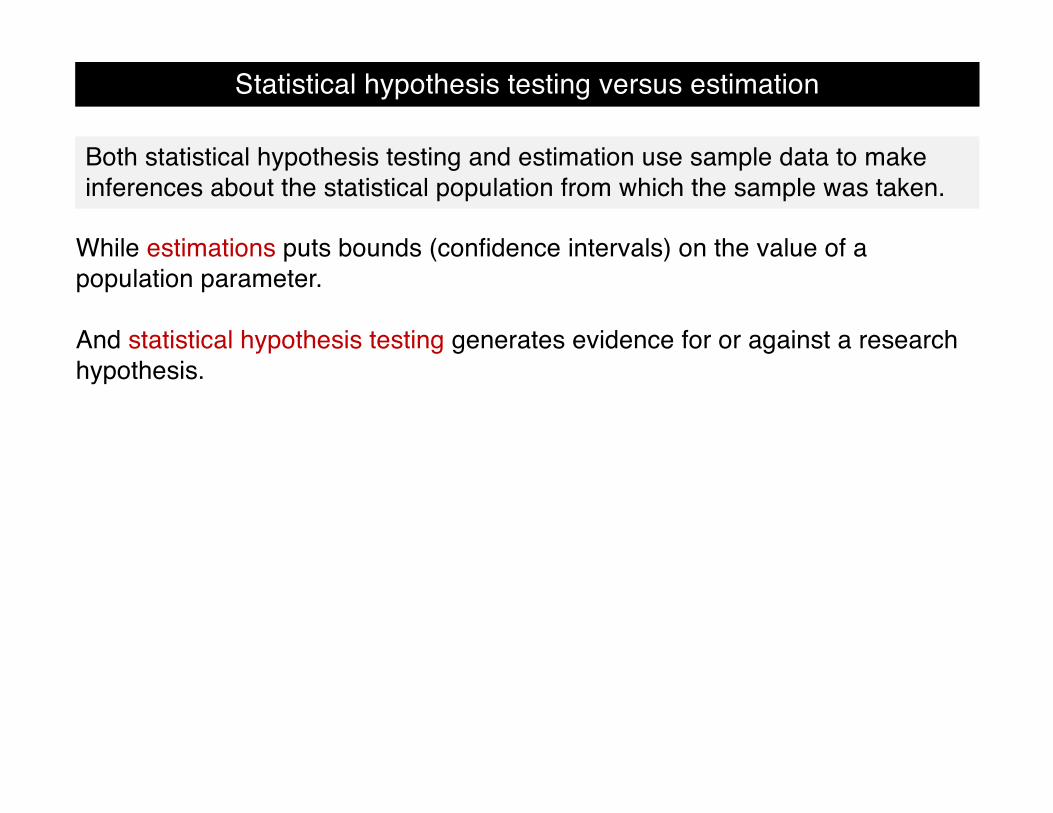
Both statistical hypothesis testing and estimation use sample data to make inferences about the statistical population from which the sample was taken.
While estimations puts bounds (confidence intervals) on the value of a population parameter.
And statistical hypothesis testing generates evidence for or against a research hypothesis.

Statistical hypothesis testing versus estimation
Both statistical hypothesis testing and estimation use sample data to make inferences about the statistical population from which the sample was taken.
While estimations puts bounds (confidence intervals) on the value of a population parameter.
And statistical hypothesis testing generates evidence for or against a research hypothesis.
Statistical hypothesis testing asks whether the observed sample value for a given test statistic (i.e., data summary) differs from a specific “null” expectation (null hypothesis) based on the sampling distribution of the same test statistic for a theoretical statistical population assuming a particular theoretical parameter.
Test statistic or Data summary: the proportion of right- and left-handed toads in the population.
Null expectation: the proportion of right- and left-handed toads in the population ARE EQUAL. The null expectation is set in such a way that a sampling distribution for the test statistic can be generated under that expectation.
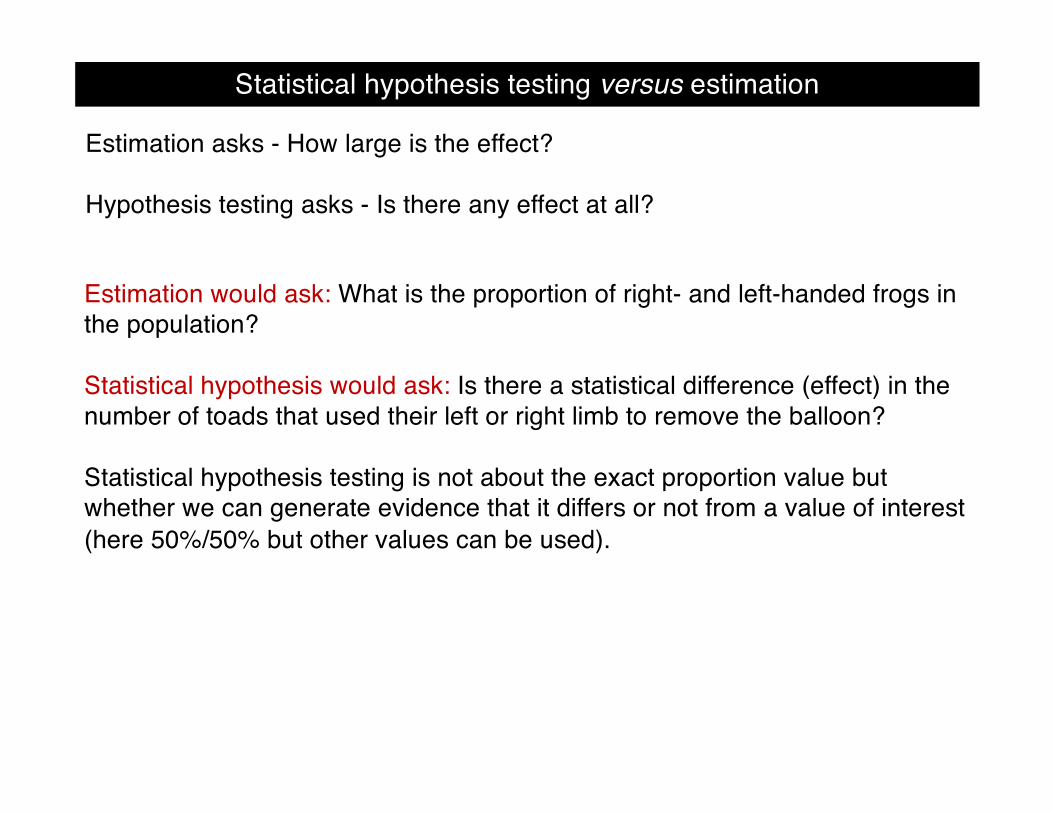
Estimation would ask: What is the proportion of right- and left-handed frogs in the population?
Statistical hypothesis would ask: Is there a statistical difference (effect) in the number of toads that used their left or right limb to remove the balloon?
Statistical hypothesis testing is not about the exact proportion value but whether we can generate evidence that it differs or not from a value of interest (here 50%/50% but other values can be used).
Statistical hypothesis testing versus estimation
Estimation asks - How large is the effect?
Hypothesis testing asks - Is there any effect at all?

Statistical hypothesis testing versus estimation
55% right-handed 95% right-handed
75%
Estimation thinking: We are 95% confident that the true proportion of right-handed toads is between 55% and 95% of the individuals in the population.
Statistical hypothesis thinking: We are confident that the true proportion of right-handed toads is not likely to be in equal proportion (50% right- and 50% left-handed).
Instead of stating what the value is likely (estimation), we state what the value is likely not (hypothesis testing)!

Statistical hypothesis thinking: We are confident that the true proportion of right-handed toads is not likely to be in equal proportion (50% right- and 50% left-handed).
Instead of stating what the value is likely (estimation), we state what the value is likely not (statistical hypothesis testing)!
In statistical hypothesis testing, one quantifies how unusual the observed sample data (4/18 left or 14/18 right) is in contrast to the assumption that they are 50%/50%
This is done by contrasting the observed number of right-handed individuals against a sampling distribution of number of right-handed toads for a theoretical statistical population where the proportion is truly 50%).
Statistical hypothesis testing: generating evidence-based conclusion without complete biological knowledge

Is the sample proportion of right-handed (14/18 = 0.78) and right-handed (4/18 = 0.22) toads really different from what would expected from a statistical population of toads that would have a proportion equal to 0.5?
Remember that samples vary due to sampling variation. Because of the effects of chance during sampling, we don’t really expect to see exactly nine right-handed and nine left-handed toads when we sample from a statistical population in which 50%/50% are truly left/right handed!
So, how can we generate evidence that 14 right-handed frogs against 4 left-handed frogs is statistically different from 0.5?
Statistical hypothesis testing: generating evidence-based conclusion without complete biological knowledge

wake up
@cjlortie
Let’s take a break - 2 minutes

You can generate evidence for or against a hypothesis (handedness) even using paper and a bag. All you need is to assume a particular hypothesis as true (null hypothesis) and then reject it (or not) in support of the alternative hypothesis!
The intuition behind the framework of statistical hypothesis testing
Statistical theoretical population where 50%of observational units (toads) are left-handed and 50% right-handed. Thistheoretical population is mathematicallyinfinite.
Take one observational unit (pieceof paper) randomly at the time(close eyes and take a paper) out ofthe bag, write it down whether a leftor right and return to the bag (i.e.,sampling with replacement*. Repeatthis 18 times (i.e., number of toadsused by the toad study (Bisazza etal. 1996).
*Resampling is important to assure that the selection ofobservational units in the population (e.g., individualpiece of paper here) must be independent, i.e., theselection of any unit (e.g., L or R) of the populationmust not influence the selection of any other unit.
1 sample: 14 R & 4 L2 sample: 8 R & 10 L...Large number of samples (~Infinite)
sampling distribution for the test statistic of interest for the
theoretical statistical population
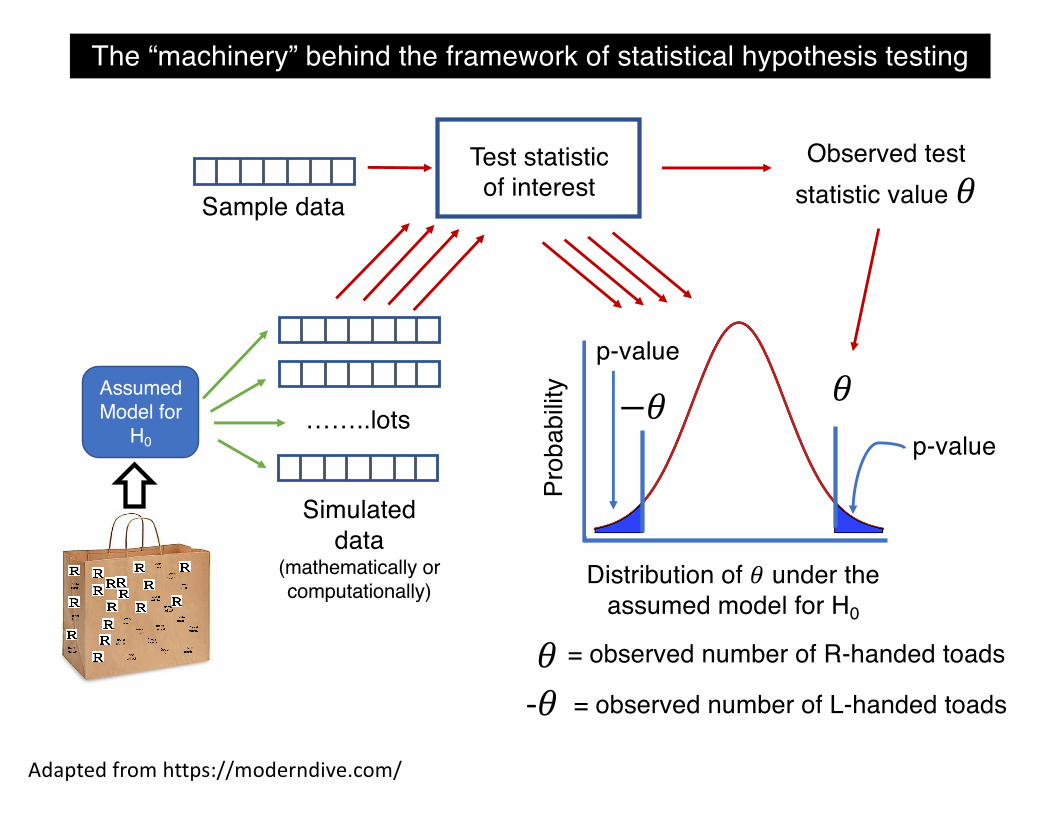
Adapted from https://moderndive.com/
Sample data
Test statisticof interest
Observed test statistic value 𝜃
……..lots
Simulated data
(mathematically or computationally)
Assumed Model for
H0
Distribution of 𝜃 under the assumed model for H0
Prob
abilit
y
−𝜃 𝜃
𝜃
The “machinery” behind the framework of statistical hypothesis testing
= observed number of R-handed toads
-𝜃
p-value
p-value
= observed number of L-handed toads
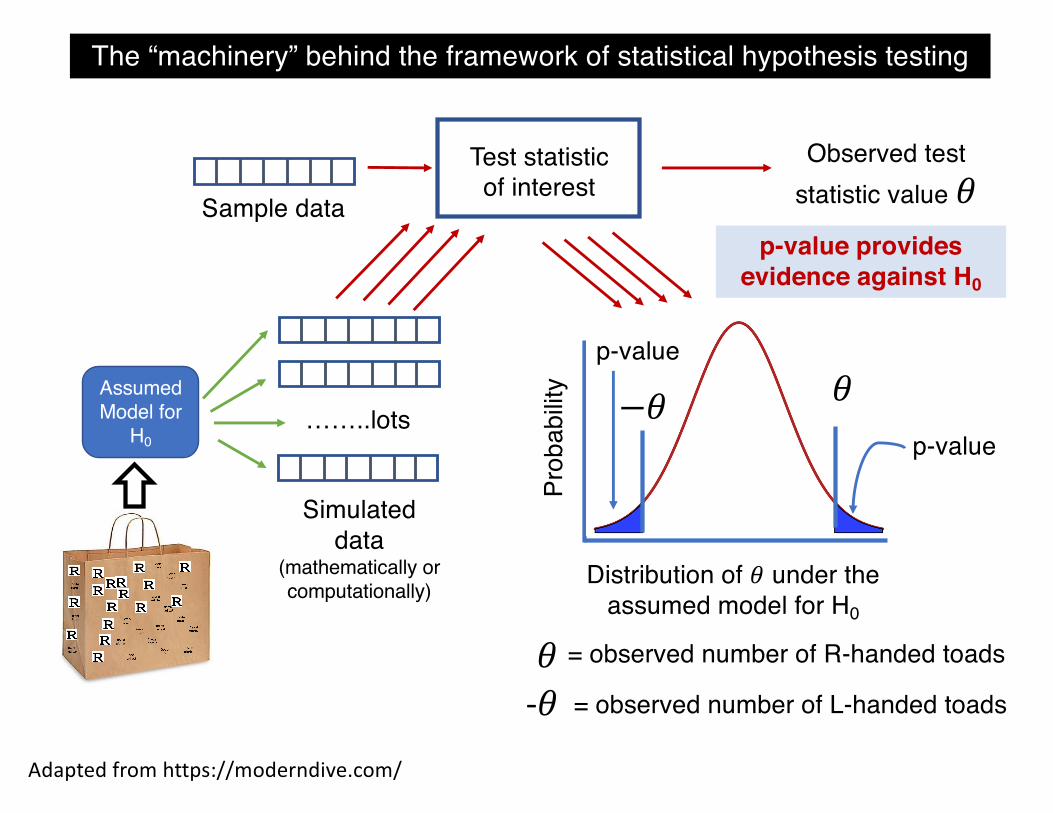
Adapted from https://moderndive.com/
Sample data
Test statisticof interest
……..lots
Simulated data
(mathematically or computationally)
Assumed Model for
H0
Distribution of 𝜃 under the assumed model for H0
Prob
abilit
y
−𝜃 𝜃
The “machinery” behind the framework of statistical hypothesis testing
p-value
p-value
p-value provides evidence against H0
𝜃 = observed number of R-handed toads
-𝜃 = observed number of L-handed toads
Observed test statistic value 𝜃

The “machinery” behind the framework of statistical hypothesis testing
p-value provides evidence against H0
P-values = (i.e., assuming a theoretical population (model) where 50% of individuals are left-handed and 50% right-handed). How many samples in the frequency distribution (probability distribution) were equal or greater than the observed AND equal or smaller than the observed.
The P-value is the probability of obtaining results at least as extreme as the results actually observed assuming the H0 as true.

Assumed theoretical population under H0

Number of right-handed toads
Probability of those samples
0 0.000004
1 0.00007
2 0.0006
3 0.0031
4 0.0117
5 0.0327
6 0.0708
7 0.1214
8 0.1669
9 0.1855
10 0.1669
11 0.1214
12 0.0708
13 0.0327
14 0.0117
15 0.0031
16 0.0006
17 0.00007
18 0.000004
Total 1.0
How many samples contain 0 right-handed toads and 18 left-handed toads? 0.000004 or 0.0004%.
If we had drawn 1000000 samples from the population assumed under H0, only 4 would had been 0 right-handed and only 4 would had been 18 right-handed (the distribution is obviously symmetric), i.e., P = 0.000004.
Sampling distribution for the test statistic of interest for the theoretical statistical population
1 sample: 14 R & 4 L2 sample: 8 R & 10 L...Large number of samples (~Infinite)

Number of right-handed toads
Probability of those samples
0 0.000004
1 0.00007
2 0.0006
3 0.0031
4 0.0117
5 0.0327
6 0.0708
7 0.1214
8 0.1669
9 0.1855
10 0.1669
11 0.1214
12 0.0708
13 0.0327
14 0.0117
15 0.0031
16 0.0006
17 0.00007
18 0.000004
Total 1.0
How many samples contain 0 right-handed toads and 18 left-handed toads? 0.000004 or 0.0004%.
How many samples contain 8 right-handed toads and 10 left-handed toads? 0.1669 or 16.69%
If we had drawn 1000000 samples from the population assumed under H0, 166900 would had been 8 right-handed and 10 left-handed.
Sampling distribution for the test statistic of interest for the theoretical statistical population
1 sample: 14 R & 4 L2 sample: 8 R & 10 L...Large number of samples (~Infinite)

Number of right-handed toads
Probability
0 0.000004
1 0.00007
2 0.0006
3 0.0031
4 0.0117
5 0.0327
6 0.0708
7 0.1214
8 0.1669
9 0.1855
10 0.1669
11 0.1214
12 0.0708
13 0.0327
14 0.0117
15 0.0031
16 0.0006
17 0.00007
18 0.000004
Total 1.0
Number of right-handed toads (out of 18 frogs)
prob
abili
ty
Pr[14 or more right-handed toads] =Pr[14] + P[15] + P[16] + P[17] + P[18] =0.0155 x 2 (symmetric distribution) = 0.031OR: Pr[14 or more right-handed toads] +
Pr[4 or less right-handed toads] = 0.031
OR: Pr[14 or more left-handed toads] + Pr[14 or less right-handed toads] = 0.031
equa
l or s
mal
ler
sum
[P]=
0.01
55eq
ual o
r gre
ater
sum
[P]=
0.01
55
Observed test statistic value 𝜃 = 4/14

P-values are used as quantitative evidence against a hypothesisof no interest (i.e., the null hypothesis assuming that theparameter for the assumed theoretical population is true. In thiscase, the proportion of right- and left-handed toads being equal).
Decision in statistical hypothesis testing – what do P-values represent?
Pr[14 or more right-handed toads] =Pr[14] + P[15] + P[16] + P[17] + P[18] =
0.0155 x 2 (symmetric distribution) = 0.031
The statistical hypothesis testing framework most often involves estimating a probability value that serves as a quantitative indicator in support of or against the research hypothesis (e.g., generate evidence for or against handedness in toads).

Decision in statistical hypothesis testing – what do P-values represent?
A P-value then estimates how unusual* (i.e., smaller or greater) the observed sample is according to a theoretical population where the number of right- and left-handed toads are the same. The sampling distribution of the theoretical population in the null distribution (under the null hypothesis.
P = 0.031The P-value is the probability of obtaining results at least as extreme as the results actually observed assuming the H0 as true.

Decision in statistical hypothesis testing – what do P-values represent?
A P-value then estimates how unusual* (i.e., smaller or greater) the observed sample is according to a theoretical population where the number of right- and left-handed toads are the same. The sampling distribution of the theoretical population in the null distribution (under the null hypothesis.
P = 0.031
Another way of stating the above is by using the definition of p-value adopted by the American Statistical Association: “The probability under a specified statistical model that a statistical summary of the data would be equal to or more extreme than its observed value.”
Under this definition:
Specified model = Sampling distribution of the same test statistic but based on a theoretical population assuming a particular parameter of interest (e.g., number of right-& left-handed toads are equal).
The P-value is the probability of obtaining results at least as extreme as the results actually observed assuming the H0 as true.

Decision in statistical hypothesis testing – what do P-values represent?
The smallest the P-value, the stronger the evidence against the initial assumption based on the parameter assumed for the theoretical population (i.e., null hypothesis). IMPORTANT: That’s not to say handedness is true but rather that we have strong evidence not to say the contrary (i.e., to say that handedness is not true).
P = 0.031
A P-value then estimates how unusual* (i.e., smaller or greater) the observed sample is according to a theoretical population where the number of right- and left-handed toads are the same.
Decision in statistical hypothesis testing – what do P-values represent?
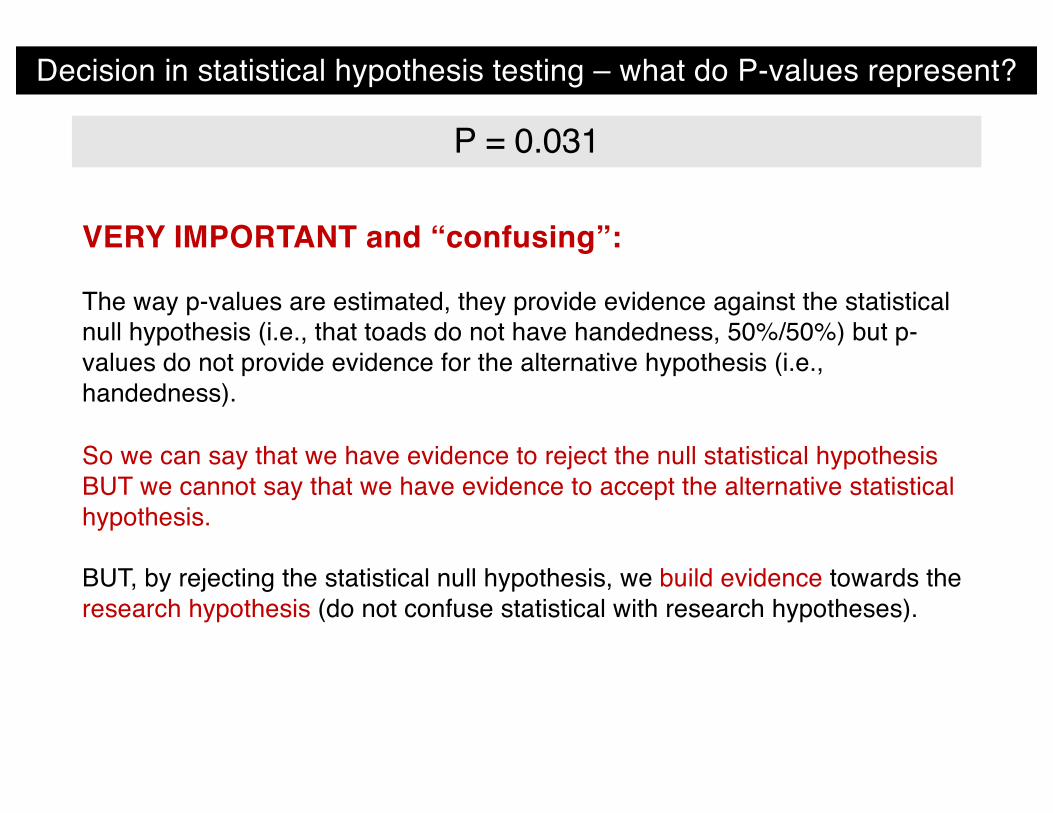
VERY IMPORTANT and “confusing”:
The way p-values are estimated, they provide evidence against the statistical null hypothesis (i.e., that toads do not have handedness, 50%/50%) but p-values do not provide evidence for the alternative hypothesis (i.e., handedness).
So we can say that we have evidence to reject the null statistical hypothesis BUT we cannot say that we have evidence to accept the alternative statistical hypothesis.
BUT, by rejecting the statistical null hypothesis, we build evidence towards the research hypothesis (do not confuse statistical with research hypotheses).
P = 0.031

Decision in statistical hypothesis testing – what do P-values represent?
The smallest the P-values, the stronger the evidence against the initial assumption based on the parameter assumed for the theoretical population (i.e., null hypothesis).
RESULT: Given that the p-value for the toad handedness study was small (P=0.031), there is evidence to reject (refute) our initial assumption of no handedness. Therefore the sample data support the hypothesis of handedness
P = 0.031
Remember: Hypotheses cannot be proven right or wrong from sample data. Hypotheses can only be said to be supported by the data.

wake up
@cjlortie
Let’s take a break - 2 minutes

It is either likely or unlikely that we would collect the evidence wedid given the initial assumption (theoretical population with equalnumber of individuals with right- and left-handed).
The decision “Likely” or “unlikely” is based on the probability above
Decision in statistical hypothesis testing – using p-values
P = 0.031
Adapted from https://onlinecourses.science.psu.edu/stat504/?q=book/export/html/20
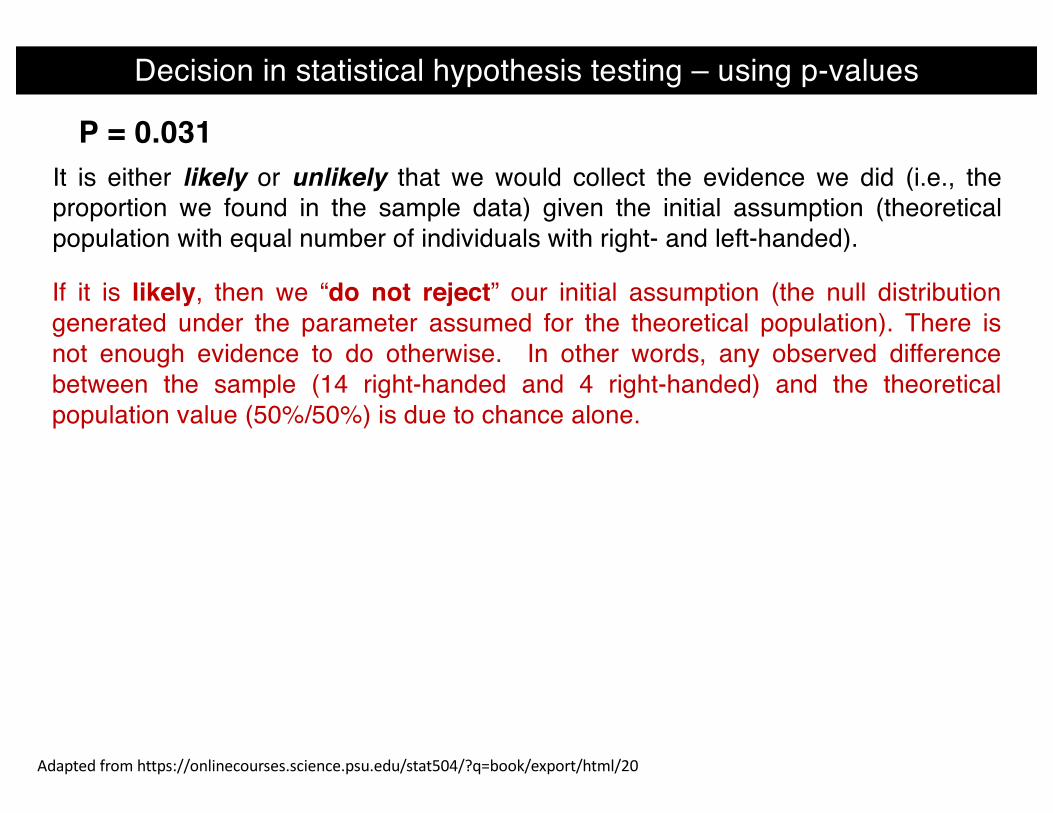
It is either likely or unlikely that we would collect the evidence we did (i.e., theproportion we found in the sample data) given the initial assumption (theoreticalpopulation with equal number of individuals with right- and left-handed).
If it is likely, then we “do not reject” our initial assumption (the null distributiongenerated under the parameter assumed for the theoretical population). There isnot enough evidence to do otherwise. In other words, any observed differencebetween the sample (14 right-handed and 4 right-handed) and the theoreticalpopulation value (50%/50%) is due to chance alone.
P = 0.031
Adapted from https://onlinecourses.science.psu.edu/stat504/?q=book/export/html/20
Decision in statistical hypothesis testing – using p-values

It is either likely or unlikely that we would collect the evidence we did (i.e., theproportion we found in the sample data) given the initial assumption (theoreticalpopulation with equal number of individuals with right- and left-handed).
Adapted from https://onlinecourses.science.psu.edu/stat504/?q=book/export/html/20
If it is likely, then we “do not reject” our initial assumption (the null distributiongenerated under the parameter assumed for the theoretical population). There isnot enough evidence to do otherwise. In other words, any observed differencebetween the sample (14 right-handed and 4 right-handed) and the theoreticalpopulation value (50%/50%) is due to chance alone.
P = 0.031
If it is unlikely, then either:- Our initial assumption (proportion is equal) is truly incorrect and we should
“reject” the initial assumption. We could say “we have strong evidence against the initial assumption”.
- OR our initial assumption is correct. We then experienced a truly unusual sample data (i.e., we made a mistake in rejecting the initial assumption); here, just by chance we sampled a very unusual sample.
Decision in statistical hypothesis testing – using p-values
SamplePopulation of interest
(toads)
Theoretical population -parameter assumed =
50% R & 50% L
Generate the sampling distributionfor the test statistic of interest (here number of right-handed and lef-handed toads) for the theoretical population(i.e., null distribution).
contrast the test statistic for the sample data (14 right handed and 4 left-handed) against the null distribution
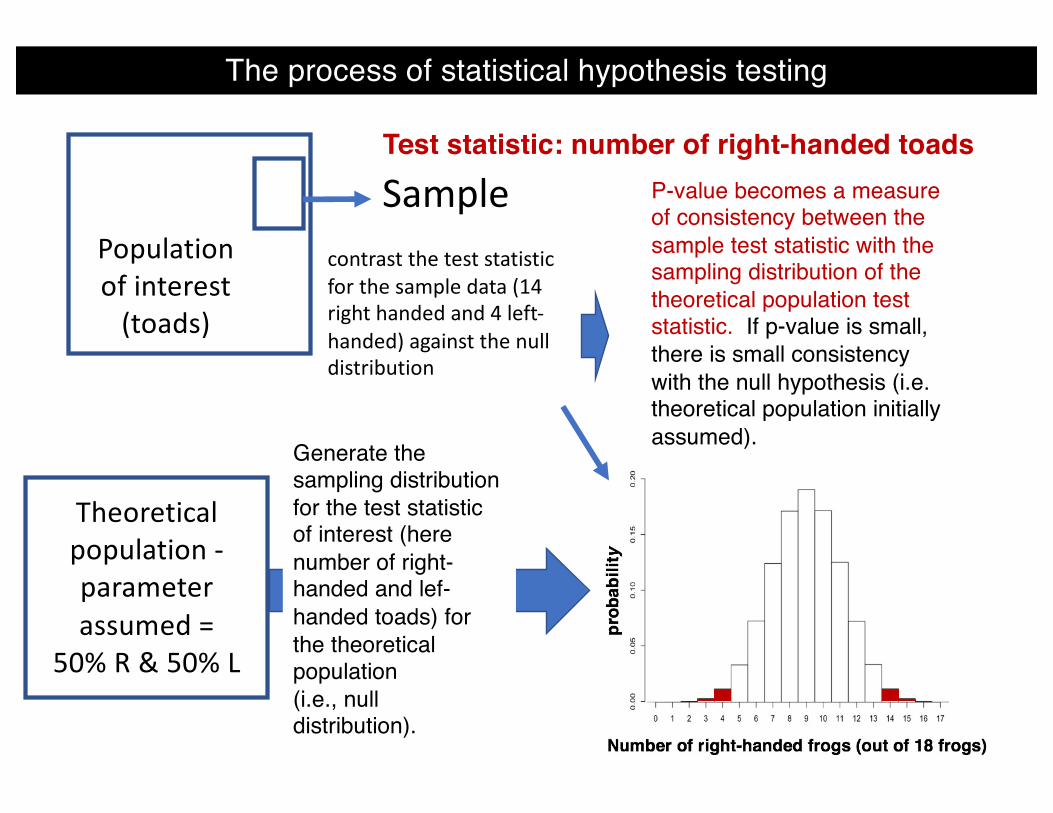
P-value becomes a measure of consistency between the sample test statistic with the sampling distribution of the theoretical population test statistic. If p-value is small, there is small consistency with the null hypothesis (i.e. theoretical population initially assumed).
The process of statistical hypothesis testing
Test statistic: number of right-handed toads

SamplePopulation of interest
(toads)
Theoretical population -parameter assumed =
50% R & 50% L
Generate the sampling distributionfor the test statistic of interest (here number of right-handed and left-handed toads) for the theoretical population(i.e., null distribution).
contrast the test statistic for the sample data (14 right handed and 4 left-handed) against the null distribution
The process of statistical hypothesis testing
Test statistic: number of right-handed toadsDecisions:Do not reject the initial assumption, i.e., parameter for the theoretical value (9 right- handed toads) for the test of statistic of interest (large p-value). ORReject the initial assumption (small p-value).

Our initial assumption (parameter) to build the sampling distribution for the theoretical population is called:H0 (null hypothesis): any observed difference between the sample and the theoretical population value is due to chance alone; i.e., the observed sample data is a common sample within the theoretical population (initial assumption).
The null hypothesis is a specific statement about a theoretical population parameter made for the purposes of argument and generating evidence for or against it.
H0: the proportion of right- and left-handed toads in the population are equal.
The two hypotheses in statistical hypothesis testing

Our initial assumption (parameter) to build the sampling distribution for the theoretical population is called:H0 (null hypothesis): any observed difference between the sample and the theoretical population value is due to chance alone; i.e., the observed sample data is a common sample within the theoretical population (initial assumption).
The null hypothesis is a specific statement about a theoretical population parameter made for the purposes of argument and generating evidence for or against it.
The two hypotheses in statistical hypothesis testing
HA (alternative hypothesis): represents all other possible parameter values, i.e., all possible populations except the one stated under the null hypothesis.
In other words, our initial assumption (theoretical value for the population) is incorrect. As such, it is more likely that the observed sample data come from a population that does not have an equal number of individuals that are right- and left-handed. HA (unlike H0) is not specific.
HA: the proportion of right- and left-handed toads in the population differ.

Do other animals exhibit handedness as well?
H0 (null hypothesis): any observed difference between the sample and the theoretical population value is due to chance alone.
H0 (null hypothesis): the number of right and left handed toads are equal; i.e., the true population value for the ratio between right- and left-handed toads is 1.
Decision in statistical hypothesis testing: in light of the evidence (P-value), should we favour H0 or HA?

Do other animals exhibit handedness as well?
H0 (null hypothesis): any observed difference between the sample and the theoretical population value is due to chance alone.
H0 (null hypothesis): the number of right and left handed toads are equal; i.e., the true population value for the ratio between right- and left-handed toads is where the data were sampled is 1.
Decision in statistical hypothesis testing: in light of the evidence (P-value), should we favour H0 or HA?
HA (alternative hypothesis): the number of right- and left-handed toads differ in the population; i.e., the true population value for the ratio between right- and left-handed toads does not equal 1.
HA (alternative hypothesis): includes all other possible parameter values, i.e., all possible populations except the one stated in the null hypothesis.

Do other animals exhibit handedness as well?
The decision threshold is called significance level and its symbol is 𝛼 (alpha). In biology, the mostly used 𝛼 = 0.05 (and often 𝛼 = 0.01). If P is smaller or equal than 𝛼, we have enough evidence to reject the null hypothesis (H0) in favour of the alternative (HA).
CONCLUSION:
Assuming a significance level of 0.05, the data generated by the balloon experiment generated evidence that toads exhibit handedness.
The smaller the p-value, the stronger the evidence is that the statistical null hypothesis should be rejected; and the stronger the evidence towards the scientific hypothesis of handedness.
Drawing a conclusion using the P-value as evidence for or against a research hypothesis
P = 0.031

Do other animals exhibit handedness as well?
The decision threshold is called significance level and its symbol is 𝛼 (alpha). In biology, the mostly used 𝛼 = 0.05 (and often 𝛼 = 0.01). If P is smaller or equal than 𝛼, we have enough evidence to reject the null hypothesis (H0) in favour of the alternative (HA).
Drawing a conclusion using the P-value as evidence for or against a research hypothesis
P = 0.031

Do other animals exhibit handedness as well?
H0 (null hypothesis): the true population value for the ratio between right- and left-handed toads is 1.
HA (alternative hypothesis): the true population value for the ratio between right- and left-handed toads does not equal 1.
Note that these two statistical hypotheses are about populations and not samples:
Drawing a conclusion using the P-value as evidence for or against a research hypothesis

We call the test used here two-sided (or two-tailed test) because either a sample with a much higher ratio of left- to right-handed toads than 1 OR a sample with a much smaller ratio than 1 would have led to the rejection of the null hypothesis.
Do other animals exhibit handedness as well? Directionality in hypothesis testing:
Number of right-handed frogs (out of 18 frogs)
prob
abilit
y
Left tail ofthe null
distribution
Here we were interested whether there was a preference but not whether the right limb or left limb were preferred over the other (that would had been a one tail test; more on that in a later lecture).
Drawing a conclusion using the P-value as evidence for or against a research hypothesis
Right tail ofthe null
distribution

Statistical hypothesis testing asks how unusual it is to get the observed value for the sample data within the distribution built assuming the null hypothesis as true.
Statistical hypothesis are about populations but are tested with data from samples.
Statistical hypothesis (usually) assumes that sampling is random.
The null hypothesis is usually the simplest statement, whereas the alternative hypothesis is usually the statement of greatest interest.
A null hypothesis is often specific (specific parameter for the theoretical population); an alternate hypothesis often is not.
The process of statistical hypothesis testing:critical details

Mark Chang (2017) well stated: "A smaller p-value indicates a discrepancy between the hypothesis and the observed data. In this sense, p-value measures the strength of evidence against the null hypothesis.
However, p-value is not a probability of a null hypothesis being true. Rejecting H0 at α = .05 level with p = 0.02 does not mean we have a 5% or 2% probability of making a mistake."; Educational and Psychological Measurement, 77, 475-488.
Decision in statistical hypothesis testing: in light of the evidence (P-value), should we favour H0 or HA?

1. How the research hypothesis should be transformed into a statistical question.
2. State the null (parameter for the theoretical population) and alternative hypotheses.
3. Compute the observed value for a particular metric of interest (i.e., based on the sample data). This is called Test Statistic. In our toad example it was simply the number of right-handed individuals.
4. Estimate the P-value by contrasting the sample (observed) value against a sampling distribution that assumes the null hypothesis to be true (around the parameter of interest for a theoretical population).
5. Draw a conclusion by contrasting the estimated p-value against the significance level (𝛼). If the p-value is greater than 𝛼, then do not reject H0; if P-value is smaller or equal than 𝛼, then reject H0.
Statistical hypothesis testing involve:

wake up
@cjlortie
Let’s take a break - 2 minutes

What does the significance level (𝜶 level) represent?
4. Estimate the P-value by contrasting the sample (observed) value against a sampling distribution that assumes the null hypothesis to be true (around the parameter of interest for a theoretical population).
5. Draw a conclusion by contrasting the estimated p-value against the significance level (𝛼). If the p-value is greater than 𝛼, then do not reject H0; if P-value is smaller than or equal to 𝛼, then reject H0.
PUTTING THE TWO ABOVE TOGETHER, ONE SHOULD CONCLUDE THAT:
The significance level (𝛂 level) is the probability of rejecting the null hypothesis when it is true. For example, a significance level of 0.05 indicates a 5% risk of concluding that a difference exists when there is no actual difference (more on that in the next lecture).

There is a lot of disagreement among statisticians and users about whether to accept or reject statistical hypotheses based on p-values.
i.e., whether to use 𝜶 as a threshold for making a decision to state whether a p-value is non-significant (do not reject H0) or a p-value is significant (reject H0 in favour of HA).
Although I agree with these arguments it is unlikely that radical changes will arrive in research behaviour any time soon!
Full Terms & Conditions of access and use can be found athttps://amstat.tandfonline.com/action/journalInformation?journalCode=utas20
The American Statistician
ISSN: 0003-1305 (Print) 1537-2731 (Online) Journal homepage: https://amstat.tandfonline.com/loi/utas20
Moving to a World Beyond “p < 0.05”
Ronald L. Wasserstein, Allen L. Schirm & Nicole A. Lazar
To cite this article: Ronald L. Wasserstein, Allen L. Schirm & Nicole A. Lazar (2019)Moving to a World Beyond “p < 0.05”, The American Statistician, 73:sup1, 1-19, DOI:10.1080/00031305.2019.1583913
To link to this article: https://doi.org/10.1080/00031305.2019.1583913
© 2019 The Author(s). Published by InformaUK Limited, trading as Taylor & FrancisGroup.
Published online: 20 Mar 2019.
Submit your article to this journal
Article views: 126004
View related articles
View Crossmark data
Citing articles: 97 View citing articles
What does the significance level (𝜶 level) represent?
Full Terms & Conditions of access and use can be found athttps://amstat.tandfonline.com/action/journalInformation?journalCode=utas20
The American Statistician
ISSN: 0003-1305 (Print) 1537-2731 (Online) Journal homepage: https://amstat.tandfonline.com/loi/utas20
Moving to a World Beyond “p < 0.05”
Ronald L. Wasserstein, Allen L. Schirm & Nicole A. Lazar
To cite this article: Ronald L. Wasserstein, Allen L. Schirm & Nicole A. Lazar (2019)Moving to a World Beyond “p < 0.05”, The American Statistician, 73:sup1, 1-19, DOI:10.1080/00031305.2019.1583913
To link to this article: https://doi.org/10.1080/00031305.2019.1583913
© 2019 The Author(s). Published by InformaUK Limited, trading as Taylor & FrancisGroup.
Published online: 20 Mar 2019.
Submit your article to this journal
Article views: 126004
View related articles
View Crossmark data
Citing articles: 97 View citing articles
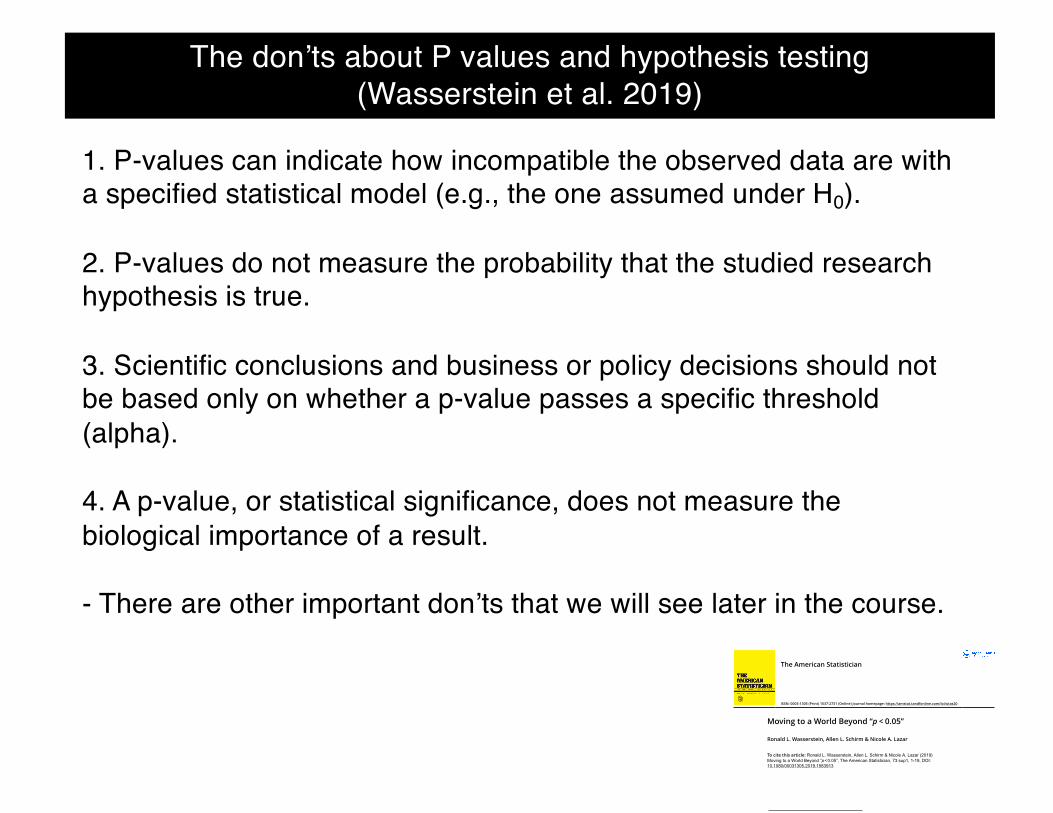
The don’ts about P values and hypothesis testing (Wasserstein et al. 2019)
1. P-values can indicate how incompatible the observed data are with a specified statistical model (e.g., the one assumed under H0).
2. P-values do not measure the probability that the studied research hypothesis is true.
3. Scientific conclusions and business or policy decisions should not be based only on whether a p-value passes a specific threshold (alpha).
4. A p-value, or statistical significance, does not measure the biological importance of a result.
- There are other important don’ts that we will see later in the course.

The biggest push today is to abandon the idea of statistical significance.In other words, to abandon the almost universal and routine practice tostate that if the probability is smaller than or equal to alpha, than weshould state that the results are significant.
Despite the limitations of p-values, we are not recommending thatthe calculation and use of p-values be discontinued. Where p-valuesare used, they should be reported as continuous quantities (e.g., p =0.08) and not yes/no reject the null hypothesis [even though inBIOL322 we will use this tradition because it is the most used andunlikely to change anytime soon].
Abandoning significance is easily said than done. The majority ofresearchers do report results as significant or non-significant. We will tryto guide you in a more nuanced ways in BIOL322 but hard to get awayfrom this common culture in the statistical applications biology andmost other fields.
The don’ts about P values and hypothesis testing (Wasserstein et al. 2019)