Generalized force vectors for analysis of torsionally ... · Chopra and Goel (2004) extended their...
20
Generalized force vectors for analysis of torsionally coupled systems *Kaan Kaatsız 1) , Fırat S. Alıcı 2) and Haluk Sucuoğlu 3) 1), 2), 3) Department of Civil Engineering, Middle East Technical University, 06800, Ankara, Turkey 1) [email protected] ABSTRACT A generalized multi-mode pushover analysis procedure is developed for estimating the maximum inelastic seismic response of symmetrical plan structures under earthquake ground excitations. Pushover analyses are conducted with story- specific generalized force vectors in this procedure, with contributions from all effective modes. Generalized pushover analysis procedure that was previously formulated on 2D planar frames is extended to 3D systems with torsional coupling in the presented study. The instantaneous force distribution acting on the system when the interstory drift at a story reaches its maximum value during seismic response is defined as the generalized force distribution. This force distribution is then expressed in terms of combinations of modal forces. Modal contributions to the generalized force vectors are calculated by a modal scaling rule which is based on the complete quadratic combination. Generalized forces are applied to the mass centers of each story incrementally for producing nonlinear static response. Maximum response quantities are then obtained when the individual frames attain their own target interstory drift values in each story. The developed procedure is tested on a torsionally coupled eight-story structure under 15 ground motion records which are employed without any modification. Performance of the procedure is assessed by comparing the results with those obtained from nonlinear time history analysis. Performance parameters such as interstory drifts and plastic rotations are presented for selected ground motions as well as mean results calculated for the ground motion set. The method is deemed successful in predicting the torsionally coupled inelastic response of 3D systems in terms of deformation and force demands. 1. INTRODUCTION Predicting the inelastic dynamic response of torsionally coupled (unbalanced) systems under strong ground excitations is perhaps one of the most challenging problems of earthquake engineering. Rutenberg and Heiderbrecht (1975) proposed an approximate method in 1975 for the lateral load analysis of asymmetric plan wall-frame structures. Reinhorn et al. (1977) suggested an approximate method in for the dynamic analysis of torsionally coupled tall building structures. In his report, Rutenberg (1998) 1), 2) Research Assistant, PhD Candidate 3) Professor
Transcript of Generalized force vectors for analysis of torsionally ... · Chopra and Goel (2004) extended their...
Generalized force vectors for analysis of torsionally coupled systems
*Kaan Kaatsız1), Fırat S. Alıcı2) and Haluk Sucuoğlu3)
1), 2), 3) Department of Civil Engineering, Middle East Technical University, 06800, Ankara, Turkey
ABSTRACT A generalized multi-mode pushover analysis procedure is developed for estimating the maximum inelastic seismic response of symmetrical plan structures under earthquake ground excitations. Pushover analyses are conducted with story-specific generalized force vectors in this procedure, with contributions from all effective modes. Generalized pushover analysis procedure that was previously formulated on 2D planar frames is extended to 3D systems with torsional coupling in the presented study. The instantaneous force distribution acting on the system when the interstory drift at a story reaches its maximum value during seismic response is defined as the generalized force distribution. This force distribution is then expressed in terms of combinations of modal forces. Modal contributions to the generalized force vectors are calculated by a modal scaling rule which is based on the complete quadratic combination. Generalized forces are applied to the mass centers of each story incrementally for producing nonlinear static response. Maximum response quantities are then obtained when the individual frames attain their own target interstory drift values in each story. The developed procedure is tested on a torsionally coupled eight-story structure under 15 ground motion records which are employed without any modification. Performance of the procedure is assessed by comparing the results with those obtained from nonlinear time history analysis. Performance parameters such as interstory drifts and plastic rotations are presented for selected ground motions as well as mean results calculated for the ground motion set. The method is deemed successful in predicting the torsionally coupled inelastic response of 3D systems in terms of deformation and force demands. 1. INTRODUCTION Predicting the inelastic dynamic response of torsionally coupled (unbalanced) systems under strong ground excitations is perhaps one of the most challenging problems of earthquake engineering. Rutenberg and Heiderbrecht (1975) proposed an approximate method in 1975 for the lateral load analysis of asymmetric plan wall-frame structures. Reinhorn et al. (1977) suggested an approximate method in for the dynamic analysis of torsionally coupled tall building structures. In his report, Rutenberg (1998) 1), 2) Research Assistant, PhD Candidate 3) Professor
concluded that the studies conducted can only be considered as a beginning in understanding the behavior of these structures. Provided that appropriate loading patterns and eccentricities are selected, he suggested pushover analysis as a promising alternative to the linear equivalent lateral force procedure. Torsionally unbalanced and irregular concrete buildings have been the subject of a study conducted by Kosmopoulos and Fardis (2006). According to the provisions of Eurocode 8 (2005), they have developed a computational procedure for the analysis, evaluation and retrofitting of torsionally coupled concrete buildings. They have verified their approach by comparing the estimated demands for floor displacements and estimated member damages to the results of pseudo dynamic tests. Pushover analysis was first applied to torsionally coupled structures by Kilar and Fajfar (1997). They modeled asymmetric structures by using planar macro-elements, and assumed a simple bilinear or multi-linear base shear-top story displacement relationship for each planar macro-element for conducting pushover analysis. Moghadam and Tso (1998) developed a procedure where three-dimensional effects induced by higher modes and torsion were considered. They determined target displacements for resisting elements by conducting a linear response spectrum analysis of the building. Later, inelastic planar models of these resisting elements are prepared and pushed to these target displacements. The implementation of multi-mode pushover analysis procedures to torsionally coupled systems is fairly recent and quite limited. Chopra and Goel (2004) extended their multi-mode pushover analysis procedure MPA (Chopra and Goel 2002) to unsymmetrical plan buildings where the modal force vectors are composed of lateral forces and torques. When asymmetry is present in both orthogonal directions, two different pushover curves exist in these directions. In this case, the authors suggested that pushover curve in the dominant direction of the coupled mode is utilized. After conducting modal pushover analyses with modal force vectors, seismic response of the unsymmetrical-plan structure is obtained by employing complete quadratic combination of the modal responses. Fajfar et al. (2005) proposed a pushover procedure for asymmetric plan buildings which is based on the single mode pushover analysis N2 (Fajfar, 2000). In this procedure, capacity curves are constructed with the N2 method and seismic demands are determined. Then, torsional effects are determined by a linear response spectrum analysis of the structure, independently in two horizontal directions. Results of the response spectrum analyses are then combined by the SRSS rule. In the final step, structure is pushed to the demands estimated by the N2 method in two horizontal directions and correction factors are determined. These correction factors are defined as the ratio between the normalized roof displacements obtained by elastic modal analysis and by pushover analysis. More recently, Kreslin and Fajfar (2012) combined their previous work on asymmetric buildings in both plan and elevation and extended the N2 method for these types of structures. They concluded that the proposed extended N2 method mostly yields conservative predictions of higher mode effects. Barros and Almeida (2011) also suggested a new multi modal load pattern based on the relative modal participation of each mode and tested it on two story symmetrical and asymmetric structures. They defined the modal participation factor they used as the contribution of each mode to the global response of the system, and formed the multi modal load pattern by multiplying mode shapes by the

corresponding modal participation factors. They further combined them by summation. Upon inspecting the past studies on torsionally coupled buildings, it can be concluded that there is still much to be developed for the seismic response prediction of these types of structures. Nonlinear time history analysis is too demanding both in computational and post processing efforts; hence there is room for simpler but reliable inelastic analysis procedures. 2. GENERALIZED FORCE VECTORS FOR TORSIONALLY COUPLED SYSTEMS Response parameters achieve their maximum values at different time instants during seismic response. When a specific response parameter reaches its maximum value at tmax, there is an effective force vector acting on the system at that instant. This effective force vector includes contributions from all modes; therefore it is a generalized force vector (Sucuoğlu and Günay, 2011). Upon defining the generalized force vector corresponding to a response parameter at tmax and applying it to the structure in a single load step, the maximum value of this response parameter can be obtained by performing an equivalent static analysis in a linear elastic system. In nonlinear systems however, generalized force vector is applied in an incremental form until a specified target response demand is attained. Interstory drift is selected as the target response parameter in this study since it provides a good representation of seismic performance of the structure at any deformation and damage state. Roof displacement is “not” employed as the control parameter in the generalized pushover procedure developed below.
Generalized force vectors are derived for linear elastic MDOF systems through the application of modal superposition principle. The maximum value of an arbitrary response parameter can be obtained at tmax while the system is subjected to an earthquake ground excitation üg(t). The force vector acting on the system at tmax is defined by the superposition of contributions from all modes:
max n maxf t f t
n
=( ) ( ) (1)
Effective force vector at the n’th mode is given in Eq. (2) at time tmax:
Γ ( )n max n
f t mn n max
= φ A t( ) (2)
Parameters in Eq. (2) are defined below.
Γn n n n n
= L / M L = φ M = φ φ T Tn n n
m l m (3)
Here φn is the n’th mode shape, m is the mass matrix and l is the influence vector. An
(tmax) in Eq.(2) can be expressed in terms of the modal displacement Dn at tmax during seismic response:
( ) ( )2n max n n max
A t =ω D t (4)
ωn2 in Eq. (4) is the n’th mode vibration frequency, and Dn satisfies the equation of
motion of a damped system with a modal damping ratio of ξn at time tmax.

( ) ( ) ( ) ( ) 2n max n n n max n n max g max
D t + 2ξ ω D t +ω D t = -u t (5)
Since Dn (tmax) occurs at a specific time during seismic excitation, it is not possible to determine it directly from Eq. (5) if tmax is not known. In the proposed procedure, tmax is defined as the time when interstory drift (Δj) of the j’th story reaches its maximum value.
( )j,max j maxΔ = Δ t (6)
The modal expansion of Δj (tmax) is given in Eq. (7):
( ) Γ ( ) ( )j max n n max n, j n, j -1n
Δ t = D t φ - φ (7)
where φn,j is the j’th element of the mode shape vector belonging to the n’th mode. Dividing both sides of Equation (7) by Δj (tmax) results in the normalized form of this equation:
( )1 Γ ( )
( ) n maxn n, j n, j-1
n j max
D t= φ -φ
Δ t (8)
The right hand side of Eq. (8) yields the normalized contribution of each mode n to the maximum interstory drift of the j’th story at tmax.
While determination of Δj (tmax) still depends on tmax, its counterpart in Eq. (6) can be estimated through response spectrum analysis (RSA) by employing a modal combination rule. Complete quadratic combination (CQC) (Wilson et. al. 1981) is the best available method for combining coupled modes with closely spaced modal frequencies. Δj,max is expressed in terms of modal spectral responses obtained with RSA, combined with CQC in Eq.(9):
( ) Γ ( ) Γ ( )[ ][ ]2j,max in i i i, j i, j-1 n n n, j n, j-1
i=1 n=1
Δ ρ D φ -φ D φ -φ (9)
Here, ρin is the correlation coefficient. Indices i and n denote corresponding modes and ranges from 1 to N where N is the number of modes. Dn (or Di) is the spectral displacement of the n’th (or i’th) mode. A normalized form of Eq. (9) can also be derived by simply dividing both sides with (Δj,max)2.
1 Γ ( ) Γ ( )i ni n
in i, j i, j -1 n, j n, j -1i=1 n=1 j,max j,max
D D= ρ φ - φ φ - φ
Δ Δ
(10)
In Eqs. (8) and (10), the normalized contributions of individual modes to the maximum interstory drift at a specified story are defined from dynamic response history and response spectrum analyses, respectively. Under the assumption of equality stated in Eq. (6), the right-hand sides of Eqs. (8) and (10) can be equated:

( )Γ ( ) Γ ( ) Γ ( )
( )i n
i n
n maxn n, j n, j-1 in i, j i, j-1 n, j n, j-1
n i=1 n=1j max j,max j,max
D t D Dφ -φ = ρ φ -φ φ -φ
Δ t Δ Δ (11)
Re-introducing Eq. (6) for the denominator terms of modal responses on both sides, and leaving out similar terms in Eq. (11) results in a simplified form:
( ) Γ ( )[ ]nn max ni i i i, j i, j-1
i=1 j,max
DD t = ρ D φ -φ
Δ (12)
The terms in brackets in Eq. (12) is Δj,i, or the i’th mode contribution to the maximum interstory drift at the j’th story determined from RSA. Inserting Δj,i for the bracket term in Eq. (12) yields a further simplified expression for Dn(tmax):
( )
in j,ii=1
n max nj,max
ρ ΔD t = D
Δ (13)
Eq. (13) describes Dn (tmax) independent of tmax through RSA, accompanied with CQC. This equality is designated as the modal scaling rule, since modal displacement amplitude of the n’th mode at tmax is obtained by the multiplication of spectral displacement of this mode by a scale factor. The modal scaling factor is defined as the ratio of modal contribution to any response parameter to the maximum of this response parameter calculated at the j’th story. Interstory drift in the equation is the response parameter selected for this derivation.
An(tmax) can also be determined from Eq. (13) by multiplying both sides with ωn2:
( )
in j,ii=1
n max nj,max
ρ ΔA t = A
Δ (14)
An is the pseudo-spectral acceleration of the n’th mode and obtained from An = ωn2Dn,
similar to Eq. (4). fn (tmax) can be rewritten via Equation (14) in a form that is independent of time. Substituting An (tmax) from Eq. (14) into Eq. (1) yields:
nn
max
f t min j,i
i=1n
j,max
ρ Δ A
Δn( ) (15)
As previously stated, formulation presented herein is based on interstory drift at the j’th story. Consequently, f(tmax) in Eq. (15) is the generalized force vector that acts on the system when the j’th story interstory drift reaches its maximum value. Therefore, f(tmax) will be denoted as fj in the remaining part of the formulation.
Summation for all modes in Eq. (15) over all terms in the parentheses and regrouping leads to a final form of the generalized force vector:

1
i
n
N
in
j
f m j,n j,i
n inn j,max j,max
Δ Δ= A + ρ
Δ Δn (16)
The generalized force vector that maximizes the j’th story interstory drift is presented in Eq. (16). This is, in fact, the force vector which is applied on the structure in an incremental form until the target interstory drift demand at the j’th story is obtained. 3. TARGET INTERSTORY DRIFT DEMAND FOR TORSIONALLY COUPLED SYSTEMS
Maximum interstory drift demand Δj (tmax) during ground motion excitation was defined as a function of Dn (tmax) in Equation (7). Δj (tmax) can also be expressed with the implementation of modal scaling rule by substituting Dn (tmax) from Eq. (13) into Eq. (7):
( ) Γ ( )
in j,ii=1
j max n n, j n, j-1 nn j,max
ρ Δ Δ t = φ -φ D
Δ (17)
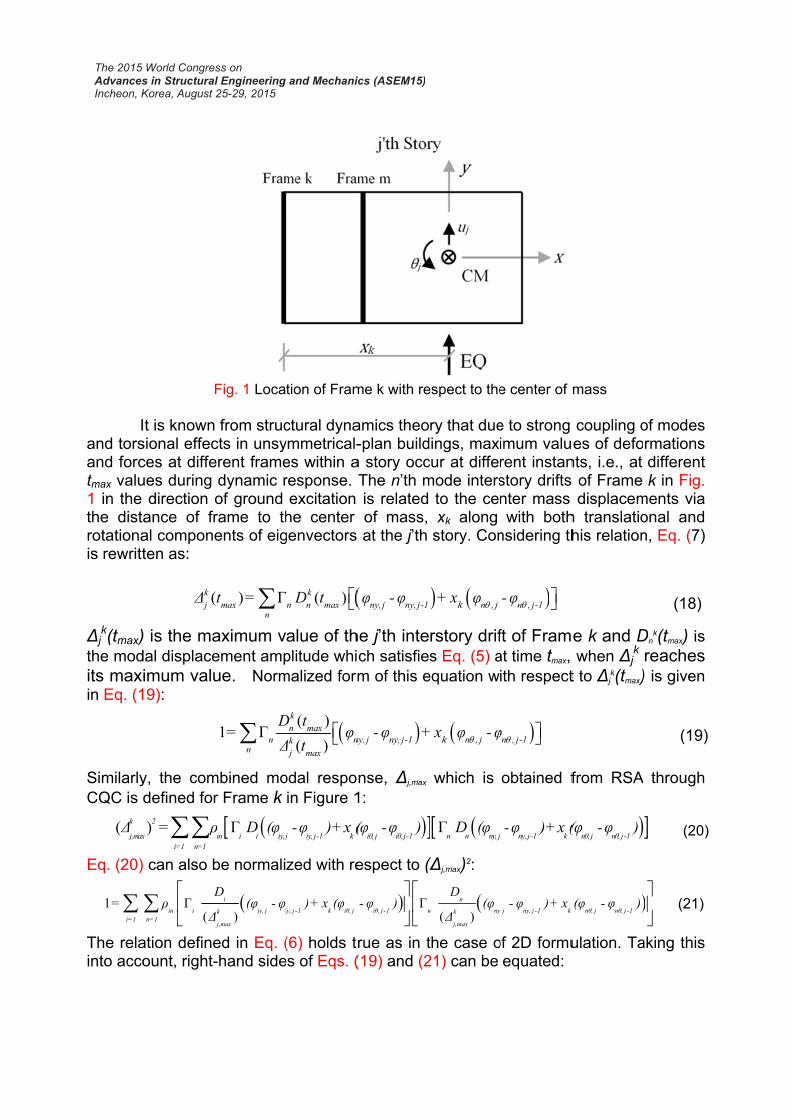
As discussed previously, Eq. (17) expresses target drift at the j’th story of a linear elastic system which reaches its maximum value when the corresponding generalized force vector fj is acting on the system. The effect of nonlinearity on Dn can be considered however, which is explained in the second step of the generalized pushover (GPA) algorithm given in the following section. Generalized force vectors and their accompanying target interstory drift demands are determined by using the eigenvectors defined at the diaphragm centers of mass of a 3D structural system. In a 2D frame, all structural members are in the same frame including the center of mass, resulting in consistent deformations and member forces at the target interstory demand. Similar to the behavior of 2D frames, response of 3D plan-symmetric structures also shows no variation within a story since torsional effects are not present. Consequently, deformations and forces of all structural members in a story can be estimated accurately by employing a single demand control mechanism, namely using one target interstory demand for each story. However, this is not the case for 3D buildings where some forms of torsional rotation components exist.
I
and torsand forctmax valu1 in the the distrotationais rewritt
Δjk(tmax)
the modits maxin Eq. (1
SimilarlyCQC is
( k
j,maxΔ
Eq. (20)
1 i=1
=
The relainto acco
It is knownsional effecces at diffeues during
direction ance of fral componten as:
(kjΔ
) is the madal displaceimum valu
19):
y, the comdefined for
) 2
xi=1 n=1
= ρ
) can also b
Γ(
in in=1
Dρ
Δ
ation defineount, right-
Fig. 1 Loca
from struccts in unsyerent frame
dynamic rof ground rame to thents of eig
( ) Γmaxn
t =
aximum vement ampue. Norm
1 Γ nn
D=
Δ
mbined mor Frame k
Γin i i iy, jρ D (φ
be normali
)
i
iy, j ik
j,max
D(φ - φ
Δ
ed in Eq. (-hand side
tion of Fram
ctural dynaymmetrical-es within aresponse. excitation
he center genvectors
( ) k
n n maxD t
alue of thplitude whi
malized form
( )
( )
kn max
nykj max
D tφ
Δ t
odal respoin Figure 1
j iy, j-1 k-φ )+x (
zed with re
iy, j -1 k iθ, j)+ x (φ
(6) holds tres of Eqs. (
me k with re
amics theo-plan build
a story occThe n’th mis relatedof mass,
at the j’th
ny, j ny, j-1φ -φ
he j’th intech satisfiem of this e
ny, j ny, j-1-φ +
nse, Δj,max
1:
iθ, j iθ, j-1
(φ -φ )
espect to (
Γ
iθ, j -1 n- φ )
rue as in t(19) and (2
espect to the
ry that duedings, maxicur at differmode inters to the cenxk along
story. Con
k n , j+ x φ
rstory drifs Eq. (5) a
equation w
k n , j+ x φ -φ
which is
Γ n n ny, j
D (φ
(Δj,max)2:
( ) n
n ny,k
j,max
D(φ
Δ
the case o21) can be
e center of
e to strong imum valurent instanstory drifts nter mass with both
nsidering th
n , j-1-φ
ft of Framat time tmax, ith respect
n , j-1φ
obtained f
ny, j-1 k-φ )+x (
j ny, j -1 k- φ )+ x
of 2D formuequated:
mass
coupling oes of defo
nts, i.e., at s of Frame
displacemh translatiohis relation
e k and Dwhen Δj
k t to Δj
k(tmax)
from RSA
nθ, j nθ, j-1
(φ -φ )
nθ, j nθ, j -1
(φ - φ )
ulation. Ta
of modes rmations different k in Fig.
ments via onal and n, Eq. (7)
(18)
Dnk(tmax) is
reaches ) is given
(19)
through
(20)
(21)
aking this
( )Γ
( )
Γ Γ( ) ( )
k
k
n max
n ny, j ny, j-1 n , j n , j-1kn
j max
i n
in i iy, j iy, j-1 k iθ, j iθ, j-1 n ny, j ny, j-1 k nθ, j nk ki=1 n=1
j,max j,max
D tφ -φ + x φ -φ
Δ t
D Dρ (φ -φ )+ x (φ -φ ) (φ -φ )+ x (φ -φ
Δ Δ
θ, j -1)
(22)
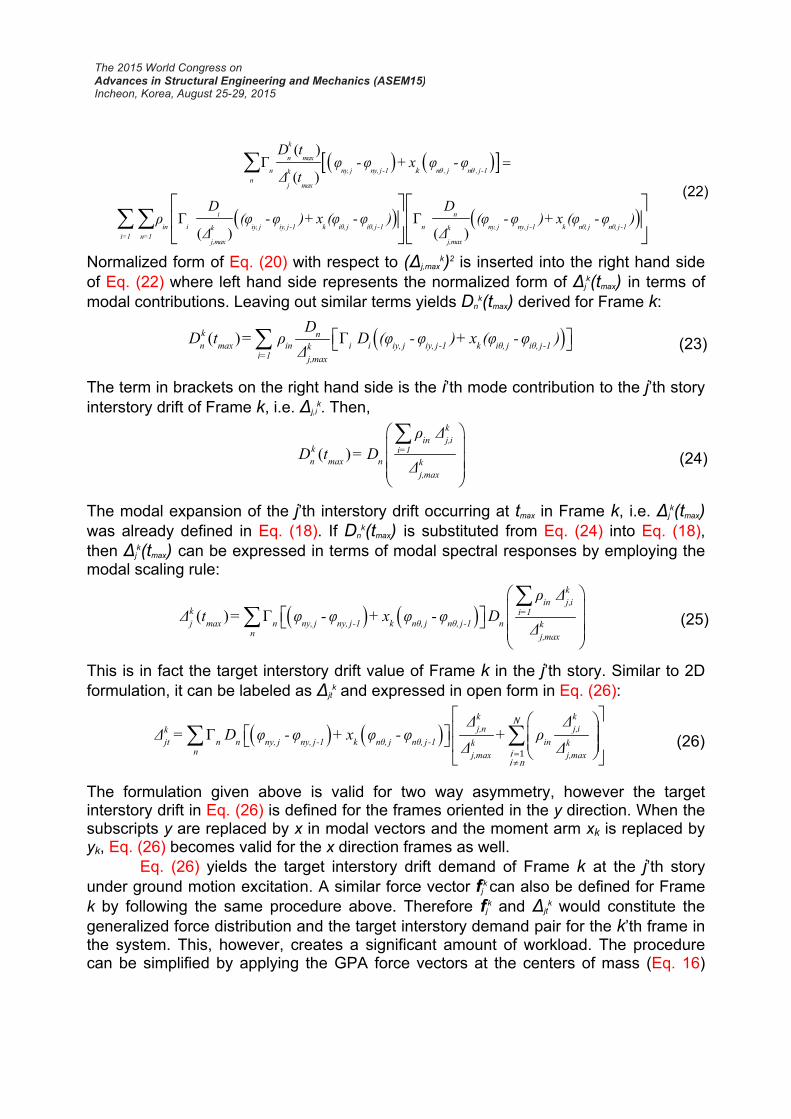
Normalized form of Eq. (20) with respect to (Δj,maxk)2 is inserted into the right hand side
of Eq. (22) where left hand side represents the normalized form of Δjk(tmax) in terms of
modal contributions. Leaving out similar terms yields Dnk(tmax) derived for Frame k:
( ) Γ k nn max in i i iy, j iy, j-1 k iθ, j iθ, j-1k
i=1 j,max
DD t = ρ D (φ -φ )+ x (φ -φ )
Δ (23)
The term in brackets on the right hand side is the i’th mode contribution to the j’th story interstory drift of Frame k, i.e. Δj,i
k. Then,
( )
kin j,i
k i=1n max n k
j,max
ρ ΔD t = D
Δ (24)
The modal expansion of the j’th interstory drift occurring at tmax in Frame k, i.e. Δjk(tmax)
was already defined in Eq. (18). If Dnk(tmax) is substituted from Eq. (24) into Eq. (18),
then Δjk(tmax) can be expressed in terms of modal spectral responses by employing the
modal scaling rule:
( ) Γ
kin j,i
k i=1j max n ny, j ny, j-1 k nθ, j nθ, j-1 n k
n j,max
ρ ΔΔ t = φ -φ + x φ -φ D
Δ (25)
This is in fact the target interstory drift value of Frame k in the j’th story. Similar to 2D formulation, it can be labeled as Δjt
k and expressed in open form in Eq. (26):
Γ1
N
ii n
k kj,n j,ik
jt n n ny, j ny, j-1 k nθ, j nθ, j-1 ink kn j,max j,max
Δ ΔΔ = D φ -φ + x φ -φ + ρ
Δ Δ (26)
The formulation given above is valid for two way asymmetry, however the target interstory drift in Eq. (26) is defined for the frames oriented in the y direction. When the subscripts y are replaced by x in modal vectors and the moment arm xk is replaced by yk, Eq. (26) becomes valid for the x direction frames as well.
Eq. (26) yields the target interstory drift demand of Frame k at the j’th story under ground motion excitation. A similar force vector fjk can also be defined for Frame k by following the same procedure above. Therefore fjk and Δjt
k would constitute the generalized force distribution and the target interstory demand pair for the k’th frame in the system. This, however, creates a significant amount of workload. The procedure can be simplified by applying the GPA force vectors at the centers of mass (Eq. 16)

rather than at each frame individually, while tracking the target interstory drifts of each frame separately (Eq. 26). Along a story, different frames reach their target interstory drifts at different analysis steps. However, the member responses obtained at these steps are virtually the same as the ones that are achieved when performing a full, frame by frame analysis. Application of generalized force vectors defined at the center of mass significantly reduces the computational effort. To illustrate on the 8-story, 4-frame structure, only 8 pushover analyses are performed and 32 target interstory drift ratios are searched from the frame interstory drifts. Due to the simplicity offered by this approach and the ability to produce results with similar accuracy compared to frame-by-frame analysis, the GPA procedure is implemented in this simplified form.
4. GENERALIZED PUSHOVER ANALYSIS ALGORITHM
The GPA algorithm is summarized in the following steps:
1. Eigenvalue analysis: Periods (Tn), mode shapes (φn) and associated modal properties of the structure are determined.
2. Response spectrum analysis: Spectral accelerations (An) and displacements (Dn) of each mode are determined from the corresponding linear elastic response spectrum. Then, Δj,n and Δj,max for the center of mass are obtained from Eq. (9), and Δj,n
k and Δj,maxk for each frame k are obtained from Eq. (20) by using these spectral
quantities. 3. GPA force vectors: GPA force vectors fj are determined according to Eq. (16). 4. Target interstory drift demands: Frame target interstory drift demands (Δjt
k) are also determined by using Eq. (26).
5. Nonlinear static analysis: fj are acted upon the system in an incremental form until Δjt calculated in step 4 is exceeded. Then the interstory drift record of frame k is searched for Δjt
k. The analysis step that yields Δjtk is used to compile the member
deformations and internal forces at the j’th story of frame k (target analysis step). Nonlinear static analysis is repeated for each story, j = 1 to N.
6. Determination of structural responses: Using the target analysis steps obtained in the 5th step, deformations and internal forces of all members at each frame are determined directly from the deformation state of the structure at the target interstory drift demand. Entire response of the system is then compiled by employing an envelope algorithm where absolute maxima of these internal forces and deformations are selected for every structural member without using any modal combination rule. These results are registered as final response estimates.
GPA procedure is implemented to an eight story torsionally coupled frame
building under fifteen ground motions in the case study presented below.
5. EIGHT STORY FRAME BUILDING The story plan of the eight story moment resisting frame building is shown in Fig
2. The building is designed in compliance with the Turkish Earthquake Code (2007) by employing the capacity design principles, with an enhanced ductility level (R=8). The design spectrum for soft soil conditions is shown in Figure 3. Concrete and steel

charactedimensioand coluand live stories ioffsettindimensioanalysis
Telastic mand a nhistory pushovewhere thand 0.6reinforceemployelumped Momenthysteresin the codamping1’st and
Fig
F0.33 secand fouTranslat
FMotion
eristic streons are seumns are 5
load is 2 kis 3 meterg the masson. Thus,
s (Y-axis inThe structmodel is dnonlinear s
analysis, er analysishe gross m6 respectived concreed in the nalong the t-curvaturesis relationolumn endg is used i3’rd mode
g. 2 Plan vie
Free vibratconds. Theurth modetional modeFifteen groDatabase
engths areelected in 50x50 cm tkN/m2. Grors. Asymms center of
asymmet Fig. 2).
ture is modeveloped structural m
generalize. Linear elamoments ovely, in o
ete membenonlinear splastic hin
e relationsns whereasds. P-Deltan both mo
es that are
ew of the eig
tion periode first and s are rotaes in the xound moti
e (2010)
e 25 MPa the design
throughoutound story
metry and f the buildintric mass
odeled by for perfor
model is ped pushovastic modeof inertia o
order to aers (ASCEstructural mge length whips are as fiber seca effects aodels where
assigned
ght-story un
ds of the fithird mod
ation domx-direction aon recordand used
and 420 n of beamt the buildi
y height is the resulting from thdistributio
using the ming linea
prepared inver analy
el is compoof the beaaccount foE/SEI-41 model bothwhich is hassigned
ctions are sre considee the dam5% viscou
nsymmetric
rst four coes are tra
minant. Heare not con
ds have bd without
MPa, resms and colu
ng. Slab th3.5 metersng torsione center of
on is obta
OpenSeear elastic rn order to ysis and cosed of “Elms and co
or the cra2001). “Bh for beamalf of the sto the beselected inered in theping coeff
us damping
cal-plan stru
oupled modnslation donce, the nsidered.een selecemploying
spectively. umns. Beahickness ats whereas nal couplinf stiffness ined along
es softwareresponse sperform n
conventionasticBeamolumns arecked secteamwithH
ms and colsection depam ends n order to e analyticalicients are
g.
cture (all un
des are 1.ominant whstructure
cted from g a scali
Uniform ams are 3t all floors the height
ng are proby 15% ofg the dire
re (2014). spectrum nonlinear rnal (single
mColumn” ee multiplietion stiffneinges” elelumns. Plapth at all mwith elastintroduce l models.
e obtained
nits in mete
62, 1.03, 0hereas theis torsiona
the PEERing or an
member 0x55 cm is 14 cm
t of other vided by f the plan ection of
A linear analysis, response e mode) elements d by 0.4
esses of ement is asticity is members. to-plastic plasticity Rayleigh from the
ers).
0.52 and e second ally stiff.
R Strong ny other

modification to the original data. These ground motions produce different levels of inelastic deformation demands and higher mode effects (both in elevation and plan) in the frame structure. Their acceleration spectra and record properties are given in Fig. 3 and Table 1, respectively. The linear elastic design spectrum (unreduced) and the mean spectrum of fifteen ground motions are also shown in Fig. 3. The selected ground motions do not represent any commonality or membership to a family.
Two different types of results are presented in the following paragraphs. The first type includes response results to three individual ground motions selected from Table 1. These ground motions produce different levels of inelastic deformations, from lower to higher. The second type of results includes statistical evaluation of the responses to the total set of fifteen ground motions. All results in the two categories are assessed with reference to the results of benchmark nonlinear response history analysis (NRHA).
Three sets of response results are presented for each ground motion in Figs. 4-6. These are the height-wise variations of interstory drift ratio, mean beam-end plastic rotations and story shears given for each frame separately. The results of GPA are compared with the results of benchmark NRHA in all figure boxes.
Table 1. Strong ground motions and their properties
GM No. PEER Code Earthquake Mw PGA (g) Site GeologyGM1 H-E04140 Imperial Valley - 1979 6,5 0,485 D GM2 ERZ-EW Erzincan - 1992 6,9 0,496 D GM3 CLS090 Loma Prieta - 1989 7,0 0,479 A GM4 SPV270 Northridge - 1994 6,7 0,753 D GM5 PCD254 San Fernando - 1971 6,6 1,160 B GM6 BOL000 Duzce - 1999 7,1 0,728 D GM7 ORR090 Northridge - 1994 6,7 0,568 B GM8 ORR360 Northridge - 1994 6,7 0,514 B GM9 B-PTS315 Superstition Hills - 1987 6,6 0,377 D GM10 IZT090 Kocaeli - 1999 7,4 0,220 A GM11 DZC270 Kocaeli - 1999 7,4 0,358 D GM12 LCN275 Landers - 1992 7,3 0,721 A GM13 G066090 Morgan Hill - 1984 6,1 0,292 A GM14 NPS210 N. Palm Springs - 1986 6,2 0,594 D GM15 STG000 Loma Prieta - 1989 7,0 0,513 D

Fig. 3 Acceleration response spectra of the fifteen ground motions and the design spectrum (T1-Y, T2-θ, T3-Y, T4-θ indicate the first four modal periods and the dominant response
directions)
The results of conventional (single mode) pushover analysis (PO) are also provided in each figure for observing the contribution of higher modes. First mode load pattern in PO includes torsional moments and first mode inelastic response is employed in calculating the target roof displacement. Moreover, interstory drift ratios obtained by the linear elastic response spectrum analysis (RSA) are presented along with the results of nonlinear procedures in order to assess the validity of linear elastic models with cracked section properties in predicting the interstory drift distributions in a torsionally coupled system which undergoes different levels of inelastic deformations.
The results obtained under the IZT090 ground excitation are shown in Fig. 4. This is the weakest intensity ground motion in Table 1; however it produces interstory drift ratios of 1.8% and mean beam plastic rotations of 0.014 radians at the middle stories of the flexible edge exterior (FE) frame, as calculated by NRHA. GPA predicts the interstory drifts and beam plastic rotations quite well, and story shears perfectly in all frames. The improvement of GPA over PO is also notable in all frames, particularly at the stiff edge frame (SE) for all three response parameters. Interstory drift distributions predicted by RSA are fairly acceptable for this ground motion since the inelastic deformations are not so far into the plastic range as observed in the second column boxes of Figure 4. Negligible yielding of columns occurs at the base sections, with maximum plastic rotations not exceeding 0.1%.
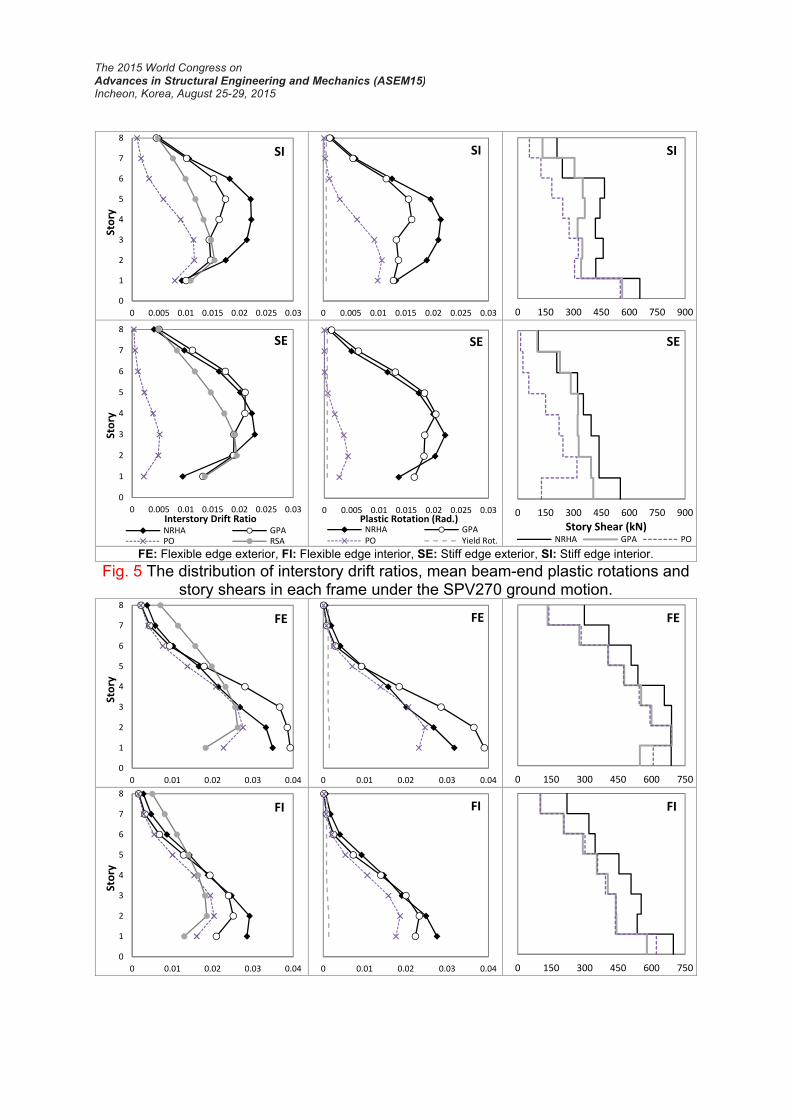
A very significant higher mode response is observed in Fig. 5 under SPV270, accompanied with large inelastic deformations. Maximum values of interstory drift ratios and mean beam plastic rotations calculated by NRHA are 2.6% and 0.022 radians, respectively. GPA generally predicts both the interstory drifts, mean beam plastic
0.0
0.5
1.0
1.5
2.0
2.5
0.0 0.5 1.0 1.5 2.0 2.5 3.0
Acc
eler
atio
n (
g)
Period (Seconds)GM1 GM2 GM3 GM4GM5 GM6 GM7 GM8GM9 GM10 GM11 GM12
T1-YT2-θT4-θ T3-Y

deformations and story shears of all frames successfully, with an under-estimation of deformations by about 30% at the middle stories of the SI frame. RSA analysis gives reasonable interstory drifts at the lowest three stories, but completely misses the upper stories where higher modes contribute significantly. This is a result of the quadratic combination of linear elastic modes which is usually a poor assumption when the first mode is not dominant. Mean rotation ductilities of the beam ends are in the 10-25 range in the 1st story, in the 15-40 range in the 3rd story (maximum), and around 3 in the top story under SPV270. Maximum rotation ductility demand at the base of the first story column of the flexible edge frame is 1.7.
The largest deformation demands on the eight story asymmetric frame come from the ground motion LCN275, which are shown in Fig. 6. Maximum values of interstory drift ratios and mean beam end plastic rotations calculated by NRHA are 3.5% and 0.032 radians respectively, at the first story of the FE frame. Inelastic deformations accumulate at the lowest two stories, with a significant torsional response as observed in Fig. 6. GPA predicts these results reasonably well. Mean rotation ductilities of the beam ends are between 20 and 30 in the first two stories, and falls to less than 2 in the top story under LCN275. Maximum values of the average rotation ductility demand of columns occur at the bases of the first story columns, which are 10, 7, 4 and 3 for the FE, FI, SI and SE frames, respectively. Such uneven distribution of ductility demands under very strong ground excitation indicates the weakness of code based design approach for torsionally coupled systems.
0
1
2
3
4
5
6
7
8
0 0.005 0.01 0.015 0.02 0.025
Story
FE
0 0.005 0.01 0.015 0.02
FE
0 100 200 300 400 500 600 700
FE
0
1
2
3
4
5
6
7
8
0 0.005 0.01 0.015 0.02 0.025
Story
FI
0 0.005 0.01 0.015 0.02
FI
0 100 200 300 400 500 600 700
FI
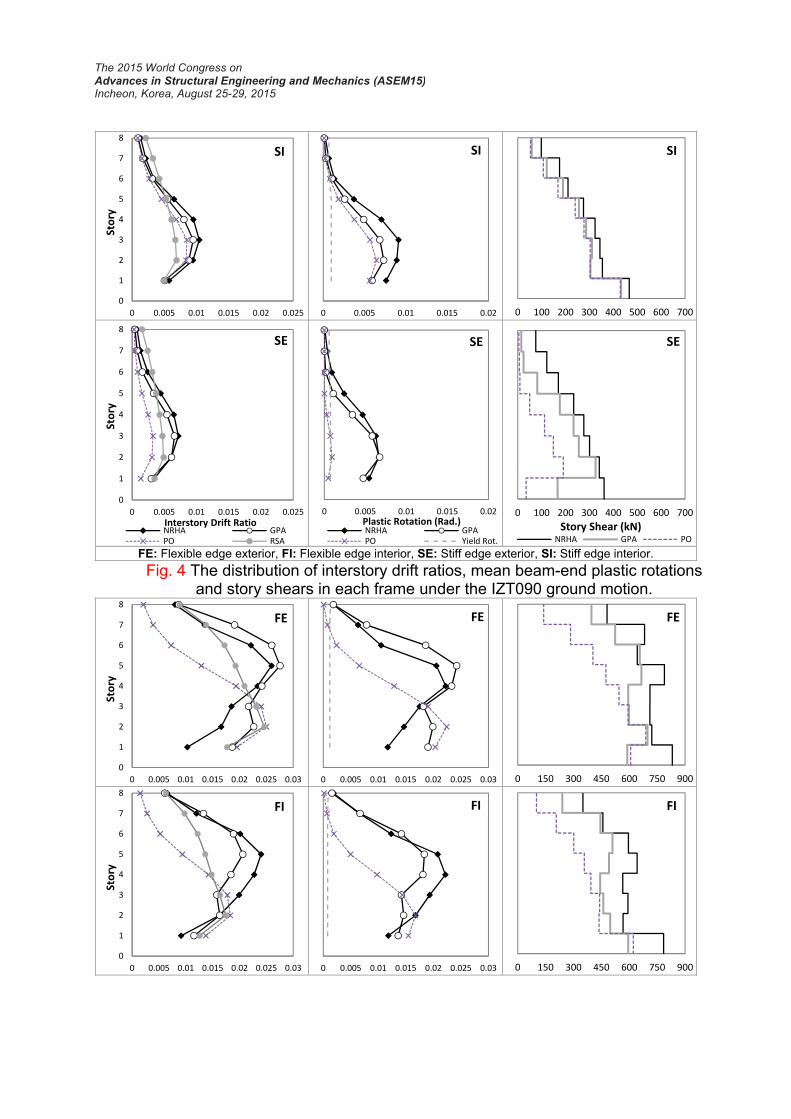
FE: Flexible edge exterior, FI: Flexible edge interior, SE: Stiff edge exterior, SI: Stiff edge interior. Fig. 4 The distribution of interstory drift ratios, mean beam-end plastic rotations
and story shears in each frame under the IZT090 ground motion.
0
1
2
3
4
5
6
7
8
0 0.005 0.01 0.015 0.02 0.025
Story
SI
0 0.005 0.01 0.015 0.02
SI
0 100 200 300 400 500 600 700
SI
0
1
2
3
4
5
6
7
8
0 0.005 0.01 0.015 0.02 0.025
Story
Interstory Drift Ratio
SE
NRHA GPAPO RSA
0 0.005 0.01 0.015 0.02Plastic Rotation (Rad.)
SE
NRHA GPAPO Yield Rot.
0 100 200 300 400 500 600 700
Story Shear (kN)
SE
NRHA GPA PO
0
1
2
3
4
5
6
7
8
0 0.005 0.01 0.015 0.02 0.025 0.03
Story
FE
0 0.005 0.01 0.015 0.02 0.025 0.03
FE
0 150 300 450 600 750 900
FE
0
1
2
3
4
5
6
7
8
0 0.005 0.01 0.015 0.02 0.025 0.03
Story
FI
0 0.005 0.01 0.015 0.02 0.025 0.03
FI
0 150 300 450 600 750 900
FI
FE: Flexible edge exterior, FI: Flexible edge interior, SE: Stiff edge exterior, SI: Stiff edge interior. Fig. 5 The distribution of interstory drift ratios, mean beam-end plastic rotations and
story shears in each frame under the SPV270 ground motion.
0
1
2
3
4
5
6
7
8
0 0.005 0.01 0.015 0.02 0.025 0.03
Story
SI
0 0.005 0.01 0.015 0.02 0.025 0.03
SI
0 150 300 450 600 750 900
SI
0
1
2
3
4
5
6
7
8
0 0.005 0.01 0.015 0.02 0.025 0.03
Story
Interstory Drift Ratio
SE
NRHA GPAPO RSA
0 0.005 0.01 0.015 0.02 0.025 0.03Plastic Rotation (Rad.)
SE
NRHA GPAPO Yield Rot.
0 150 300 450 600 750 900
Story Shear (kN)
SE
NRHA GPA PO
0
1
2
3
4
5
6
7
8
0 0.01 0.02 0.03 0.04
Story
FE
0 0.01 0.02 0.03 0.04
FE
0 150 300 450 600 750
FE
0
1
2
3
4
5
6
7
8
0 0.01 0.02 0.03 0.04
Story
FI
0 0.01 0.02 0.03 0.04
FI
0 150 300 450 600 750
FI

FE: Flexible edge exterior, FI: Flexible edge interior, SE: Stiff edge exterior, SI: Stiff edge interior. Fig. 6 The distribution of interstory drift ratios, mean beam-end plastic rotations and
story shears in each frame under the LCN275 ground motion. The second type of results provide comparisons of the statistical distributions of
interstory drift ratios, beam plastic rotations and story shears under fifteen ground motions. The statistical distribution of interstory drift ratios calculated by NRHA and GPA at the four frames is shown in Fig. 7. It can be observed that the distributions obtained at the FI and SE frames are matching perfectly well whereas those obtained at the FE and SI frames are in reasonably good agreement. Moreover, mean interstory drift distributions are also calculated under the mean spectrum of fifteen ground motions shown in Fig. 3. These results are fairly close to the mean of fifteen interstory drift distributions obtained under fifteen ground motions separately. Therefore it can be concluded that GPA conducted under a mean spectrum of ground motions produces acceptable estimates of the statistical mean of interstory drift ratios obtained under a set of ground motions. Accordingly GPA can be employed as an effective nonlinear analysis tool under a site specific design spectrum representing the mean spectrum of ground motions expected at a site.
0
1
2
3
4
5
6
7
8
0 0.01 0.02 0.03 0.04
Story
SI
0 0.01 0.02 0.03 0.04
SI
0 150 300 450 600 750
SI
0
1
2
3
4
5
6
7
8
0 0.01 0.02 0.03 0.04
Story
Interstory Drift Ratio
SE
NRHA GPAPO RSA
0 0.01 0.02 0.03 0.04Plastic Rotation (Rad.)
SE
NRHA GPAPO Yield Rot.
0 150 300 450 600 750
Story Shear (kN)
SE
NRHA GPA PO

FE: Flexible edge exterior, FI: Flexible edge interior, SE: Stiff edge exterior, SI: Stiff edge i iFig. 7 The mean distribution of interstory drift ratios and mean spectrum GPA results in
each frame. The mean distribution of beam plastic rotations obtained under fifteen ground motions calculated by NRHA, GPA and PO are compared in Fig. 8. It has to be reminded that beam plastic rotations are also the mean values over the beam ends in each story. The results in Fig. 8 reveals that mean GPA and mean NRHA results match perfectly well in the FI and SE frames, and match reasonably well in the FE and SI frames.
0
1
2
3
4
5
6
7
8
0 0.005 0.01 0.015 0.02 0.025 0.03
Story
FE
0 0.005 0.01 0.015 0.02 0.025 0.03
FI
0
1
2
3
4
5
6
7
8
0 0.005 0.01 0.015 0.02 0.025 0.03
Story
Interstory Drift Ratio
SI
NRHA NRHA ± σGPA GPA ± σMean Spec. GPA
0 0.005 0.01 0.015 0.02 0.025 0.03Interstory Drift Ratio
SE
NRHA NRHA ± σGPA GPA ± σMean Spec. GPA
0
1
2
3
4
5
6
7
8
0 0.005 0.01 0.015 0.02 0.025
Story
FE
0 0.005 0.01 0.015 0.02 0.025
FI

FE: Flexible edge exterior, FI: Flexible edge interior, SE: Stiff edge exterior, SI: Stiff edge i iFig. 8 The mean distribution of mean beam-end plastic rotations in each frame.
FE: Flexible edge exterior, FI: Flexible edge interior, SE: Stiff edge exterior, SI: Stiff edge i iFig. 9 The mean distribution of story shears in each frame.
The last set of statistical results compare the distributions of mean story shears obtained under fifteen ground motions in Figure 10, as calculated by the NRHA, GPA and PO procedures. GPA captures the NRHA results very well in all four frames, with small errors however at the first story of the exterior frames. PO analysis under predicts story shears at all frames and the errors increase at higher stories where higher modes have more significant contribution to seismic response. 6. SUMMARY AND CONCLUSIONS
0
1
2
3
4
5
6
7
8
0 0.005 0.01 0.015 0.02 0.025
Story
Plastic Rotation (Rad.)
SI
NRHA GPA PO
0 0.005 0.01 0.015 0.02 0.025Plastic Rotation (Rad.)
SE
NRHA GPA PO
0
1
2
3
4
5
6
7
8
0 150 300 450 600 750
Story
FE
0 150 300 450 600 750
FI
0
1
2
3
4
5
6
7
8
0 150 300 450 600 750
Story
Story Shear (kN)
SI
NRHA GPA PO
0 150 300 450 600 750Story Shear (kN)
SE
NRHA GPA PO

Generalized pushover analysis procedure is extended to 3D torsionally coupled systems in this study. Modal contributions to the generalized force vectors and target interstory drifts are calculated by a modal scaling rule which is based on the complete quadratic combination. Generalized forces are applied to the mass centers of each story incrementally for producing nonlinear static response. Maximum response quantities are obtained at the loading increments when the individual frames attain their own target interstory drift values in each story. GPA requires (N) pushovers in each direction where N is the number of stories. GPA is non-adaptive; hence it can be implemented conveniently with any general purpose nonlinear static analysis tool. Also it does not suffer from the statistical combination of inelastic modal responses which leads to violation of force equilibrium. Convergence is the basic advantage of GPA as well as all nonlinear static procedures over the nonlinear response history analysis procedure. NRHA suffers from convergence problems when the size of the model is large as in a 3D structure, when the model involves computationally demanding elements such as fiber elements, and when the ground motions drive the system far into significant inelastic deformation range. GPA predicts the results of NRHA fairly well, as demonstrated under several ground motions employed in this study. Moreover, GPA conducted under the mean spectrum of a set of ground motions produce results which are very close to the mean of individual GPA results. This is an indication that GPA can be employed as an effective nonlinear analysis tool under a site specific design spectrum. The basic limitation of the GPA procedure arises from the local accumulation of plastic deformations during actual dynamic response, which leads to significant changes in the modal deformation shapes. The non-adaptive GPA algorithm cannot track these changes and hence its results may deviate from the results of NRHA when such localized nonlinearities dominate the overall deformation pattern of the system. REFERENCES
ASCE/SEI 41, (2001), “Seismic Rehabilitation of Existing Buildings”, American Society of Civil Engineers, Reston, Virginia.
Barros RC, Almeida R. (2011), “Pushover Analysis of Asymmetric Three-Dimensional Building Frames”, Journal of Civil Engineering and Management, 11(1): 3–12.
Chopra AK, Goel R.K. (2002), “A Modal Pushover Analysis Procedure for Estimating Seismic Demands for Buildings”, Earthquake Engineering and Structural Dynamics, 31(3): 561–582.
Chopra AK, Goel R.K. (2004), “A Modal Pushover Analysis Procedure to Estimate Seismic Demands for Unsymmetric-plan Buildings”, Earthquake Engineering and Structural Dynamics, 33(8): 903–927.
Comite European de Normalisation, (2005), “Eurocode 8, Design of Structures for Earthquake Resistance - Part 3: Assessment and Retrofitting of Buildings”, European Standard EN 1998-3, Brussels.

Fajfar P. (2000), “A Nonlinear Analysis Method for Performance-Based Seismic Design”, Earthquake Spectra, 16(3): 573–592.
Fajfar P, Marusic D, Perus I. (2005), “Torsional Effects in the Pushover-Based Seismic Analysis of Buildings”, Journal of Earthquake Engineering, 9(6): 851–854.
Kilar V, Fajfar P. (1997), “Simple Push-Over Analysis of Asymmetric Buildings”, Earthquake Engineering and Structural Dynamics, 26(2): 233–249.
Kosmopoulos A, Fardis M.N. (2006), “Seismic Evaluation of Strongly Irregular and Torsionally Unbalanced Concrete Buildings”, Proceedings of the 2nd FIB Congress, Naples.
Kreslin M, Fajfar P. (2012), “The Extended N2 Method Considering Higher Mode Effects in Both Plan and Elevation”, Bulletin of Earthquake Engineering, 10: 695–715.
Moghadam AS, Tso W.K. (1998), “Pushover Analysis for Asymmetrical Multistory Buildings”, Proceedings of the 6th U.S. National Conference on Earthquake Engineering, EERI, Oakland, California.
PEER Strong Motion Database, (2010), Available from: http://peer.berkeley.edu/smcat.
Reinhorn A, Rutenberg A, Glück J. (1977) “Dynamic Torsional Coupling in Asymmetric Building Structures”, Building and Environment, 12(4): 251–261.
Rutenberg A, Heidebrecht A.C. (1975), “Approximate Analysis of Asymmetric Wall-frame Structures”, Building Science, 10(1): 27–35.
Rutenberg A. (1998), “EAEE Task Group 8. Behavior of Irregular and Complex Structures, State of the Art Report: Seismic Nonlinear Response of Code-Designed Asymmetric Structures”, Proceedings of the 11th European Conference on Earthquake Engineering, Paris.
Sucuoğlu H, Günay M.S. (2011), “Generalized Force Vectors for Multi-mode Pushover Analysis”, Earthquake Engineering and Structural Dynamics, 40(1): 55–74.
Turkish Ministry of Construction and Settlement. (2007), “Design Code for Buildings in Seismic Regions”, Ankara.
Open System for Earthquake Engineering Simulation, (2011), Available from: http://opensees.berkeley.edu.
Wilson EL, Der Kiureghan A, Bayo E.P. (1981), “A Replacement for the SRSS Method in Seismic Analysis”, Earthquake Engineering and Structural Dynamics, 9(2): 187–192.