Generali Group 2015 First Half Results
52
GENERALI GROUP 2015 First Half Results Please note that prior year’s figures have been restated throughout the whole presentation to reflect the new perimeter of th e Group. Net income, Shareholders’ Equity, Solvency I, Life Value KPIs, Embedded Value are not adjusted for disposed entities. The like for like c hange of written premiums, life net inflows, APE and NBV is on equivalent terms (on equivalent exchange rates and consolidation area).
Transcript of Generali Group 2015 First Half Results

GENERALI GROUP 2015 First Half Results
Please note that prior year’s figures have been restated throughout the whole presentation to reflect the new perimeter of the Group. Net income,
Shareholders’ Equity, Solvency I, Life Value KPIs, Embedded Value are not adjusted for disposed entities. The like for like change of written premiums,
life net inflows, APE and NBV is on equivalent terms (on equivalent exchange rates and consolidation area).

© Generali
July 30, 2015 2015 First Half Results
Agenda
I. Business Overview Page 3 Mario Greco – Group CEO
II. 2015 First Half Group Financials Page 10 Alberto Minali – Group CFO
Backup Page 31
2

© Generali
July 30, 2015 2015 First Half Results
Agenda
I. Business Overview
3
Mario Greco – Group CEO

© Generali
4
July 30, 2015 2015 First Half Results
1H 2015 Key messages
CEO – Business overview
2.2 2.2 2.3 2.5
2.8
1H11 1H12 1H13 1H14 1H15
Operating result Euro bn
0.8 0.8
1.1 1.1
1.3
1H11 1H12 1H13 1H14 1H15
Net result Euro bn
(1) Average over the period
0.0
1.0
2.0
3.0
4.0
1H11 1H12 1H13 1H14 1H15
Interest rates German 10Y bund yield, %(1)
In the face of persistently
adverse external conditions…
…we have consistently grown
operating profitability…
… and the net result
7% CAGR from 2011, +11% in
1H 2015
Best operating result in 8 years
All business segments
progressed
P&C Combined ratio at record
levels (92.6%)
Improvement in Life business
mix, also increasing quality of
profits for the future
13% CAGR from 2011, +22%
in 1H 2015
Resolution of legacy issues
and investment positions
reducing gap between
Operating and Net result
Declining interest rates and
spreads creates a huge
earnings headwind
Weak economic growth
High levels of competition in
P&C markets
Increasing regulatory
pressures across the
business

© Generali
5
1H 2015 Key messages
CEO – Business overview
133% 130%
139%
162% 164%
1H11 1H12 1H13 1H14 1H15
Solvency I ratio %
186%
200%
FY14 1H15
Economic capital ratio %, pro-forma internal model view
We have rebuilt the capital position
under Solvency I…
…and our new internal model shows us to
be well positioned on an economic view
Internal model solvency capital requirements 2x
covered as at 30 June 2015
Driven by organic capital generation,
disposals, and more favourable asset prices
Achieved while investing €3bn to acquire
minorities in our core operations
July 30, 2015 2015 First Half Results
(1)
(1) Proforma for BSI sale
(1)

© Generali
6
Country highlights
CEO – Business overview
P&C: Excellent underwriting performance maintained
- Combined ratio remains well below 90%, despite 1.6%pts higher Nat Cat
- Strong performance of non-motor; Margin over volume approach in the highly competitive
motor market
Combined ratio
88.7% (+0.6%pts)
Life: Further impressive momentum in net inflows
- Unit linked flows the driver: almost 4x higher than prior period
Life net inflows
€3.9bn (+78%)
Banca Generali: Another outstanding contribution
- Dynamic growth in operating performance once again
- Market value of our stake grew to > €1.8bn at end 1H
Operating profit(1)
€172m (+37%)
(1) Operating profit as per Generali’s definition
P&C: Improving combined ratio despite higher Nat Cat, reflecting good market
conditions Combined ratio
92.5% (-1.2%pts)
Life: Resilient performance in a challenging interest rate environment Operating Result
€200m (+21%)
Restructuring: Moving with determination
- New management in place; Board of future GD AG completed; Reorganisation commenced
- Comprehensive approach to create “new normal” in life underway
Restructuring charge of
€100m booked in 2Q
Italy
Germany
July 30, 2015 2015 First Half Results

© Generali
7
Country highlights
CEO – Business overview
P&C: Clear benefits of turnaround program emerging
- Combined ratio ex-Nat Cat significantly improved (-2.3%pts)
- Absence of Nat Cat in 1H15 (vs. 3.6%pts in 1H 2014) also helped performance
- Confident of delivering <100% in 2016 as planned, even with normal level of Nat Cat
Combined ratio
99.2% (-5.9%pts)
Life: Building momentum with improved mix
- Increase particularly in Unit Linked (net inflows >2x prior year level, and 80% of total)
- New pension products with more favourable economics launched in July
- Further product profitability initiatives in coming months
Life net inflows
€0.7bn (1H 2014: €0.0bn)
P&C: Dependable delivery of excellent performance
- Combined ratio remains consistently below 90%
Combined ratio
85.4% (+1.2%pts)
France
CEE
July 30, 2015 2015 First Half Results

© Generali
8
Recap of our strategy
CEO – Business overview
Retail Leader in
Europe
Fast, Lean, Agile
Simple & Smart
Leveraging on
technology &
partnerships
Build on our existing strengths:
- European retail focus
- Powerful distribution capabilities
Best customer insights, strengthen relationships with distributors
Creating a distinctive brand
Strong and effective governance & organisation
Continued rigorous execution on efficiency to fund business
transformation
Focused on cash generation
Solution vs. product focus
Ease of access across the customer journey
Further develop “connected” insurance
New partnerships to complement existing capabilities
- E.g. recently announced acquisition of MyDrive
July 30, 2015 2015 First Half Results

© Generali
9
Clear financial goals
CEO – Business overview
Cash Generation > €7bn (cumulative 2015-2018)
c. 50% more cash than FY14
run-rate
Dividends > €5bn (cumulative 2015-2018)
Progressively increasing;
Average yield c. 5%(1)
Cost savings totalling €1.5bn
by 2018(2) Fully on track to achieve gross
savings targets and flat nominal
costs
Operating RoE > 13% on
average Maintained commitment to
attractive returns
(1) Based on closing share price on 30 June 2015
(2) Since programme commencement in 2013
July 30, 2015 2015 First Half Results

© Generali
July 30, 2015 2015 First Half Results
Agenda
II. 2014 Group Financials
10
Alberto Minali – Group CFO
Profit & Loss and Balance Sheet Page 11
Business review Page 18

© Generali
July 30, 2015 2015 First Half Results
Operating Result: Positive development (+11%) thanks to both Life business (+13%) and P&C
business (+2%).
Net Result: Increasing 22%, driven by the excellent operating performance of the period, the positive
development of non operating investment income, and lower interest expenses on financial debt
Shareholders’ equity: Stable at year end level, with net income and other market effects offsetting the
negative impact of rising yields, and the dividend paid.
Economic Solvency: +14%pts. improvement, driven by operating returns and positive economic
variances
Key First Half 2015 financials at a glance
CFO – Profit & Loss 11
1H14 1H15 LFL D 2Q14 2Q15 LFL D
Operating result (Euro m) 2,498 2,779 +11.3% 1,248 1,453 +16.5%
Operating RoE 7.2% 8.3% +1.1%pts. 3.6% 4.3% +0.7%pts.
Net result (Euro m) 1,075 1,307 +21.6% 415 626 +50.6%
EPS (Euro) 0.69 0.84 +21.5% 0.27 0.40 +50.6%
Net operating EPS (Euro) 0.84 0.96 +14.9% 0.42 0.51 +19.9%
Shareholders’ equity(1) 23,204 23,284 +0.3%
Economic Solvency(1) 186% 200% +14%pts.
(1) Comparative data FY14

© Generali
July 30, 2015 2015 First Half Results
2,498
199 25 52 2,779
1H14 Life P&C Holding & Otherbusinesses
Cons. Adj 1H15
5
Operating result by segment
CFO – Profit & Loss
12
+11.3%
(Euro m)
1H 15 1,713 1,103 71 (109)
1H 14 1,514 1,079 66 (161)
D +13.2% +2.3% +7.9% -32.4%

© Generali
July 30, 2015 2015 First Half Results
From operating result to net result
CFO – Profit & Loss
13
2,779 351
(367)
(468)
(757) (82) (149)
1,307
Operating
Result
Non Oper.
Investment
Income
Non Oper.
Holding
Expenses
Net Other
Non Oper.
Expenses
Taxes Disc.
Operations
Minorities Net
Result
Including: -€ 342 m: Interest costs
Including: -€ 181 m: Restructuring costs
-€ 66 m: VOBA amortisation
-€ 220m other non-recurring provisions
1H 15 2,779 351 (367) (468) (757) (82) (149) 1,307
1H 14 2,498 (79) (409) (170) (629) (12) (124) 1,075
D +11.3% n.m. -10.3% n.m. +20.4% n.m. +19.9% +21.6%
(Euro m)

© Generali
July 30, 2015 2015 First Half Results
Shareholders’ equity rollforward (Euro m)
932
(1,226)
23,204 1,307
(934)
23,284
Shareholders'Equity FY14
Δ in AFS Reserve
1H 2015 NetResults
Dividend Other Shareholders'Equity 1H15
Shareholders’ equity
CFO – Balance Sheet 14
Change in AFS reserve (Euro m)
+0.3%
(1,556)
6,498
142 188 5,272
AFS Reserve FY14 Impact BondInvestment
Impact EquityInvestments
Other AFS Reserve 1H15
Shareholders’ equity sensitivities (Euro bn)
Equities
-30%
Interest rate
+100bps
Interest rate
-100bps
Credit spread
+100bps
-1.8
-3.0
2.6
-0.8

© Generali
July 30, 2015 2015 First Half Results
Solvency I
CFO – Capital 15
+0%pts
164% 156%
(6%pts)
8%pts
(1%pts)
156%
Solvency IFY14
RequiredMarginGrowth
ConsolidatedResult
Financial markets andother
Solvency I1H15
Solvency I pro forma1H15 (1)
Solvency ratio stable mainly thanks to the result of the
period…
….offsetting the increase of required margin, driven by
ordinary business growth, exchange rate effects (mainly
CHF) and the negative impact from financial markets
Solvency I rollforward (%) Solvency I ratio sensitivities (%)
(1) At 1H15, the estimated positive impact of BSI disposal amounts to 8% pts
152
152
169
140
147
156
Real estate -10%
Credit spread + 100bps
Interest rate -100bps
Interest rate +100bps
Equities -30%
Total ratio 30.06.2015

© Generali
July 30, 2015 2015 First Half Results
186% 11% 4% 200%
ESR FY14 ESR 1H15
Economic solvency
Pro-forma internal model ESR roll-forward(1) (%)
CFO – Balance sheet & capital
Improvements driven by normalized operating return and positive economic variances on Eligible Own
Funds and Solvency Capital Requirement mainly related to rising of interest rates and favourable equity
markets.
16
+14%pts.
(1) Proforma including BSI sale (2) Eligible Own Funds (3) Solvency Capital Requirment
Change in
EOF(2)
Change in
SCR(3)

© Generali
July 30, 2015 2015 First Half Results
Agenda
II. 2014 Group Financials
17
Alberto Minali – Group CFO
Profit & Loss and Balance Sheet Page 11
Business review Page 18

© Generali
July 30, 2015 2015 First Half Results
1H14 1H15 LFL D 2Q14 2Q15 LFL D
Gross written premiums 24,119 26,906 +10.6% 12,094 13,240 +8.5%
Net inflows 5,864 8,200 +38.5% 3,007 3,894 +28.4%
Life operating result 1,514 1,713 +13.2% 753 890 +18.1%
Life operating ratio on
investments (bps) 43 43 - 21 22 +1
APE 2,520 2,707 +5.4% 1,250 1,278 +0.8%
New Business Value 651 474 -29.2% 332 152 -55.1%
Margin on APE (%) 25.8% 17.5% -8.5%pts. 26.5% 11.9% -14.8%pts.
Life key financial indicators
CFO – Life Insurance 18
(Euro m)

© Generali
July 30, 2015 2015 First Half Results
Life Operating result by driver
CFO – Life Insurance 19
(Euro m)
1H 15 2,868 1,374 (2,529)
1H 14 2,702 1,091 (2,279)
D % +6.1% +26.0% +11.0%
Life Operating result up 13.2%:
Very strong investment result, thanks to higher current income and net realised gains
Technical margin improves due to better risk result, and higher unit linked fees
Expense result reflects higher acquisition costs, following increased volumes
1,514 166
284
(250)
1,713
1H14 Technical Margin Investment result Expenses 1H15
+13.2%

© Generali
July 30, 2015 2015 First Half Results
Life inflows and technical reserves(1)
CFO – Life Insurance 20
(1) Including liabilities related to investment contracts
1H14 1H15
Italy 2,203 3,919
France 41 721
Germany 1,649 2,031
CEE 219 240
EMEA 1,575 947
Americas 58 75
Asia 82 220
International 36 47
TOTAL 5,864 8,200
Sharp increase in net inflows (+38.5%)
- Continued notable growth in Italy thanks to hybrid products
- Positive trend in France, confirming 1st quarter increase
- Decrease in EMEA due by contraction in single premiums of
Ireland (vs very strong 1H14) and increase of maturities in Austria
Overall growth in reserve of 5.2% from end 2014 (of which +13.4%
increase in unit linked)
+ 5.2%
279.7 288.8
67.5 76.5
347.2 8.2
(2.9)
9.8 3.0 365.3
FY14 NetInflows
Loadings,Risk &
Surrender Result
Policyh. Shareof Invest. Result
ExchangeRate & Other
1H15
+13.4%
+3.2%
Unit linked
Traditional
(Euro m)

© Generali
July 30, 2015 2015 First Half Results
Life investment performance
CFO – Life Insurance 21
Euro 321 bn Euro 322 bn
(1) Net of depreciation expenses
47.0 44.7
34.5 36.0
7.7 8.5
4.0 4.3 3.1 3.0 2.1 1.9 1.6 1.5
FY14 1H15
Other
Cash & cashequivalent
Real estate
Equity
Other fixedincome
Corporatebonds
Governmentbonds
Euro m %
Fixed income
1H14 4,634 1.8
1H15 4,867 1.7
Equity
1H14 316 2.4
1H15 220 1.6
Real Estate(1)
1H14 258 2.7
1H15 300 3.0
Total(1)
1H14 5,360 1.8
1H15 5,500 1.7
Life segment general account (%)
Current returns

© Generali
July 30, 2015 2015 First Half Results
Life new business analysis
CFO – Life Insurance 22
APE NBV MARGIN ON APE
1H14 1H15 LFL D 1H14 1H15 LFL D 1H14 1H15 LFL D
Italy 1,177 1,159 -1.6% 319 258 -18.9% 27.1% 22.3% -4.7%pts.
France 425 535 +27.0% 56 18 -66.7% 13.1% 3.4% -9.7%pts.
Germany 418 448 +5.1% 134 73 -46.5% 32.1% 16.4% -15.8%pts.
CEE 64 87 +2.6% 22 21 -29.8% 34.8% 23.6% -11.0%pts.
EMEA 363 348 -5.8% 110 83 -28.4% 30.2% 23.8% -7.5%pts.
Lat. Am.&Asia 73 131 +44.5% 11 21 53.3% 14.5% 15.9% +0.9%pts.
TOTAL 2,520 2,707 +5.4% 651 474 -29.2% 25.8% 17.5% -8.5%pts.
APE growth (+5.4%) driven by unit linked (+35.1%) and protection business (+20.8%) developments
Better product mix (Unit Linked weight at 26.7%) and a further reduction of guarantees (in Euro area
from 0.96% at 1H14 to 0.68% at 1H15)
NBM (17.5%): Reduced despite positive changes at product level, due to the extreme economic
scenario in Q2 (where NBM is based on start of quarter market inputs). Assumption set for Q3 (based
on market levels at 1 July) is significantly better
(Euro m)

© Generali
July 30, 2015 2015 First Half Results
P&C key financial Indicators
CFO – P&C Insurance
23
1H14 1H15 LFL D 2Q14 2Q15 LFL D
Gross written premiums, of which: 11,169 11,266 +0.1% 4,753 4,783 +0.2%
Primary Motor 4,516 4,498 -1.7% 1,815 1,827 -0.2%
Primary Non Motor 6,306 6,391 +0.9% 2,737 2,767 +1.0%
Combined ratio (%) 92.8% 92.6% -0.2%pts. 92.9% 92.0% -0.9%pts.
Nat Cat impact (%) 1.3% 1.4% +0.1%pts. 2.0% 0.9% -1.1%pts.
P&C operating result 1,079 1,103 +2.3% 549 598 +8.9%
(Euro m)

© Generali
July 30, 2015 2015 First Half Results
P&C Operating result by driver
CFO – P&C Insurance
24
Investment return increasing despite low interest rate environment
(Euro m)
1H 15 644 529 (70)
1H 14 649 508 (77)
D % -0.7% +4.3% -9.1%
1,079
(4)
22 7 1,103
1H14 Technical Result Investment result Other 1H15
+2.3%

© Generali
July 30, 2015 2015 First Half Results
1H14 1H15 LFL
Italy 3,032 2,927 -3.5%
France 1,416 1,380 -2.5%
Germany 2,130 2,144 +0.6%
CEE 989 1,015 +2.8%
EMEA 2,465 2,585 +1.9%
Americas 524 597 +7.2%
Asia 49 59 +16.8%
International 563 559 +3.8%
Total 11,169 11,266 +0.1%
P&C gross written premiums trends
CFO – P&C Insurance
25
Overall stable premium development:
Decline in Italy due to decrease in Motor coupled with a
substantial stability in Non Motor
Decline in France both in Motor and Non-Motor. After
decrease of the previous quarter, 2Q showed a stable
performance thanks to Non-Motor lines
Recovery in Germany thanks to the positive
development of the 2nd quarter (+4.0%)
Improvement in CEE thanks both to Motor and Non-
Motor
Increase in Americas led by Argentina (both Motor and
Non-Motor) that more than offset decrease reported in
Brazil
(Euro m)

© Generali
July 30, 2015 2015 First Half Results
65.7 65.0
27.1
0.5
27.6
(0.7)
92.8 92.6
1H14 Δ Expense ratio Δ Loss ratio 1H15
27.1 27.6
21.4
0.2
21.6
5.7
0.3
6.0
1H14 Δ Admin Δ Acq. 1H15
Combined ratio analysis
CFO – P&C Insurance
26
Loss ratio
Expense ratio
Combined ratio (%)
-0.2%pts.
Expense ratio (%)
Loss ratio (%)
Acquisition costs
Administr. costs
+0.5%pts.
65.7
(0.3)
0.1
(0.5)
65.0
1H14 Current year NATCAT Prior years 1H15
1H 15 68.3 1.4 -4.6 65.0
1H 14 68.6 1.3 -4.2 65.7
-0.7%pts.

© Generali
July 30, 2015 2015 First Half Results
Combined ratio by country
CFO – P&C Insurance 27
1H14 1H15 LFL
Italy 88.1% 88.7% +0.6%pts.
France 105.1% 99.2% -5.9%pts.
Germany 93.7% 92.5% -1.2%pts.
CEE 84.2% 85.4% +1.2%pts.
EMEA 94.6% 94.1% -0.5%pts.
Americas 105.3% 104.7% -0.6%pts.
Asia 104.4% 92.7% -11.7%pts.
International
Operations 83.2% 88.6% +5.4%pts.
Total 92.8% 92.6% -0.2%pts.
Combined ratio increase in Italy due to heavier Nat Cat
impact (+2.6%pts. against +1.0%pts reported in 1H14)
Improvement in France favoured by lower impact of Nat
Cat (-3.6%pts. compared to 1H14) and effects of portfolio
restructuring activities
Combined ratio improving in Germany, despite
+0.7%pts. Nat Cat impact compared to 1H14
Combined ratio increase in CEE due to deterioration in
Motor, partially offset by improvement in Non-Motor
(%)

© Generali
July 30, 2015 2015 First Half Results
P&C investment performance
CFO – P&C Insurance 28
Euro 39 bn Euro 39 bn
(1) Net of depreciation expenses
26.0 26.1
35.4 35.6
5.9 6.5
8.7 8.3
11.1 11.1
9.8 8.9
3.1 3.5
FY14 1H15
Other
Cash & cashequivalent
Real estate
Equity
Other fixedincome
Corporatebonds
Governmentbonds
Euro m %
Fixed income
1H14 427 1.7
1H15 417 1.6
Equity
1H14 60 1.8
1H15 76 2.2
Real Estate(1)
1H14 137 3.0
1H15 131 3.1
Total(1)
1H14 679 1.8
1H15 662 1.7
P&C segment general account (%)
Current returns

© Generali
July 30, 2015 2015 First Half Results
1H14 1H15 LFL 2Q14 2Q15 LFL
Financial 201 245 +22.2% 106 96 -8.7%
of which Banca Generali(1) 126 172 +36.7% 70 57 -18.5%
Operating holding expenses (197) (251) +27.4% (101) (135) +33.9%
Other businesses(2) 62 77 +23.3% 37 56 +52.1%
Total 66 71 +7.9% 41 17 -58.4%
Focus on Holding & Other businesses segment CFO – Holding & Other businesses
29
(Euro m)
(1) Banca Generali’s operating contribution as per Generali’s view
(2) Including pure financial holdings, international service activities and any other non-core businesses

© Generali
July 30, 2015 2015 First Half Results
Final remarks
CFO – Final remarks 30
Excellent profitability in 1H 2015, across all business
lines
Strong growth in life production with improving mix
Focus on profitability leads to a record low combined
ratio in P&C
Further improvement in our strong economic solvency
position to 200%

© Generali
July 30, 2015 2015 First Half Results
Agenda
III. Backup
31
Costs Page 32
Investments Page 34
Financial debt Page 40
Life Page 43
Group Embedded Value Page 45
Definitions Page 47

© Generali
July 30, 2015 2015 First Half Results
1H15 Cost development
Back up: Focus on costs 32
Group operating expense development (OpEx view) (Euro bn)
Reconciliation of general expenses from IFRS view to OpEx view (1H15, Euro bn)
Increase in operating costs in 1H reflecting adverse FX
trends, and some timing differences through the year
Overall 1H15 costs are exactly 50.0% of our ambition
level of Euro 6.3bn for the year (i.e. the 2012 baseline)
We remain on track to keep nominal costs flat at 2012
levels
Acquisition & Admin costs, accounting view
(per segmental operating profit analysis)
Adjustments from accounting view
Adjusted general expense base (OpEx view)
2.5
2.7
0.4
(3.1)
0.5 0.2 3.2
IFRS Admin & Acquisition
costs
Commissions & DAC
Claims settlemement
costs (included
in claims & benefits)
Other items & adjustments
Total general expenses
(OpEx view)
Holding & other
Life
P&C
3.0 3.2
1H 14 1H 15

© Generali
July 30, 2015 2015 First Half Results
Agenda
III. Backup
33
Costs Page 32
Investments Page 34
Financial debt Page 40
Life Page 43
Group Embedded Value Page 45
Definitions Page 47

© Generali
July 30, 2015 2015 First Half Results
34
Assets under management
Backup: Investments
74.2
15.5
10.3 Generalaccount
Unit Linked
Third partyinvestments
5
87
4 3
1
Equity
Fixed income
Real estate
Cash & Cash Equivalent
Other
By Asset Class
By Region
31
23
29
3
10 4 Italy
France
Germany
CEE
EMEA
RoW and other operations
Total Portfolio: Euro 493 bn (%)
Breakdown by owner and asset class (%)
© Generali
July 30, 2015 2015 First Half Results
4 7
34
42
13 1
AAA AA A BBB Not Investment Grade Not Rated
74
8
12
5 1
1
13
36
4
45
2
0
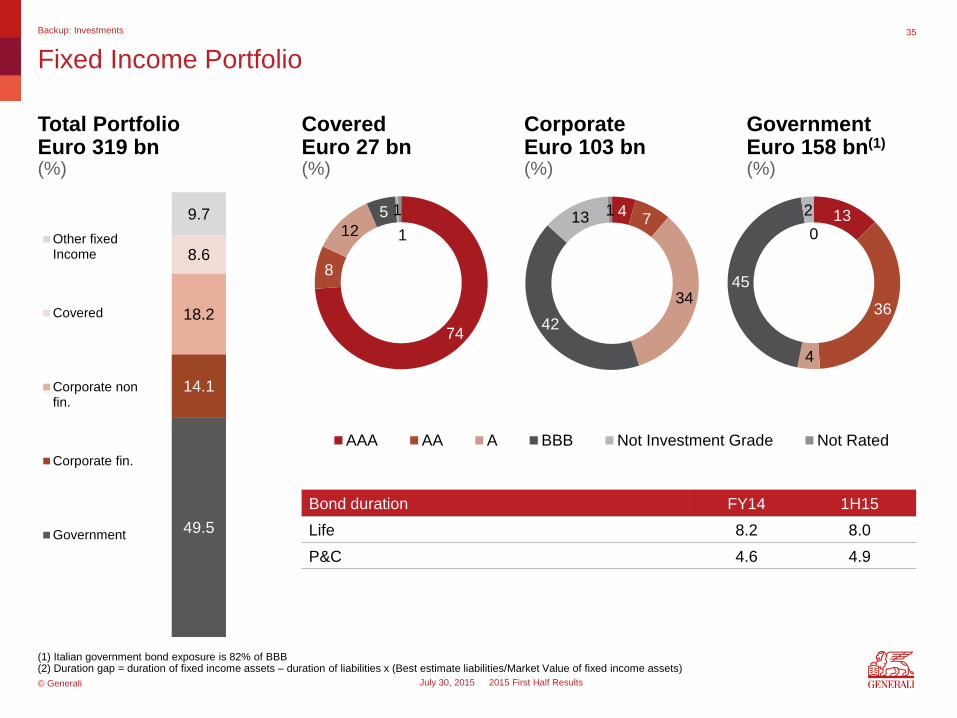
Fixed Income Portfolio
Backup: Investments 35
(1) Italian government bond exposure is 82% of BBB (2) Duration gap = duration of fixed income assets – duration of liabilities x (Best estimate liabilities/Market Value of fixed income assets)
Bond duration FY14 1H15
Life 8.2 8.0
P&C 4.6 4.9
49.5
14.1
18.2
8.6
9.7
Other fixedIncome
Covered
Corporate nonfin.
Corporate fin.
Government
Total Portfolio Euro 319 bn (%)
Covered Euro 27 bn (%)
Corporate Euro 103 bn (%)
Government Euro 158 bn(1) (%)

© Generali
July 30, 2015 2015 First Half Results
13
14
20
2 10
41
Italy Germany France CEE USA Other
8
15
27
2
1
48
37
5 21
7
4
27
Fixed Income Portfolio by country
Backup: Investments 36
49.5
14.1
18.2
8.6
9.7
Other fixedIncome
Covered
Corporate nonfin.
Corporate fin.
Government
Total Portfolio Euro 319 bn (%)
Covered Euro 27 bn (%)
Corporate Euro 103 bn (%)
Government Euro 158 bn (%)

© Generali
July 30, 2015 2015 First Half Results
78
19
3
Life
P&C
H&O
69
31
Quoted
Unquoted
60
6
34
Life
P&C
H&O
77
23 0
Life
P&C
H&O
56
25
19
Equity Equity Funds Alternatives
Equity & Equity-like
Backup: Investments
37
Life, P&C and
Financial
Life, P&C and
Financial
Life, P&C and
Financial
Listed and
Unlisted
Total Portfolio: Euro 19 bn (%)
Alternatives: Euro 3 bn (%)
Equity: Euro 10 bn (%)
Equity funds: Euro 5 bn (%)

© Generali
July 30, 2015 2015 First Half Results
82
18
Investmentproperties
Own use
65
16
11 3 4
Office
Residential
Retail
Logistic
Other/Mixed
Asset Allocation: Real Estate1
Backup: Investments
38
33
15 28
2
21
2 Italy
Germany
France
CEE
RoE
RoW
1 Data, at fair value, includes own use assets and property inventory 2 Detail referred to direct investments in real estate only
Total Portfolio: Euro 24.6 bn1
Breakdown by use2 (%)
Breakdown by country2 (%)
Breakdown by utilization2 (%)

© Generali
July 30, 2015 2015 First Half Results
Agenda
39
III. Backup
Costs Page 32
Investments Page 34
Financial debt Page 40
Life Page 43
Group Embedded Value Page 45
Definitions Page 47

© Generali
July 30, 2015 2015 First Half Results
Focus on financial debt
Backup: Financial debt 40
3,477 2,996
8,315 8,440
460 344
FY14 1H15
Senior Sub/Hybrid Other
FY14 1H15
Average cost (%) 5.62% 5.69%
Subordinated/Hybrid 6.21% 6.21%
Senior 4.13% 4.17%
Average maturity
(years) 6.88 6.65
Euro 12,253 m (1) Euro 11,779 m (1)
Total financial debt (Euro bn)
Average cost & maturity of financial debt (%)
(1) The amount of financial debt as of December, 31, includes the subordinated bond issued in May 2014 for a nominal amount of Euro 1 bn partly to refinance 2015
maturities

© Generali
July 30, 2015 2015 First Half Results
1,240
887
250
770
1,250
2,699
1,750
1,500 1,494
2016 2017 2018 2019 2020 2022 2024 2025 2026
Senior Hybrid Subordinated
Financial debt breakdown by expiry date/call date
Backup: Financial debt
41
(Euro m)

© Generali
July 30, 2015 2015 First Half Results
Agenda
III. Backup
42
Costs Page 32
Investments Page 34
Financial debt Page 40
Life Page 43
Group Embedded Value Page 45
Definitions Page 47

© Generali
July 30, 2015 2015 First Half Results
43
Life new business: APE
Back up: Life insurance
(€ m) APE Annual Premium Single Premium
1H14 1H15 LFL 1H14 1H15 LFL 1H14 1H15 LFL
Italy 1,177 1,159 -1.6% 702 517 -26.4% 4,757 6,422 +35.0%
France 425 535 +27.0% 162 233 +45.0% 2,625 3,018 +15.9%
Germany 418 448 +5.1% 278 278 -1.7% 1,404 1,695 +18.6%
CEE 64 87 +2.6% 60 75 -7.0% 36 128 +160.8%
EMEA 363 348 -5.8% 180 196 +5.4% 1,825 1,516 -17.1%
Austria 51 60 +19.3% 35 45 +27.9% 158 158 +0.2%
Spain 59 58 -3.6% 31 31 +0.1% 284 262 -7.7%
Switzerland 26 37 +22.5% 25 30 +0.2% 7 76 +811.8%
Lat. Am & Asia 73 131 +44.5% 60 112 +51.2% 133 189 +14.6%
Total 2,520 2,707 +5.4% 1,442 1,410 -5.1% 10,781 12,968 +19.7%

© Generali
July 30, 2015 2015 First Half Results
Agenda
III. Backup
44
Costs Page 32
Investments Page 34
Financial debt Page 40
Life Page 43
Group Embedded Value Page 45
Definitions Page 47

© Generali
July 30, 2015 2015 First Half Results
26,390 849
1,319 1,649
29,273
(934)
EV FY14 FX impact Normalised EVearnings
Investment, Tax andother Variances
2014 Dividend EV 1H15
45
Group embedded value rollforward
Back up: Group Embedded Value
Return on Embedded Value
RoEV Normalised RoEV
Group Embedded Value
Group EV per share
Group EV 1H15
9.7% 21.8%
18.7 €
Including
+ € 0.8 bn: increase in interest rates
(VIF and financial liabilities)
+ € 0.9 bn: positive performance of
equity market
Important return on
Embedded Value driven by
a positive combined ratio at
92.6% and positive Life
NBV at € 0.5 bn
(Euro m)

© Generali
July 30, 2015 2015 First Half Results
Agenda
III. Backup
46
Costs Page 32
Investments Page 34
Financial debt Page 40
Life Page 43
Group Embedded Value Page 45
Definitions Page 47

© Generali
July 30, 2015 2015 First Half Results
Definitions
Backup: Definitions 47
Total Operating Result Total operating result represents earnings before taxes, gross of interest expense on liabilities linked to financing activit ies,
specific net income from investments and non-recurring income and expenses
Adjusted Shareholders’
Equity
Shareholders’ Equity gross of minorities excluding gains and losses included in Other Comprehensive Income (OCI)
Operating RoE Operating Return on Equity indicates the return in terms of Operating Result on Group Shareholders’ Equity. It is calculated
according to the following ratio:
Total Operating Result adjusted to include:
- interest expenses on financial debt
˗ income taxes based on a mid-term expected tax rate as assumed in 2015 Target
- minorities interests
Adjusted Shareholders’ Equity
Financial Leverage Financial Debt / Financial Debt + Adjusted Shareholders’ Equity
Fixed Charge Coverage EBIT (net of disposals gains) / interest expenses on financial debt
Economic Solvency Ratio The Economic Solvency ratio is based on the internal model to the insurance scope of Generali Group, assuming the BSI
Group disposal and the application of the current IORP regime to the overall French pension portfolio.
The Group internal model is currently subject to the approval process conducted by the Group Supervisor as part of the
Solvency II implementation process which is scheduled to take effect January 1, 2016.

© Generali
July 30, 2015 2015 First Half Results
Disclaimer
Certain of the statements contained herein are statements of future expectations and other forward-looking
statements.
These expectations are based on management's current views and assumptions and involve known and
unknown risks and uncertainties.
The user of such information should recognise that actual results, performance or events may differ
materially from such expectations because they relate to future events and circumstances which are
beyond our control including, among other things, general economic and sector conditions.
Neither Assicurazioni Generali S.p.A. nor any of its affiliates, directors, officers employees or agents owe
any duty of care towards any user of the information provided herein nor any obligation to update any
forward-looking information contained in this document.
The manager charged with preparing the company’s financial reports, Alberto Minali, declares, pursuant to
paragraph 2 of article 154-bis of the Consolidated Law on Financial Intermediation, that the accounting
information contained in this presentation corresponds to document results, books and accounts records.
48

© Generali
July 30, 2015 2015 First Half Results
Next events
5 November 2015
9M 2015 results reporting
49

© Generali
July 30, 2015 2015 First Half Results
Team
Marta Porczynska
Team Assistant & Event Manager
+39 040 671402
Martina Vono
Team Assistant & Event Manager
+39 040 671548
Assicurazioni Generali
P.za Duca degli Abruzzi 2
34132 Trieste, Italy
Fax: +39 040 671338
e-mail: [email protected]
www.generali.com
Spencer Horgan
Head of Investor & Rating Agency Relations
+44 20 7265 6480
Stefano Burrino
Senior IR Manager
+39 040 671202
Emanuele Marciante
Senior IR Manager – Credit & Rating Agency Relations
+39 040 671347
Veronica Cherini
IR Manager
+39 040 671488
Rodolfo Svara
IR Manager
+39 040 671823
50

Thank you
51

GENERALI GROUP 2015 First Half Results