
General overview for investors
46
Transcript of General overview for investors


General overview for investors in Hungary’s Manufacturing sector
WHY INVEST?
Over recent years, hundreds of new industrial investments have been carried out
in Hungary. Mercedes-Benz, GM, Audi, Apollo Tyres, Hankook, Continental, Bosch,
Knorr Bremse, Magna Automotive, Grundfos, Lego, Rehau or Nestlé, to name just a
few of the international top enterprises who have opened or extended factories in
Hungary in the last years. All of them (and an increasing number of the Hungarian
companies also) have realized the competitive advantages of opening a Hungarian
manufacturing plant, company, logistics center or headquarter. Besides the stable
economy and government support, Hungary has unique benefits, even compared
to other CEE countries.
• Development and support of the Hungarian manufacturing sector is a
strategic focus of the Government
• Great Central European location within the Schengen zone, logistically ideal
to supply the whole European and Middle East market
• Competitive and enterprise friendly tax system, Hungary’s corporate tax
rate is 10-19% low
• Average wages in Hungary are ca. 60% less than the average of the EU
countries
• National and municipal incentives (both refundable and non-refundable
cash subsidies, tax allowance, land available for reduced price or for free)
• Wide range of national and EU grants available, with attractive conditions
• Developed transportation systems, extensive highway and railroad network
• Developed and active industrial property market, with well-built and stable
utility networks; moderate and regulated energy prices

MANUFACTURING SECTOR OVERVIEW
In harmony with the re-industrialization strategy of the European Union, the Hungarian Government has placed the industrial and manufacturing sector into the focus of the economic development strategy. Hungary wants to utilize EU funding (with maximum intensity of 50%) and national incentives to enterprise development and help expand major production oriented sectors. Within that, special emphasis will be placed on the support of high-tech industrial sectors, due to their multiplier effect. Potent high-tech industrial sectors can and will have a positive impact on stakeholders in supplier chains and the industrial services sector. Eventually, headcount is expected to rise in these sectors, including low-skilled jobs as well. From the aspect of foreign trade, motor vehicle manufacturing, related sub-sectors as well as pharmaceutical and food industry exports may constitute the axis of future growth.
To support the re-industrialization strategy the Hungarian Government introduced Irinyi Plan, a long-term development plan named after the Hungarian innovator János Irinyi. The program outlines main directions of the economic development. Through the implementation of these priorities the Hungarian Government adds further incentives to the industrial sector, supports innovation, helps create jobs and promotes the competitiveness and export of potential domestic enterprises and SMEs. In order to have a more modern industrial production structure, capable of creating more added value the Government shifts towards an innovation-focused economy and the industrial sector must be supported by up-to-date market and technical knowledge, R&D activity, and education.
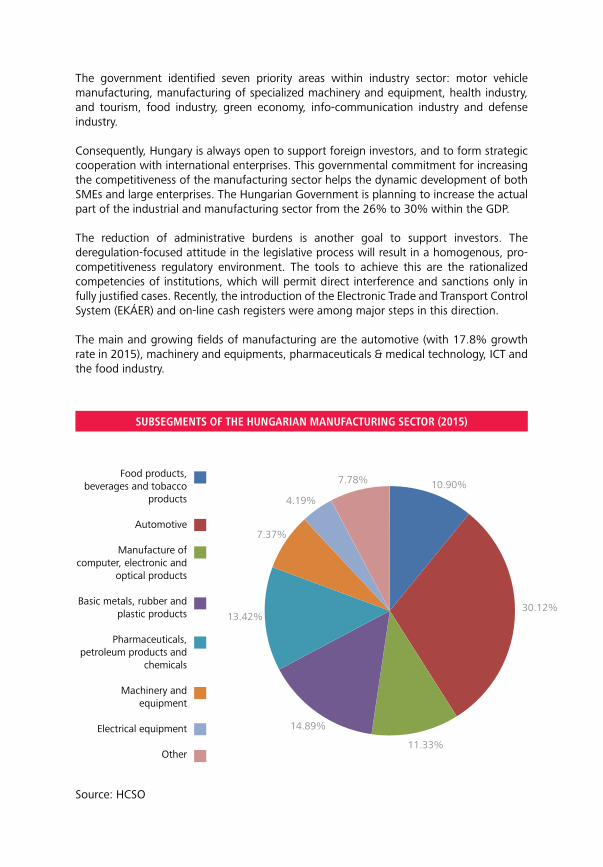
SUBSEGMENTS OF THE HUNGARIAN MANUFACTURING SECTOR (2015)
The government identiied seven priority areas within industry sector: motor vehicle manufacturing, manufacturing of specialized machinery and equipment, health industry, and tourism, food industry, green economy, info-communication industry and defense industry.
Consequently, Hungary is always open to support foreign investors, and to form strategic cooperation with international enterprises. This governmental commitment for increasing the competitiveness of the manufacturing sector helps the dynamic development of both SMEs and large enterprises. The Hungarian Government is planning to increase the actual part of the industrial and manufacturing sector from the 26% to 30% within the GDP.
The reduction of administrative burdens is another goal to support investors. The deregulation-focused attitude in the legislative process will result in a homogenous, pro-competitiveness regulatory environment. The tools to achieve this are the rationalized competencies of institutions, which will permit direct interference and sanctions only in fully justiied cases. Recently, the introduction of the Electronic Trade and Transport Control System (EKÁER) and on-line cash registers were among major steps in this direction.
The main and growing ields of manufacturing are the automotive (with 17.8% growth rate in 2015), machinery and equipments, pharmaceuticals & medical technology, ICT and the food industry.
Food products, beverages and tobacco
products
Automotive
Manufacture of computer, electronic and
optical products
Basic metals, rubber and plastic products
Pharmaceuticals, petroleum products and
chemicals
Machinery and equipment
Electrical equipment
Other
Source: HCSO
10.90%
30.12%
11.33%
14.89%
13.42%
7.37%
4.19%
7.78%

In general, the recovery of Hungarian manufacturing was slow after the 2008-2009 inancial crisis, but following 2012, a clear upward trend can be seen in all main manufacturing indicators. Manufacturing sector’s growth rate was 8.1% in 2015; 26% of the Hungarian GDP was generated by the manufacturing sector in 2015. Decreases were recorded only in two of the thirteen subsections of manufacturing in 2015. Out of the three greatest subsections, the production of transport equipment rose the most by 17.2%, while the output of computer, electronic and optical products went up by 6.4%. The manufacturing of food products, beverages and tobacco products was characterized by a moderate growth (4.3%) mainly due to an upturn in exports representing more than 40% of total sales; the volume of domestic sales only slightly increased.
The total growth of the manufacturing sector’s export activity was 8.7% in 2015 which was the main pulling force of the segment. The domestic sales of the manufacturing sector’s products increased by 6.7% in that period.
Investment trends in the manufacturing sector are also an indicator of the manufacturing sector’s reliable growth. The investment index similarly shows a clear upward trend from 2012. Developments in manufacturing, representing more than a third of investments in the national economy, were 12.4% higher than a year earlier in the second quarter of 2016.
Two manufacturing subsections gave more than half of all export sales. The export volume of vehicle production representing 36,5% of manufacturing exports - along with a continuous increase over the year - rose at the fastest rate of 15.6%. The second largest subsection, the manufacture of computer, electronic and optical products had 14.6% share within the export of manufacturing sector.
MANUFACTURING SECTOR - INVESTMENTS (BILLION HUF)
2012 2013 2014 2015
1550
1450
1350
1250
Source: HCSO
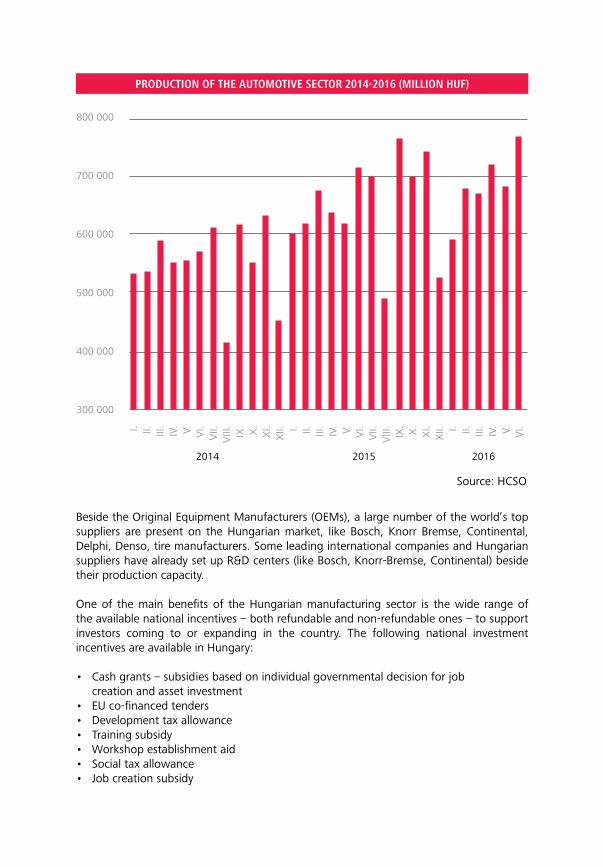
PRODUCTION OF THE AUTOMOTIVE SECTOR 2014-2016 (MILLION HUF)
800 000
700 000
600 000
500 000
400 000
300 000
I. II. III.
IV. V. VI.
VII.
VIII
.IX
.X
.X
I.X
II. I. II. III.
IV. V. VI.
VII.
VIII
.IX
.X
.X
I.X
II. I. II. III.
IV. V. VI.
2014 2015 2016
Beside the Original Equipment Manufacturers (OEMs), a large number of the world’s top suppliers are present on the Hungarian market, like Bosch, Knorr Bremse, Continental, Delphi, Denso, tire manufacturers. Some leading international companies and Hungarian suppliers have already set up R&D centers (like Bosch, Knorr-Bremse, Continental) beside their production capacity.
One of the main beneits of the Hungarian manufacturing sector is the wide range of the available national incentives – both refundable and non-refundable ones – to support investors coming to or expanding in the country. The following national investment incentives are available in Hungary:
• Cashgrants–subsidiesbasedonindividualgovernmentaldecisionforjob
creation and asset investment• EUco-inancedtenders
• Developmenttaxallowance
• Trainingsubsidy
• Workshopestablishmentaid
• Socialtaxallowance
• Jobcreationsubsidy
Source: HCSO

The corporate income tax rates are also an attractive aspect of the investment: the tax rate is 10% of the positive tax base up to ive hundred million forints and 19% for the part above ive hundred million forints (cc. 1.6 million euros).
In the manufacturing sector a digital revolution is in progress. In the next few years manufacturing enterprises and SMEs will need major investments with the focus on digital technologies like sensors, connectivity devices and software licenses to preserve their competitive advantages. The R&D activity within the sector is also increasing partly due to the available tax allowances and EU funds. The Hungarian Government has launched the Industry 4.0 National Technology Platform with the participation of research institutions, education institutions and companies having R&D activity in Hungary. This program provides a framework for companies to support high added value research and development work, all of the newly established or Hungarian companies can generate proit from that Industry 4.0 program. With this program the government would like to motivate Hungarian SMEs and large enterprises especially in the application and development process of the digital manufacturing and the internet of things.
ACQUISITION OPPORTUNITIES IN THE MANUFACTURING
SECTOR
25 years after of the regime change in Hungary, several company owners are in the age of retirement. These market participants would like to sell their companies and because of this impact, the Hungarian M&A activity will increase in the manufacturing sector as well. This trend generates attractive opportunities to acquire functioning businesses (with established capacities, skilled and well-trained labor) and to complete new investments. Some of these potential manufacturing companies are working for the world’s largest enterprises as suppliers.

VOLUME INDEX OF PRODUCTION, MANUFACTURING SECTOR IN THE EU
COUNTRIES MAY OF 2016 (2010=100%)
Slovakia
Estonia
Latvia
Ireland
Romania
Lithuania
Hungary
Poland
Czech Republic
Denmark
Slovenia
Austria
Serbia
Bulgaria
Norway
EU average
Germany
Belgium
Croatia
Euro area
United Kingdom
Luxembourg
Spain
Netherlands
Portugal
Italy
Finland
Sweden
France
Malta
Greece
Montenegro
Cyprus
0.0% 20.0% 40.0% 60.0% 80.0% 100.0% 120.0%
Source: Eurostat
140.0%

COST-EFFECTIVE AND SKILLED LABOR MARKET
The Hungarian unemployment rate shows a slight decline at around 6.5%, with a wide variation by region. The highest rate (10.7%) was in Northern Hungary, while the lowest rate was in the West-Transdanubian Region (3.2%). The investors in the less developed regions with higher unemployment rate are especially supported with governmental and municipal incentives, cash subsidies and tax allowances.
Hungary has one of the cheapest labor markets in the EU: the Hungarian average wage is almost the lowest in the EU (5th lowest average salary in EU, 2015). Based on the average labor cost per productivity ratio, Hungary is still one of the best locations for manufacturing plants. The oficial minimum wage in the country is also one of the lowest in the EU, ca. 360 euro / month.
The Hungarian labor market has skilled workers employees. Almost 90% of employees leave school at 18 with at least a medium level inal examination (this indicator is among the best within the EU), and over a quarter have a university level degree. The Hungarian educational institutions are lexible and ready to cooperate with industry players. For example Audi, Mercedes-Benz and Bosch have set up dual training cooperation with local universities to prepare students for working life. In these dual training cooperations carmakers and other companies are paying students to take more practical, job−oriented training in special programs designed to improve the supply of Hungarian workers. Audi operates programs in 11 departments in cooperation with Széchenyi István University in Győr, with Budapest University of Technology and Economics, with University of Miskolc, and with Óbuda University. Since 2012 Mercedes has a partnership with the Kecskemét College. The company started with mechatronic maintenance, vehicle mechatronics, and vehicle coating and now also includes a program for toolmakers and a management program.

SUCCESS STORIES FROM THE MANUFACTURING SECTOR
• With the most developed pharma sector in the region Hungary provides an ideal base for life science companies. For example the Hungarian leading pharmaceutical company, Richter Gedeon Nyrt. is spending 50 million euros on an investment project to expand its biotechnology plant founded in 2012 to develop and manufacture biosimilar products, which has a unique, cutting edge technology in the region.
• The Hungarian health protection product manufacturer Béres Gyógyszergyár invests 3.2 billion HUF (10 million EUR) into a new production department in Szolnok. The company receives a non-refundable 50% state support with creating 60 new jobs. Béres would expand the size of their base by 1,640 sqm, the size of their logistics warehouse by 800 sqm, they would install new technologies, improve infrastructure and nearly double production capacity.
• The automotive industry is the leading and most dynamic segment of the manufacturing sector in Hungary. Automotive production accounts for 30% of Hungarian manufacturing and represents 18% of exports. Over 700 companies work in this ield with the top four Original Equipment Manufacturer companies (Audi, Mercedes, Opel, Suzuki) employing over 20 000 people.
• Within the automotive subsector, Mercedes and Audi have invested the most into the production. Mercedes-Benz Hungary is building a new plant next in 2017 to its existing factory in Kecskemét; 150 thousand cars-a-year will be manufactured here, which is being built with an investment of 1 billion euros.
• Borgwarner Turbo Systems Kft., the U.S.-based supplier of turbocharger systems and other automotive components is investing 15.5 billion HUF in Komárom-Esztergom county, Hungary. The approximately 51 million EUR investment is supported with a 1.7 billion HUF (5.5 million EUR) state subsidy.
• Suzuki: one of the irst international car brands to open a Hungarian plant. Founded in 1991, manufacturing started in 1992. Until the inancial crisis of 2009, it was the domestic market leader with a 20% market share. It is still one of the biggest car producers with an annual production of ca. 150 000 vehicles.
• Robert Bosch Elektronika Kft. (part of Bosch Group) is creating 600 new jobs in Hatvan, Hungary. Backed by a dedicated government decision, the project run between 2016 and 2018, with a total capital cost of 18.9 billion HUF, including a 4.7 billion HUF(15 million EUR) grant provided by the Hungarian government. This project will involve both the purchase of machines to produce automotive electronic parts and the expansion of existing capacity.


I. PROJECT BACKGROUND
SHORT DESCRIPTION
Funding requirement
Concr et e Pipe
Sale of 100% ownership of the Company preferably to a strategic investor
SectorLocation
Overall Budget of the Project
Reinforced Concrete Product Manufacturing
Monor, Hungary
EUR 3.3 million
BA
SIC
PR
OJE
CT
DA
TA
EUR 3.3 M
Project owner
The Company is owned by its founder (90% share) and his son (10% share). The founder is the
managing director of the Company and is planning retirement from the business due to his age.

The Company produces prefabricated reinforced concrete product parts mainly used in civil
engineering. The Company’s leading products: reinforced concrete ROCLA tubes of a large
diameter, reinforced concrete tubes with glass fi bre reinforced polyester lining, water tower parts
and reinforced concrete telecommunication transmission towers. In addition, the Company carries
out precision welding for Western European customers through its German and French branch
offi ces.
The technology of manufacturing reinforced concrete tubes with glass fi bre reinforced polyester
lining is patented by the Company. In comparison to other anti-corrosion solutions, the Company’s
glass fi bre reinforced polyester lining provides permanent protection. The Company also owns
patents for other technological solutions it had developed.
The technical quality of the Company’s products is outstanding; the number of customer complaints
is signifi cantly lower than those of the Company’s competitors. No other manufacturers offer high-
functionality products of similar quality in the regional market.
The Company’s customers in the segment of concrete product manufacturing are primarily civil
engineering contractors. The Company receives project-based orders, acting as a subcontractor. In
addition to production, the Company also regularly provides construction and installation services
in connection with its products. Over the two decades of its operation, the Company has provided
its services to a number of clients, and its products are widely used in the Hungarian water supply,
water storage and sewerage systems. The Company’s telecommunication transmission towers have
been installed in a number of countries around the world.
The large-scale sewerage and water supply system development projects in Hungary (to be
completed by 2020) offer the Company a signifi cant opportunity for growth. The relatively
underdeveloped sewerage systems in the neighbouring countries of Central Eastern Europe offer
potential for international expansion. Management believes that a strategic investor with experience
in international sales could make a signifi cant contribution to the growth of the Company.
The Company’s premises are located close to Budapest, Hungary. The premises and the equipment
are owned by the Company. The Company has a staff of approximately 65 people.
II. PROJECT DESCRIPTION

III. FINANCIAL INDICATORS
Estimates and main indicators
The Company has realised EUR 5.2 million of revenues in 2015, of which EUR 3.4 million is
related to concrete product manufacturing and EUR 1.8 million to precision welding.
Key fi nancial data (EUR 1000) 2012 2013 2014
Export revenue 2,814 2,675 2,410
Domestic revenue 1,859 1,424 1,614
Total Revenue 4,673 4,100 4,024
EBIT 257 31 201

Investment opportunity Acquisition of 100% stake
Price expectations EUR 3.3 million (after subtraction of debt)
IV. INVESTMENT OFFER
CONTACT DETAILSKRISZTINA SZILÁGYI
communication and marketing director +36-29-610460; +36-20-5292829

I. PROJECT BACKGROUND
Short background Single use medical devices, wound care dressings, feminine hygiene care products, injection
moulds, machinery, robotics manufacturer.
Organisation Dispomedicor has been a basic health care supplier for the Hungarian domestic market
since 1950.
Subsidiaries:S.C. Dispomedicor Steril Srl, Romania
S.C. Pharmico Srl, Romania
DispoAmecor Arab Hungarian Medical Equipments Co. Ltd., Egypt
- 100% ownership - 100% ownership - 60% ownership
SHORT DESCRIPTION
Funding requirement
Dispomedicor - Cannula and needle pr oduct ion
To set up a factory producing
55 million pcs of cannula/month.
EUR 12.6 MSector
Project owner
Location
Implementation period
Overall Budget of the Project
Funding requirement
Health Care
Dispomedicor Zrt.
Eastern Region of Hungary
2014-2018
EUR 42 million
30% - 50% of the overall budget
BA
SIC
PR
OJE
CT
DA
TA

II. PROJECT DESCRIPTION
General background of the management (including partner companies and
relations)
General Manager, Mr. Antal Nagy.
• Vice President of the Hungarian-Arab Committee
of the Hungarian Chamber of Commerce and Industry
• Co-Chairman of the Hungarian Medical Cluster companies
• Business diplomat
• Chairman of Dispomedicor Zrt.
• Chairman of DispoAmecor Co. Ltd. Egypt
We plan to build up a cannula drawing and grinding factory in the eastern region of Hungary,
which will produce 55 Million cannula / month of products. These cannula would be further
processed on totally automatic product lines to be production lines by Dispomedicor Zrt.,
manufacturing fi rst quality AVF needles, SVS needles, safety and normal hypodermic needles and
special cannula. Dispomedicor shall be the main supplier of the manufacturing machinery and
equipment.
One part of the cannula production will be used in-house and the remaining capacity will be sold
to export markets.
Type of item Annually quantity
AVF needle 13.7 Million pcs
SVS needle 27.3 Million pcs
Normal hypodermic needle 291.6 Million pcs
Safety hypodermic needle 97.2 Million pcs
Other special cannula 175.1 Million pcs
The automated equipment requires minimal maintenance, according to this we calculated with
15 minutes of maintenance per shift. The realization of this investment is based on three shifts.
The planned project's expenses are EUR 42 million. The investment project will be returned in
5.87 years.
WHY INVEST?• Asian producers are the main competitors on this mass market. A European-based factory could
be utilised thanks to the favourable logistical advantage of the factory location.
• With local production, the European, North American, African and South American markets can
be totally covered, and thanks to the automated equipment, these components can be produced
profi tably.
• This facility would be the largest unique European manufacturer for cannula drawing,
grinding and different types of needles.
• The new joint company will create new workplaces for 92 people in Hungary.
• The European production is combined with high level automation and could be delivered
by Dispomedicor Zrt.’s own transport vehicle fl eet.
Competitive advantages
Dispomedicor Co. possesses all medical device related commercial information including
technologies related to product manufacturing. The machines delivered by Dispomedicor Zrt
are tested, computer- controlled and are suitable for immediate industrial production. No time-
wasting procedures!
The project is supplied with a complete design to production package:
• Design of the production technology
• List of ‘composed’ materials
• Help in purchasing raw materials
• Prototyping of the product
• Layout planning of the building 31
Dispomedicor Zrt. can replace 10 sub-contractors, i.e. product designer, market research and
marketing (company), patent agent, Permission Authorization, a company dealing with quality
assurance and clinical tests, logistics, injection mould, and machine, etc.
Property rights, licenses, certifi cations
Safety needle patent of Dispomedicor Zrt. The factory will be certifi ed by SGS United Kingdom
for ISO 9001; ISO 13485; ISO 14001 and CE mark.
Target groups
Manufacturers and distributors of single use medical devices mainly in Europe, Russia, the Balkan
Region and MENA Countries.
Short market description, main competitors
Main manufacturers in Europe: Chirana T Injecta Slovakia, Handle S.A. France, KD Medical
Germany and Nipro Japan.
Key strategic partners
• Islamic Development Bank (IDB)
• European Bank for Reconstruction and Development (EBRD)
• Islamic Corporation for the Insurance of Investment and Export Credit (ICIEC)
Access to foreign market, export market
• Dispomedicor Zrt. has maintained a strong market position not only in the domestic market of
Hungary but also in export markets like Europe, America, Africa and Asia.
• Dispomedicor Zrt. intends to regain the lost markets of South America and Russia and to provide
stable supply and good quality hypodermic needles at competitive prices.
• The Joint Venture could be the registered as leading supplier of Fresenius Medical Care, Germany,
who is ready to change its Asian supplier to a unique European one for an annual quantity of
17,000,000 pieces of AVF needles.
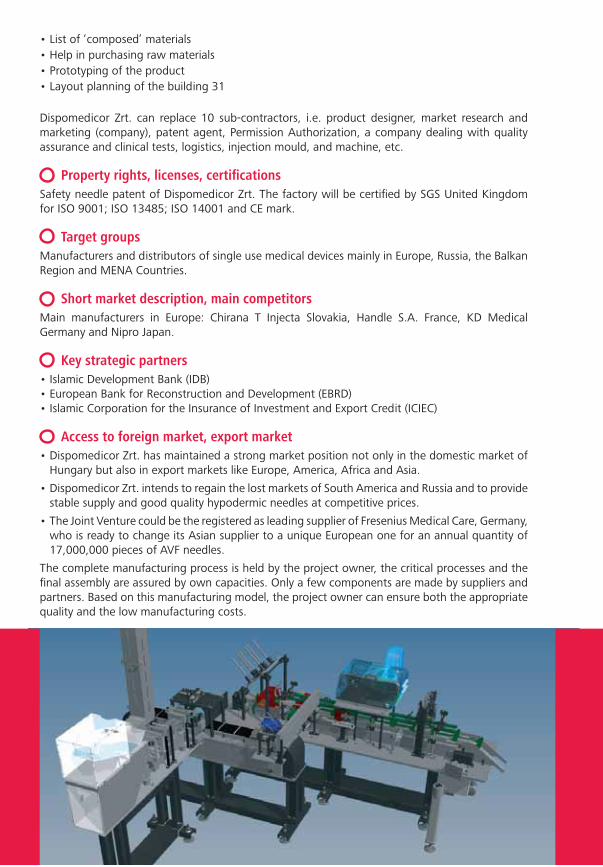
The complete manufacturing process is held by the project owner, the critical processes and the
fi nal assembly are assured by own capacities. Only a few components are made by suppliers and
partners. Based on this manufacturing model, the project owner can ensure both the appropriate
quality and the low manufacturing costs.

Basic P&L plan
(in EUR 1000) 2014 2015 2016 2017 2018 2019 2020 2021 2022 2023 2024 2025
Revenues and Other Income1.)Sales and other operating revenues2.)Income from equity affi liate3.)Other income
I.Total Revenues and Other Income
(I.=1+2+3 row)
0 16856 17531 18232 18961 19719 20508 21329 23003 23923 24880 25875
0 16856 17531 18232 18961 19719 20508 21329 23003 23923 24880 25875
Costs and Other Deductions
4.) Raw Material
5.) Operating expenses
License Fees
Utilities
Travel Expenses
Repair and maintaenance costs
Vehicle Expense
Leasing Commissions
Salary and Wages
Other (i.e. legal fees, auditing, R+D etc.)
6.) Selling, general and administrative expenses
Marketing
7.) Depreciation, depletion and amortization
8.)Taxes other than on income
9.) Interest and debt expense
0 4245 4287 4330 4374 4417 4461 4506 4551 4597 4643 4689
1679 2180 2202 2224 2246 2269 2291 2314 2337 2361 2384 2408
500 88 89 89 90 91 92 93 94 95 96 97
0 624 630 637 643 649 656 662 669 676 682 689
0 0 0 0 0 0 0 0 0 0 0 0
0 474 478 483 488 493 503 508 513 518 523
0 0 0 0 0 0 0 0 0 0 0 0
0 0 0 0 0 0 0 0 0 0 0 0
379 623 629 635 642 648 655 661668 674 681 688
800 372 376 379 383 387 391 395 399 403 407 411
1000 1283 1296 1309 1322 1335 1348 1362 1376 1389 1403 1417
0 0 0 0 0 0 0 0 0 0 0
0 3925 3964 4004 4085 4125 4167 4208 4250 4293 4336
0 0 0 0 0 0 0 0 0 0 0
0 314 317 320 323 326 330 333 336 340 343 346
II. Total Costs and Other Deductions
(II.=4+5+6+7+8+9 row)
2679 11947 12066 12187 12309 12432 12556 12682 12809 12937 13066 13197
III.Income Before Income Tax
Expense (III.=I.-II. row)
-2679 4909 5464 6045 6652 7287 7952 8647 10194 10986 11814 12678
IV.Income Tax Expense 0 123 137 151 166 182 199 216 255 275 295 317
V.Net Income (V.=III.-IV. row) -2679 4787 5328 5894 6486 7105 7753 8431 9939 10711 11518 12361
VI.Cumulated net income
VII.Dividend
VIII.Retained earnings (VIII.=VI.-VII. row)
Cumulated retained earnings
-2679 2107 7435 13329 19814 26920 34673 43103 53043 63754 75272 87633
0 0 2131 2357 2594 2842 3101 3372 3967 4285 4607 4944
-2679 4787 3197 3536 3891 4263 4652 5058 5964 6427 6911 7417
-2679 2107 5304 8840 12732 16995 21647 26705 32669 39095 46006 53423
EBITDA, KPIs
2014 2015 2016 2017 2018 2019 2020 2021 2022 2023 2024
ROE -6.1% 10.1% 10.5% 10.8% 11.0% 11.2% 11.3% 11.3% 12.3% 12.2% 13.1%
ROA -115% 8% 9% 10% 11% 11% 11% 11% 12% 12% 12%
EBIDTA -2,679 8,835 9,429 10,049 10,696 11,372 12,077 12,813 14,402 15,237 16,107
III. FINANCIAL INDICATORS
Assumptions and main indicators
The calculation includes 81% of indirect costs, which originate from Dispomedicor amortization
data for the machinery. In this respect, the capacity utilization of the line is 89-90 %.

Quantitative and Qualitative Indicators
QUANTITATIVE INDICATORS
Revenues / year 2015 EUR 16,856,000
Mid-term revenues/year expectation EUR 20,508,000 (Y2020)
Available owner’s resources /available funds
Dispomedicor Zrt. will support the project to obtain
the fi nancial resources from the EU OECD funds and
to apply for EU and Hungarian Government funding.
The rest of the investment would be fi nanced by an
advanced loan also from the Hungarian Government
or could be fi nanced by the investor partner.
Funding requirement EUR 42 million
Form of investment Joint Venture Company
Proposed capital/equity structure60% Hungarian share
40% Saudi Arabian share
Investment scheduleThe preparation could start in 2014 Q1. The permission and construction phase could start in
2014 Q2.
IV. INVESTMENT OFFER
CONTACT DETAILSMR. ANTAL NAGY, CEO
+36 30 749 [email protected] www.dispomedicor.hu


I. PROJECT BACKGROUND
Short background HandInScan Kft. was founded in 2012 as a spin-off of the Budapest University of Technology and Economics (BME). Original founders were private individuals from the engineering development team, aiming to create a device to control objectively hand hygiene performance of medical staff. It was named Semmelweis Scanner, following the tradition of the great physician who first recognized the importance of hand hygiene. The innovation and the technology transfer received numerous international awards, including ICPIC Innovation Academy award (Genova, 2011), the Red Dot Design Award – best concept – in Singapore (2015) and the Swedish Gran Prize (2016). After the initial successful validation with early prototypes of the Semmelweis Scanner, the application domains were significantly extended to target clean manufacturing sites, the food industry and high-end tourism. In early 2013, HandInScan received a seed investment of 540 k EUR from DBH Investment Group, a Hungarian VC investor company, to carry out further R&D, prototyping and field validation of its technology. In 2016 HandInScan closed a Series A investment round of 1.45 M EUR by Perion Investment Fund. The project was also supported by numerous R&D grants, with a total budget of 800 k EUR.
SHORT DESCRIPTION
Funding requirement
HandInScan – a computer-enhanced hand hygiene
training and control device
HandInScan is an innovative health-tech company providing a technology driven, IP protected solution for the prevention of healthcare-associated infections (HAIs) and biological contamination. Its disruptive life, cost saving technology and quality-insured methods are to be extended to clean manufacturing plants, food service stations and the hospitality industry as well.
EUR 5 MSector
Project ownerLocation
Implementation periodOverall Budget of the Project
Funding requirement
Health technology
HandInScan Kft.
Budapest, Hungary
2017-20
15 M EUR
5 M EUR
BA
SIC
PR
OJE
CT
DA
TA

II. PROJECT DESCRIPTION
General background of the management The current management team of the company holds expertise in the key technical and financing areas.
•
•
•
•
Problem• Healthcare-AssociatedInfections(HAI)arealeadingcauseofdeathevenintheEUandtheUSA
• HAIresultsin1.4mcasesadayglobally
• Causingover250000unnecessarydeathsayearinthewesternworld(accordingtoWHO),
despite all current governmental campaigns and educational programs • Westernhospitalsstillhavea10%averageHAIratio,andHungaryseesevenmore
(undocumented cases)• EffectivehanddisinfectionhasshowntodecreaseHAIbyatleast30%
The cost of poor hygiene• HAIisaleadingcauseofdeathbothintheEUandtheUSA
• Healthcareworkers’adherenceiswellbelowtherequiredlevel
• DirectcostsforHAIinEurope:9.3bnEURannually
• Anaverage500bedhospitalloses1.7mEURoninfectionsannually
• HAIcosts96bnUSDtotheUSeconomyyearly,includingthesickdaysandthepermanent
health damage
HandInScan developed an integrated system that utilizes digital imaging combined with proprietary software methodology to identify treated versus unaffected areas after regular hand rubbing. For that, an UV-dye enabled alcohol-based disinfectant is employed. Effective hand washing was showntodecreaseHAIby30%,atleast.OnlyHandInScanensuresqualitycontrol,tacklinginitialtraining and ongoing monitoring as well. The system records each hand washing event of every person,andgeneratesstatisticstothemanagement.HandInScanteachesthevalidatedWHO’s6-step hand washing protocol (part of the EN1500 and US CDC recommendation), with an order of a magnitude higher cost effectiveness than of the closest competitor.
HandInScan employs state-of-the-art image processing algorithms, relying on Artificial Intelligence methods, and able to create new theoretical results, serving further product development. The usability of the system has been optimized, and there is a custom designed integrated reporting system, which is portable to any smart device or tablet. As for the hardware, it is built on industrial grade components with in-house-designed electronics, with function-driven, yet sleek exterior design.
Dr Tamás Haidegger, CEO: Ph.D. in electrical engineering,MSc in biomedical engineering.Dr Haidegger is an associate professor at Óbuda University and research area manager at ACMIT. He has been serving as the CEO/CTO in the early stage of the company, and built a vast networkofcollaborationswithmedicalinstitutionsandorganizations,suchasWHO.Péter Róna, COO: received hisM.Sc. degree in the ield of computer science at BME. Hejoined the HandInScan founders in 2011 bringing in complementary project management and innovation financing knowledge, and has been running the business operations since. CsabaHankó(Sales&MarketingDirector):gained12+yearsofexperience inmedtechandhealthsalesandmarketingduringdifferentmanagementpositions(WeyergansHighCareAG,3DHISTECH Ltd.) held over the years. Advisoryboardmemberswhoarealsoparticipatinginthestrategy:WilliamBenkő(Presidentof AmCham Hungary), László Ürge (CEO of ComInnex Inc).

HandInScan operates a value-added revenue model, optimized to create a sustainable business modelbasedonrecurringfees.Majorrevenuestreams:equipmentsalesorrentals,handhygieneauditand trainingservices.HandInScandevice’sdistributionsalesprice is7-10kEURand thehardware’smanufacturingcostcanbesigniicantlyreducedwithscaling.
Property rights, licences and certificatesHandInScan products and technologies are protected by patents and appropriate know-how in order to secure its innovations. The Hungarian patent application was filed by Budapest University of Technology in 2010, later acquired by the company. The protection has been extendedinternationally with the PCT filing in 2011—national extension for the US was accepted, for Canada and Europe is in progress. Further patents have been submitted in 2016.
Current position in the market• HandInScanhasstartedthesalesprocessin2015,andthecompanyalreadysoldcloseto100devices.• InMay2013,NationalUniversityHospitalofSingaporeteamedupwiththeHandInScanteam to transact an objective evaluation for this process. During 5 days, HandInScan assessed more than 5,000 healthcare workers with the device. • TechnologyvalidationhasbeenachievedthroughclinicaltrialsinHungarianhospitals(Bethesda Hospital, Miskolc General Hospital, etc., 2013-) .• HandInScanhasbeenanintegralpartofthemedicaldoctoraltrainingprogramatSemmelweis University (2012-).• Thetechnologyhasbeenintroducedtoapp.100kpeopledirectly,mostlytopotential customers and partners at the MEDICA Expo (2014, 2015), Arab Health Expo (2014, 2015, 2016), OECD Forum (2016) etc. • CurrentlyHandInScanisincontactwithover40potentialdistributors,coveringglobalregions, the first couple of contracts have been signed. • In2016,HandInScanhasalreadystartedinitialmarketdevelopmentandsalesactivitiesintheUSA.
Target groupsHandInScan identified three major market segments, where improvement on hand hygiene practices brings great benefits through different measures. •Healthcaresector–hospitals,nursinghomes,dentists•Hospitalityindustry–mostlyfastfoodchains,restaurants,cruiselines•Cleanmanufacturingcompanies–biotechnologyplants,pharmaceuticalcompanies,foodandbeverage manufacturing
Duetothespeciicityofthemarket(structureofthehealthcaresystemandlocalculture)WesternEuropeancountries,especiallyGermanspeakingcountriesandtheUSAareHandInScan’sprimarytarget markets. In these countries, the estimated market potential is 6-700 000 devices.

Short market description, main competitorsInthenextiveyearssigniicantgrowth(CAGR~20%)isexpectedinhandhygienerevenuesbasedon a research by Frost and Sullivan. Automated hand hygiene monitoring devices are playing a moreandmoreimportantroleinpreventinghealthassociatedinfections.TheWesternEuropeanhand hygiene market earned revenue of $271.3 million in 2010 and estimates this to reach $446.9millionin2017.Current technologies are addressing different parts of the complex problem of hygiene. No other technologyprovidesquantitativemeasurementandreportonhandhygiene.Relatedcompaniesinclude:SureWash(IE),Hygreen(US),Biovigil(US)andcompliancemonitoringsystemshavebeenprovided by e.g., Ecolab (US) via a strategic alliance with Proventix (US) and Hill-Rom (US). Noneofthosecanprovideobjectiveresultsonhandhygienetechnique.Hygienecontrolinfoodand manufacturing industries use only manual methods.
Competitive advantages•Immediateuserfeedbackaboutthehandwashingtechnique•Reportsforthemanagementtodetectrisksofhandhygieneprocesses•UsingHandInScancangenerateextracredibilityininfectionsensibleindustries•Objectivetoolforhealthcareinstitutestoauditemployees’andvisitors’handhygienestatus•IntegrationopportunitytohospitalITsystems
Key strategic partners• HandInScan’smainpartnerinproductdevelopmentisBudapestUniversityofTechnology(BME), and the Austrian Centre for Medical Innovation and Technology (ACMIT).• PaulHARTMANNAG(aglobalhygienecompanybasedinGermany)isakeypartnerandserves as an agent in many countries.• SalesdistributioncontractsaresignedfortheterritoriesofUK,AT,RO,NL,BE,LU,US,CA,JP, KR, negotiation for another 10 countries are ongoing.
WHY TO INVEST?
•CuttingedgetechnologywithIPprotectionandseveralawards•Dynamicallygrowingmarketasautomatichandhygienecompliancemonitoring devices becoming standards in the next 3-5 years•StrongR&Dcapabilityandtangibleresults,allowingafurtherproductdevelopment•Experiencedmanagementteam(avg.10+years)intheieldofmedtechand business operations•Growingglobalpartnershipnetwork,furtheropportunitiestoenternew geographical markets

III. FINANCIAL INDICATORS
Assumptions and main indicators
P&L, financial indicators (summary of the investment plan, and the P&L)
EUR ‘000 2016 2017 2018 2019 2020
Revenue 685 1,042 2,017 4,335 7,699
OPEX 1,066 1,313 2,057 3,832 4,436
EBITDA -381 -271 -40 503 3,263
Quantitative and Qualitative Indicators
QUANTITATIVE INDICATORS
Revenues/year2015 110 k EUR
Mid-term revenues/year expectation 5-8 M EUR
Mid-term market penetration expectation (%) 5%
Available owner’s resources / available funds In early 2016 HandInScan closed Series A investment round of 1.45 M EUR.
Required amount of investment 5 m EUR
Form of investment Equity
Proposed capital/equity structureMinoritystake(<25%)fortheinvestoronlongterm.
Investment scheduleThe5millionEURcapitalinvestmentisneededin2017-18.Therequiredamountwouldcontribute to the step into the various segments in the USA and other American countries and to continue the development of the Semmelweis Scanner.
Proposed exit policyTrade sale mainly to a strategic investor – sideward or forward integration.
IV. INVESTMENT OFFER
CONTACT DETAILSDR. TAMÁS HAIDEGGER
http://www.handinscan.com/


I. PROJECT BACKGROUND
SHORT DESCRIPTION
Funding requirement
Medical device
Sale of 76% of the shares of a developer, producer
and trader of ECG and blood pressure devices as well
as related integrated analysis systems. 24% of the
shares will be distributed to the management team as a
motivational scheme.
Sector
Location
Overall Budget of the Project
Medical equipment manufacturing
Debrecen, Hungary
EUR 4.4 million
BA
SIC
PR
OJE
CT
DA
TA
EUR 4 .4 M
Project owner
The managing director is the sole owner of the company.
The management team consists of 3 professionals responsible for the top level management,
sales, development and manufacturing activity with outstanding expertise in the fi eld of medical
equipment and the healthcare market.

The company is a well-known developer and producer of medical devices for hospitals, cardiology
clinics and general practitioners. Key products include ambulatory ECG Holter monitors, blood
pressure monitors, resting and stress ECGs, as well as related devices and a unique software which
performs high-quality analysis and evaluation of test results. The company’s product portfolio
covers an extensive range of cardiology devices. Nevertheless, continuous product development
activity resulted in top-notch, unique products targeting the steadily growing niche healthcare
sector of telemedicine which allows for the fast and easy transmission and remote analysis of data.
Product parts are manufactured by local co-operating partners based on the company’s know-how,
while design, assembly and testing is executed within its own capacity. The equipment is jointly
developed with local universities acknowledged in the fi eld of healthcare and medical devices.
85% of the revenue of the company - which is in possession of all the necessary product
certifi cations - is generated from 40 different export markets through its distribution partners. The
main areas of operation include Western and Eastern European countries, Japan, China, Korea,
and Turkey coupled with advanced stage negotiations on commercial co-operation with leading
manufacturers in the United States. Along with the increase of the current product segments,
the new target sector of telemedicine ensures a high growth potential for the company in the
upcoming years supported by recent client acquisitions as well as a rapidly growing demand in the
Far Eastern region.
The fi ercely competitive international market of ambulatory ECG Holter monitors, resting/stress
ECGs and blood pressure devices are worth EUR 3 billion. Main players include international blue-
chip companies, yet with its highly integrated systems and related unique analysis software, the
company managed to produce steady growth in its key countries. Furthermore, recently developed
telemedicine solutions provide the company with a competitive advantage on a market of
outstanding growth potential.
II. PROJECT DESCRIPTION


III. FINANCIAL INDICATORS
Assumptions and main indicators
Based on the information above, the management forecasts promising opportunities for growth,
particularly in the fi eld of telemedicine, with an expected stable increase of the ambulatory ECG
and Stress ECG product line.
Key fi nancial data
(EUR 1000)2013 2014 2015 2016 2017 2018 2019
Export revenue 892 682 920 1,400 1,900 2,400 2,900
Domestic revenue 134 93 80 90 100 100 100
EBIT 311 245 250 350 450 550 650
The crisis in The Ukraine affected the export revenue of 2014, although revenue generated in the
country is expected to catch-up in the near future.
Investment opportunity Acquisition of 76% stake
Price expectations EUR 4.4 million
Subsequent to preliminary discussions and negotiations, potentially interested buyers are
expected to submit an offer. Following the acceptance of the offer, the investor will be invited
to the data room to undergo an in-depth due diligence assessment of fi nancial, tax, legal and
technical matters.
IV. INVESTMENT OFFER
CONTACT DETAILSHUNGARIAN INVESTMENT PROMOTION AGENCY
+36 1 872 [email protected]

I. PROJECT BACKGROUND
SHORT DESCRIPTION
Funding requirement
MTCN
Establishment of a green fi eld alkaloid production plant.
The Company seeks investment by a new investor/
prospective co-owner
Sector
Location
Overall Budget of the Project
Production of pharmaceutical raw materials (primary)
Ónod, Hungary
EUR 44 million
BA
SIC
PR
OJE
CT
DA
TA
EUR 5 M
Project owner
The project owner, MTCN Magyarország Ltd., was founded by a Hungarian private individual who has been involved in the preparation of the project for several years and is managing director of the Company. Other professionals participating in the preparation will also occupy formal management positions at the Company.
II. PROJECT DESCRIPTION
Based on several patents and poppy of high alkaloid content (Papaver Soniferum), the Company is planning to establish and operate a modern production plant employing 130-150 people. By processing 5,000 tons of poppy per year, the Company expects to produce 20-25 tons of morphine, thebaine, codeine sulphate and narcotine (alkaloids) along with c. 2,000 tons of poppy seeds annually (the latter also being suitable for the production of 750 tons of cold-pressed, refi ned poppy seed oil). Alkaloids are chemical compounds/intermediaries used in the production of various medicinal products (among others, for pain relief and disintoxication therapies), while poppy seed oil is widely used in cosmetics, nutrition, fi ne mechanical and arms industries. The establishment of the production plant requires a net capital of approx. EUR 29 million, most of which is planned to be covered from a bank loan.
Being intermediaries of basic medicines and having a strategic military signifi cance, alkaloids belong to the group of strictly controlled drugs. Cultivation of poppies is also offi cially regulated. As a result of the above factors and the scarcity of similar companies in the region, market demand for alkaloids and poppy seed oil is both high and stable.
After obtaining the necessary permits and approvals, the Company will be the sole active alkaloid producer in Hungary. It plans to sell its products internationally to pharmaceutical and military enterprises, and potentially to national governments (which maintain strategic stocks of poppy-based alkaloids which are regularly renewed due to their expiration). The Company has had discussions with several potential customers who indicated serious interest in a business partnership. In addition to processing poppy seed pod, the Company will also manage the organization of poppy cultivation in the surrounding area by concluding annual agreements for growing poppy with 500-1000 producers to satisfy the raw material demand without import.
The project is currently in a highly developed phase. Preparation for the implementation has been ongoing for years. During this period, detailed investment and technological plans have been elaborated and advanced discussions about the terms and conditions of the investment conducted with third parties (including local governments, public and offi cial agencies, potential business partners and fi nancing institutions).
III. FINANCIAL INDICATORS
Estimates and main indicators
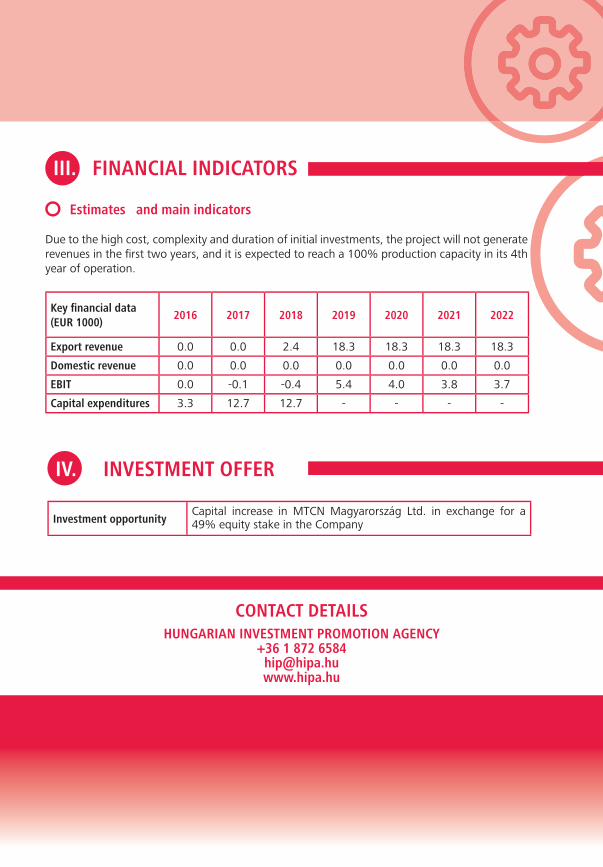
Due to the high cost, complexity and duration of initial investments, the project will not generate revenues in the fi rst two years, and it is expected to reach a 100% production capacity in its 4th year of operation.
Key fi nancial data
(EUR 1000)2016 2017 2018 2019 2020 2021 2022
Export revenue 0.0 0.0 2.4 18.3 18.3 18.3 18.3
Domestic revenue 0.0 0.0 0.0 0.0 0.0 0.0 0.0
EBIT 0.0 -0.1 -0.4 5.4 4.0 3.8 3.7
Capital expenditures 3.3 12.7 12.7 - - - -
Investment opportunityCapital increase in MTCN Magyarország Ltd. in exchange for a 49% equity stake in the Company
IV. INVESTMENT OFFER
CONTACT DETAILSHUNGARIAN INVESTMENT PROMOTION AGENCY
+36 1 872 [email protected]


I. PROJECT BACKGROUND
Short background For the last seven years, a group of Hungarian researchers, engineers and businessmen, with support
from a regional development company of the Hungarian Government, has developed a ground-
breaking new rubber and tyre pyrolysing technology that is ready to be deployed worldwide.
A complete pilot factory with a capacity of 1200 tonnes per year has been built and operated
successfully at an industrial scale by Pirolisis Project Limited (PP Ltd.), the company established
by the project leaders and fi nanciers.
The technology is proved to be capable of profi tably solving the global issue of waste tyre and
rubber management problems. The owners of the international patent are seeking fi nancial or
professional investors to establish a joint venture for the utilization of the technology and to build
large-scale factories worldwide.
SHORT DESCRIPTION
Funding requirement
Pir olisis Pr oject - Wast e t y r e r ecycling
The project owner has developed a superior new technology for rubber waste pyrolysis. The technology is international patent protected, and proven on an industrial level (already working factory). Five new factories are planned to be opened in fi ve years (as the start of the worldwide spread of the novel technology).
SectorProject owner
LocationImplementation period
Overall Budget of the Project
Waste processing, recycling, energy
Pirolisis Project Ltd.
Hungary
The fi rst factory to be opened in 15 months. In the
following four years, the remaining four factories
could be opened. The opening speed could
modifi ed in line with the fi nal investor strategy.
EUR 25 million
BA
SIC
PR
OJE
CT
DA
TA
EUR 25 M
OrganisationThe current management (see below) taking care of the operation of the already working factory,
managing the patent, and searching for investors for the new factories.
General background of the management
KEY MEMBERS OF THE MANAGEMENT
Name Status Age, Qualifi cation, references
Péter Nagy Managing Director 41, CEO, Authorized signatory
László Nagy Technical Manager 64, Mechanical and Organizing, Engineer
Péter Varga owner 46, Agrarian Mechanical Engineer, Entrepreneur
Dr. András Bálint Head of Research 70, Mechanical Engineer of the Chemical Industry,
Academic
Sándor Demeter Technologist 71, Chemical Engineer
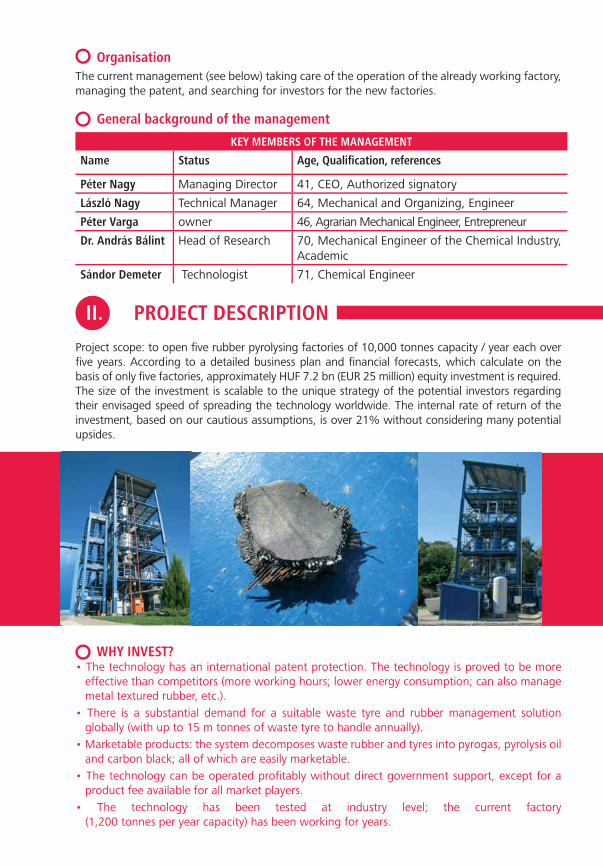
Project scope: to open fi ve rubber pyrolysing factories of 10,000 tonnes capacity / year each over
fi ve years. According to a detailed business plan and fi nancial forecasts, which calculate on the
basis of only fi ve factories, approximately HUF 7.2 bn (EUR 25 million) equity investment is required.
The size of the investment is scalable to the unique strategy of the potential investors regarding
their envisaged speed of spreading the technology worldwide. The internal rate of return of the
investment, based on our cautious assumptions, is over 21% without considering many potential
upsides.
WHY INVEST?• The technology has an international patent protection. The technology is proved to be more
effective than competitors (more working hours; lower energy consumption; can also manage
metal textured rubber, etc.).
• There is a substantial demand for a suitable waste tyre and rubber management solution
globally (with up to 15 m tonnes of waste tyre to handle annually).
• Marketable products: the system decomposes waste rubber and tyres into pyrogas, pyrolysis oil
and carbon black; all of which are easily marketable.
• The technology can be operated profi tably without direct government support, except for a
product fee available for all market players.
• The technology has been tested at industry level; the current factory
(1,200 tonnes per year capacity) has been working for years.
II. PROJECT DESCRIPTION

Competitive advantages• stationary aggregate, no stirring in the reactor unit
• excellent heat transition, therefore low energy consumption
• multi-phase heating process with the pre-heating stage using waste energy
• almost continuous operation
• controllable decomposition reaction by parameters such as temperature
• mainly standard equipment and robust machinery with a limited number of moving parts
therefore less maintenance
• already proven on an industrial scale (ca. 1,200 t/year)
• mostly automatic, cost- effi cient operation
• low labour requirement
• potentially further development, larger factories and plastic pyrolysis
Property rights, licenses, certifi cationsPatent No. P 06 00661 titled as ‘Reactor and equipment for pyrolysing waste, especially tyres’ has
been registered following an affi rmative decision by the European Patent Offi ce. The technology is
also patented by the U.S. Patent Offi ce and the Canadian Patent Offi ce.
Current position in the market – expected shareThe current factory is only processing 1200 tonnes of tyres per year. In the EU, a minimum of
2.5 million tonnes of waste tyre is “produced” every year (97% of is managed by deposing). The
planned full capacity would cover only 2% of the European yearly waste tyre production (not
calculating with the deposed quantities).
Target groupsThe raw material side partners are all of the waste management companies. The output of the
factory is marketable to the chemical and energy industry.
Short market description, main competitorsToday many companies and technologies are trying to handle the waste rubber problem. None
of the technologies have achieved the effectiveness of PP Ltd. The following is a comparison with
several competitor technologies.

COMPARISON OF ALTERNATIVE METHODS AND TECHNOLOGIES TO MANAGEWASTE RUBBER AND TIRE
Selection criteria/Methods&technologies
Deep
Inceneration
Cement production
Grindling, rubber shape production
Pyrolysis (heated jacket, blades)
Plazma pyrolysis
Pyrolysis (PP Ltd.)
Final solution for waste rubber issue no yes yes no yes yes yes
Final solution for waste tire tissue no no no no no yes yes
Enviromentally fi rendly solution no no no no yes yes yes
Over the laboratory phase yes yes yes yes yes yes no
Proved to be feasible at industrial scale yes yes yes yes yes yes no
Can be applied in the future without growing regulatory restrictions no no yes no yes yes yes
Large volume can be handled yes no no no no yes no
Can operate effi ciently and persistently yes no no no no no
Assumptions and main indicators
Justifi cation of the revenue planThe planned fi rst phase capacity only covers 2% of EU demand. There is no competitive pyrolysing
technology available on the market compared to PP Ltd. The trend for environmental fees is only
likely to be upward. The output materials unit price calculation is based on real market price.
P&L, fi nancial indicators
FINANCIAL HIGHLIGHT OF THE JOINT VENTURE, FULL PLAN, ALL 5 FACTORIES AND HEADQUARTERS
EUR million Y1 Y2 Y3 Y4 Y5 Y6 Y7 Y8 Y9 Y10
Net sales 0.0 0.0 3.9 4.0 8.3 10.7 15.3 22.5 23.2 23.9
Operating profi t (loss) -3.1 -1.8 -1.8 -0.6 0.2 0.4 5.7 10.7 12.8 13.0
Financial result 0.0 0.6 0.5 0.4 0.2 -0.1 -0.5 -0.9 -1.1 -1.1
Pre-tax profi t -3.1 -1.2 -1.3 -0.2 0.3 0.3 5.2 9.8 11.6 11.8
After-tax profi t -3.1 -1.2 -1.3 -0.2 0.3 0.3 5.2 7.9 9.4 9.6
Dividend 0.0 0.0 0.0 0.0 0.0 0.0 4.1 7.1 8.5 8.6
Total assets 21.8 20.4 19.9 20.8 23.6 26.6 32.2 36.9 39.0 40.9
Shareholders equity 21.6 20.4 19.1 18.8 19.2 19.5 20.6 21.4 22.3 23.3
Debt/Equity 0.0% 0.0% 0.0% 4.3% 11.6% 21.6% 37.2% 47.4% 47.3% 47.3%
ROA -14.1% -5.9% -6.7% -1.0% 1.4% 1.1% 16.1% 21.5% 24.1% 23.4%
ROE -14.1% -5.9% -7.0% -1.1% 1.7% 1.5% 25.2% 37.1% 42.1% 41.2%
III. FINANCIAL INDICATORS
Quantitative and Qualitative Indicators
QUANTITATIVE INDICATORSRevenues / year 2017 EUR 3.9 million
Mid-term revenues/year expectation EUR 22.5 million
Mid-term market penetration expectation (%) 2%
Available owner’s resources /available funds The project owner would provide the technology, full project management, patent, technical supervisory. No fi nancial funding is planned from PP Ltd.
Required amount of investment EUR 25 million
Form of investment Capital
Proposed capital/equity structureThe project owner offers a majority share in the new project company to the fi nancial or
strategic investor. Precise share composition is subject to negotiation with the project owner
and the 1st phase investor.
Investment scheduleFirst phase (fi rst factory, up to full operation): EUR 6.0 million within 15 months.
Second phase (the next four factories): EUR 19.0 million within the next four years.
Proposed exit policyAlthough no exit policy is established, Pirolisis Project Ltd. opened for cooperation with a
fi nancial investor. In this case, the exit policy has to be discussed and set up.
IV. INVESTMENT OFFER
CONTACT DETAILSMR. PÉTER NAGY, CEO
+36 30 373 [email protected]
MR. LÁSZLÓ BARTUCZ+36 20 940 2700

I. PROJECT BACKGROUND
Short background Our main energy source is still underground fossil oil, and gas. The number of oil drillings per
year is heavily increasing, and it is getting harder to fi nd further oil fi elds. Not only the number
of oil rigs, but the average drilling depth is also increasing. This results an extreme amount of
untreated oil drilling waste.
The project owner has developed a technology to answer the environmental challenges
presented by the oil drilling waste material. The prototype of the technology (MUDMAX)
has been tested in England (Aberdeen) for 1 and 1/2 years. Based on the testing, the project
owner developed the SLOPMAX technology. SLOPMAX is the only ZERO WASTE method for
treating the hazardous slop waste. Defi nition of slop: the slop (or sludge) is the remains from
the oil well drilling and washing of the drilling equipment. It contains 15-30% dry matter and
0-15% drilling oil (drilling oil is extremely expensive).
SHORT DESCRIPTION
Funding requirement
Slopmax - Zer o w ast e t echnology f or cleaner dr illing
The project owner has developed a superior new technology for cleaning drilling slops from oil well drilling. The patented technology has been tested in England for 18 months. The project owner is looking for an investor for a production factory to produce the machine.
SectorProject owner
LocationImplementation period
Overall Budget of the Project
Energy, environmental safety
Slopmax Ltd.
Hungary
The factory could be approved and developed by
the end of 2015.
EUR 9.8 million
BA
SIC
PR
OJE
CT
DA
TA
EUR 9.8 M

General background of the managementDénes István (MD of the company): Electrical Engineer. High level industry experience in multinational
companies (Siemens, Elin, Fabrikom,). Leader of the MUD and SLOP technology testing in the UK. Multi-
linguist (including English and mid-level Arabic).
Pinczés Imre ('Father of the Technology): Chemical Automation Engineer. Well known expert of green
technologies, number of own patents: cold plasma technology, catalytic oxidation technology, slopmax,
etc.
The project has three main phases:
1. After the long development procedure (incorporated the learnings from the test operation), the fi nal
machine has been built. The machine has to be transported to Scotland. It will take six months of
operation, testing and laboratory tests to achieve the Best Available Technology qualifi cation.
2. Parallel with the fi nal testing, the machine production factory has to be authorized, built, and
equipped (by the end of 2015).
3. The standardised production of the device could start by the end of 2015.
WHY INVEST?• The technology has international patent protection.
• The technology is proved to be most cost effi cient among the competitors.
• SLOPMAX is the ONLY ZERO WASTE TECHNOLOGY on the slop treatment market.
• The technology has been tested for 18 months prior to the production of the fi nal device.
• The project IRR is 194%.
II. PROJECT DESCRIPTION
Photo of the fi nal machine ready to transport and test.

Competitive advantagesThere are several technologies to handle the drilling waste material. Compared with the main
competitors, it excels both environmentally and fi nancially. Slopmax is the leading technology:
Competitors TCC Rotamil Westfalia Slopmax
Technology Thermic desorption Thermic desorption Emulsion separation
with poli-electrolytes
additive
Electrolytic emulsion
separation
Capacity 100 t / day 100 t / day 100 t / day 100 t / day
Contamination level
of the output
> 500 ppm > 500 ppm > 500 ppm +
contaminated
additives
< 50 ppm
Price / device EUR 3.8 million EUR 3 million n.a. EUR 3.9 million
How many devices
sold so far?
35 19 10 0
Operating cost,
description of the
residue
Extremely high
energy cost. The
remaining dry
residue (100 kg /
tonne) is hazardous
waste.
High energy cost.
The remaining dry
residue (100 kg /
tonne) is hazardous
waste.
New technology,
lower energy
consumption, higher
labour cost. The
remaining cleaning
additive (poli-
electrolytes) is also a
hazardous waste.
Lower energy
consumption,
higher labour cost.
The only ZERO
WASTE technology
(if no heavy metal
contamination in
soil).
Neutralisation of 1
tonne of slop
(desposal cost
included, if
the residue is
contaminated)
150-200 €/t
Depends on water
content. No totally
neutralised end
product
60-75 €
No totally neutralised
end product
66 €/t
No totally neutralised
end product
18€/t
Totally neutral end
product
Property rights, licenses, certifi cationsThe technology is patent protected: PCT/HU2010/000142 “Method and apparatus for handling
drilling mud contains oil / water emulsion.” The patent and all rights 100% held by Slopmax Ltd.
Current position in the market – expected shareThe Slopmax machine has not yet been put on the market. It has been presented to many market
players, and earned attention from most of them.
Target groupsThe potential customers for the device are the drilling service provider companies and waste
management companies of the oil drilling market. Because of the environmental regulations,
most of the potential customers are from Europe and North America. The project owner
contacted most of the potential partners, in line with the test of the technology:
• Baker Hughes: third global waste disposal company of the oil sector.
• Haliburton: the second largest global waste disposal company of the oil sector.
• MI Swaco: world leading waste disposal company of the oil sector.
• TWMA: already visited the Hungarian company.
• Taylors: A local waste management company in Aberdeen.

Short market description, main competitorsThe volume of the slop produced by the industry is increasing exponentially. Although the number
of drillings were stable around 2000-2010, the number has dramatically increased since (doubled
in recent years). Since 1990, the average depth of the oil wells has also increased by 40%. The
slop volume from oil drilling was 64 million tonnes per year in 2010, and the volume is increasing
as are the environmental regulation levels.
Key strategic partnersThe project owner contacted and interviewed all the potential partners (see “target group”
chapter). The fi nal machine was developed, based on their feedback, operational experience of
the prototype and laboratory tests. The technology and the documentation of the machine are
under evaluation of a leading European oil company from late 2014.
Access to foreign markets, export markets, description of key risks and measures to prevent risksThe technology would be marketed to the main players of the oil waste disposal market.
The project owner presented the technology to the main players. Key risk elements:
• Elongated qualifi cation procedures: this risk could be managed by appropriate timing of the
investment (if all the fi nancial resources are set up for the testing).
• Lobbying by the current technologies “against” the new market player: testing in Scotland
(EU country, strict environmental regulations) accelerates the qualifi cation; the qualifi ed device
cannot be put out of market.
9000
8000
7000
6000
5000
4000
Feel p
er
Well
ANNUAL U.S. AVEREGE DEPTH OF CRUDE OIL EXPLORATORY WELLS DRILLED
1950 1960 1970 1980 1990 2000
1975 1980 1985 1990 1995 2000 2005 2010
1.600
1.400
1.200
1.000
800
600
400
200
0
MONTHLY U.S. CRUDE OIL ROTARY RINGS IN OPERATION
Num
ber
of
Ele
ments

III. FINANCIAL INDICATORS
Justifi cation of the revenue planThe revenue plan was conservatively calculated. Only the sale of the machines is calculated as an
income; the maintenance of the device, or own waste disposal activity has not been included in
the fi nancial plans. The unit price is set to the market level, which is also conservative compared
to the advanced technology.
The plan calculates with a 10% market share in fi ve years on the newly produced slop cleaning market
(64 million tonnes / year, 20% of slop contains drilling oil). This could be managed by 28-32 machines
(100 tonnes per day capacity each). The factory is planned to build four machines at the same time.
As the average building time is six months, the capacity is planned to be eight devices a year.
P&L, fi nancial indicators (summary of the investment plan, and the P&L)
investment 0 1 2 3 4
fi gures in 000 Euro 2013 2014 2015 2016 2017 2018 sum 2014-2018
bat - 400 - 400
factory - 1 333 - 1 33
production - 8 000 - 8 000
total investment - -1 733 - 8 000 - - - - 9 733
revenue 2013 2014 2015 2016 2017 2018 sum 2014-2018
solid machines 8 8 8 6 30
unit price 3900 3900 3900 3900
revenue 31200 31200 31200 23400 117 000
material -10667 -10667 -10667 -8000
wages -5333 -5333 -5333 -4000
services -2667 -2667 -2667 -2667
depreciacion -1533 -1533 -1533 -1533
total cost -20200 -20200 -20200 -16200 -76800
EBIT 11000 11000 11000 7200 40200
Quantitative and Qualitative Indicators
QUANTITATIVE INDICATORSRevenues / year 2015 -
Mid-term revenues/year expectation EUR 31.2 million
Mid-term market penetration expectation (%) maximum 10% of new slops (1-5 % total
market)
Available owner’s resources /available funds The project owner would provide the
technology, full project management,
patent, technical supervisory.

Required amount of investment EUR 9.8 million
Form of investment Capital investment
Proposed capital/equity structureThe project owner offers a majority share of 51-75% in the new project company to the fi nancial or
strategic investor. Share composition is subject to negotiation, depends on the business construction.
Investment scheduleThe fi rst phase of the investment is EUR 1.8 million (BAT + construction) and will be carried out in
2015. The rest of the capital increase (EUR 8.0 million) would be used in year 2016, as the fi nancing
of the fi rst year of production.
Proposed exit policyAlthough no exit policy has been established by the project owner, Slopmax Ltd. is ready to
cooperate with a fi nancial investor and setup an exit strategy, if required.
IV. INVESTMENT OFFER
CONTACT DETAILSMR. ISTVÁN DÉNES, CEO
+36 20 999 [email protected]
MR. LÁSZLÓ BARTUCZ+36 20 940 2700