General Outline of the Study - UNESCAP No. 40.pdf · *Multhi Samudram is Associate Professor at...
57
Asia-Pacific Research and Training Network on Trade Working Paper Series, No. 40, July 2007 Services Trade in Developing Asia: A case study of the Banking and Insurance Sector in Malaysia By Muthi Samudram* *Multhi Samudram is Associate Professor at Monash University, Malaysia. The views presented in this paper are those of author and do not necessarily reflect the views of Monash University, ARTNeT members, partners and the United Nations. This study was conducted as part of the Asia-Pacific Research and Training Network on Trade (ARTNeT) initiative, aimed at building regional trade policy and facilitation research capacity in developing countries. This work was carried out with the aid of a grant from the IDRC. The technical support of the United Nations Economic and Social Commission for Asia and the Pacific is gratefully acknowledged. Any remaining errors are the responsibility of the author (email: [email protected] ). The Asia-Pacific Research and Training Network on Trade (ARTNeT) aims at building regional trade policy and facilitation research capacity in developing countries. The ARTNeT Working Paper Series disseminates the findings of work in progress to encourage the exchange of ideas about trade issues. An objective of the series is to get the findings out quickly, even if the presentations are less than fully polished. ARTNeT working papers are available online at: www.artnetontrade.org . All material in the working papers may be freely quoted or reprinted, but acknowledgment is requested, together with a copy of the publication containing the quotation or reprint. The use of the working papers for any commercial purpose, including resale, is prohibited. 1
Transcript of General Outline of the Study - UNESCAP No. 40.pdf · *Multhi Samudram is Associate Professor at...

Asia-Pacific Research and Training Network on Trade Working Paper Series, No. 40, July 2007
Services Trade in Developing Asia:
A case study of the Banking and Insurance Sector in Malaysia
By
Muthi Samudram*
*Multhi Samudram is Associate Professor at Monash University, Malaysia. The views presented in this paper are those of author and do not necessarily reflect the views of Monash University, ARTNeT members, partners and the United Nations. This study was conducted as part of the Asia-Pacific Research and Training Network on Trade (ARTNeT) initiative, aimed at building regional trade policy and facilitation research capacity in developing countries. This work was carried out with the aid of a grant from the IDRC. The technical support of the United Nations Economic and Social Commission for Asia and the Pacific is gratefully acknowledged. Any remaining errors are the responsibility of the author (email: [email protected] ).
The Asia-Pacific Research and Training Network on Trade (ARTNeT) aims at building regional trade policy and facilitation research capacity in developing countries. The ARTNeT Working Paper Series disseminates the findings of work in progress to encourage the exchange of ideas about trade issues. An objective of the series is to get the findings out quickly, even if the presentations are less than fully polished. ARTNeT working papers are available online at: www.artnetontrade.org. All material in the working papers may be freely quoted or reprinted, but acknowledgment is requested, together with a copy of the publication containing the quotation or reprint. The use of the working papers for any commercial purpose, including resale, is prohibited.
1

Table of contents
Executive Summary ...................................................................................................... 4
I: Introduction................................................................................................................ 6
1.1 Definition of the Sector........................................................................................ 6
1.2 Research Questions and Scope of the Study........................................................ 7
1.3 Methodology and Data Sources ........................................................................... 7
1.4 Structure of the Report......................................................................................... 7
II: Brief Review of the Malaysian Economy ................................................................ 9
III: Policy reforms and changes in the banking system .............................................. 12
3.1.1 Two-Tier Regulatory System (TTRS)......................................................... 14
3.1.2 Securitization of assets ................................................................................ 16
3.1.3 Credit, and Risk management ..................................................................... 17
3.1.4 Sectoral loan exposure................................................................................. 17
3.1.5 Strengthening the supervisory framework .................................................. 18
3.1.6 Merger program for the banking sector....................................................... 19
3.1.7 Corporate Governance................................................................................. 19
Performance of the banking sector .......................................................................... 20
3.2.1 Distribution of loans by business type ........................................................ 21
3.2.2 Profitability indicator .................................................................................. 22
3.2.3 Profitability of banking system ................................................................... 23
3.2.4 Interest margins .......................................................................................... 24
Commitments in GATS, AFAS and FTAs .............................................................. 26
3.3.1 The following are Malaysia’s commitments in Banking under GATS: ..... 26
3.3.2 ASEAN Framework Agreement on Services (AFAS)................................ 27
3.3.3 FREE TRADE AGREEMENTS (FTAs) .................................................... 27
IV: Policy reforms in the insurance sector .................................................................. 28
4.1.1 Market Liberalization .................................................................................. 29
V: Performance and impact of Insurance services liberalization................................ 30
5.1.1 Performance of Life Insurance Business..................................................... 31
2

5.1.2 Performance of General Insurance Business............................................... 33
5.1.3 Commitments under GATS, AFAS and FTAs ........................................... 34
VI: Impact of liberalization policies............................................................................ 36
VII: Sequencing of banking reforms in Malaysia ....................................................... 38
VIII: Case studies ........................................................................................................ 41
Conclusions ................................................................................................................. 46
Appendix 1 .................................................................................................................. 48
References ................................................................................................................... 56
3

Executive Summary
This study reviews the development of the banking and insurance sectors in Malaysia since the 1980s, with a particular attention to the effects and sequencing of the various reforms as well as the impact of services trade liberalization and related commitments.
Over the 31 years since independence in 1957, the Malaysian economy transformed itself
from an agriculture based, to a manufacturing one. This was the result of maintaining an open and liberal trading regime with responsible economic policies to meet the challenges of internal and external imbalances. Malaysia achieved rapid economic growth largely due to the implementation of market oriented policies and reforms within the context of several 5 year-plans for the development of the economy.
Malaysia introduced a program to promote industrialization in order to insulate the economy
from over-dependence on primary commodities. To promote ancillary industries, Malaysia diversified into heavy industries during early 80s. The First Industrial Master Plan (1986-95) was introduced to develop a broad based manufacturing sector with emphasis on export led industrialization. The role of government in the economy prior to the introduction of the First IMP led to heavy budget deficits. In that IMP the private sector was given incentives to more actively participate in the economy. There was significant increase in private investment due to liberalization and deregulation.
With the shift in policy in the 80s, much of the financing was intermediated through banks.
The financial system was strengthened after the recession of the 80s and the Asian financial crisis of 1997/98. The central bank was empowered through the Banking and Financial Institutions Act 1989 (BAFIA) to modernise and streamline laws relating to banking and other financial institutions under one supervisory and regulatory legislative regime. This led to a healthy growth of the economy with reduction in NPLs (non-performing loans) which were as high as 8.8% of total loans in 1990 to 1.9% in 1996. Bad debt provisions and interest-in-suspense declined, and banks have enjoyed a period of record profits.
It was also during this period that prudential measures were introduced to liberalize the
commercial banking sector. In 1991, the base lending rate was freed from administrative control. Other reforms included investment by the commercial banks in equity and private debt securities, streamlining the classification of NPLs, and provisioning for bad and doubtful debts and guidelines for internal auditors.
One of the major policy measures introduced during the period was the two tier banking
system for the commercial banks with the objective of developing highly capitalized and strong institutions. Although this measure was dropped in 1999, it set in motion the process of consolidation among the commercial banks. Policies were in place to consolidate the banking system into highly capitalized commercial banks (including finance companies) and investment banks (including merchant banks, discount houses and stock broking firms)
Malaysia also introduced Islamic banking through the enactment of the Islamic Banking Act
of 1983. There are 6 Islamic Banks which offer the full range of Islamic banking products. Even the conventional banking system was authorized to offer similar products
Malaysia remains committed to further liberalization of the financial sector through
successive rounds of negotiations as provided under GATS. Under GATS, Malaysia has made
4

substantial commitments to progressively liberalize its financial system.. Among the commitment made were that foreign participation in the equity of domestic banks is limited to 30%, while equity in the investment banks can rise up to 49%. Foreign banks that were operating in Malaysia prior to BAFIA 1989 can hold 100% equity if they were incorporated as domestic entities. There are restrictions on other modes of supply of services in the banking industry.
A number of measures were implemented to enhance the competitiveness of the banking
system. The BLR base lending rate) was freed from administrative control. Each financial institution was allowed to set its own BLR based on its own cost structure. There were guidelines issued regularly on banks’ investment in equity and bond markets. Other guidelines focused on improvements in corporate governance. Prudential guidelines governing risk concentration, asset values, risk management, disclosure and accounting standards were constantly reviewed to ensure that they were consistent with international standards.
With the conclusion of the Uruguay round in December 1993, and with Malaysia’s
commitments under GATS, it was evident that the domestic banking sector has to be progressively liberalized to compete in the international arena. Therefore the strategy of consolidation of the banking system began earnestly by introducing a two tier system until BAFIA was enacted in 1989.
The assessing of the impact of the liberalization of trade in services on the domestic
economy - in particular the banking system - conducted in this study suggests two way causality between trade liberalization (defined as openness of the economy) and the deepening of the financial system (defined as change in domestic credit) during the period of 1982 - 2005. This period was associated with increased dominance of the manufacturing sector in the economy. Over the longer period of 1970 to 2005, the causality seems to run from trade liberalization to financial deepening. Overall, empirical evidence shows that greater liberalization of services trade has significant effects on financial deepening and economic growth. The estimates suggest that when we consolidate the banking system, we should also liberalize the trading environment to maximize the strengthening of the banking system.
5

I: Introduction
Since independence in 1957, Malaysian economy was sustained at a high rate of growth up to 1980. But the pace of growth slowed to an average rate of 6% during 1981-90 as a result of global recession which began in the latter part of 1980. Malaysia is a trade-oriented economy and during the first two decades after independence, the economy was based largely on agriculture. The agricultural sector contributed about 40% of real GDP, provided two-thirds of the total employment, and contributed much of the export earnings. By 1987, the manufacturing sector surpassed agriculture as the premier sector in the economy (Table 2).
The first priority of the central bank (Bank Negara Malaysia- BNM) in the early 60s was to create the basic infrastructure and develop the domestic banks to complement the already strong foreign banking presence in the economy. In the 70s, the central bank introduced other financial intermediaries, including merchant banks and development finance institutions to provide other services that were not provided by the commercial banks. New legislation provided more powers to BNM to supervise all banking institutions. The Finance Companies Act 1969 was enacted to bring the finance companies under the supervision of BNM. In addition, the Banking Ordinance 1958 was amended and replace by the Banking act of 1973, which provided BNM with regulatory powers over both the commercial and merchant banks.
The later part of the 1980s was a period of prudential re-regulation and significant structural change in the banking system. One of the most significant weaknesses highlighted during the crisis of 1980s, was the absence of a comprehensive legislative framework governing the deposit taking institutions in the financial system. The enactment of BAFIA in 1989 widened the supervisory and regulatory powers vested in BNM.
In 1990s, strong economic growth created different challenges to BNM. It became necessary to create a core of strong banking institutions which are highly capitalized and well managed to meet the challenges of liberalization and development of the financial sector.
1.1 Definition of the Sector
According to definitions provided in the Annex on Financial Services (the Annex) of the GATS( the General Agreement on Trade in Services), “ a financial service is any service of a financial nature offered by a financial service supplier of a Member.” The term “financial service supplier” does not include a public entity that provides services in the exercise of government authority.
Financial services include the following activities: (a) Insurance and Insurances-related services This covers (i) direct insurance (including co-insurance), both life and non-life; (ii) reinsurance and retrocession: (ii) insurance intermediation, such as brokerage and agency; and (iv) services auxiliary to insurance, such as consultancy, actuarial, risk assessment, and claim settlement services. (b) Banking and Other Financial services (excluding insurance)
This covers deposit taking; lending; leasing; payment and monetary transmission; guarantees and commitments; financial trading (money market instruments, foreign exchange,
6

derivative products, swaps, forward rate agreements, transferable securities, and other negotiable instruments); money brokering; asset management; settlement and clearing services; provision of financial information; and advisory services.
1.2 Research Questions and Scope of the Study The most important research questions to be addressed by the study will be as follows: (i) How have banking and insurance sector liberalization policies been pursued in Malaysia? Are the reforms accompanied by a stronger regulatory system, and more efficiency in the delivery of services?. (ii) Has the banking and insurance sector liberalization enhanced competition and efficiency to promote domestic business and augment international trade? Are there any adverse employment effects as a result of foreign participation in both banking and insurance sectors? (iii) Has the expansion of banking and insurance increased access to credit by all sectors of the economy?
This study critically assesses the liberalization polices pursued by Malaysia in banking and insurance. It examines the strengths and weaknesses of these sectors in terms of efficiency and competitiveness, and explores the possibility of enhancing trade arrangements with other countries.
1.3 Methodology and Data Sources
It is difficult to estimate the impact of liberalization in services trade on the domestic economy. Nevertheless, there are studies which have derived competition indices and used them to estimate the impact of liberalizing the services sector of the economy. This paper analyses the impact of liberalization on financial deepening in Malaysia, Nepal and Bangladesh. As the study focuses on liberalization of banking and insurance, the study attempts to evaluate the impact of liberation on the development of the financial sector. The estimates are given in the Appendix 1. The data and its sources are in Appendix 2.
1.4 Structure of the Report
The report is structured as follows:
Section 2: A brief review of the Malaysian economy.
Section 3: Policy reforms and changes in the Banking system
Section3.1.1 Two-Tier Regulatory System
Section3.1.2 Securitization of assets
Section3.1.3 Credit, financial derivatives and risk management
Section3.1.4 Sectoral loan exposure
Section3.1.5 Strengthening the supervisory framework
Section3.1.6 Merger program for the banking sector
Section3.1.7 Corporate Governance
7

Section3.2 Performance of Banking sector
Section3.2.1 Distribution of loans by business types
Section3.2.2 Profitability indicator- commercial banks
Sectioon3.2.3 Profitability of banking system
Section3.2.4 Interest Margins
Section3.3 Commitments under GATS, AFAS and FTAs
Section3.3.1 GATS
Section3.3.2 AFAS
Section3.3.3 FTAs
Section 4. Policy reforms in the insurance sector
Section4.1.1 Market liberalization
Section5. Performance of insurance sector
Section5.1.1 Performance of life insurance business
Section5.1.2 Performance of General insurance business
Section5.1.3 Commitments under GATS, AFAS and FTAs
Section 6. Impact of liberalization on the economy
Section7. Sequencing of the regulations in the banking and insurance sectors
Section 8: Case Studies
Section 9. Conclusion
Appendix 1- Islamic banking and insurance
Empirical estimates of the impact of liberalization on financial sector
Appendix 2- Data and its sources.
8

II: Brief Review of the Malaysian Economy
In this section, a brief review of the Malaysian economy from 1970 to 2004 is undertaken. Prior to independence in 1957, the economic development of Malaya (Malaysia since 1963)
was confined to tin mining, and rice and rubber cultivation. Since independence, economic growth in Malaysia was sustained at 5.4% (1966-1970) and an average growth rate of 8.3% during 1971 – 1980. The agriculture sector’s share of GDP stood at 40.2% in 1955 and steadily declined to 21% by the end of the 19801. The overdependence on the primary commodities such as rubber and tin provided the country with reasonable growth rates, but has subjected the economy to the instability arising from wide fluctuations in commodity prices. Therefore the government began to not only diversify the agriculture sector to include oil palm, cocoa, timber and high yielding varieties of rice cultivation, but also the manufacturing sector. Besides providing incentives to promote foreign direct investment, the role of government in the economy has steadily expanded. In the 70s with the introduction of the New Economic Policy, the government was directly and heavily involved in economic activity. The share of the public and private sector investment as a percentage of real GDP rose from 20% in 1970 to 30% at the end of 1980. The expanding share reflected the government’s role in sustaining economic growth. As such the public expenditures (current and development) began to increase. The development expenditures increased from RM4.2 billion during 1966-70 to RM 27.5 billion during 1976-80. In terms of share of GNP, development expenditures were 25.1% in 1970 and gradually increased to 45% in 1980.2
Table 1 Growth rate of GDP in 1987 Prices
year 1961-70 1971-1980 1981-1990 1991-2000 2001-2005
1 1.4 10.0 6.9 9.5 0.6
2 6.9 9.4 6.0 8.9 4.4
3 5.5 11.7 6.2 9.9 5.4
4 5.8 8.3 7.8 9.2 7.1
5 5.6 0.8 -1.1 9.8 5.3
6 6.2 11.6 1.2 10.0
7 1.0 7.8 5.4 7.5
8 4.2 6.7 9.9 -7.4
9 10.4 9.3 9.1 6.1
10 5.0 7.4 9.0 8.5
average 5.2 8.3 6.0 6.75 4.6
Source: Economic Reports of Ministry of Finance, various issues.
There was a shift in strategy from public sector financing of growth to privately financed development. This shift in policy was the result of large public sector deficit incurred during the
1 Data from various Economic Reports, Ministry of Finance, Malaysia. 2 Data from various Economic Reports, Ministry of Finance, Malaysia and Annual Reports of Bank Negara Malaysia.
9

80’s. A national policy of “Malaysia Incorporated” was introduced in 1983 to enable the private sector to participate extensively in the economy with the government providing a favorable regulatory framework and infrastructure facilities. This approach reduced the need for government borrowing.
The First Industrial Master Plan (IMP), 1986-1995 provided a framework for the
development of a broad-based manufacturing sector based on export-led industrialization strategy. The first half of 1980s was challenging period for Malaysia. There was world recession in early 80s, and to generate growth, Malaysia undertook anti-cyclical fiscal measures to sustain growth.. Significant expansion of government expenditures resulted in both a budget and current account deficit. A structural adjustment program was needed, and private sector participation in the economy became a necessity. The policy framework laid by the First Industrial Master plan followed by liberalization and deregulation of the economy after the recession of mid-80s, provided the base for rapid growth of the manufacturing sector.
With the implementation of Malaysian industrialization and export promotion strategy
during the 80s, the economy grew at an average growth rate 6% during 1981-90. The contribution of the manufacturing sector increased from 20% in 1987 to 30% in 2005. The manufacturing sector relied heavily on non-resource based industries such as electrical & electronic with high import contend and low valued added production process. The emergence of low cost producing countries in the region generated competition, and Malaysia then introduced the Second Industrial Master Plan (1995-2005) to implement strategies to increase the value added content of the manufacturing sector.
Table2 Shares of GDP (per cent) Agriculture Mining Manufacturing Construction Services
1970 28.6 16.9 12.9 4.2 37.2
1980 20.9 12.6 19.1 4.7 42.6
1990 16.3 9.4 24.6 3.5 46.2
1995 10.2 8.2 27.1 4.5 50.2
2000 8.9 7.3 32.0 3.3 53.9
2005 8.5 5.8 32.0 2.7 52.0
Source: Economic Report, Ministry of Finance, various years.
Table 2 shows that the share of agriculture sector has declined significantly since 1970. The shares of manufacturing and services sectors have clearly increased with the services sector contributing significantly to GDP growth. Much of the improvement in the service sector, which includes banking and financial services, is due to the broad based development of the manufacturing sector.
The services sector was also identified as another source of growth to accelerate the
transformation of the Malaysia’s economy into a high technology driven and high value-added economy. Value in services sector has increased at a faster pace than the overall growth of the economy. As part of improving the services sector’s growth, the government launched the Multimedia Super Corridor (MSC). This corridor is expected to have a communications network including digital optical fiber infrastructure. Multinational companies were expected to participate in the development of multimedia applications in electronic government, smart schools,
10

telemedicine, R&D clusters, and smart cards. The government also reformed the financial sector to improve the competitiveness of the service industries.
Table 3 Contribution of Services Sector to Malaysian GDP
Year Electricity,
gas & water
Transport,
storage &
communication
Wholesale
and retail
trade, ,hotels
and
restaurants
Finance,
insurance,
real estate
and business
services
Government
services
Other
services
Shares of GDP (per cent)
1987 2.6 6.5 10.8 17.0 24.1 15.0
1990 2.7 6.7 13.2 17.5 18.8 15.4
1995 3.5 7.4 15.2 20.3 13.8 15.0
2000 3.9 8.0 14.8 23.6 12.6 14.2
2005 4.1 8.8 14.7 26.4 12.8 13.3
Average growth rate (per cent)
1987-
1990
10.0 10.6 17.2 11.8 1.7 11.4
1991-
2000
11.7 9.1 8.4 12.2 4.4 7.8
2001-
2005
5.6 6.5 4.4 8.6 6.5 4.8
Source: Economic Report, Ministry of Finance, various issues.
The shares of the services sector of GDP increased from 46.8% in 1990 ( 45.3% in 1987) and reached 53.9% in 2000. This reflects the success of policies that were directed towards liberalization of the services sector. By the end of 2006, the share of the overall services sector is expected to reach 58.2%. Among the sub-sectors, the share of finance, insurance and business services increased its share from 17% in 1987 to 26.4% share in 2005. In terms of average growth, this sector registered the fastest growth rate compared to all other sub-sectors of the services sector ( Table 3).
11

III: Policy reforms and changes in the banking system
The largest group of financial institutions in Malaysia has been the commercial banks. In the early days, their function has been mainly been financing external trade i.e remitting and receiving funds to and from abroad. At the turn of the century in 1900, a few locally incorporated banks emerged with branch network to service the banking needs of the growth of plantation agriculture and tin mining sectors. By the 1950s, the financing of the wholesale and retail trade grew along with the growth of imports particularly of consumption goods in response to rising incomes.
With independence in 1957 and prior the establishment of the Central Bank of Malaysia in 1959, the supervision of the commercial banks was conducted through the Banking Ordinance 1958 which became the Banking Act in 1973. Prior to 1973, banking legislation in Malaysia was specific to the type of financial and non-financial institution. The separate legislation did not provide the Central Bank of Malaysia (BNM) with effective regulatory and supervisory powers to oversee the activities of non-financial institutions that were operating at the fringe of the regulated banking sector.
Until 1972, the general policy regarding the supervisions and regulation of the banking system in Malaysia was to provide only a broad legal framework to govern the activities of the commercial banks. More often the Central Bank relied on moral suasion to establish a modern and progressive banking regime.
The Banking Act 1973 stipulated the legal and financial requirements which the commercial banks have to comply with. The Act also provided rules for supervision, empowered the Central Bank to issue new banking licenses, stipulated the financial requirements and duties of banks as well as rules regarding the protection of depositors, and ownership and control and management of banks. There were several amendments introduced to the 1973 Banking Act regarding supervision and control of banks, equity limits on ownership of banks, as well as strict control on lending which came into effect during the early part of 1986. This was because the collapse of the deposit-taking cooperatives in the mid 80s had generated undue uncertainty and lack of confidence in the banking system.
In retail banking, banking technology has transformed the range of services offered to the public. By the end of 1988, 36 out of 38 banks had computerized their operations with 780 ATMs in operation.
The regulatory and supervisory framework was put on sound footing with the introduction of Financial Institutions Act (BAFIA) in 1989. Prior to this, the banking sector was regulated and supervised with a large number regulations pertaining to different institutions.
There was one occasion in 1985, when the financial system came under stress and although the system remained sound with minimal disturbance to loan intermediation, the need for a complete regulatory and supervisory framework for the overall financial system with powers vested in BNM was required.
One of the significant weaknesses highlighted during the 1980s crisis was the absence of a comprehensive legislative framework governing the activities of deposit taking entities in the financial system. The system that existed prior to the recession of 1985 was fragmented with different laws and regulations governing the activities of commercial banks, finance companies and
12

merchant banks .In addition there were no specific regulations governing the activities of development finance institutions, specialized credit institutions, credit firms and cooperatives. There was an urgent need for a comprehensive regulatory policies in place.
The BAFIA empowers the central bank to have wider powers to supervise all financial institutions and under specific circumstances regulate both schedule and non-scheduled institutions. According to the new Act, all domestic banks are required to have new licenses issued under BAFIA. The branches of foreign-owned banking institutions operating in Malaysia were required to be locally incorporated and they were allowed to hold 100% equity. The local incorporation was necessary so all deposit taking institutions meet the same capital adequacy rules. The capital adequacy framework was harmonized at 8% across all banking institutions. Many banking regulations regarding SRR(statutory reserve ratio), BLR( base lending rate) and two-tier asset ratio have been replaced with a single liquidity ratio to allow flexibility for the banks to manage their liquid assets.
Other reforms followed the BAFIA Act. An active secondary market for government securities (MGS) was beginning to be developed along with securitization of assets through CAGAMAS (National Mortgage Corporation). There was a mismatch between the time profile of deposits as against the lending behaviour of housing loans by commercial/finance companies, which affected the liquidity position of the banks. Therefore, CAGAMAS was formed to purchase these housing loans from the banks and improve their liquidity positions.
The 90s presented new challenges to the central bank. The recession of 1985 had exposed several weaknesses in the banking system and policies were introduced to achieve the following objectives: To
1. create a strong highly capitalized domestic banking institutions that can meet the challenges of liberalization and form the basis for a strong financial sector,
2. broaden and deepen the financial markets and improve the overall efficiency and competitiveness of the banking sector,
3. accelerate the development of the bond market.3 In 1991 the BNM allowed commercial banks and the finance companies to determine their
own deposit and lending rates. A standardized formula was introduced in 1991 to enable banks to determine the lending rates based on their cost of funds. The deregulation of the estimation of the BLR allowed market forces to determine the lending rates. Invariably this has created problems of the impact of policy measures on the credit market. It was discovered that the averaging of the cost of funds had a lagging effect on the interest rates in the credit market . The lending rates prevailing in the market do not appear to reflect the liquidity conditions and therefore the impact of monetary policy sometimes conflicted with lending rates in the market. As a result the BLR framework was abolished in 1995.
In November 1995, a new market-based BLR framework based on weighted average of 3-month inter-bank rate and administrative margin of 2.5 percentage points, was introduced. The maximum margin above BLR was retained at 4 percentage points.
The computation of the ceiling BLR was further improved by substituting the weighted average inter-bank rate with the intervention rate. The intervention rate was the rate at which banking institutions can borrow from BNM at times when there is demand for liquidity. The
3 “The Central Bank and the Financial system in Malaysia- A Decade of Change” Bank Negara Malaysia, pg 183
13

administrative margin was reduced to 2.25 percentage points and the ceiling has been reduced to 2.5 percentage points.
The central bank revised its guidelines for banks to invest in any shares listed on stock exchange subject to certain prudential limits. Banks can also invest in corporate bonds and commercial papers approved by the central bank and this should not exceed 10% of the banking institution’s capital funds.
The Bank also introduced prudential guidelines periodically to ensure that banking institutions are not overtly exposed to excessive risks as happened in 1985. Limits were imposed on financing of the purchase of cars, residential properties and credit card holders. With the conclusion of the Uruguay Round in December 1993, and Malaysia’s commitments under GATS, it was evident that Malaysia’s banking sector and insurance sectors have to be progressively liberalized.
Therefore the BNM began to introduce several measures to consolidate the banking system which consisted of several commercial banks, finance companies, merchant banks and discount houses and which came under the regulatory framework of BAFIA in 1989. The Central Bank introduced a two-tier system to encourage banks to recapitalize into larger units so that they can be competitive domestically and abroad. The following are some of the steps that BNM took to consolidate the banking system:
1. two-tier regulatory system 2. securitization of assets 3. credit and risk management 4. strengthening supervisory framework
5. corporate governance 3.1.1 Two-Tier Regulatory System (TTRS)
Tier 1 status was accorded to well capitalized and well managed banking institutions. To
qualify for Tier 1 status, a banking institution (domestic or foreign) has to satisfy two criteria: capital size (as measured by shareholder’s funds) and CAMEL framework requirements ( discussed in detail in section 3.1.5).
Table 4
Minimum capital requirements for Tier 1- Banking Institutions ( RM million)
Shareholders funds Paid-up capital
December 1995 December 1998 December 2000
Commercial Banks RM500 RM1,000 RM1,000
Finance Companies RM300 RM600 RM600
Merchant Banks RM 250 RM500 RM500
Source: “The Central Bank and the Financial System in Malaysia”, Bank Negara Malaysia.
14

In 1994, seven commercial banks, four merchant banks and three finance companies were
accorded Tier 1 status. At the end of 1998, there were 11 Tier 1 commercial banks, six merchant banks and four finance companies.
Banking institutions which qualified for Tier 1 status were allowed to conduct some aspects of their business under a more liberal regulatory environment. This incentive was to encourage the banks to merge to improve their capital base.
The incentive based system of TTRS which was expected to create highly capitalized banks to meet the challenges of competition, led to some adverse developments. In their attempt to raise funds, shareholders resorted to heavy short-term borrowing. This led the institutions to adopt aggressive lending to generate required returns for the newly injected capital. The lending activity compromised prudent credit risk practices. Besides, the TTRS did not accelerate mergers among domestic banking institutions as was intended. Therefore TTRS were abolished in 1999.
By the time the financial crisis hit the region in 1997, Malaysia has already complied with 23 out of 25 Basle Committee’s Principles for Effective Banking Supervision4. At the onset of the crisis, the banking system was in a good position to withstand any impact the crisis had. Net-non performing loan ratio was at 2.2% and the risk-weighted capital ratio at 12%, far exceeding the minimum requirement of 8%.
As a result of the financial crisis, real economy contracted significantly along with the depreciation of the exchange rate. These development’s along with the significant decline of the stock market, created tremendous pressure on the banking sector to prevent any contagion effect. Prudential regulations were strengthened in September 1997, when measures were introduced in terms of limit on credit facilities to selected properties (20 per cent of total loans) and a 15per cent ceiling on credit facilities for the purchase of stock and shares and unit trust funds. The classification of loans as non-performing was shortened from 6 months to 3 months. The supervisory framework was also strengthened. Banks were required to submit their credit plans for 1997 and 1998.
There were other stabilization measures introduced in March 1998 which not only formed part of economic recovery measures but were also stabilization measures introduced to address some of the weaknesses in the banking system. One of the measures was to limit single customer credit from 30 per cent to 25 per cent of total capital, and to force compliance of banking institutions with the minimum risk-weighted capital ratio on a consolidated basis. The banking institutions were required to submit financial statements to BNM on a quarterly basis.
The finance companies were severely affected by the crisis. Their business was basically fixed-rate loans and with the economy contracting by 7.8% in 1998, most of loans were not serviced and therefore NPLs amounted to RM24.8 billion ( 3months) and RM15.7 billion ( 6months) compared to RM9.7 billion in 1997.
The finance companies industry was fragmented and therefore BNM initiated a merger program in 1998 and introduced the requirement that the minimum capital funds for finance companies must be RM300 million by mid-1999 and RM600 million by end 2000. The RWCR (risk weighted capital adequacy ratio) was raised to 10 per cent.
4 “The Central bank and the Financial System in Malaysia- A Decade of Change” Bank Negara Malaysia, 1999, pg 188
15

Given the problems associated with the downturn in the economy, the banks took a cautious approach towards lending. The Government then adopted a four-pronged approach to strengthen the banking sector through merger programs for all the entities within the financial system, the setting up of an asset management company, a special recapitalization agency and a debt restructuring facility. In addition, the government made revisions to the prudential requirements such as lengthening the classification period for NPLs from 3 moths to 6 moths, deferring the required capital funds of RM600 million by the finance companies. The revisions were not to backtrack on the measures but to reduce the burden on banking institutions.
Following the imposition of the selective exchange control measures on 1st September 1998 to prevent the internationalization of the Ringgit (the Malaysian currency), stable conditions returned which then allowed the financial reforms introduced by the Government to gather pace.
Additional measures were introduced to restructure the banking sector. It was required that a bank holding company has to be set up separately to hold only banking institutions and subsidiaries which are under the supervision of BNM. In the past the failure of a non-supervised entity within the banking group affected the confidence of the banking group. This measure was also necessary particularly in the cases where the Government assures the safety of the deposits. This is to compel banking groups to have banking institutions and its subsidiaries in one entity that came under the supervision of BNM. Banking institutions were also no longer allowed to lend to their shareholders who have controlling or influential interest in the banking group. Any new capital injection into the bank has to come from non-debt sources or long debt instruments.
The central bank recognized the importance of bank mergers and consolidation of banks to meet the future challenges of globalization. During the economic boom of late 80s and early 90s, calls for consolidation of banking institutions were ignored. Some banks merged while a larger number of them did not. The financial crisis of the 90s exposed the weaknesses of fragmented banking sector. The commitments under GATS also suggested that large banking groups need to be established before any concessions could be made for foreign participation. So a merger program was initiated by the Government allowing banks to form their own merger groups within a strict time frame.
In response to this approach, banks have agreed to form 10 banking groups, each with minimum shareholder’s funds of RM2billion and asset base of at least RM25 billion. As a result of this exercise, the number of banking institutions reduced substantially from 54 in 1999 to 29 banking institutions in 2000. Further mergers are likely to take place as globalization imposes competitiveness and efficiency within the banking industry.
The BNM also initiated a number of measures which allowed the banking industry to have a large liquid asset base to promote lending activities, securitization of assets, risk management, strengthening supervisory framework and corporate governance. 3.1.2 Securitization of assets
Banks were required at all times to maintain sufficient liquidity to meet contingency
requirements. Prior to 1990, a two-tier liquid asset ratio requirement was imposed on the commercial banks with an overall liquidity ratio of 17 per cent and a primary liquid asset ratio of 5 per cent of eligible liabilities [(these are total deposits, net amounts due to banking institutions in Malaysia, net repurchase agreements, net amount of NIDs (negotiable instruments of deposits) issued, all Ringgit borrowing from abroad and net foreign currency liabilities)]. The two tier
16

framework was abolished in June 1990. In its place was introduced an overall liquidity ratio of 17 per cent for commercial banks and a 10 per cent ratio for finance companies and merchant banks.
Following the exchange controls introduced in September 1998, some monetary measures were introduced to improve liquidity within the financial system. The liquidity asset ratio requirement for the commercial banks was further reduced to 15 per cent (previously 17 per cent) of total eligible liabilities. This reduction in the liquidity asset ratio is part of a broader framework of liquid asset management to be introduced to the banking system. A fixed liquidity asset ratio does not differentiate between banks that have strong liquidity management and diversified funding base than other banks which have weak liquidity management. Therefore a new liquidity framework was introduced in July 1998 whereby banks were required to assess their liquidity needs by matching their short term liquidity requirement from matching obligations with the maturing of the assets. Banks are required to maintain adequate liquidity surplus to be able to meet any unexpected heavy demand for withdrawals for at least one month ( New Liquidity Framework stipulates up to 5 per cent of its deposit base over one week period, or 7 per cent of its deposit base over a month).
One of the reforms initiated after the recession of 1985, was to match the asset and liability profile of the banking system. The traditional forms of lending especially the housing loans with maturity of 15 to 20 years has invariably lengthened the maturity profile of the banks deposit base. In actual fact, most deposits at the banks have a maximum maturity profile of one year. This created a mismatch between assets and liabilities and the government established the National Mortgage Corporation (CAGAMAS) in December 1986 to allow banks to securitize their housing loans. 3.1.3 Credit, and Risk management
The recession of 1985 had exposed the absence of a sound and effective credit risk
management process. Coupled with imprudent lending practices and mismanagement had led to heavy losses and the collapse of banking institutions. The losses imposed heavy burden on the Government to recapitalize these banks. This episode led the BNM to introduce in November 1985 the Guidelines on the Suspension of Interest on Non-Performing Loans and Provision for Bad and Doubtful Debts (GP3) to put in place uniformity in income recognition and loan loss provisions. In January 1986, the Guidelines on the Credit Limit to a Single Customer (GP5) were issued to limit lending to a single customer and related corporations (30 per cent to total capital which later was reduced to 25% from March 1998). In terms of large loans, the Central Bank imposed a limit of 50 per cent of total credit facilities.
The guidelines on investment in private debt securities was revised in February 1994 to allow banks to invest in all approved corporate bonds and commercial papers rated at least ‘BBB” or P3 respectively. This is part of the effort to promote the growth of the private debt securities market.
Over the years, GP3 (provisions for NPLs) was modified to bring in line with the international practices. In 1989, the classification period for NPLs was reclassified from 12 months to 6 months. General Provisions for bad loans remained at 1 per cent of total outstanding loans, net of interest suspended and specific provisions for bad and doubtful debts. 3.1.4 Sectoral loan exposure
Throughout the 80s when the Malaysian economic was buoyant with an average growth rate
of 6.6 per cent, commercial banks’ exposure to the broad property sector has been evident with 32.8
17

per cent of loans extended in 1988. Since then, this ratio has declined to 31.6 per cent in 1993. Prior to the Asian financial crisis, lending to the property sector remained at 35 per cent in 1997 and reached a high of 41.2 per cent (includes loans by finance companies and Islamic banks) in 2005. Much of the lending has gone to the purchase of residential property.
Table 5 Commercial Bank NPLs to Sector as per cent of Total Loans
1988 1993 1997 1998 2000 2005
Agriculture 5.2 3.4 2.0(1.8) 2.0(1.5) 2.9(1.6) 1.9(1.2)
Mining 1.2 0.5 0.3(0.6) 0.4(0.4) 0.4(0.4) 0.1(0.2)
Manufacturing 14.6 22.5 19.0(19.8) 18.8(19.4) 18.2(21.3) 10.9(12.4)
Wholesale and
retail trade
14.8 9.7 10.1(9.7) 9.9(8.4) 9.8(11.2) 8.4(6.8)
Broad property
sector
32.8 31.6 35(34.8) 35.8(35.5) 37.3(35.5) 41.2(51.8)
Finance, insurance
and business
services
10.5 14.2 9.8(5.5) 10.0(8.4) 8.9(3.1) 5.4(3.5)
NPLs as % of total
loans
17.8 5.0 12.0 10.3 9.2
Note: Data on loans and NPLs for 2001-2005 includes finance companies and Islamic banks
NPLs includes interest in suspense and specific provisions
Disaggregating broad property sector into sub-sectors, loans by the commercial banks showed that much of lending after the financial crisis has been directed to residential property with strict guidelines in lending. Prior to the crisis, substantial loans have been lent to the construction sector which experienced a greater burden of NPLs.
As regards NPLs of the commercial banks, they have declined from a high of 17.8% in 1988 to 5 per cent in 1997 but increased to 12.0 per cent in 1998 and declined marginally in 2005 to 9.2 per cent.
The overall decline in NPLS of the banking system reflected the improvements in the loan quality of the business sector. The repayment capacity of the sector improved in 2005 due to strong external demand coupled with rise in domestic demand. There was decline in NPLs for the manufacturing sector, wholesale and retail trade and construction sectors. The NPLs for the manufacturing sector showed the largest improvement from 21.3 per cent in 2000 to 12.4 per cent in 2005. 3.1.5 Strengthening the supervisory framework
18

The BNM employs the CAMEL framework to evaluate the overall financial and general conditions of a banking institution. CAMEL is the acronym for Capital adequacy, Asset Quality, Management quality, Earnings performance and Liquidity position.
On the question of approach to supervision, BNM employs Off-site surveillance and On-site examination. Off-site surveillance serves as an early warning system to detect any problems within the banking institutions so that timely action can be taken.It also monitors the banks’ compliance with prudential requirements. The On-site examination evaluates the extent of risk to which the banking institutions are exposed. 3.1.6 Merger program for the banking sector
Apart from commercial banks, the merger program initially covered the finance companies,
merchant banks and discount houses. Given that the finance company industry was highly fragmented (39 companies) and that the nature of their business was to provide hire purchase financing and consumption credit, the industry became exposed to uncertainties during the economic slow down in 1985 and 1998. As a result, the BNM introduced a merger program of all the finance companies.
BNM announced the framework for the creation of investment banks in March 2005. The purpose of merging merchant banks, discount houses and stock-broking companies into fully fledged investment banks is to transform the banking groups to face the challenges of liberalization of the financial sector. These financial sector intermediaries currently undertake similar products and services. On completion of the merger exercise, an investment bank will hold both a merchant banking license as well as a dealer’s license which are issued under BAFIA 1989 and Securities Industry Act 1983 respectively. 3.1.7 Corporate Governance
The fundamental determinant of the strength of a banking system is its governance structure.
In the past, many banks have failed due to weak governance structure and inadequate credit assessment framework within the bank. A good governance structure is one that ensures banks adhere to a strict code of ethics regarding the roles and responsibilities of stakeholders and the management of the banking institutions.
The main laws governing the Malaysian corporate sector include the Companies Act of 1965, the Companies Regulations of 1966, the Securities Industry Act of 1983, the Securities Commission Act of 1993, the Futures Industry Act of 1993, the Banking and Financial Institutions Act (BAFIA) of 1989, the Malaysian Code on Takeovers and Mergers of 1987, KLSE Guidelines on Stock Exchange Listing and the Foreign Investment Committee (FIC) guidelines. Malaysia’s accounting standards are good and are generally much stronger than those in the region with many of the international accounting standards having been adopted by the Malaysian Accounting Standards Board. Prior to the financial crisis in 1998, there two main avenues to dealing with corporate distress:
1. the company coul wind up under the companies Act 1965, under which creditors could petition the High Court to wind up a company which fails to pay its debts. The Act provided for the appointment of a liquidator or a receiver.
19

2. restructuring of the company as going concern under Section 176 of the Companies Act.
However, many problems existed with the enforcement of the laws, including the autonomy of regulators, transparency in exercising regulation and confusion over jurisdictional boundaries. Amendments were made to Section 176 of the Companies Act in September 1998 to remove the ambiguities existing in the interpretation of the Act prior to the crisis.
BNM has introduced several measures: (1) guidelines on directorship in the banking institutions (GP1); (2) guidelines on the code of conduct for directors, officers and employees in the banking industry (GP 7); (3) guidelines on the specimen financial statements for the banking industry (GP8); (4) guidelines on minimum audit standards for internal auditors of financial institutions (GP10). These guidelines were introduced at various stages to improve the governance of banks.
Performance of the banking sector The growth in the finance, insurance, real estate and business services sub– ectors was sustained
at 5.4 per cent in 2005 and this has improved the employment prospects for the sector. Employment in this sub-sector increased to 593,500 from 557,900 in 2004. On average, the annual growth rate of employment in this sub-sector was 5.3 per cent during the period 2000 to 2005. Finance, insurance, real estate and business services sector recorded the fastest growth in employment compared to all other sectors since 2000.
Table 6 Growth Rate in Services Sector in 1987 Prices
2004 2005
Annual change (per
cent)
Services 6.8 6.5
Intermediate services 7.1 5.7
Transport, storage and communications 8.5 6.3
Finance, insurance, real estate and business
services
6.3 5.4
Final services 6.6 7.1
Electricity, gas and water 8.2 5.5
Wholesale and retail trade 7.1 8.0
Government services 6.5 8.8
Other services 4.9 4.9
Employment
Transport, storage and communications 642,400 671,700
Finance, insurance, real estate and business
services
557,900 593,500
Source: Bank Negara Annual Report 2005
20

The commercial banks are the main players in the financial system. They are the most significant providers of funds in the banking system, with total loans and total deposits amounting to RM524.7 billion and RM644.9 billion respectively at the end of 2005. These represent approximately 94 per cent and 93 per cent of the banking system’s total loans and deposits respectively. As of December 2005, there are 29 commercial banks including locally incorporated foreign banks and ten merchant banks.
The strong economic growth during the period of 1988-97 contributed to the rapid expansion of the assets of the commercial banks. The total assets increased from RM96.8 billion to RM885.9 at the end of 2005. The average growth of assets during the period of 1995.1996 and 1997 was 26.3 per cent, which is the highest since the crisis of 1985. The main contributory factor for the higher growth of the assets was the BNM’s efforts to accelerate the pace of liberalization for a strong and competitive banking industry. After the financial crisis of 1998, the asset growth was negative but began to consolidate towards 2003 and beyond.
Consistent with the robust performance of the economy 1993, NPLs of the commercial banks which increased by 0.9 per cent in 1993, declined significantly by 15.8 per cent (RM2.6billion) in 1994. Also interest-in-suspence (IIS) also contracted in 1994. The decline in NPLs and IIS were made possible due strong growth in corporate earnings 3.2.1 Distribution of loans by business type
At the beginning of the decade of the 90s, commercial banks were recovering from an
economic downturn which left them with an overhang of NPLs of 29.8 per cent of the total loans of the commercial banks. Similar problems were also face by the finance companies and merchant banks. Net NPLs of commercial banks accounted for 15.3 per cent. The net NPLs are largely due to an excessive lending to the broad property sector sector as shown below:
Table 7 Sector Loans as a Share of Total Loans (per cent)
1988 1989 1997 1998
Broad Property
sector
35.4 32.8 35.0 35.8
Construction - - 10.0 10.3
Housing 13.1 14.0
Non-residential 14.2 13.5 7.5 7.6
Real estate 14.0 13.4 4.3 3.8
Financial services 10.0 10.5 9.8 10
Source: Monthly Statistical Bulletin, Bank Negara Malaysia, various issues
Commercial banks have suffered significant erosion of their capital due to large provisions made against bad debts and interest –in-suspense. With the aim of strengthening the balance sheets of the commercial banks, prudential reforms were introduced.
During the period of 1990-96, the buoyant economic growth allowed banks once again to extend loans to all sectors of the economy and in particular the property sector. The Asian financial crisis eroded the confidence of investors and economic prospects deteriorated to the extent that real
21

GDP fell by 7.1% during 1998. Of the total loans to the property sector, more than half of them became NPLs. The Government undertook several measures to restructure the capitalization of the banks by removing NPLs from the banks. The NPLs were handled by a special vehicle which can provided much needed finance to the banks and then restructured the loans so that companies in default of the loans would be in a position to repay them as the economy improved. 3.2.2 Profitability indicator
The pre-tax profits of commercial banks, finance companies and the merchant banks
reflected the economic growth of the country. Table 8 below provides the figures for some of the years.
Table 8 Pre-tax Profits of Financial Institutions (RM million)
1988 1989 1997 1998 1999 2004
Commercial
banks
679.1 -150.3 5717 -2686 5775.1 10754.9
Finance
companies
-166.4 243.3 1274.3 -2388 -943 “
Merchant
Banks
78 80.9 633.2 -656.8 -171.7 814.4
Economic
growth (%)
9.8 9.3 7.3 -7.4 6.1 7.1
Source: Bank Negara, Annual reports, various issues
Prior to the financial crisis of 1998, the banking system on average registered healthy pre-tax profits in line with the fundamentals of the economy. Commercial banks pre-tax profits grew from RM 679.1 million in 1988 to RM 5.77 billion in 1997 with a negative growth of profits in 1989 and 1998 respectively. The average cost of funds rose in 1989 to 4.0% from 3.5% in 1988 and that resulted in the reduction of pre-tax profits.
22

Table 9 Commercial banks: Income and Expenditure ( as per cent of total income)*
Year Interest
income
Feebased
income
Staff costs overheads Interest
expense
Interest
income/total
assets
1988 61.0 20.9 11.2 11.8 41.9 1.6
1990 79.4 11.5 10.7 10.3 50.6 2.3
1993 81.6 11.4 9.4 9.4 53.2 2.3
1997 89.2 10.4 8.0 7.9 57.8 2.4
1998 84.2 9.8 5.9 7.1 60.5 2.7
2000 76.4 14.4 10.2 10.4 39.6 2.5
2005 91.0 9.1 12.5 14.3 46.3 2.4
• total income = interest income in suspense+ interest income+ fee-based income
Source: Annual Report, Bank Negara Malaysia, various issues.
Historically, interest income had been a major source of income for the commercial banks, contributing well over 80 per cent of revenue. That trend continued in the 80s and 90s, except that in 1997, interest income amounted to 89 per cent and the ratio dropped to around 80 per cent until 2003. In 2005, the ratio reached a high of 91 per cent on the back of higher lending rates.
The contribution of non-interest income to total income remained around 14 per cent of total income throughout the period of study except in the years when interest rates were high which reduced the contribution of non-interest income. Its share dropped to 9 per cent in 1991 and remained around 10 per cent in 2000-2003.
On the cost side of the profitability equation, staff costs stood at 11 per cent in 1988 and dropped to 6 per cent at the height of financial crisis in 1998. Overhead costs followed asimilar pattern. Interest expense was around 50 per cent in 1989 and rose to a high of 60 per cent in 1998 and dropped to stable ratio of 42 per cent in the 2000s. 3.2.3 Profitability of banking system
The banking system continues to record strong profit performance. The pre-tax profits for
2005 amounted to RM12.4 billion for the Banking system. In 2003, the pre-tax profits were RM11.6 billion. Growth in profits was mainly derived from lending financing activities, sale of wealth management products, provision of remittance services as well as trading and investment activities.
There has been a continued effort by banks to strengthen their balance sheets. As a result return on average equity improved to 16.9%. The interest income as a ratio of total assets declined marginally between 2000 and 2005, although there was an increase in the total assets during the year.
23

Table 10 Banking System: Income and Expenditure (billion RM)
year Interest
income
Fee-based
income
Staff costs Overheads Interest
expense
Interest
income/total
assets
1992 84.8 8.6 8.4 8.9 58.6 10.5
1995 85.4 12.8 9.7 9.8 50.3 8.6
1997 90.2 8.9 7.2 7.9 60.1 10.4
1998 84.6 8.4 5.4 7.4 63.9 13.4
1999 77.9 11.9 7.1 8.1 48.8 8.4
2000 76.9 13.3 9.1 9.6 40.3 7.6
2005 78.9 8.2 11.0 12.3 38.6 5.1
• total income = interest income in suspense+ interest income+ fee-based income
Source: Annual Report, Bank Negara Malaysia, various issues.
Gross profits for the year 2005 rose by 6.2 per cent to RM13.1 billion on account of higher
income from interest related and fee-based activities. The quality of loan portfolio continue to improve as shown by the lower incidence of new NPLs and this enabled the interest income to remain fairly stable around 78 per cent during the period of 2000-2005. The staff costs and overheads rose during the period largely due to hiring of new staff and business expansion including improvements in the IT systems. 3.2.4 Interest margins
A fundamental condition of any sound financial system is a profitable and efficient system
of financial intermediation. Efficient financial markets with few legal and institutional barriers to competition would result in the successful mobilization of savings for investment purposes.
One of the most profound lessons of the 1985 recession was the need for financial institutions to improve their productivity and profitability, which had declined owing to lack of cost controls and declines in output. A case in point was the widening of the interest rate margins in the 80s.
With the improvement in liquidity, deposits rates were brought down rapidly to 7.5 per cent to 4 per cent for 12 month fixed deposits in 1986. But the lending rates responded gradually and the end of 1987, interest rate margin was 6.1 per cent- the largest recorded not only in the 80s but also in the 90s. Finance companies also recorded an interest rate margin of 6.9 per cent during the same period. The banking community attributed the slow response of lending rates to the decline in fixed deposit rates to the overhang of non-performing loans. In actual fact the reasons were not ‘locked in’ costs of long term deposits, but the rise in staff costs, overheads, and provisions for bad debts. The banking system experienced pre-tax losses for 1985 and 1986.
24

DETERMINATION OF INTEREST RATES
Prior to October 23, 1978, the regulation of interest rates involved the setting of minimum lending
rates for bank loans and a ceiling on interest rates that are offered for deposits by the banks. There were two types of lending rates: (1) prime rate that is charged for best customers and (2) preferential rate which is charged on loans to government and the public sector at large. This regulation of interest rates was made on the assumption that lending and savings are sensitive to interest rate movements. The regulation of deposit rates was to encourage savings and the maturity structure of savings. Deposit interest rates were regulated according to the requirement of short or long term savings, and lending rates were regulated to promote domestic banks in the face of competition from foreign banks. Interest rates were regulated partly to moderate capital movements between Malaysia and the rest of the world.
The adoption of “ administered “ interest rates from 1959 till 1978 provided a stable environment for the rapidly growing economy, and at the same time permitted the development of a diversified financial system. The development of financial intermediaries and new financial instruments imposed pressures on the regulated interest rate environment, and the BNM encouraged a market oriented system of interest rates. Some of the interest rates were allowed to be market determined, but overall the Bank used selective credit controls so that some priority sectors and special groups had access to credit.
To enhance competitiveness in the banking system and allow market forces to determine interest rates, the BLR of commercial banks and finance companies were freed from administrative control of BNM in 1991. All banks were allowed to determine their own deposit and lending rates. Lending rates were subject to maximum margin of 4 percentage points above the BLR. To be consistent and comparable in their computation of BLR, a standard BLR was introduced which was based on each bank’s interest cost of funds in 1991. The deregulated BLR led to other problems. One of them was that the averaging of cost of funds has introduced a lagging effect and delayed an intended effect of monetary policy. This weakness has led BNM to revamp the BLR framework in 1995.
Under the new framework, commercial banks and finance companies were free to quote their BLR below the ceiling of BLR of the industry. The ceiling BLR was calculated based on weighted average of preceding month’s 3-month inter-bank rate, adjusted for cost of statutory reserves and deposits in current accounts including administrative cost margin
In September 1998, the 3-month inter-bank rate was replaced by the intervention rate which is the rate at which banking institutions can borrow from the BNM. Subsequently the administrative cost margin was reduced to 2.25 percentage points. In April 2004, Bank Negara introduced a new interest rate framework. The ceiling on BLR and the maximum lending spread of the 2.5 percentage points above the BLR or cost of funds were removed. Banking institutions were givne flexibility to determine their own BLR based on their own cost of funds. Bank Negara introduced ‘Overnight Policy Rate (OPR) as a rate to reflect the monetary policy stance’ The OPR reflects the average overnight inter-bank rate which serves and the sole operating target for the Central Bank’s daily liquidity operations.
25
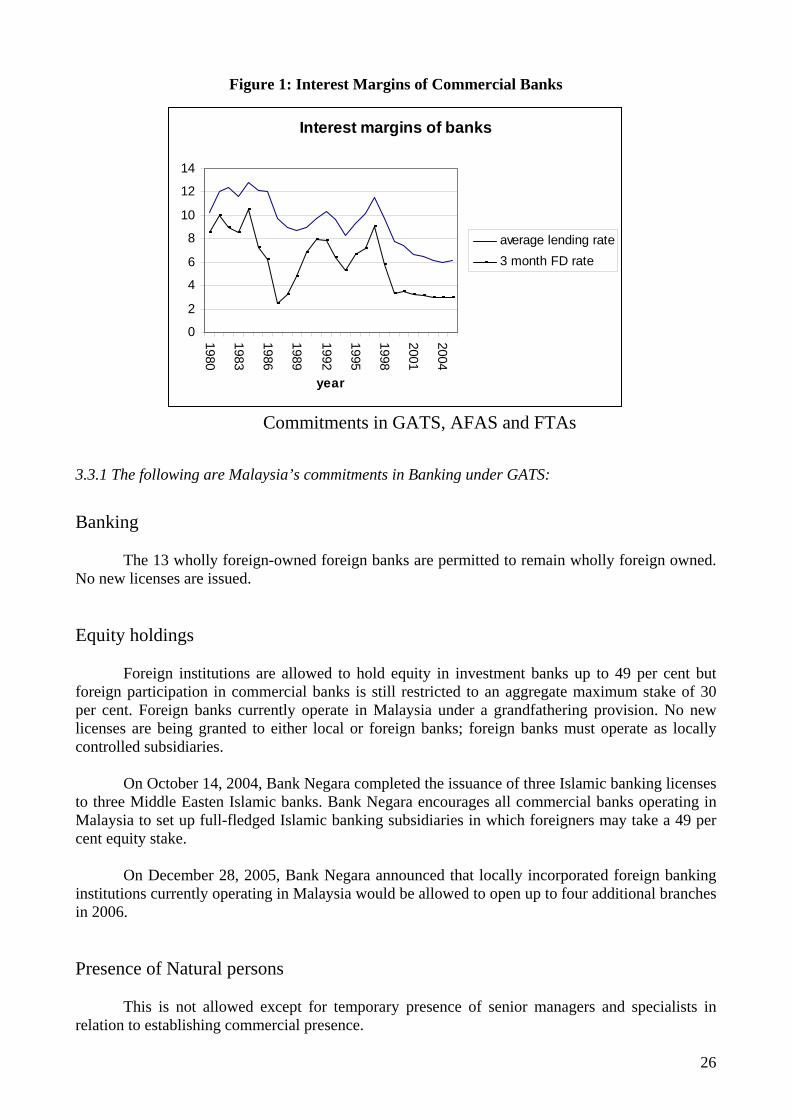
Figure 1: Interest Margins of Commercial Banks
Interest margins of banks
0
2
4
6
8
10
12
14
1980
1983
1986
1989
1992
1995
1998
2001
2004
year
average lending rate3 month FD rate
Commitments in GATS, AFAS and FTAs
3.3.1 The following are Malaysia’s commitments in Banking under GATS:
Banking
The 13 wholly foreign-owned foreign banks are permitted to remain wholly foreign owned. No new licenses are issued. Equity holdings
Foreign institutions are allowed to hold equity in investment banks up to 49 per cent but foreign participation in commercial banks is still restricted to an aggregate maximum stake of 30 per cent. Foreign banks currently operate in Malaysia under a grandfathering provision. No new licenses are being granted to either local or foreign banks; foreign banks must operate as locally controlled subsidiaries.
On October 14, 2004, Bank Negara completed the issuance of three Islamic banking licenses to three Middle Easten Islamic banks. Bank Negara encourages all commercial banks operating in Malaysia to set up full-fledged Islamic banking subsidiaries in which foreigners may take a 49 per cent equity stake.
On December 28, 2005, Bank Negara announced that locally incorporated foreign banking institutions currently operating in Malaysia would be allowed to open up to four additional branches in 2006. Presence of Natural persons
This is not allowed except for temporary presence of senior managers and specialists in relation to establishing commercial presence.
26

Other restrictions Offshore institutions are allowed in Labuan. 3.3.2 ASEAN Framework Agreement on Services (AFAS)
AFAS is a regional agreement on trade cooperation in services involving the members of the
Association of Southeast Asian Nations (ASEAN).5 The AFAS was signed during the Fifth Asean Summit on December 15, 1995. The aim of AFAS is to enhance co-operation in the services sector among member economies beyond those already undertaken under the GATS. Under AFAS, initial negotiations focused on five sectors:
(1) financial services (2) transport (3) telecommunications (4) tourism (5) professional business services
The AFAS has so far completed two rounds of negotiations and three packages of
commitments involving seven sectors (constructions and marine transport services have been added to the initial list of five sectors).
Member countries opted for positive list approach to liberalization of services trade and are to place requests and offer on liberalization of their respective service sectors. The positive list approach implies progressive liberalization through the undertaking of commitments regarding market access, the treatment of foreign services suppliers in specific service sectors or both. The negotiations schedule based on the request and offer format did not prove to be effective because member countries were unwilling to open their markets. This was evident in “ Initial Package of Commitments” made in December 1997. The Final Package of Commitments made in September 1998 included a broader range of offers.
It has been more than ten years since the inception of AFAS in 1995 and very little has been achieved in the liberalization of services sector in this region. The regional and multi-lateral negotiations approach appears to have played little role in encouraging further liberalization. Much of the liberalization that has taken place since 1995 was the result of each country’s domestic policies. 3.3.3 FREE TRADE AGREEMENTS (FTAs)
Malaysia is not a signatory of the WTO Procurement Agreement (GPA). Malaysia’s official
policy of procurement has been to support the national policy objectives. These objectives include encouraging greater participation of Bumiputra (ethnic Malays) in the economy, transferring technology to local industries, creating opportunities for local companies in the service sector. As a result, foreign companies do not have the same opportunities as some local companies to compete for contract as, in most cases, foreign companies are required to take on local partner before their
5 ASEAN consists of ten of the eleven Southeast Asian countries, East Timor being the exception. The ten members are Indonesia, Malaysia, Thailand, the Philippines, Singapore ( original members), Brunei Darusssalam, Cambodia, Myanmar, Lao PDR and Vietnam
27

bids will be considered. Recently the government announced the introduction of open tenders for government procurements and major projects, with direct negotiation limited to special cases. The FTA discussion between USA and Malaysia have focused on the following areas
1. Facilitation and liberalization of trade and investment, including non-tariff barriers 2. Promotion and protection of investment 3. Protection of intellectual property 4. Regulatory issues affecting trade and investment policies 5. Cooperation in promotion of bilateral trade 6. Trade in services, including financial services 7. Information and communications technology 8. Biotechnology 9. Tourism 10. Trade-related capacity building and technical cooperation 11. Enhancing the participation of SMEs in trade and investment 12. WTO and APRC coordination and 13. Other areas of economic cooperation to be mutually agreed upon
In the FTAs that the US has signed with other countries, there has been strong demand for inclusion of an agreement on access to government procurement The chapter on government procurement typically involves (1) Access of each party to the procurement market of the other party; (2) National treatment for the foreign firms and products; (3)A wider definition of government which includes various levels of government; (4) The “threshold levels” in monetary terms of the values of government contracts which can be procured.
Most developing countries provide preferential treatment to local suppliers in government procurement. With the FTA, foreign suppliers would be given equal treatment and this can have significant consequences to the domestic economy.
IV: Policy reforms in the insurance sector Introduction
Prior to 1950, insurance business in Malaysia was mainly offered by branches of foreign insurance companies. The supervision and regulation of the industry was under the control of the Ministry of Finance. Only on 1st May 1988, were the supervisory and regulatory powers of the industry vested with the Central Bank (BNM). The banking and insurance companies were increasingly converging with some of the banking groups establishing insurance entities within their groups. Therefore, it was proper that BNM took control of the regulation of the industry.
With the growth of the economy and the increase in demand for insurance services, insurance business grew and the number of Malaysian-incorporated insurance companies increased rapidly from 6 in 1963 to 51 in 1988, mainly from the local incorporation of Malaysian branches of foreign insurance companies. At the end of 1988, there were 9 branches of foreign incorporated insurance companies writing direct insurance business in the country.
The BNM manage s the insurance sector both through the regulation and supervision of insurance licensees. As at the end of 1999, there were 147 licensees who come under the
28

supervision of the BNM of which there are 58 direct insurers, professional re-insurers (10), insurance brokers (37) and adjusters (42). There were also insurance agents who came under the supervision of the life and general insurance associations. The BNM’s regulation of the industry falls into four categories:
1. Policy development 2. Administration and enforcement 3. Actuarial function 4. Consumer education and complaints handling
Policy development focuses on continuous improvements in the regulatory framework for
the insurance industry. Much of the administration of the industry is based on the Insurance Act of 1996 which incorporated the necessary framework to regulate, supervise and develop the industry, taking into consideration various aspects of the industry that needed attention since the Insurance Act of 1963. The administration and enforcement of the industry is based on the Insurance Act 1996. The conduct of insurance (including re-insurance), insurance broking and adjustment business in Malaysia requires a valid license issued under the Insurance Act 1996. A special actuarial unit was set up in 1992 to provide technical support for the regulatory function of the BNM. On the question of consumer education and complaints, the BNM set up a bureau to build confidence between the industry and the public.
Supervision of the insurance industry is carried out through off-site financial surveillance and on-site examinations conducted on licensees. The BNM monitors the performance of individual insurers based on earnings capacity, management and asset quality, and solvency and capital adequacy.
The Insurance Act mandates all licensees to be members of the insurance associations approved by the BNMk. The four mandatory associations are the General Insurance Association of Malaysia, the Life Insurance Association of Malaysia, the Insurance Brokers Association of Malaysia and the Association of Malaysian Loss Adjusters. These associations enforce various market agreements to provide best practices for the industry.
The Insurance Act 1996 incorporated all the changes necessary to the Insurance Act of 1963, to make the industry more competitive within a substantially strengthened legal framework. New rules were introduced to provide for more stringent financial requirements, higher levels of disclosure and transparency in operations.
The main objective in offering the new reinsurance licenses were to enlarge domestic retention capacity and to improve the technical expertise in insurance domestically.
The BNM also controls the licenses of brokers and adjusters. The renewal of licenses has been on annual basis but this was been changed to biannual in 1999 for those well managed and financially strong brokers and adjusters. In 1996, BNM introduced a Master Plan for the Insurance industry, mapping out five years of growth in terms of several key indicators of industry development: 4.1.1 Market Liberalization
Licensing plays an important role in the stability of the insurance market. BNM imposes
strict conditions for entry into the insurance market. Because the market was fragmented, there has
29

been a moratorium on new licenses since 1970s. This was to enable the existing 58 (at the end of 1998) direct insurers to consolidate into more sustainable players in the market.
Under its commitments to WTO (World Trade Organization), Malaysia has offered to issue seven new licenses for general re-insurance business and 6 new licenses for life re-insurance business to be issued by June 2005. As at the end of June 2005, there were one life re-insurer, one life and General re-insurer and 5 general re-insurers operating in the country. The motivation to offer more re-insurance licenses is to reduce the outflow of re-insurance premiums abroad.
Under the Insurance Act of 1996, licensed insurers are required to maintain a minimum capital funds of RM50 million or surplus of assets over liabilities in the case of licensed foreign insurers which re incorporated outside Malaysia). The minimum capital requirement was not a statutory requirement under the Insurance Act 1963. Insurers are also required to maintain a minimum margin of solvency of RM50 million (only RM5 million under the previous act). Both the capital and solvency margin requirements were fully implemented at the beginning of 2001.
The Insurance Act 1996 also provides for BNM to specify the manner in which assets backing the solvency margin of the insurer are invested. This was to ensure adequate liquidity and minimum risk. BNM introduced the admitted assets (AA) framework in 1997 where the assets backing the solvency margin muct be part of the AA framework. These financial requirements proved to be timely during the financial crisis of 1997/98.
To formalize the policy of licensing professional reinsurers, under the WTO Agreement entered into in 1995, Malaysia committed to issue 7 new general reinsurance licenses (excluding three licenses issued prior to commitment) by the end of June 2005. Malaysia also agreed to issue 6 life reinsurance licenses by 30 June 2005. Malaysia had liberalized the insurance sector in the early 1960s, resulting in a significant foreign presence in the Malaysian insurance industry. Today, foreigners hold 45.8 per cent of the total equity of insurance companies and control 74.3 per cent of life insurance premiums.
V: Performance and impact of Insurance services liberalization
Historically, a number of Life and Fire Insurance Ordinances formed the regulatory
framework for the functioning of the insurance companies. A comprehensive review of the insurance legislation was undertaken in 1963 culminating in the enactment of the Insurance Act 1963. This Act covered both the life and general insurance business to protect the interest of policy holders. Since 1963, significant changes have taken place in the insurance industry and the Insurance (Amendment) Act 1983 was enacted to cover various activities of the industry such as minimum capital requirements, solvency margins, annual registration fees and others.
In the past, the bulk of insurance business in Malaysia was dominated by the branches of foreign insurance companies. At the end of 1987, just before powers for supervision and regulation of the industry were vested with the BNM, there was a total of 60 insurance companies operating in Malaysia, of which 51 were domestically incorporated. Two companies were in the life insurance business, 41 general insurance, one re-insurance and 16 composite (both life and general) business.
30

Table 11 Number of insurers
year Total Direct Insurers Professional
reinsures
Domestically
incorporated
Foreign
Incorporated
Life General Life &
General
1963 95 10 76 9 -
1987 60 2 41 16 1 51 9
1990 57 3 39 15 1
1998 58 7 40 11 10(8) 51 7
2000 53 7 36 10 11(9) 51 2
2002 44 7 28 9 10(8) 42 2
2005 42 7 26 9 7(5) 40 2
Data in parentheses ( ) represents foreign incorporated reinsurers
Source: Annual Report, Insurance, Bank Negara Malaysia, various issues
5.1.1 Performance of Life Insurance Business
The Malaysian life insurance industry recorded significant growth over the last decade.
Premiums in force grew at an average rate of 23.9 per cent over the period 1990-95 but slowed down during the next 5 years. By 2005, the premium total reached RM 12.3 billion. On the basis of growth in individual years, 1991 was the best year with a growth rate of 26 per cent. The period 1995-2000 which includes the years of Asian financial crisis, witnessed a growth rate of 9.9 per cent in premiums. The period also witnessed the implementation of operating costs guidelines which became effective on 1st January 1996.
Table 12 New Premium, Premiums in Force and Life Fund Assets
Total new premiums Premiums in force Life fund assets
RM mill % change RM mill % change RM mill % change
1988 384.0 1082.7 5363.1
1990 573.1 22.3 1576.7 20.7 7097.2 15.0
1995 1510.5 22.5 4612.8 23.9 17574.3 19.9
2000 2942.3 16.7 7364.7 9.9 36806 16.0
2005 6701 24.1 12301.7 10.8 78753.4 16.5
Source:Bank Negara Malaysia, The Central Bank and the Financial System in Malaysia- A Decade of Change, 1989-1999, pg 475.
31

The forfeiture rate of life policies remained high, indicating that around 24 per cent of the whole life endowment policies written 3 years earlier were forfeited. This ratio reached a high of 39.8 per cent during 1998 due to the economic downturn as a result of Asian financial crisis.
The expense rate, defined as the proportion of total expenses to annual premium income, provides an indication of the industry’s operational efficiency. The expense rate has been high during 90s with 1995 witnessing the highest ratio at 47.9 per cent.
The agency force is the dominant distribution channel, the commissions given to the agents formed the largest component of the expenses. In the early 90s, this component formed around 33 to 34 per cent of the total expenses of the life insurers. The implementation of guidelines pertaining to operating costs, reduced the commission payments significantly leading to the reduction in the expense rate around 30 per cent of the total premium income (Table 13).
Table 13 Life Insurance Sector: Expense Ratio and Rate of Interest Earned
year Expense rate (per
cent)
Net interest earned(*)
1988 43.5 6.9
1989 45.7 7.2
1990 45.9 7.2
1991 47.2 7.8
1992 46.4 8.0
1993 46.7 7.8 (16.5)**
1994 46.3 6.5(15.2)**
1995 47.9 6.5
1996 42.0 6.7
1997 36.9 7.2
1998 31.2 7.8
1999 30.5 6.5
2000 29.8 5.8
2001 31.8 5.4
2002 30.5 5.6
2003 30.2 5.7
2004 30.7 5.8
2005 29.7 5.7
(*)Rate of return on investments excluding capital gains
** Rate of return on investments including capital gains
32

The investment performance of life insurance funds has fairly stable with the exception of
1993 and 1994 when high investment returns of 16.5 per cent and 15.2 per cent were achieved due to the buoyant stock market. On the whole, the net yield on life insurance funds was maintained around an average rate of 7.2 per cent during 1990-1999 and 5.7 per cent during 2000-2005. 5.1.2 Performance of General Insurance Business
Consistent with the growth of life insurance business, the general insurance also recorded
impressive growth during 80s and early 90s, when it registered an average growth in direct premiums of around 19 per cent (Table 3). As a result of economic slowdown in late 90s, general insurance business suffered with a slow average growth rate of 4.9 per cent during 1995 to 2000 ( 1998 = -10.7 per cent growth).
Table 14 General Insurance Sector: Growth and Distribution of Premium, Net Retention and Assets
Direct
premiums
Average share of direct
premiums (per cent)
Net
retention*
Assets
Year RM
million
Average
growth
rate (per
cent)
Marine Fire Motor RM
million
Average
growth
rate (per
cent)
1988 1321.1 75.6 1665.5
1990 1979.1 18.2 4.6 15.1 38.2 77.1 2400.9 15.7
1995 4764.4 19.3 3.9 13.3 40.4 74.4 7643 26.1
2000 5928.6 4.9 4.1 15.6 45.6 85.3 13791 13.1
2005 9386.1 9.7 3.6 13.8 45.4 80.4 7989.4 5.9
* the ratio of net premium to direct premiums Source: Insurance, Annual Reports, Bank Negara Malaysia, various years.
Despite the decline in premium, strong growth was evident in the expansion of total assets with an average growth rate of 13.1 per cent. During the last 5 years (2000-20005), growth rate of assets has been around 5.9 per cent. Most of the assets are held in the form of corporate debt securities and Malaysian government securities, and almost 30 per cent of the assets were held in cash and deposits.
In terms of sectoral break-down of the general insurance business, motor insurance continued to register the largest share of business with an average share of 38.2 per cent in 1990 rising to an average share of 45.4 per cent during the period 2000 to 2005. The contribution of Fire and Marine insurance business remained fairly stable throughout the period.
The net retention of insurance premium has increased steadily form 76.4 per cent in 1988 to a high average share of 84.1 per cent during 1995-2000 with the highest share of 86.4 per cent
33

recorded in 1998. The ratio declined marginally to 80.9 per cent during the period 2000-2005. The high retention ratio was due to increased capitalization and a bigger market share captured by foreign professional re-insurers licensed to operate in the country. The professional re-insurance licenses for general insurance increased from 4 in 1995 to 9 in 2000.
The analysis of the underwriting performance in the general insurance sector for the period 1988-2005 showed that from 1992 the underwriting business of general insurance sector turned profitable. In 1991, this sector experienced substantial losses to the tune of RM 332.8 million. Since 1992, the general insurance sector enjoyed good underwriting results with the highest profits registered in 1997 and 2005(RM619.9 million and RM 956.3 million respectively). This was the result of an improved claims ratio and a reduction in commission payments following the implementation of cost control guidelines by BNM in 1992. A similar trend emerged in the operating results of the general insurance sector with the exception of losses between 1988 until 1991.
Table 15 General Insurance sector: Underwriting and Operating Results
Per cent of earned premium income Operating results (RM million)
Year Claims
ratio
Management
expenses
ratio
Commissions
ratio
Under-
writing
margin
Under-
writing
gain/(loss)
Investment
income
Operating
profit/(loss)
1988 64.6 23.3 21.3 -9.2 -89.8 63.8 -48.4
1991 85.4 19.3 15.1 -19.8 -332.8 133.7 -247.7
1997 58 19.7 9.6 12.7 619.9 618.1 466.2
2000 63.7 22.4 11 2.9 138.9 501.3 437.9
2005 55.4 20.7 10.8 13.1 956.3 64.2 1524.4
Average per cent Average RM million
1988-
1991
70.4 21.2 19.3 -10.9 -153.5 92.7 -107.4
1991-
1995
63.9 20.3 10.7 5.0 170.6 226.2 434.3
1996-
2000
61.1 20.9 10.1 7.8 357.8 589.5 828.9
2000-05 60.5 21.5 10.9 7.0 462.4 563.6 1112.7
Source: Insurance, Annual Reports, Bank Negara Malaysia, various issues
5.1.3 Commitments under GATS, AFAS and FTAs
The following are Malaysia’s commitments in insurance under GATS:
34

Direct Insurance: Modes of supply (1) Cross-border supply (2) Consumption abroad (3) Commercial presence (4) Presence of natural persons. (1) and (2) unbound except (3) Branches of foreign insurance companies are required to be locally incorporated by 30th June 1998 and foreign shareholding not exceeding 51 per cent is permitted. Foreign holding not exceeding 51 per cent is also permitted for the existing foreign shareholders of locally incorporated insurance companies which were the original owners of these companies provided aggregate foreign shareholding is such companies does not exceed 51 per cent.
New entry is limited to equity participation by foreign insurance companies in locally incorporated insurance companies and aggregate foreign shareholding in such company shall not exceed 30 per cent.
Acquisition by a foreign insurance company of an aggregate of more than 5 per cent shareholding in a locally incorporated insurance company must meet at least one of the following criteria: (a) The foreign insurance company has the ability to facilitate trade and contribute to financial and economic development of Malaysia; (b) The country of the foreign insurance company has significant trade and investment interests in Malaysia. (c) The country of the foreign insurance company does not have a significant representation in the Malaysian insurance industry; or (d) The foreign insurance company has the ability to provide technical expertise and know-how to contribute to the financial and economic development of Malaysia An insurance company is not allowed to acquire more than 5 per cent share:
(a) in another insurance company in Malaysia that carries on the same class of insurance business as that carried on by it: or (b) in an insurance broking company
Other persons holding more than 5 percent shareholding in an insurance company are not
permitted to acquire more than 5 per cent shareholding in: (a) Another insurance company carrying on the same class of insurance business as that carried
on by the insurance company in which the person is a shareholder; or (b) An insurance broking company
(4) Unbound except the following: (a) unless otherwise specified, temporary presence of natural persons is offered only in respect of supply through the mode of commercial presence (b) two (2) senior managers for branches of foreign insurance companies and locally incorporated insurance companies with an aggregate foreign shareholding of 50 per cent or more. A senior manager is an individual possessing proprietary knowledge and authority essential to the establishment, control and operation of the services of the financial service supplier (c) five(5) specialists are to be allowed for each institution which is locally incorporated and owned or controlled by natural or juridical persons of Member State(s) for areas relating to :
(i) underwriting of specialized classes of general business; (ii) information technology and (iii) actuarial functions
35

(d) entry shall be limited to a maximum period of 5 years
VI: Impact of liberalization policies
The overall impact of financial liberalization on the financial sector has been significant (Table 16). Despite the BNM’s aim to control inflation, which meant that the monetary growth has to be stable throughout the period, the ratio of M2 increased more than two fold between 1975 and 2004. Similarly the M3 ratio also recorded an increase of almost 3 fold, reflecting the financial deepening that has taken place in the economy.
Table 16 Indicators of Financial liberalization (per cent of GDP)
M3 M2 Claims on
government
Claims on
private
sector
Gross
Fixed
Capital
formation
FDI
1975-1980 54.04 46.88 21.96 46.94 25.42 4.12
1981-1988 81.3 66.55 33.23 78.96 30.40 5.71
1991-2000 124.22 91.74 -2.02 30.87 35.56 4.75
2000 133.0 103.35 -7.06 140.19 25.56 -6.95
2001 140.4 108.36 -2.84 149.24 24.92 -4.42
2002 138.4 105.95 -0.51 145.56 23.14 -3.30
2003 139.2 107.96 -1.94 140.91 22.05 -3.07
2004 137.4 118.81 130.1 20.42
2005 134.9 124.60 20.00
Source: International Financial Statistics.
The financial intermediation ratio (banks’ claims on private sector) increased by more than
three fold, reflecting the public’s willingness to hold assets. It also reflected the development of institutions which facilitate the lending activities. This level of intermediation is a reflection of commercialization of economic activities over the years and the liberal policies that promoted competition.
Financial intermediation for the public sector shows negative ratios in the 90s and early 2000, largely because of the restructuring of the government finances as the economy began to show signs of weakness after the financial crisis. There was then discipline in government spending and lending to government was much less than the government deposits in the banks. The negative ratios indicated the decline in government spending.
Whilst public sector financial intermediation was slowing, private sector debt was building up when lending to the property sector increased substantially prior to the Asian financial crisis.
36

The growth in private sector debt appears to show in the growth of FDI as well. The 1990s witnessed large inflows which showed up in the Gross Fixed Capital Formation ratio. This ratio increased to an average of 36 per cent of GDP in the 90s. These figures support the view that growth in the 90s was generated by greater private sector participation supported by the banking system. The financial ratios showed that there was financial deepening during 1975-2004 with the exception of the period during the Asian Financial crisis. The lessons learned from the crisis enabled the banks to further consolidate into highly capitalized units. MACROECONOMIC EFFECTS
Table 17 Malaysian Economic Indicators: Growth rates per cent)
Real
GDP
Inflation
Rate
Government
Revenue
M2 M3 Trade
balance
FDI
1976-80 8.56 4.52 22.34 23.01 23.71 98.55 127.31
1981-85 5.16 4.69 8.78 12.56 14.98 181.99 16.36
1986-1990 6.92 1.80 7.67 10.78 12.13 1.67 -71.65
1991-95 9.46 3.97 11.70 18.90 18.76 86.27 138.91
1996-2000 4.97 3.14 4.47 12.57 11.16 -671.51 -19.95
2001 0.6 1.42 28.62 2.20 2.85 -11.73 -37.97
2002 4.4 1.80 4.96 2.8 6.73 -1.35 -19.26
2003 5.4 1.06 10.89 11.1 9.68 41.77 1.72
2004 7.1 1.46 7.33 25.4 12.37 6.9
2005 5.3 3.06 6.95 15.35 8.04
Source: Annual Reports, Bank Negara Malaysia, various issues
Table 17 provides summary statistics on the effects of liberalization on the overall performance of the economy during the period 1975 to 2005, when most indicators apart from FDI showed significant growth.
The growth of M2 and M3 and other macroeconomic variables have been significant with the exception of trade balance. Economic growth had been maintained at an average of 7 to 8 percent until the Asian financial crisis in 1998. Since then, the economy has grown at a moderate pace. This was largely due to external developments. Growth in FDI was substantial in the 90s due to very liberal policies of the Government. Between 1991 and 1996, a total of US$45 billion in FDI was invested in the country. This does not include portfolio investments in the equity and bond markets. Private sector borrowings from foreign sources have been substantial. An important consequence of these developments was that such a rate of investment could not be sustained without significant increase in inflation and interest rates. Since 1998, Malaysia has experienced moderate growth. This has nothing to do with liberalization of services sector as such but is largely due to external developments including competition for FDI from China and India. The slowdown in the economy is reflected in the growth of government revenues, although financial deepening has been stable.
37

VII: Sequencing of banking reforms in Malaysia
7.1 LEGAL FRAMEWORK
1. Central Bank of Malaysia was established in 1959. 2. The Banking Ordinance 1958 brought the commercial banks under the supervision of the
Central Bank of Malaysia ( BNM) 3. The Banking Ordinance 1958 was amended to become the Banking Act 1973. 4. Until 1972, the general policy regarding the supervision and regulation of the banking
system in Malaysia was to provide a broad framework relying heavily on ‘moral suasion’ to regulate banking activities.
5. Enactment of Banking and Financial Institution Act (BAFIA) in 1989
7.2 INTEREST RATE FRAMEWORK
1. Prior to 1978, the structure and level of interest rate had been determined by the BNM in consultation with the Council of Association of Banks in Malaysia. Both parties agree on the maximum deposit rates and minimum lending rate.
2. The system of determining interest rate was changed on October 23, 1978. Under the new regime, commercial banks determined both the interest rates for deposits and lendinding.. The maximum interest rates charged by banks on loans to Priority Sectors continued to be regulated by BNM..
3. Since November 1980, commercial banks introduced their BLR (Base Lending Rate) based on cost of funds. With effect from 1983, all loans were charged at a margin above the BLR.
4. BLR of commercial banks and finance companies was freed from the administration control of BNM in 1991.
5. In the same year, a standardised BLR formula based on each individual bank’s cost of funds
was introduced. Lending rates were subject to maximum margin of 4 percentage points above their respective BLRs. Banking institutions were free to determine deposit and lending rates.
6. Market-based BLR framework incorporating standardized formula for computation of maximum BLR for the industry was introduced in November 1995. The computation of the ceiling BLR was based on a weighted average of 3-month inter-bank rate adjusted for cost of statutory reserves and current deposit and an administrative margin of 2.5 percentage points.
7. In September 1998, BNM intervention rate was introduced to replace the inter-bank rate in the calculation of the ceiling BLR. The intervention rate is the rate at which commercial banks can borrow funds from the central bank.
8. Guidelines for banks to invest in shares of listed companies were formalized in 1991. 9. In April 2004, a new interest rate framework (Overnight Policy Rate) replacing the 3-month
intervention rate was introduced, with the overnight inter-bank rate becoming the operating target of monetary policy . Under the new framework, the maximum lending rates charged by banking institutions are no longer subject to BLR formula and the spread of 2.5 percentage points above BLR is removed. BLR of each bank is based on its own cost structure and lending strategy.
38

7.3 BANKING MEASURES (COMMERCIAL BANKS)
1. By 1966, the foreign incorporated banks were no longer allowed to establish new branches in Malaysia. At the end of 1966, there were 37 banks with 16 domestic and 21 foreign owned.
2. Until 1972, the policy regarding supervision and regulation was to provide a broad framework. The Banking Act 1973 introduced new provisions for regulation and supervision of the banks in the areas of issuance of banking licenses, the financial requirements and duties of banks, the protection of depositors, the operational policy of banks, ownership, control and management of banks, loans to directors, advances fro shares and loans for immovable properties and powers of supervision and control over banks by BNM, including provisions to introduce credit limits to a single customer, the prohibition of loans to staff and to director-interested companies, and the declaration of assets by senior bankers.
3. Several amendments to the Act of 1973 were made in 1986. Among the amendments, one imposed limits on ownership of commercial banks and strict control on lending. There were 26 banks in 1959 and grew to 38 by the end of September 1988. Of these, 16 are foreign and 22 are domestic banks.
4. Until 1974 the number of foreign banks exceeded that banks, (domestic banks 17, foreign banks 18). With the issue of new licenses, the number of domestic banks increased.
5. In 1981, the first automated teller machine (ATM) was installed in 1984, The Kuala Lumpur Automated Clearing House (KLACH) was launched for cheques.
6. In 1981, a minimum capital adequacy ratio was introduced where commercial banks are required to hold 4% of shareholders’ funds. For foreign banks, the ratio was 6% of the net working funds. These ratios were revised in 1982 to RM 10 million in each case.
7. Prior to 1982, a locally incorporated bank was required to have a minimum paid-up capital and reserves of RM$2 million. In the case of foreign incorporated banks, the capital funds of their head offices should not be less than RM5 million, while their branches must have working funds of RM2 million.
8. In 1987, the National Automated Cheque Clearing System was introduced which reduced the time required to clear cheques.
9. In 1988, BNM launched a bad cheque monitoring system to control the incidence of bad cheques.
10. In 1988, an Audit and Examination Committee of the Board should be established in banks to evaluate audit reports. Banks were requested to establish a Special Rehabilitation Unit to resolve the problems of non-performing loans
11. Limits on loan facilities were set up in 1984. For a single customer loans cannot exceed 30 per cent of capital funds.
12. In Nov 1985, a Staff Training Fund was set up with contributions from banks to upgrade professional skills
13. From January 1986, interest accrued but not received over the last 12 months or more should not be taken into profits.
14. National Mortgage Corporation known as Cagamas Berhad (CAGAMAS) was established in December 1986 to allow banks to securitize their housing loans.
15. The two tier regulatory system (TTRS) for the commercial banks was introduced in 1994. To qualify for Tier 1-status, commercial banks were required to meet minimum shareholders’ funds of RM500 million by end 1995 and RM1 billion by end 2000. They were required to achieve a strong rating under the CAMEL framework( capital adequacy, asset quality, management capability, earning performance and liquidity position).
16. An incentive-based system called Two-Tier Regulatory System (TTRS) was introduced in 1994 for commercial banks to merge and form larger banking institutions with strong capital structure.
39

17. The TTRS were extended to finance companies and merchant banks in 1996. After the Asian financial crisis, minimum capital funds were raised for finance companies.
18. Over emphasis on capital base and the problem it created led BNM to abolish TTRS in 1999.
19. Bank and Financial Institutions (Amendment) Act 2003 came into effect on 15th January 2004. This amendment allows commercial and finance companies to merge (Bafin framework) to provide a single lending entity. In the same year five out of ten finance companies merged with some of the commercial banks.
7.4. MERCHANT BANKS
1. Merchant banks emerged on the banking scene in 1970s to offer bulk financing and complex banking services. They played a role in the short-term money market and capital raising activities. There were a total of 12 merchant banks in the 1970s.
2. After BAFIA 1989, merchant banks were required to generate 30 per cent of their total income in the form of fee income. This requirement was removed in 1996.
3. With effect from March 1990, merchant banks were allowed to accept deposits from associations, clubs and foundations subject to a minimum denomination of RM 1 million per deposit and this was reduced to RM 500,000 in January 1991.
4. The principal dealer system for the sale of Malaysian Government Securities (MGS) and Treasury Bills was introduced in 1989. Prior to this, the issuance to the MGS and Treasury Bills were taken up through an advance subscription system. Merchant banks can participate as principal dealers for these issues and play an important role in the secondary market trading of these instruments.
5. Effective from 1 October 1991, discount houses were also allowed to invest and trade, underwrite and manage issues of private debt securities approved by BNM. Fund management activities were also allowed to be conducted by discount houses on case-by-case basis.
6. In January 1996, the two-tier regulatory system (TTRS) was introduced for the merchant banking industry. Similar rules which were applied to commercial banks also applied to merchant banks, with a different quantum of required shareholders’ funds.
7. BNM issued guidelines on the requirements, processes and regulatory framework for investment banks. Merchant banks, and discount houses were expected to merge into investment banks by the middle of 2006.
7.5 FINANCE COMPANIES
1. Finance companies were initially brought within the ambit of BNMs supervisory control through the enactment of the Borrowing Companies Act 1969 (later renamed the Finance Companies Act 1969. This Act was replaced in 1989 with BAFIA.
2. Finance companies specialize in consumption credit (hire-purchase finance, leasing finance, housing loans, block discounting, and secured personal loans). They can accept savings and fixed deposits from the public but cannot offer current account facilities.
3. In 1996, the two-tier regulatory system (TTRS) was introduced to finance companies. 4. In March 1998, BNM announced a merger program to consolidate the finance company
industry. Six anchor finance companies were identified. Some of the other finance companies were absorbed by the parent banks, while some others were forced to merge with the six anchor companies.
40

7.6 INSURANCE INDUSTRY
1. Prior to 1950, insurance business in Malaysia was mainly offered by branches of foreign insurance companies.
2. Between 1963 till 1988, the number of Malaysian-incorporated insurance companies increase from 6 to 51 and most of these were the local incorporation of Malaysian branches of foreign insurance companies.
3. In January 1997, the Insurance Act of 1996 was implemented. This Act required the foreign incorporated insurers to transfer their insurance business to their Malaysian insurance companies incorporated locally under the Companies Act 1965.
7.7 The Financial Sector Master Plan released in 2001 provided a blue print for the development of an effective, competitive, resilient and dynamic financial system. It has 3 phases of implementation: (1) Phase 1 (3 years) is focused on capacity building of the domestic institutions; (2) Phase 2 (3 to 4 years) is focused on increasing domestic competition; (3) Phase 3 sets the pace for integration with the international market and the possibility of introducing new foreign competition after seven years.
VIII: Case studies Maybank and Its Performance
The Maybank Group is the largest banking group in Malaysia, with over 378 branches of Maybank itself and well over 400 branches within the larger Group. The Group has been leading the banking industry for over three and a half decades. During this time, the Group's achievements have paralleled Malaysia's ascent to international recognition.. Maybank has a presence in 12 countries through its network of branches, subsidiaries, associate and representative offices. The bank is represented in all major financial centres of the world, with branches in London, New York, Hong Kong and Singapore. In addition, Maybank has correspondent banking relationships with 700 foreign banks. The bank and the Group currently employ 22,500 and 23,147 people, respectively. Bank’s Financial Services
Maybank Group comprises several business segments, namely banking, finance, investment banking, insurance as well as asset and fund management, nominee and trust services and custodian services.
The banking segment focuses on the business of banking in all its aspects which also include Islamic Banking Scheme (IBS) operations. Its activities cater to individuals and business customers in the area of Retail Financial Services (RFS) and Enterprise Financial Services (EFS) respectively. The business of its finance subsidiary was transferred to the bank in the financial year 2005. It provides financing products and services (including IBS products and services) to individual customers and small and medium enterprises, concentrating on hire purchase financing, leasing, block discounting and other retail based loans products. The investment banking segment includes merchant bank, discount house and securities broker, serving mainly large corporate customers and financial institutions.
41

Performance Indicators of Maybank
Table 18 below shows that the net profit margin of MBB is in increasing trend, with a slight drop in the financial year 2005, reaching 23.98 per cent from 8.79 per cent in 2001. Earning per share is also increasing. Payment of cash dividend also increased over this period, except for 2002. In spite of the declining trend in the percentage of interest income to loan and advances, the deposit rates decreased over time. This has been due to the easy availability of deposits at the low rate and reduction in interest rate structure in the aftermath of deregulation. Other indicators like NPL ratio, net worth, margins and core capital to risk weighted assets indicate sound performance of this banking group. Net worth of the bank shows higher returns despite the significant increase in dividend payment. The share of core capital and capital fund to risk weighted assets of the bank is above the regulatory requirement throughout the years under consideration.
Table 18 Financial Performance Indicators of Maybank Banking Berhad
Fiscal Years 2001 2002 2003 2004 2005
Net Profit/Total Income, per cent 8.79 17.54 21.83 25.10 23.98
Earning Per Share in RM 0.36 0.47 0.56 0.67 0.68
Per cent Cash Dividend on Paid Up Share
Capital 8.67 3.60 37.06 37.44 49.99
Per cent Interest Income on Loans & Advances 8.55 7.75 7.01 6.73 6.33
Per cent of Interest Expense on Deposit s&
Borrowings 3.01 2.51 2.25 1.97 1.90
Total Loan/Total Deposit 0.96 0.93 0.94 0.88 0.91
Non Performing Loan/Total Loan, per cent 15.23 12.87 11.60 10.38 8.72
Book Net Worth in Million RM 10,040.36 11,667.33 13,485.23 14,623.44 16,401.31
Per cent Liquidity (Total cash in hand/Total
Deposit) 13.11 15.39 14.74 18.65 17.24
Per cent Core Capital to Risk Weighted Assets 9.17 10.35 10.24 10.37 10.27
Per cent Capital Fund to Risk Weighted Assets 13.05 15.62 15.25 15.10 13.84
Interest Income in Million RM 7,920.79 7,403.24 7,187.35 7,336.28 7,564.46
Interest Expenses in Million RM 3,925.72 3,451.11 3,290.12 3,217.08 3,304.72
Margin in Million RM 3,995.07 3,952.13 3,897.24 4,119.21 4,259.73
Staff Expenses as per cent of Total Income 10.78 11.10 12.56 13.1 13.00%
Source: Annual Reports of Maybank from FY2000/01 to FY2004/5
Public Bank and ts performance
Public Bank was founded in 1966 and listed on the Main Board of Bursa Securities in 1967. With 40 years of excellent service in the banking sector, it has grown to be the second largest lender in Malaysia by market capitalization and the fifth largest listed company in Malaysia.
42

Public Bank remains focused on its core strengths in the retail banking market and is
committed to its goal of being a one-stop financial centre in Malaysia. The Public Bank Group's primary growth strategy remains focused on increasing market share through organic growth and on enhancing shareholders' value through strong and consistent financial performance.
Public Bank Group continues to strengthen its presence and market share in the domestic market, particularly in residential mortgages, passenger vehicles hire purchase financing and lending to middle market small- and medium-sized enterprises. Having completed the merger of the finance company business of Public Finance with the commercial banking business of Public Bank in 2004, the Group is taking steps to merge Public Merchant Bank and PB Securities to form an investment bank and also to set up an Islamic banking subsidiary.
Public Bank Group's business ended the financial year 2005 on a high note with RM111.6 billion in assets, RM68.1 billion in loans and RM84.1 billion in deposits. Public Bank commands a larger loan market share of 12.3 per cent, up from 5.7 per cent in 2000, with strong loan growth in excess of or close to 20 per cent per year in the last five years. In terms of balance sheet size, the Public Bank Group is the third largest banking group in Malaysia with the lowest non-performing loan ratios. Public Bank’s financial services
As a one-stop financial services provider, the Public Bank Group offers a wide array of financial products and services which include commercial banking, hire purchase financing, merchant banking, credit cards, Islamic banking, stock broking, sales of trust units and management of unit trusts funds, banc assurance and general insurance products, and other related financial services such as nominees and trustee services. New products and services are introduced regularly to meet the increasingly complex and sophisticated customer demand. Performance Indicators of Public Bank
Table 19 below shows the summary of performance of Public Bank in recent years. Net profit margin rose steadily from fiscal year 2001 to 2004. However, there was a slight decrease from year 2004 to year 2005. On the other hand, dividend on paid up share capital is also rising. This shows that the Public Bank is still performing well and investors still have confidence in it. Another excellent achievement done by the Public Bank is the NPL over total loan ratio is reduced from 4.41 per cent to 1.38 per cent over the years. The CEO of Public Bank Tan Sri Dato’ Sri Dr. Teh Hong Piow believes that this figure will even go lower from time to time. Table 19 Financial Performance Indicators of Public Banking Berhad (per cent, unless stated) Fiscal Year 2001 2002 2003 2004 2005
Net Profit/ Total Income 34.37516 41.02275 47.84308 53.28779 41.02455
Dividend (Cash & Bonus) on Paid up Share
Capital 15.07756 21.7323 36.54999 24.73008 NA
Interest Income on Loan & Advance 9.07219 8.364613 9.008575 5.443215 6.381206
Interest expenses on Deposit & Borrowing 3.011345 2.571865 2.496259 2.111071 2.52859
Total Loan/ Total Deposit 65.61298 64.2705 56.72994 78.89198 78.55941
43

NPL/ Total Loan 4.410936 2.816372 1.907841 2.235026 1.384903
Liquidity (Total cash in hand/ Total Deposit) 26.14937 22.71107 27.96329 29.14092 20.88717
Core Capital Ratio 16.8 15.6 15.6 13.8 9.8
Risk Weighted Capital ratio 16.8 15.6 15.6 15.3 13.6
Interest Income in Million RM 1782.982 1885.429 2101.499 2931.504 4120.977
Interest Expenses in Million RM 901.998 901.988 1026.48 1441.136 2078.632
Source: Annual Reports of Public Bank from FY2000/01 to FY2004/5
Bumiputra-Commerce Holdings Berhad (BCHB) and its performance
Bumiputra-Commerce Holdings Berhad (BCHB) (formerly known as Commerce Asset-Holding Berhad) Group is a leading financial services player in Malaysia with a growing presence in South East Asia.
BCHB has been listed on Bursa Malaysia Securities Berhad since 1987. As at 30 December 2005, it is the eighth largest company by market capitalisation amounting to RM15.698 billion. In 2005, the Group undertook a significant step towards creating a universal banking platform through the internal restructuring of its investment and commercial banking arms, namely CIMB Berhad and Bumiputra-Commerce Bank Bhd.
The Group is involved in the full suite of investment banking and commercial banking services. From a regional perspective, BCHB has a 65% stake in Indonesia’s seventh largest bank, P.T. Bank Niaga and in 2005, CIMB acquired the stock broking businesses of GK Goh Holdings Limited, Singapore. The Group is also involved in venture capital, life & general insurance and takaful business. As for the insurance business, a new insurance holding company, namely Commerce International Group Berhad was established at the end of 2005 to facilitate shared services and provide overall strategic direction for the Group’s insurance and takaful businesses. BCHB’s financial services
BCHB’s corporate and investment banking arm provide corporate finance, equity market and derivatives, cross market trading and treasury, debt capital market and syndicate, structured products and derivatives, research, corporate and international banking, asset management, private equities, structured assets, real estate, structured investments and private banking and custody and trust services to individual, corporate clients, governments and financial institutions.
BCHB’s Islamic financial boutique provides Islamic commercial, investment banking and asset management services. With over 100 Islamic investment bankers and specialists, BCHB has the relevant expertise and experience to provide timely insights into all aspects of Islamic financing.
Performance Indicators of BCHB
According to Table 20 net profit margin was performing well from fiscal year 2001 to 2003. However, after year 2003, it has dropped from 26.64 per cent to 17.51 per cent. Furthermore, the NPL ratio is also rising from year 2001 to 2005. Perhaps the strategy of BCHB integrating with CIMB bank could fix these problems.
44

Table 20 Financial Performance Indicators of BCHB (per cent, unless stated otherwise)
Fiscal Year 2001 2002 2003 2004 2005
Net Profit/ Total Income 19.51 29.39 26.64 18.01 17.51
Dividend (Cash & Bonus) on Paid up Share
Capital 4.28 3.69 7.30 10.87 NA
Interest Income on Loan & Advance 9.18 8.35 9.32 8.43 8.72
Interest expenses on Deposit & Borrowing 4.30 3.28 4.01 3.47 4.09
Total Loan/ Total Deposit 0.90 0.80 0.86 0.84 0.93
NPL/ Total Loan 6.7 7.7 8.7 9.7 10.7
Liquidity (Total cash in hand/ Total Deposit) 10.86 12.16 22.25 22.45 16.25
Core Capital Ratio 9.81 10.53 10.94 9.75 11.2
Risk Weighted Capital ratio 12.28 12.38 14.79 13.62 15.23
Interest Income in Million RM 3876.99 4072.24 5080.36 5276.50 6025.13
Interest Expenses in Million RM 2015.99 1992.94 2533.73 2572.98 3038.88
Source: Annual Reports of BCHB from FY2000/01 to FY2004/5
45

Conclusions
Since independence in 1957, Malaysian economy transformed itself from agriculture base to a manufacturing sector led economy within the space of 25 years. Against this backdrop, the Malaysian financial system has gradually changed to meet the demands of the economy. Policies have been modified to develop an efficient and sophisticated financial system that can meet the financing needs of the economy as well as support the national policy objectives. In this context, Malaysia recognized that the opening up of the domestic financial sector to foreign competition would contribute towards creating more efficient, competitive and market driven financial sector. Nevertheless, the country recognizes that opening up the financial sector has to be carried out in an orderly manner.
Malaysia remains committed to further liberalization of its financial sector. Foreign participation has always been significant in the financial sector of the country. Malaysia’s commitments under GATS of WTO is an indication of liberalizing the foreign ownership in both banking, insurance and other areas of financial sector. The government allowed 13 foreign banks to maintain 100 per cent equity ownership but the banks were required to be locally incorporated. Foreign participation is also allowed in other domestically controlled banks. In the insurance sector, existing foreign shareholders were allowed to increase their equity to a maximum of 51 per cent of the equity of the insurance company. New entry of foreign insurance companies was allowed up to 30 per cent equity of a locally incorporated company.
The capital market has also opened up to global players, with a gradual increase in foreign equity participation in stock broking; fund management and entry of managers, experts and professionals. Foreign equity is allowed up to 49 per cent in stock broking companies and in the fund management and investment advisory areas, foreigners are allowed to hold 100 per cent equity. Thus Malaysia has made substantial progress in its commitments under GATS of WTO to progressively liberalize its financial system.
After the turmoil created by the Asian financial crisis, Malaysia found it necessary to pursue its long-term objective of building a competitive and dynamic financial sector by introducing further regulatory measures. To prepare the domestic institutions for liberalization, a time line of 10 years has been set with the aim of building a strong banking and insurance sectors. These time lines are included in the Financial Sector Master Plan and Capital Market Master Plan. Both were launched in 2002. The main focus of both plans was to build capacity.
A significant banking merger exercise was undertaken which compelled 54 institutions to form into 10 domestic banking groups by the end of 2002. These ten domestic banking groups shall compete with the 13 foreign owned commercial banks that have been incorporated locally. In the broking sector, some 66 companies merged to form 40 stock broking companies by the end of 2002. This process of restructuring and consolidation is expected to continue. Consolidation of both commercial banks and finance companies into a larger entity on one side, and the merger of merchant banks, discount houses and the stock-broking firms into investment banks on the other, should put Malaysia on a strong footing to compete globally in the offer of financial services. The progress of consolidation is in line with the agenda set in both the financial and capital master plans.
Liberalization of the financial system is to continue at a pace that is consistent with the prevailing conditions, infrastructure and regulatory framework and the needs of the economy. An important lesson learned from the crises in 80s and 90s, is that liberalization strategies must follow
46

with systematic regulations and effective supervision policies in place to enhance capacity building. It is a matter of time before the banking and insurance sectors are progressively liberalized.
On the question whether liberalization of trade in services and the consolidation of the banking sector with foreign participation should progress simultaneously, preliminary empirical evidence suggests that this should be the case. Liberalization of trade has impacted on the deepening of the financial system (the opening of trade facilities improves the availability of domestic credit) and vice versa and therefore, careful planning is essential to benefit from liberalization and strengthening of the domestic banking system.
47

Appendix 1
A. ISLAMIC BANKING: POLICY REFORMS AND PERFORMANCE
The Islamic Banking Act 1983 (IBA) was enacted for Islamic banking to exist side-by-side with conventional banking in Malaysia. The Government through Government Investment Act 1983, issued Government Investment Certificates which are Government bonds issued on Islamic principles to enable the bank to meet their liquidity requirements.
Bank Islam Malaysia Berhad (BIMB) was the first Islamic bank to be established in Malaysia in July 1983. As provided in IBA, BIMB carries out banking business similar to to other commercial banks, but along the principles of Syariah. By the end of 1993, Bank Islam had a network of 52 branches.
On the prudential front, the Bank has to adhere to the same regulatory rules as other banks offering conventional banking products. The bank has to observe a minimum risk-weighted capital ratio of 8 per cent.
To create an Islamic Banking System, BNM has to follow certain steps to create a large number of players and a wide range of products. The first step was to disseminate Islamic banking on a nationwide basis with as many players as possible and within the shortest period possible. This was achieved through the introduction of Skim Perbankan Tanpa Faedah (SPTF) or Interest Free Banking Scheme in March 1993. This scheme allows conventional banking institutions to offer Islamic banking products using their existing infrastructure, including staff and branches. Each commercial bank was expected to establish an Islamic Banking Unit and open separate current/clearing accounts for Islamic banking operations with BNM and observe a separate cheque clearing system for Islamic banking.
Islamic banking functions were conducted within the conventional banking system by an Islamic Banking Unit which later transformed into an Islamic Banking Division. This was a one stop centre for all Islamic Banking operations within the conventional bank.
Another major development in Islamic banking was the establishment of the Islamic money market on 3rd January 1994. This was expected to play an important role in providing Islamic institutions with facilities to change their portfolios over the short term and secondly serving as a channel for the transmission of monetary policy.
A second Islamic bank was established on 1st October 1999. By the end of 1999, total banking institutions participating in Islamic banking increase to 54 comprising 24 commercial banks, 18 finance companies, 5 merchant banks and 7 discount houses. Islamic banking facilities are now available in 120 branches of the Islamic banks, 1663 branches of the SPI(Islamic Banking Scheme) commercial banks, including six full-fledged Islamic banking branches, 820 finance company branches, including two full-fledged Islamic banking branches, and nine merchant bank branches. Total assets
48

Table 1: Income and Expenditure
Net change in bad debt* staff* overheads* pre- tax
income
total
income provisions costs profits
1999 280.7 16.900 30.000 28.700 75.4
2000 301 20.3 15.300 32.000 37.600 51.7
2001 1364.3 1063.3 30.400 10.000 12.600 844.5
2002 1626.9 262.6 33.300 9.400 12.700 947.8
2003 2174.8 547.9 46.100 7.900 13.100 960.4
2004 2484.7 309.9 41.200 9.400 14.800 988.1
2005 3197.2 712.5 26.300 12.000 18.800 1554.8
* these ratios are based on total income
The Islamic banking system continued to show strong performance in 2005. The change in
net income has been increasing since 1999 when conventional banks began to offer Islamic banking products. Bad debt provisions as a ratio of total income was above 40% during 2003/2004 but brought down in 2005 to 26.3%. B. Financial sector liberalization, financial deepening and economic growth
1. Introduction
The relationship between financial development and economic growth has been explored extensively in theoretical and empirical literature. The theoretical underpinnings of this link can be traced back to the work of Schumpeter (1911), and later to McKinnon (1973) and Shaw (1973) and others. The main policy implications of McKinnon/Shaw is that government restrictions on credit availability hinder financial deepening. This may in turn affect investment and economic growth. Similar conclusions are also reached by the endogenous growth literature in which the services provided by the financial intermediaries are explicitly modeled. These models suggest that financial intermediation has a positive effect on steady-state growth (Bencivenga & Smith 1991), and that government intervention in the financial system has a negative effect on growth (King & Levine, 1993).
The positive relationship between the development of the financial system and real economic growth predicted by both the McKinnon/Shaw approach and the endogenous growth literature has received considerable empirical support from cross-sectional studies (World Bank 1989, Roubini & Salai-i-martin 1992 and King & Levine 1993).
What role has liberalization of trade and services play in the nexus between financial liberalization and economic growth? It is not difficult to understand that an efficient and well
49

regulated financial sector can lead to an efficient transformation of savings to investment, thus ensuring resources are deployed where they have the highest returns.
In static models without market imperfections, restrictions on trade in goods reduce the level of real GDP. Restrictions on trade in services can also be expected to have similar effect on economic growth. Restrictions on trade in services can drive a wedge between domestic and foreign price of services. Many of the empirical sectoral studies support this contention (Hockman & Braga 1997).
The impact of goods liberalization on growth can be different from that of services liberalization.. In the neo-classical model, long run growth is exogenously determined by technical progress. In a two sector model, trade policy affects the allocation of resources between sectors and hence savings and investment. The effect on level of GDP can be one-off impact but not on the rate of growth.
However in endogenous growth models, trade liberalization can have positive or negative impact (Rodriguez & Rodrik 1999) depending on whether the resource allocation effects of trade policy promote sectors that generate long run growth. The key difference between trade in goods and services in terms of their impact on growth stems from two features of services liberalization; (a) “imports” of services must be locally produced and (b) liberalization leads to greater competition, both domestic and foreign. Greater foreign factor participation and increased competition together can enhance growth. If foreign participation merely substitutes for domestic factors, the degree of competition remains unchanged and there cannot be a positive impact on growth.
If greater technology transfer accompanies services liberalization, the growth effect will be stronger. Coe, Helpmann and Hoffmaister (1999) presents empirical evidence demonstrating the impact of technology diffusion (via trade in goods) on total factor productivity growth. Theoretically, the same applies to trade in services.
More empirical evidence began to appear in 1990s following the work of King & Levine (1993). Their empirical specifications included various measures of financial development and these have been widely used in many of the recent studies. King & Levine (1997) found that higher levels of financial development are associated with faster economic growth and conclude that financial development leads economic growth. However, conomic growth may create demand for more financial services and therefore the financial system will grow in response to economic expansion. Empirical support for this approach is found in Demetriades & Hussein (1996).
There is new literature showing trade openness, financial development and economic growth are related. Beck (2002) demonstrates that financial development results in higher level of exports and trade balance of manufactured goods which in turn generate economic growth.
Using an entirely different approach to estimate causality, Mattoo et al. (2000) constructed indices of trade openness. They contend that two key elements contribute to the dynamic benefits from services liberalization: (1) degree of competition, (2) the extent of foreign ownership, (3) nature of regulation. For the financial sector the authors used commitments under GATS to represent national policies relating to competition and foreign ownership of financial services. They used an index of capital controls compiled by Dailami (2000) to represent openness of a country’s current and capital accounts. Both these measures were combined to form an index of openness of the financial services trade.
50

2. Econometric Methodology and Data
In this study we used the Auto-regressive Distributed lagged (ARDL) model to examine the relationship between financial deepening (CREDIT) and the liberalization of trade and services (OPEN). We also used a new co-integration test called the Bounds Test developed by Pesaran et al.(2001) to establish if the variables are co-moving. This empirical framework has two major advantages over the traditional error correction framework proposed by Engle and Grainger (1987), Johansen (1988) and Johansen & Juselius (1992). First the ARDL approach used in this study allows for the explanatory variables to be a mixture of stationary and non-stationary series. Second, the Bounds Test is robust against small sample bias. Hence, it gives reliable estimates for small sample studies.
In this section, we outline the empirical model and the data used in this study. First we conduct a unit root test using the Phillips Perron (PP) test. The PP-test will determine the order of integration of each of the series. Once the order of integration is determined, we test if there is a long run relationship between the variables. Here we use the autoregressive distributive lag (ARDL) method proposed by Pesaran et al., (2001). This involves the following models (UECM):
1 2
1 1
1 1 2 1
k k
om t ii i
m t m t Mt
LnCredit im LnCredit im LnOPEN
LnCredit LnOPEN
α β ξ
θ θ ε
−= =
− −
Δ = + Δ + Δ
+ + +
∑ ∑ + (1)
Where LnCredit, and LnOPEN are the logarithm value of Domestic Credit/gdpn, and Trade/gdpn. The variables in (1) are in logarithm, so the coefficients are the elasticities.
In order to test for the absence of a long run relationship in (1), we conduct a Wald-type (F-test) coefficient restriction test, which entail testing the following null hypothesis, respectively: H 0 : m1θ = m2θ = 0 (2)
This test is known as the Bounds Test (Pesaran et al, 2001) and the computed F-statistics under the null hypothesis (2) is F(LnCredit/ LnOpen). The asymptotic distribution of the test statistic is non-standard regardless of whether the variables are I(0) or I(1). For this purpose Pesaran et al. (2001) computed two sets of asymptotic critical values where the first set assumes variables to be I(0) and the other as I(1) which are known as lower bounds (LCB) and upper bounds critical values (UCB), respectively. A decision on whether cointegration exists between the dependent variables and its regressors is then made based on the criterion given in Table 1.
Table 1 F Statistics Decision Meaning F statistic > UCB Reject H0 LnCredit and its regressors are co-integrated F statistic < LCB Fail to Reject H0 LnCredit is not co-integrated with regressors LCB < F sstatistic<UCB Results inconclusive
51

Once both order of integration and co-integration are established, we then use the standard Grainger causality tests to confirm the direction of causality. In the case, when the series are of order I(1) and co-integrated, we conduct the Grainger causality with inclusion of the lagged error correction term (ECT)
Table 2:Phillip-Perron Unit Root Test Log levels Log differences MALAYSIA with trend with trend Lncredit -2.4194 -11.8875* lnM3 -2.8002 -10.6093* lnopen -3.2946 -6.6160* NEPAL Lncredit -5.0005* - lnM3 -2.1934 -16.1159* lnopen -1.6608 -5.2439* BANGLADESH Lncredit -3.0537 -4.7926* lnM3 -2.5763 -7.2466* lnopen -5.7167 -8.7508* AUSTRALIA Lncredit -2.0035 -5.2424* lnM3 -1.4702 -6.9799* lnopen -2.9596 -7.2954* Source: IFC statistics
All variables other than lncredit in Nepal, are non-stationary. The PP test shows that all the series are integrated of order 1. This implies that using ordinary least squares may lead to spurious estimates. All the variables are significant at 1% critical value.
Table 3 below reports the results of the bounds test for co-integration analysis. It is evident that only when lnCredit is the dependent variable does there exist a long run relationship between LnOpen and LnCredit.
52

3. Empirical Findings Table 3: The Bounds Test for Co-integration
F-Statistic lag ECM Malaysia 1970-2004 Fcredit (Lncredit/lnopen) 6.1428 7 =-0.1637 [0.046] [0.034] Fopen (Lnopen/Lncredit) 0.3441 7 = -0.0308 [0.777] [0.703] 1986-2004 Fcredit (Lncredit/lnopen) 5.6003 7 = -0.2588 [0.061] [0.004] Fopen (Lnopen/Lncredit) 4.7473 7 = -0.3748 [0.093] [0.118] Australia 1970-2004 Fcredit (Lncredit/lnopen) 14.7528 9 = -0.3417 [0.001] [0.003] Fopen (Lnopen/Lncredit) 4.9972 9 = -0.4262 [0.082] [0.016] 1985-2004 Fcredit (Lncredit/lnopen) 26.6156 8 = -0.4375 [0.000] [0.004] Fopen (Lnopen/Lncredit) 1.7414 8 = -0.2758 [0.419] [0.151] Nepal 1975-2000 Fcredit (Lncredit/lnopen) 46.0982 2 = -0.2654 [0.000] [0.000] Fopen (Lnopen/Lncredit) 1.1200 2 = -0.2046 [0.082] [0.878] 1982-2000 Fcredit (Lncredit/lnopen) 16.6287 5 = -0.4068 [0.000] [0.001] Fopen (Lnopen/Lncredit) 0.6291 5 = -0.01219 [0.730] [0.929] Bangladesh 1974-2003 Fcredit (Lncredit/lnopen) 3.7808 2 = -0.2012 [0.151] [0.107] Fopen (Lnopen/Lncredit) 0.7405 2 = -0.1251 [0.691] [0.275] 1986-2003 Fcredit (Lncredit/lnopen) 15.6900 7 = -0.0885 [0.000] [0.617] Fopen (Lnopen/Lncredit) Note: 90% critical values are 4.042-4.788, 95% critical values are 4.934-5.764
53

The results indicate that there is a link between financial development and exports and
imports of trade and services. For the longer period (1970-2004), all countries exhibit strong causality from trade openness to financial deepening. Only in the case of Australia does the level of financial development have an effect on the structure of trade balance. Therefore causality runs in both directions in the case of Australia.
For a shorter period (1982-2004), only Malaysia exhibits causality in both directions while two other countries (Australia and Nepal) show one way causality from trade openness to financial deepening. Bangladesh does not show any form of causality in the shorter period.
The long run impact is also captured by the error correction term (ECT). The ECT for Malaysia, Australia, and Nepal (for longer period) were found to be statistically significant at the 5% significance level. This suggests that in the long run liberalization of services Grainger-causes financial deepening. This means that causality runs interactively through ECT from Lnopen to Ln credit. The magnitude suggests a deviation from the equilibrium level of Lncredit during the current period will be corrected by 16%, 34% and 26% in the next period for Malaysia, Australia and Nepal respectively.
From the above analysis, we can conclude that Lnopen (liberalization of services) influences LnCredit (financial deepening) in the long run. The estimated long run elasticities using ARDL model are given in Table 4.
Thus empirical evidence shows that greater liberalization of services trade has significant effects on financial deepening and economic growth.
54

Table 4
Long Run Elasticities Dependent Variable Independent Variables Lnopen Lncredit Malaysia 1970-2004 lncredit 0.7683*** (0.083) Lnopen 0.4314 (0.3414) 1986-2004 Lncredit 0.7224* (0.000) Lnopen 0.7728** (0.023) Australia 1970-2004 Lncredit 3.1254* (0.000) Lnopen 0.2691* (0.001) 1985-2004 Lncredit 1.5366* (0.009) Lnopen 0.1976 (0.327) Nepal 1975-2000 Lncredit 0.6498* (0.000) Lnopen -0.6949 (0.926) 1982-2000 Lncredit 0.5997* (0.000) Lnopen -1.8334 (0.961) Bangladesh 1974-2003 Lncredit 0.6391*** (0.056) Lnopen 0.7400 (0.302) 1986-2004 Lncredit 7.5255 (0.633) *, **, *** denotes significance at 1%, 5%, and 10% significance level respectively. The probabilities are given in ( ).
55

References
Bank Negara Malaysia, Annual Report, several issues Beck, T., 2002. Financial Development and International trade: Is there a Link? Journal of International Economics 57, 107-131 Bencivenga, V.R., Smith, B.D., 1991. Financial Intermediation and Endogenous Growth. Review of Economic Studies 58, 195-209 Coe, David T. and Alexander W Hoffmaister,1997 “ North-South R & D spillovers”, The Economic Journal (UK); 107:134—39, January Dailami, Mansoor, “Financial Opennes, Democracy and Redistributive Policy”, World Bank Institute, 2000. Demetriades, P., Hussein, K.A., 1996. Does Financial Development Cause Economic Growth? Time-series evidenc from 16 countries, Journal of Development Economics 51, 387-411 Engle, R.F. and Grainger, C.W.J (1987), Co-integration and error correction: Representation, estimation and testing, Econometrica, 55, 252-276 Johansen, S. (1988), Statistical analysis of co-integration vectors, Journal of Economic Dynamics and Control, 12, 231-254. Johansen,S. and Juselius, K. (1992), Testing structural hypothesis in a multivariate cointegration analysis of the PPP and the UIP for UK, Journal of Econometrics, 53, 211-244 King,R.G., Levine, R., 1993(a). Finance and Growth: Schumpeter might be right. Quarterly Journal of economics 108, 717-737 King, R.G., and Levine.R., 1993(b) Finance, entrepreneurship and growth, Journal of Monetary economics 32, 1-30 Martin Khor, “Government procurement in FTAs: An outline of the Issues”, Third World Network Mattoo Aaditya, Rathindran Randeep, Subramaniam Arvind (2001), Measuring Services Trade Liberalization and its Impact on Economic Growth, An Illustration, Policy Research Working Paper 2655,The World Bank, Development Research Group, Trade, August 2001. McKinnon, R.I., 1973. Money and capital in economic development. Brookings Institution, Washington D.C Money and Banking in Malaysia, Bank Negara Malaysia, Kuala Lumpur 1989 Monthly statistical Bulletin, Bank Negara Malaysia, several issues. Pesaran, .H., Shin. Y., and Smith R.J. 2001 Bounds testing approach to the level relationship, Journal of Applied Econometrics, 16, 289-326
56

Phillips, P.C.B and P.Perron (1988) “ Testing a unit root in a Time series Regression”, Biometrika, 75, pp335-46 Ramkishen S.Rajan and Rahl Sen, “ Liberalization of Financial services in Southeast Asia under the ASEAN Framework Agreement on Services ( AFAS). October 2002, Adelaide University Roubini, J. and X. Sala-i-Martin, 1992 Financial repression and economic growth, Journal of Development Economics, 39, 5-30 Rodriguez, Fransisco and Dani Rodrik, 1999 “ Trade policy and Economic Growth: A Skeptic’s Guide to the Cross-national evidence,” Discussion Paper 2143, Center for Economic Policy Research, May . Shaw, E.S., 1973. Financial Deepening in Economic Development. Oxford University Press, London and New York. The Central Bank and the Financial System in Malaysia- a decade of change, Bank Negara Malaysia, Kuala Lumpur, 1999. Yun-Hwan Kim,(2002) Financial Opening under the WTO Agreement in Selected Asian Countries: Progress and Issues, ERD working Paper No.23, Asian Development Bank World Bank, 1989, World development report 1989 ( Oxford University Press, New York) Zeti Akhtar Aziz, “ Recent developments in Islamic finance in Malaysia, “ speech delivered at the Malaysian Islamic Finance Issuers and Investors Forum 2006, Kuala Lumpur, 14th August 2006.
57