
General Motors Corporation Use of Non-GAAP Financial Measures
22
8 General Motors Corporation Use of Non-GAAP Financial Measures This press release, the accompanying tables and the charts for securities analysts include the following financial measures, which are not prepared in accordance with Accounting Principles Generally Accepted in the United States of America (GAAP): (1) adjusted net income; (2) adjusted earnings before tax; (3) managerial cash flow; and (4) GM North America vehicle revenue per unit. Each of these financial measures is therefore considered a non-GAAP financial measure. This press release and the charts for securities analysts also contain a reconciliation of each non-GAAP financial measure to its most comparable GAAP financial measure. Certain prior period amounts have been reclassified in the consolidated statements of operations and related summaries to conform to the current period presentation. Management believes these non-GAAP financial measures provide meaningful supplemental information regarding GM’s operating results because they exclude amounts that GM management does not consider part of operating results when assessing and measuring the operational and financial performance of the organization. In addition, GM has historically reported similar non-GAAP financial measures and believes that inclusion of these non-GAAP financial measures provides consistency and comparability with past earnings releases. GM management believes these measures allow it to readily view operating trends, perform analytical comparisons, benchmark performance among geographic regions and assess whether the GM North American structural cost turnaround plan is on target. Also, GM management uses adjusted net income and adjusted earnings before tax for forecasting purposes and in determining future capital investment allocations. Accordingly, GM believes these non-GAAP financial measures are useful to investors in allowing for greater transparency of supplemental information used by management in its financial and operational decision-making. While GM believes that these non-GAAP financial measures provide useful supplemental information, there are limitations associated with the use of these non-GAAP financial measures. These non-GAAP financial measures are not prepared in accordance with GAAP, do not reflect a comprehensive system of accounting and may not be comparable to similarly titled measures of other companies due to potential differences in the method of calculation between companies. Costs such as the special attrition programs and restructuring charges that are excluded from GM’s non-GAAP financial measures can have a material effect on net earnings. As a result, these non-GAAP financial measures have limitations and should not be considered in isolation from, or as a substitute for, net earnings, cash flow from operations, or other measures of performance or liquidity prepared in accordance with GAAP. GM compensates for these limitations by using these non-GAAP financial measures as supplements to GAAP financial measures and by providing the reconciliations of the non-GAAP financial measures to their most comparable GAAP financial measures. Investors are encouraged to review the reconciliations of these non-GAAP financial measures to their most comparable GAAP financial measures that are included elsewhere in this press release. Adjusted Net Income and Adjusted Earnings Before Tax Adjusted net income excludes charges for certain tax related items, gains and losses on the sale of business units and business interests, charges associated with accounting changes, restructuring, plant closure and impairment charges, charges associated with Delphi Corporation (Delphi), special attrition program charges, and other gains and losses which management excludes when assessing the internal performance of the organization. Adjusted earnings before tax begins with adjusted net income and is adjusted to remove any remaining tax expense or benefit.
Transcript of General Motors Corporation Use of Non-GAAP Financial Measures
8
General Motors Corporation
Use of Non-GAAP Financial Measures
This press release, the accompanying tables and the charts for securities analysts include the following financial measures, which are not prepared in accordance with Accounting Principles Generally Accepted in the United States of America (GAAP): (1) adjusted net income; (2) adjusted earnings before tax; (3) managerial cash flow; and (4) GM North America vehicle revenue per unit. Each of these financial measures is therefore considered a non-GAAP financial measure. This press release and the charts for securities analysts also contain a reconciliation of each non-GAAP financial measure to its most comparable GAAP financial measure. Certain prior period amounts have been reclassified in the consolidated statements of operations and related summaries to conform to the current period presentation. Management believes these non-GAAP financial measures provide meaningful supplemental information regarding GM’s operating results because they exclude amounts that GM management does not consider part of operating results when assessing and measuring the operational and financial performance of the organization. In addition, GM has historically reported similar non-GAAP financial measures and believes that inclusion of these non-GAAP financial measures provides consistency and comparability with past earnings releases. GM management believes these measures allow it to readily view operating trends, perform analytical comparisons, benchmark performance among geographic regions and assess whether the GM North American structural cost turnaround plan is on target. Also, GM management uses adjusted net income and adjusted earnings before tax for forecasting purposes and in determining future capital investment allocations. Accordingly, GM believes these non-GAAP financial measures are useful to investors in allowing for greater transparency of supplemental information used by management in its financial and operational decision-making. While GM believes that these non-GAAP financial measures provide useful supplemental information, there are limitations associated with the use of these non-GAAP financial measures. These non-GAAP financial measures are not prepared in accordance with GAAP, do not reflect a comprehensive system of accounting and may not be comparable to similarly titled measures of other companies due to potential differences in the method of calculation between companies. Costs such as the special attrition programs and restructuring charges that are excluded from GM’s non-GAAP financial measures can have a material effect on net earnings. As a result, these non-GAAP financial measures have limitations and should not be considered in isolation from, or as a substitute for, net earnings, cash flow from operations, or other measures of performance or liquidity prepared in accordance with GAAP. GM compensates for these limitations by using these non-GAAP financial measures as supplements to GAAP financial measures and by providing the reconciliations of the non-GAAP financial measures to their most comparable GAAP financial measures. Investors are encouraged to review the reconciliations of these non-GAAP financial measures to their most comparable GAAP financial measures that are included elsewhere in this press release. Adjusted Net Income and Adjusted Earnings Before Tax Adjusted net income excludes charges for certain tax related items, gains and losses on the sale of business units and business interests, charges associated with accounting changes, restructuring, plant closure and impairment charges, charges associated with Delphi Corporation (Delphi), special attrition program charges, and other gains and losses which management excludes when assessing the internal performance of the organization. Adjusted earnings before tax begins with adjusted net income and is adjusted to remove any remaining tax expense or benefit.
9
General Motors Corporation
Use of Non-GAAP Financial Measures (Continued)
Managerial Cash Flow GM reports non-GAAP managerial automotive operating cash flow in its earnings releases and charts for securities analysts. Management believes that providing managerial automotive operating cash flow furnishes it and investors with useful information by representing the cash flow generated or consumed by its automotive operations, including cash consumed by automotive capital expenditures and equity investments in companies related to GM’s core business and cash generated by sales of automotive operating assets and equity investments in companies related to GM’s core business, before funding non-operating-related obligations including debt maturities, dividends and other non-operating items. Management uses this non-GAAP financial measure to assess its automotive cash flow when evaluating the performance of GM, its business units and its management teams and when making decisions to allocate resources among GM’s business units.
10
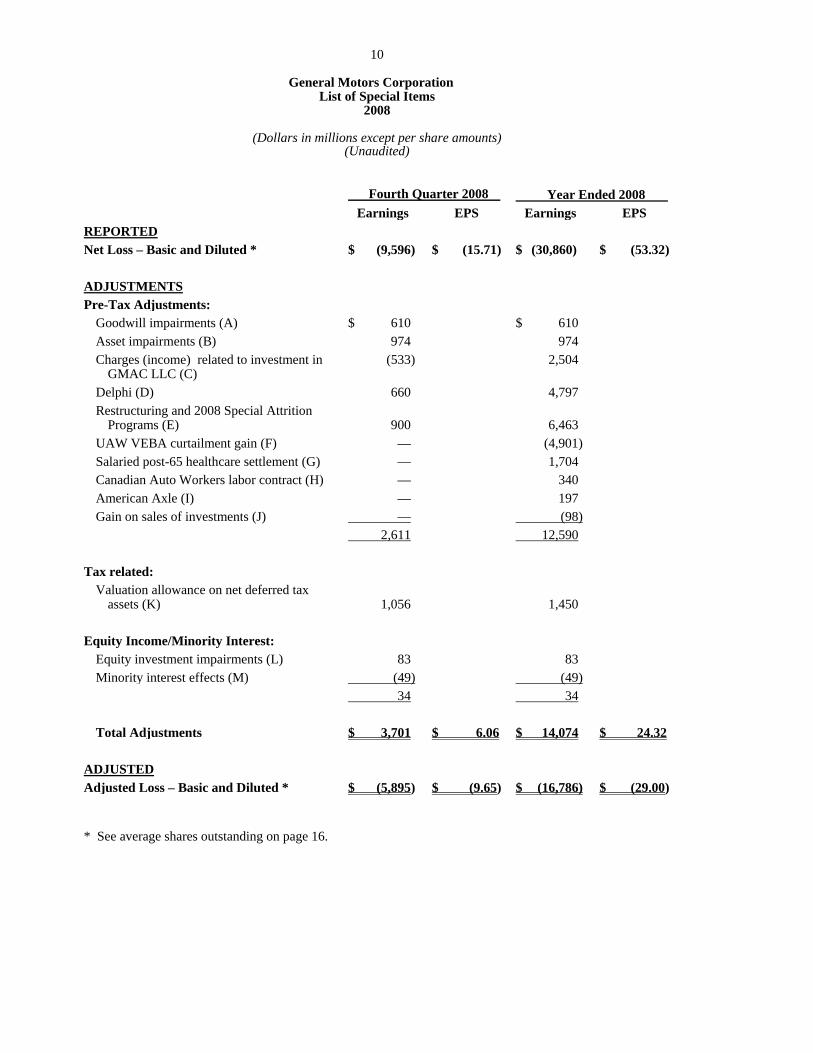
General Motors Corporation List of Special Items
2008
(Dollars in millions except per share amounts) (Unaudited)
Fourth Quarter 2008 Year Ended 2008 Earnings EPS Earnings EPS REPORTED Net Loss – Basic and Diluted * $ (9,596) $ (15.71) $ (30,860) $ (53.32) ADJUSTMENTS Pre-Tax Adjustments:
Goodwill impairments (A) $ 610 $ 610 Asset impairments (B) 974 974 Charges (income) related to investment in
GMAC LLC (C) (533) 2,504
Delphi (D) 660 4,797 Restructuring and 2008 Special Attrition
Programs (E) 900 6,463 UAW VEBA curtailment gain (F) — (4,901) Salaried post-65 healthcare settlement (G) — 1,704 Canadian Auto Workers labor contract (H) — 340 American Axle (I) — 197 Gain on sales of investments (J) — (98) 2,611 12,590
Tax related: Valuation allowance on net deferred tax
assets (K) 1,056 1,450 Equity Income/Minority Interest:
Equity investment impairments (L) 83 83 Minority interest effects (M) (49) (49) 34 34 Total Adjustments $ 3,701 $ 6.06 $ 14,074 $ 24.32
ADJUSTED Adjusted Loss – Basic and Diluted * $ (5,895) $ (9.65) $ (16,786) $ (29.00)
* See average shares outstanding on page 16.

11
General Motors Corporation List of Special Items
2008
(Unaudited) (A) Fourth quarter and year to date charges of $610 million were recorded for goodwill impairments as
follows: $154 million related to GMNA and $456 million related to GME. (B) Fourth quarter charges of $974 million were recorded for asset impairments as follows: GMNA, $412
million; GME, $497 million; LAAM, $27 million; and GMAP, $38 million. (C) Fourth quarter income of $5.6 billion representing our proportionate share of GMAC’s bond
extinguishment gain recorded related to its debt tender offer partially offset by impairment charges of $5.1 billion related to our investment in GMAC Common Membership Interests. Year to date impairment charges of $8.1 billion related to GM’s investment in GMAC’s Common and Preferred Membership Interests partially offset by the $5.6 billion bond extinguishment gain.
(D) Fourth quarter charges of $660 million and year to date charges of $4.8 billion were recorded for
increased liabilities under the Delphi-GM Settlement Agreements, primarily due to expectations of increased obligations and lower estimates of the expected amount of recoveries associated with the Delphi Benefit Guarantee Agreements.
(E) Relates to various restructuring initiatives and the 2008 Special Attrition Programs. Charges recorded
by region are as follows:
GMNA: Fourth quarter charges of $757 million and year to date charges of $6.0 billion were recorded in GMNA for additional wage and benefit costs related to announced capacity actions, plant idlings in the U.S. and Canada, Salaried Window Program and IUE-CWA pension related items. Year to date charges of $3.5 billion were recorded for pre-retirement and retirement pension and benefit incentives and cash buyouts for employees leaving under the 2008 Special Attrition Programs.
GME: Fourth quarter charges of $33 million and year to date charges of $264 million were recorded for separation programs, primarily in Belgium, France, Germany and the United Kingdom. GMAP: Year to date charges of $98 million were recorded for separation programs at GM Holden, Ltd. Corporate and Other: Fourth quarter and year to date charges of $110 million were recorded for additional wage and benefit costs related to the Salaried Window Program and IUE-CWA pension related items.
(F) Year to date gain of $4.9 billion for the accelerated recognition of unamortized net prior service credits due to the Settlement Agreement for the UAW hourly medical plan becoming effective in 2008.
(G) Settlement loss of $1.7 billion associated with the elimination of healthcare coverage for U.S. salaried
retirees over age 65 beginning January 1, 2009. The settlement loss was recorded for participants over age 65 at January 1, 2009 and considers the cost of the increased pension benefit provided to those affected participants to help offset the cost of Medicare and supplemental coverage.
(H) Year to date loss of $340 million due to a change in the estimate of the amortization period for pension
prior service costs related to the hourly defined benefit pension plan in Canada. In conjunction with the 2008 Canadian Auto Workers (CAW) labor agreement, it was determined that the three year contractual life of the labor agreement is a better reflection of the period of future economic benefit for the collectively bargained hourly pension plans.
(I) Year to date charge of $197 million due to GM’s agreement to provide upfront support to American
Axle to end the work stoppage that affected approximately 30 GM plants in North America. GM’s support partially funds American Axle’s costs associated with UAW employee buyouts, early retirements and buydowns.
12
General Motors Corporation
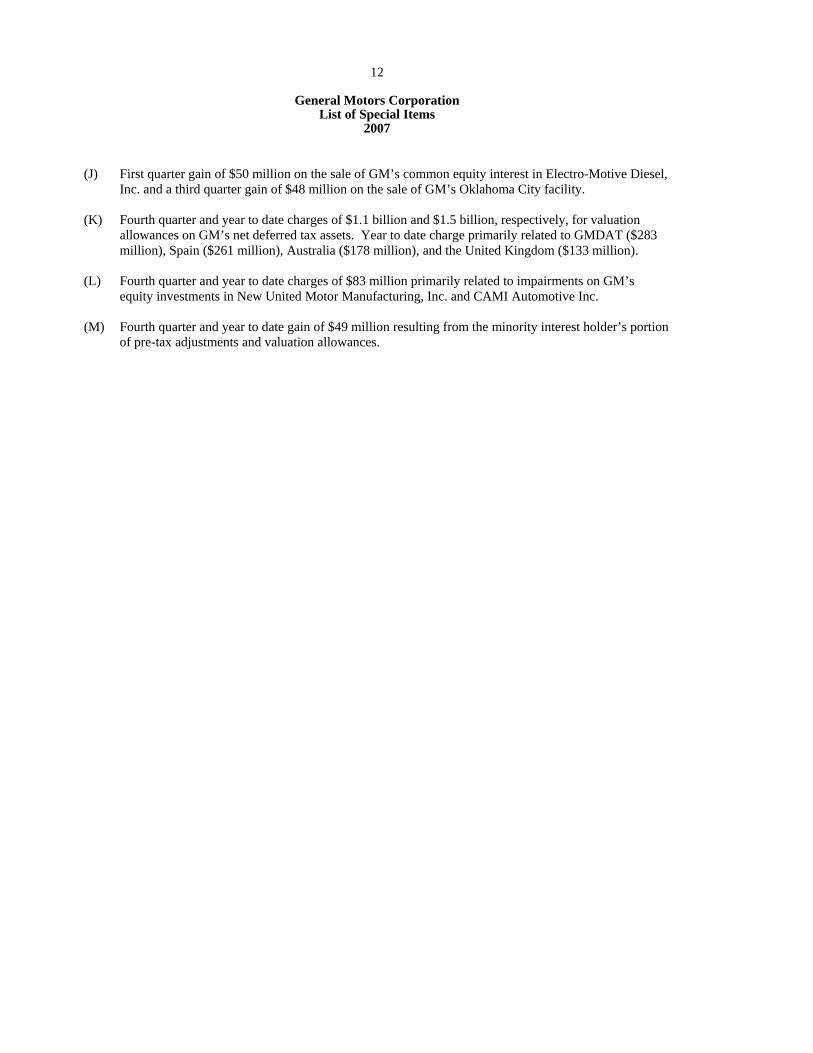
List of Special Items 2007
(J) First quarter gain of $50 million on the sale of GM’s common equity interest in Electro-Motive Diesel,
Inc. and a third quarter gain of $48 million on the sale of GM’s Oklahoma City facility.
(K) Fourth quarter and year to date charges of $1.1 billion and $1.5 billion, respectively, for valuation allowances on GM’s net deferred tax assets. Year to date charge primarily related to GMDAT ($283 million), Spain ($261 million), Australia ($178 million), and the United Kingdom ($133 million).
(L) Fourth quarter and year to date charges of $83 million primarily related to impairments on GM’s
equity investments in New United Motor Manufacturing, Inc. and CAMI Automotive Inc. (M) Fourth quarter and year to date gain of $49 million resulting from the minority interest holder’s portion
of pre-tax adjustments and valuation allowances.
13
General Motors Corporation List of Special Items
2007
(Dollars in millions except per share amounts) (Unaudited)
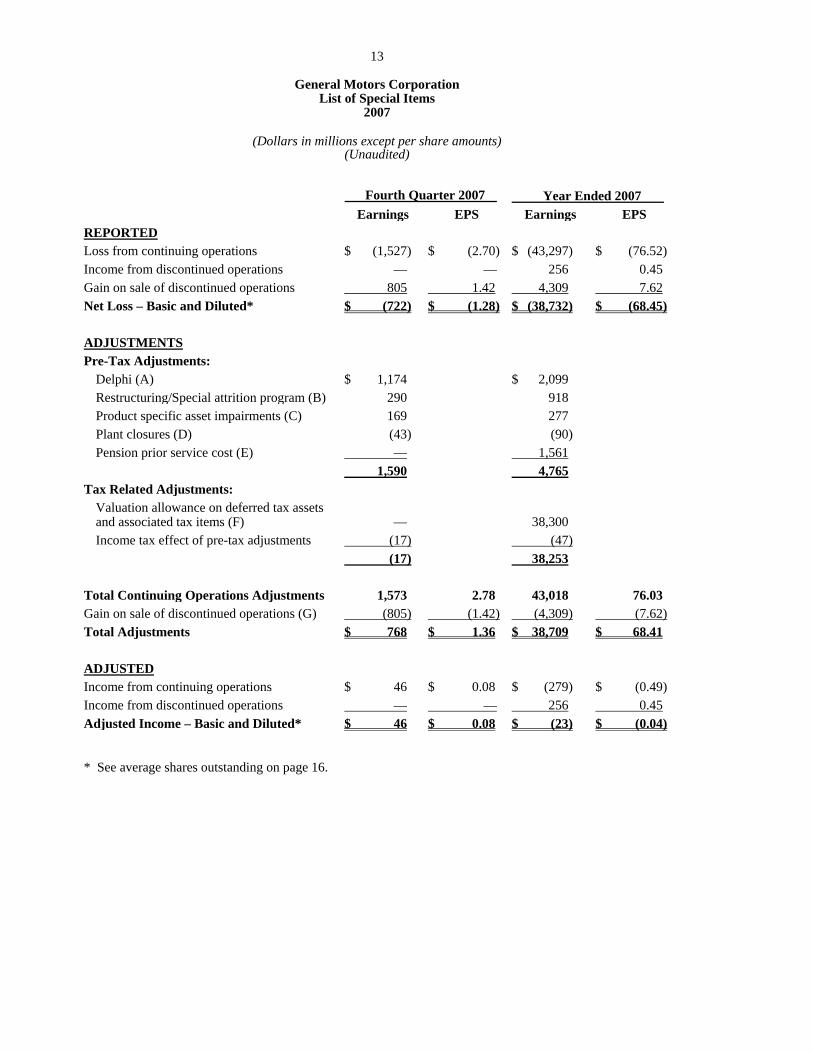
Fourth Quarter 2007 Year Ended 2007 Earnings EPS Earnings EPS REPORTED Loss from continuing operations $ (1,527) $ (2.70) $ (43,297) $ (76.52) Income from discontinued operations — — 256 0.45Gain on sale of discontinued operations 805 1.42 4,309 7.62 Net Loss – Basic and Diluted* $ (722) $ (1.28) $ (38,732) $ (68.45) ADJUSTMENTS Pre-Tax Adjustments:
Delphi (A) $ 1,174 $ 2,099 Restructuring/Special attrition program (B) 290 918 Product specific asset impairments (C) 169 277 Plant closures (D) (43) (90) Pension prior service cost (E) — 1,561 1,590 4,765
Tax Related Adjustments: Valuation allowance on deferred tax assets and associated tax items (F) — 38,300 Income tax effect of pre-tax adjustments (17) (47)
(17) 38,253 Total Continuing Operations Adjustments 1,573 2.78 43,018 76.03Gain on sale of discontinued operations (G) (805) (1.42) (4,309) (7.62)Total Adjustments $ 768 $ 1.36 $ 38,709 $ 68.41 ADJUSTED Income from continuing operations $ 46 $ 0.08 $ (279) $ (0.49) Income from discontinued operations — — 256 0.45 Adjusted Income – Basic and Diluted* $ 46 $ 0.08 $ (23) $ (0.04) * See average shares outstanding on page 16.
14
General Motors Corporation List of Special Items
2007
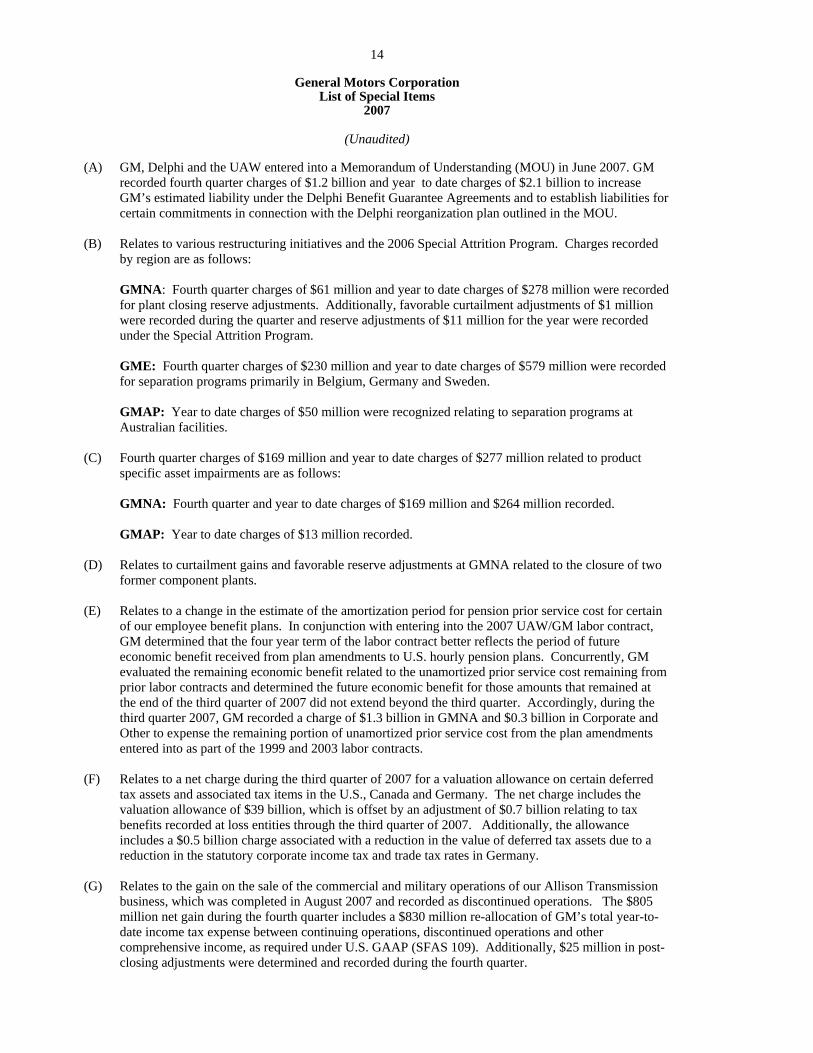
(Unaudited) (A) GM, Delphi and the UAW entered into a Memorandum of Understanding (MOU) in June 2007. GM
recorded fourth quarter charges of $1.2 billion and year to date charges of $2.1 billion to increase GM’s estimated liability under the Delphi Benefit Guarantee Agreements and to establish liabilities for certain commitments in connection with the Delphi reorganization plan outlined in the MOU.
(B) Relates to various restructuring initiatives and the 2006 Special Attrition Program. Charges recorded
by region are as follows:
GMNA: Fourth quarter charges of $61 million and year to date charges of $278 million were recorded for plant closing reserve adjustments. Additionally, favorable curtailment adjustments of $1 million were recorded during the quarter and reserve adjustments of $11 million for the year were recorded under the Special Attrition Program.
GME: Fourth quarter charges of $230 million and year to date charges of $579 million were recorded for separation programs primarily in Belgium, Germany and Sweden.
GMAP: Year to date charges of $50 million were recognized relating to separation programs at
Australian facilities. (C) Fourth quarter charges of $169 million and year to date charges of $277 million related to product
specific asset impairments are as follows:
GMNA: Fourth quarter and year to date charges of $169 million and $264 million recorded. GMAP: Year to date charges of $13 million recorded.
(D) Relates to curtailment gains and favorable reserve adjustments at GMNA related to the closure of two former component plants.
(E) Relates to a change in the estimate of the amortization period for pension prior service cost for certain
of our employee benefit plans. In conjunction with entering into the 2007 UAW/GM labor contract, GM determined that the four year term of the labor contract better reflects the period of future economic benefit received from plan amendments to U.S. hourly pension plans. Concurrently, GM evaluated the remaining economic benefit related to the unamortized prior service cost remaining from prior labor contracts and determined the future economic benefit for those amounts that remained at the end of the third quarter of 2007 did not extend beyond the third quarter. Accordingly, during the third quarter 2007, GM recorded a charge of $1.3 billion in GMNA and $0.3 billion in Corporate and Other to expense the remaining portion of unamortized prior service cost from the plan amendments entered into as part of the 1999 and 2003 labor contracts.
(F) Relates to a net charge during the third quarter of 2007 for a valuation allowance on certain deferred
tax assets and associated tax items in the U.S., Canada and Germany. The net charge includes the valuation allowance of $39 billion, which is offset by an adjustment of $0.7 billion relating to tax benefits recorded at loss entities through the third quarter of 2007. Additionally, the allowance includes a $0.5 billion charge associated with a reduction in the value of deferred tax assets due to a reduction in the statutory corporate income tax and trade tax rates in Germany.
(G) Relates to the gain on the sale of the commercial and military operations of our Allison Transmission
business, which was completed in August 2007 and recorded as discontinued operations. The $805 million net gain during the fourth quarter includes a $830 million re-allocation of GM’s total year-to-date income tax expense between continuing operations, discontinued operations and other comprehensive income, as required under U.S. GAAP (SFAS 109). Additionally, $25 million in post-closing adjustments were determined and recorded during the fourth quarter.
15
General Motors Corporation
Summary Corporate Financial Results
(Dollars in millions except per share amounts) (Unaudited)
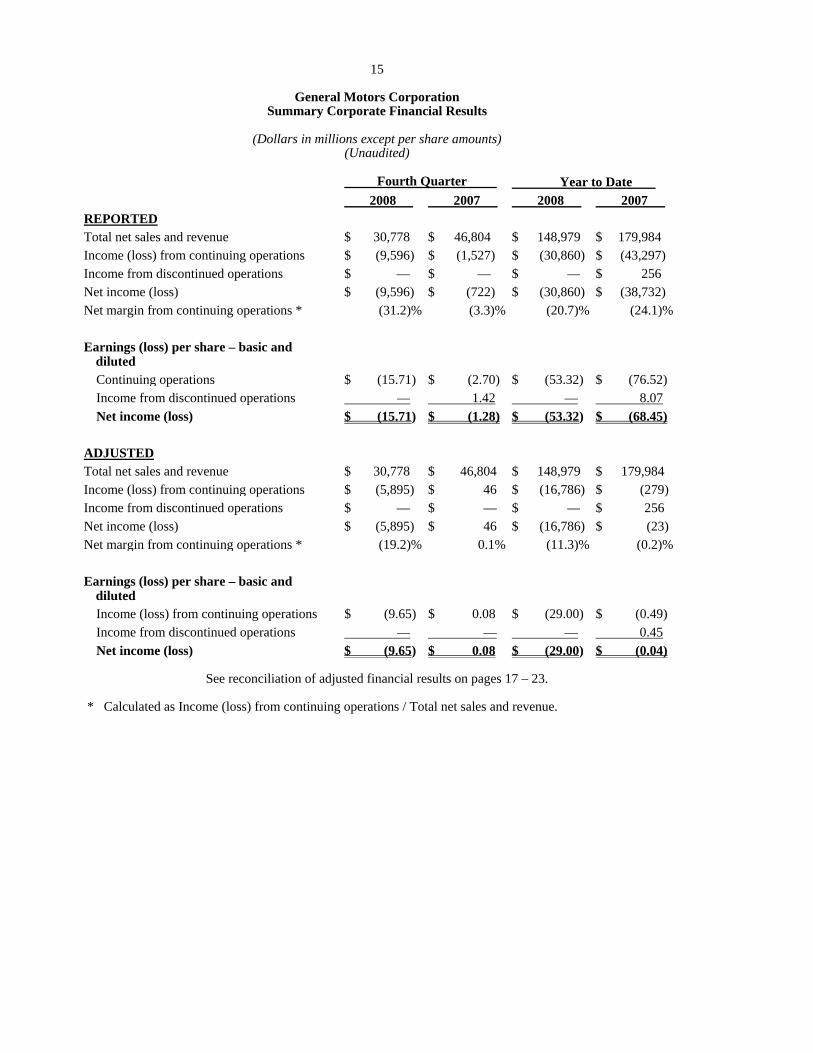
Fourth Quarter Year to Date 2008 2007 2008 2007 REPORTED Total net sales and revenue $ 30,778 $ 46,804 $ 148,979 $ 179,984Income (loss) from continuing operations $ (9,596) $ (1,527) $ (30,860) $ (43,297)Income from discontinued operations $ — $ — $ — $ 256Net income (loss) $ (9,596) $ (722) $ (30,860) $ (38,732)Net margin from continuing operations * (31.2)% (3.3)% (20.7)% (24.1)% Earnings (loss) per share – basic and
diluted Continuing operations $ (15.71) $ (2.70) $ (53.32) $ (76.52) Income from discontinued operations — 1.42 — 8.07 Net income (loss) $ (15.71) $ (1.28) $ (53.32) $ (68.45) ADJUSTED Total net sales and revenue $ 30,778 $ 46,804 $ 148,979 $ 179,984Income (loss) from continuing operations $ (5,895) $ 46 $ (16,786) $ (279)Income from discontinued operations $ — $ — $ — $ 256Net income (loss) $ (5,895) $ 46 $ (16,786) $ (23)Net margin from continuing operations * (19.2)% 0.1% (11.3)% (0.2)% Earnings (loss) per share – basic and
diluted Income (loss) from continuing operations $ (9.65) $ 0.08 $ (29.00) $ (0.49) Income from discontinued operations — — — 0.45 Net income (loss) $ (9.65) $ 0.08 $ (29.00) $ (0.04)
See reconciliation of adjusted financial results on pages 17 – 23.
* Calculated as Income (loss) from continuing operations / Total net sales and revenue.
16
General Motors Corporation Summary Corporate Financial Results
(Unaudited)
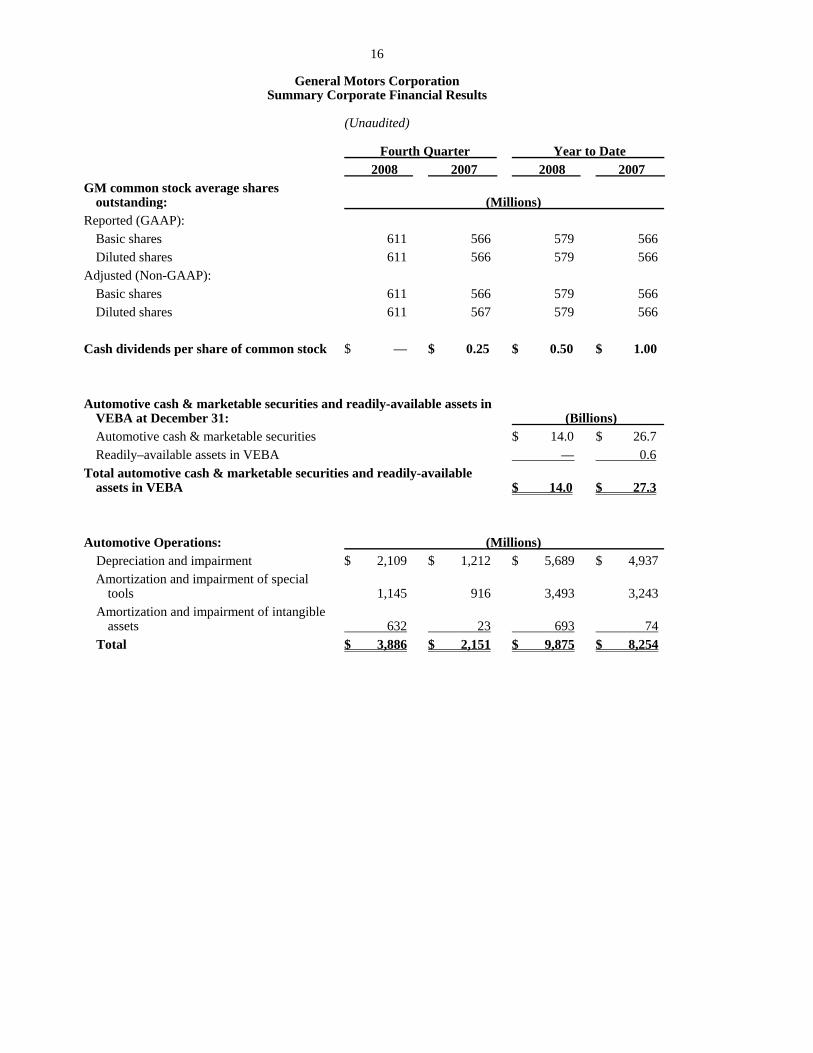
Fourth Quarter Year to Date 2008 2007 2008 2007 GM common stock average shares
outstanding: (Millions)Reported (GAAP):
Basic shares 611 566 579 566Diluted shares 611 566 579 566
Adjusted (Non-GAAP): Basic shares 611 566 579 566Diluted shares 611 567 579 566
Cash dividends per share of common stock $ — $ 0.25 $ 0.50 $ 1.00 Automotive cash & marketable securities and readily-available assets in
VEBA at December 31: (Billions) Automotive cash & marketable securities $ 14.0 $ 26.7Readily–available assets in VEBA — 0.6
Total automotive cash & marketable securities and readily-available assets in VEBA $ 14.0 $ 27.3
Automotive Operations: (Millions)
Depreciation and impairment $ 2,109 $ 1,212 $ 5,689 $ 4,937Amortization and impairment of special
tools 1,145 916 3,493 3,243 Amortization and impairment of intangible
assets 632 23 693 74 Total $ 3,886 $ 2,151 $ 9,875 $ 8,254

17
General Motors Corporation Summary Corporate Financial Results
(Dollars in millions)
(Unaudited)
Fourth Quarter 2008 and 2007
Reported Special Items Adjusted 2008 2007 2008 2007 2008 2007 Net sales and revenue:
GMNA $ 19,280 $ 28,121 $ — $ — $ 19,280 $ 28,121GME 6,418 10,710 — — 6,418 10,710GMLAAM 4,707 6,040 — — 4,707 6,040GMAP 2,608 5,342 — — 2,608 5,342Auto Elimination (a) (2,401) (3,695) — — (2,401) (3,695)Total GMA 30,612 46,518 — — 30,612 46,518Corporate & Other — — — — — —Total Auto & Other 30,612 46,518 — — 30,612 46,518GMAC — — — — — —Other Financing 166 286 — — 166 286Total Financing 166 286 — — 166 286
Total $ 30,778 $ 46,804 $ — $ — $ 30,778 $ 46,804 Income (loss) from continuing operations before
income taxes, other equity income and minority interests: GMNA $ (3,390) $ (1,221) $ 1,323 $ 192 $ (2,067) $ (1,029)GME (1,938) (449) 986 230 (952) (219)GMLAAM (171) 424 27 — (144) 424GMAP (921) 13 38 — (883) 13Auto Elimination (a) 103 (24) — — 103 (24)Total GMA (6,317) (1,257) 2,374 422 (3,943) (835)Corporate & Other (a) (1,086) (1,652) 770 1,168 (316) (484)Total Auto & Other (7,403) (2,909) 3,144 1,590 (4,259) (1,319)GMAC (1,406) (394) (533) — (1,939) (394)Other Financing (a) 18 94 — — 18 94Total Financing (1,388) (300) (533) — (1,921) (300)
Total $ (8,791) $ (3,209) $ 2,611 $ 1,590 $ (6,180) $ (1,619)
See footnotes on page 26.
18
General Motors Corporation Summary Corporate Financial Results
(Dollars in millions)
(Unaudited)
Fourth Quarter 2008 and 2007
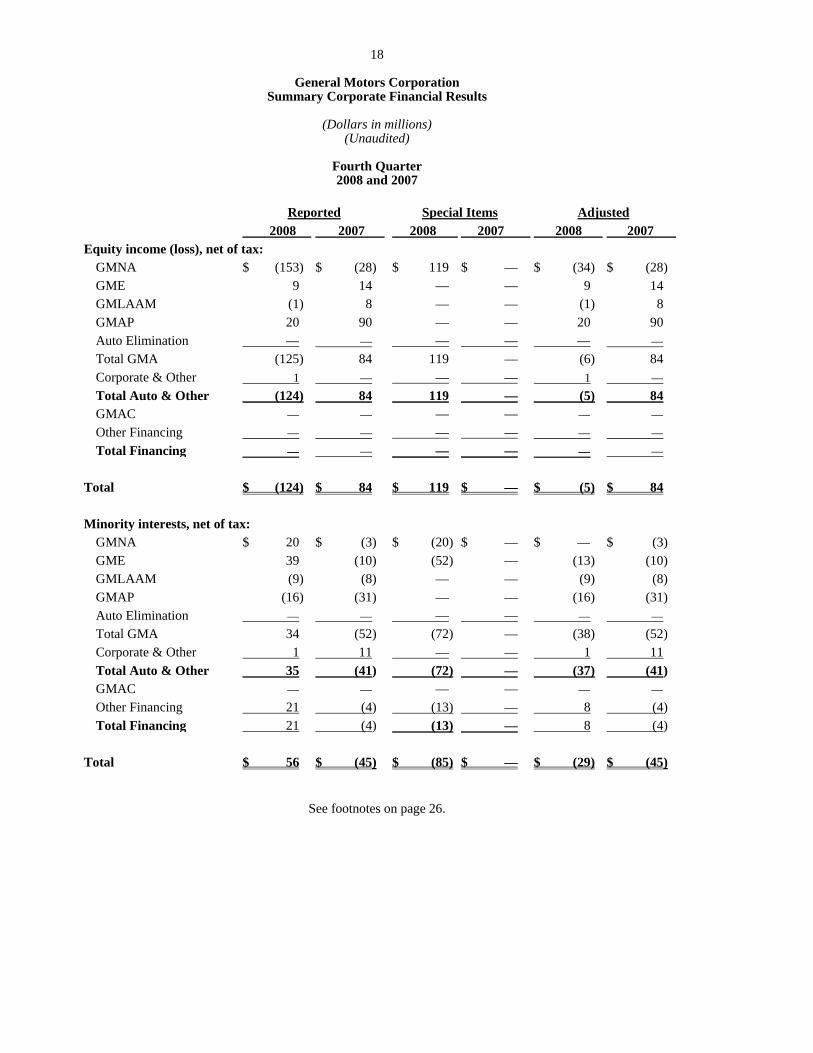
Reported Special Items Adjusted 2008 2007 2008 2007 2008 2007 Equity income (loss), net of tax:
GMNA $ (153) $ (28) $ 119 $ — $ (34) $ (28)GME 9 14 — — 9 14GMLAAM (1) 8 — — (1) 8GMAP 20 90 — — 20 90Auto Elimination — — — — — —Total GMA (125) 84 119 — (6) 84Corporate & Other 1 — — — 1 —Total Auto & Other (124) 84 119 — (5) 84GMAC — — — — — —Other Financing — — — — — —Total Financing — — — — — —
Total $ (124) $ 84 $ 119 $ — $ (5) $ 84 Minority interests, net of tax:
GMNA $ 20 $ (3) $ (20) $ — $ — $ (3)GME 39 (10) (52) — (13) (10)GMLAAM (9) (8) — — (9) (8)GMAP (16) (31) — — (16) (31)Auto Elimination — — — — — —Total GMA 34 (52) (72) — (38) (52)Corporate & Other 1 11 — — 1 11Total Auto & Other 35 (41) (72) — (37) (41)GMAC — — — — — —Other Financing 21 (4) (13) — 8 (4)Total Financing 21 (4) (13) — 8 (4)
Total $ 56 $ (45) $ (85) $ — $ (29) $ (45)
See footnotes on page 26.
19
General Motors Corporation Summary Corporate Financial Results
(Dollars in millions)
(Unaudited)
Fourth Quarter 2008 and 2007
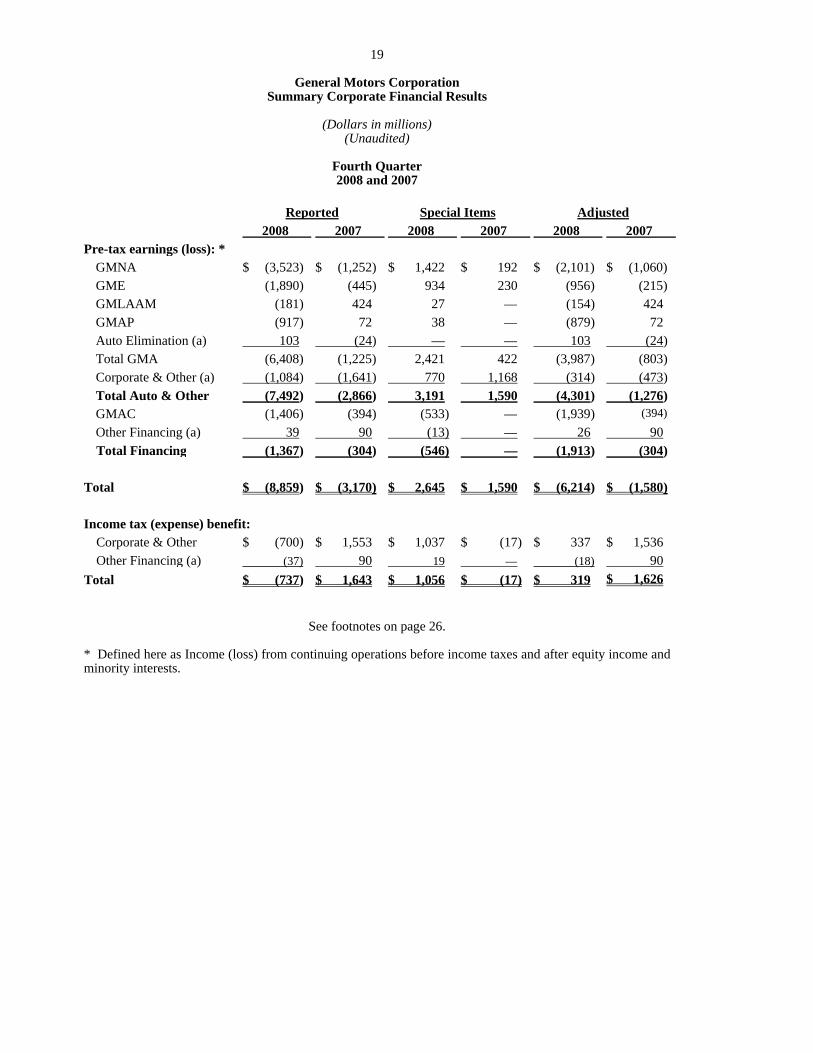
Reported Special Items Adjusted 2008 2007 2008 2007 2008 2007 Pre-tax earnings (loss): *
GMNA $ (3,523) $ (1,252) $ 1,422 $ 192 $ (2,101) $ (1,060)GME (1,890) (445) 934 230 (956) (215)GMLAAM (181) 424 27 — (154) 424GMAP (917) 72 38 — (879) 72Auto Elimination (a) 103 (24) — — 103 (24)Total GMA (6,408) (1,225) 2,421 422 (3,987) (803)Corporate & Other (a) (1,084) (1,641) 770 1,168 (314) (473)Total Auto & Other (7,492) (2,866) 3,191 1,590 (4,301) (1,276)GMAC (1,406) (394) (533) — (1,939) (394) Other Financing (a) 39 90 (13) — 26 90 Total Financing (1,367) (304) (546) — (1,913) (304)
Total $ (8,859) $ (3,170) $ 2,645 $ 1,590 $ (6,214) $ (1,580) Income tax (expense) benefit: Corporate & Other $ (700) $ 1,553 $ 1,037 $ (17) $ 337 $ 1,536 Other Financing (a) (37) 90 19 — (18) 90Total $ (737) $ 1,643 $ 1,056 $ (17) $ 319 $ 1,626
See footnotes on page 26.
* Defined here as Income (loss) from continuing operations before income taxes and after equity income and minority interests.
20
General Motors Corporation Summary Corporate Financial Results
(Dollars in millions)
(Unaudited)
Year to Date 2008 and 2007
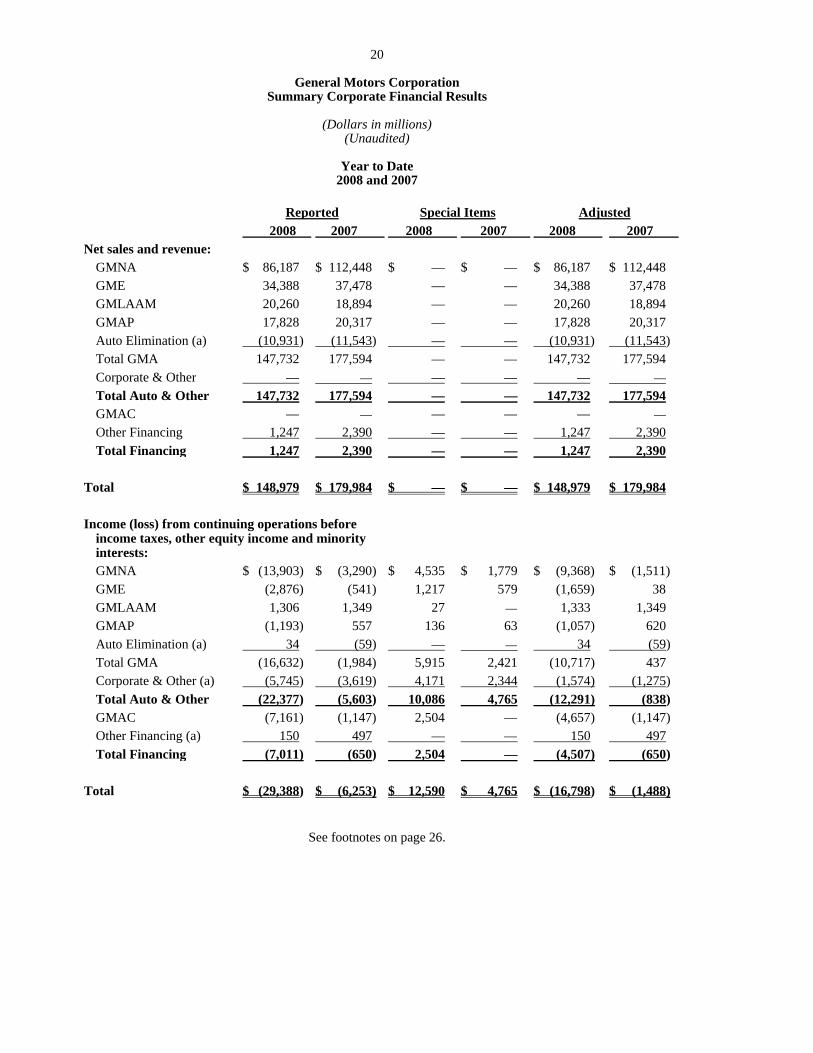
Reported Special Items Adjusted 2008 2007 2008 2007 2008 2007 Net sales and revenue:
GMNA $ 86,187 $ 112,448 $ — $ — $ 86,187 $ 112,448GME 34,388 37,478 — — 34,388 37,478GMLAAM 20,260 18,894 — — 20,260 18,894GMAP 17,828 20,317 — — 17,828 20,317Auto Elimination (a) (10,931) (11,543) — — (10,931) (11,543)Total GMA 147,732 177,594 — — 147,732 177,594Corporate & Other — — — — — —Total Auto & Other 147,732 177,594 — — 147,732 177,594GMAC — — — — — —Other Financing 1,247 2,390 — — 1,247 2,390Total Financing 1,247 2,390 — — 1,247 2,390
Total $ 148,979 $ 179,984 $ — $ — $ 148,979 $ 179,984 Income (loss) from continuing operations before
income taxes, other equity income and minority interests: GMNA $ (13,903) $ (3,290) $ 4,535 $ 1,779 $ (9,368) $ (1,511)GME (2,876) (541) 1,217 579 (1,659) 38GMLAAM 1,306 1,349 27 — 1,333 1,349GMAP (1,193) 557 136 63 (1,057) 620Auto Elimination (a) 34 (59) — — 34 (59)Total GMA (16,632) (1,984) 5,915 2,421 (10,717) 437Corporate & Other (a) (5,745) (3,619) 4,171 2,344 (1,574) (1,275)Total Auto & Other (22,377) (5,603) 10,086 4,765 (12,291) (838)GMAC (7,161) (1,147) 2,504 — (4,657) (1,147)Other Financing (a) 150 497 — — 150 497Total Financing (7,011) (650) 2,504 — (4,507) (650)
Total $ (29,388) $ (6,253) $ 12,590 $ 4,765 $ (16,798) $ (1,488)
See footnotes on page 26.
21
General Motors Corporation Summary Corporate Financial Results
(Dollars in millions)
(Unaudited)
Year to Date 2008 and 2007
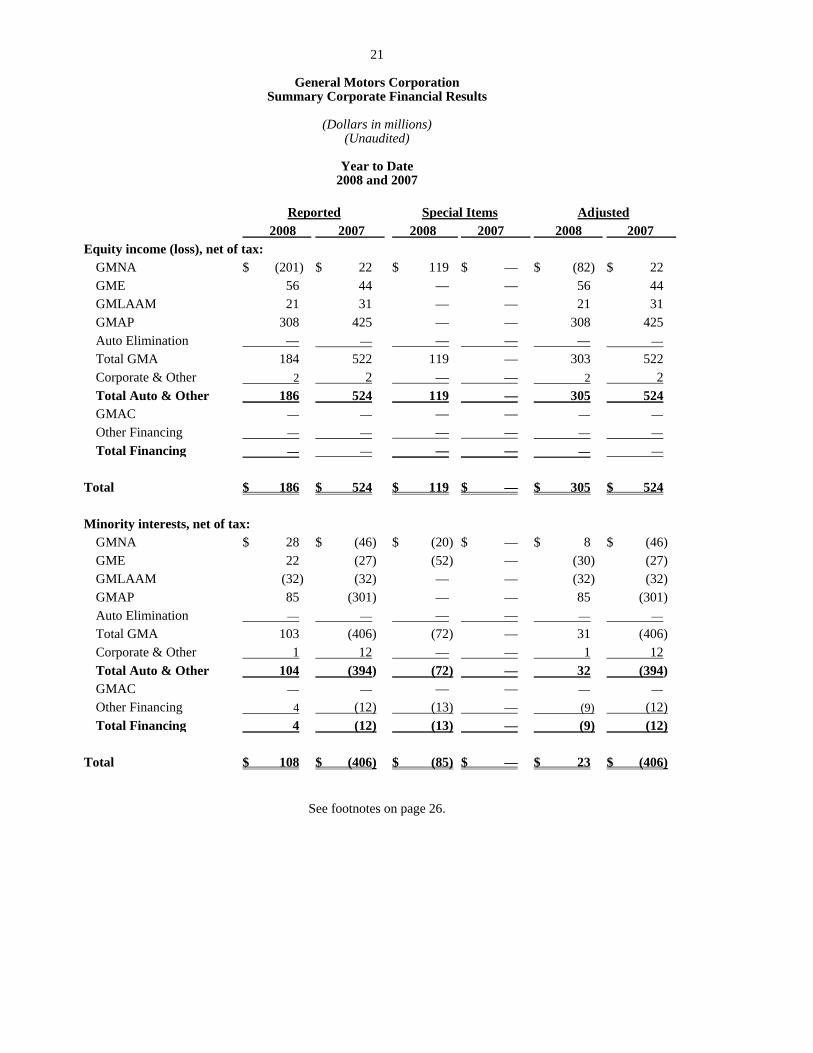
Reported Special Items Adjusted 2008 2007 2008 2007 2008 2007 Equity income (loss), net of tax:
GMNA $ (201) $ 22 $ 119 $ — $ (82) $ 22GME 56 44 — — 56 44GMLAAM 21 31 — — 21 31GMAP 308 425 — — 308 425Auto Elimination — — — — — —Total GMA 184 522 119 — 303 522Corporate & Other 2 2 — — 2 2Total Auto & Other 186 524 119 — 305 524GMAC — — — — — —Other Financing — — — — — —Total Financing — — — — — —
Total $ 186 $ 524 $ 119 $ — $ 305 $ 524 Minority interests, net of tax:
GMNA $ 28 $ (46) $ (20) $ — $ 8 $ (46)GME 22 (27) (52) — (30) (27)GMLAAM (32) (32) — — (32) (32)GMAP 85 (301) — — 85 (301)Auto Elimination — — — — — —Total GMA 103 (406) (72) — 31 (406)Corporate & Other 1 12 — — 1 12Total Auto & Other 104 (394) (72) — 32 (394)GMAC — — — — — —Other Financing 4 (12) (13) — (9) (12)Total Financing 4 (12) (13) — (9) (12)
Total $ 108 $ (406) $ (85) $ — $ 23 $ (406)
See footnotes on page 26.

22
General Motors Corporation Summary Corporate Financial Results
(Dollars in millions)
(Unaudited)
Year to Date 2008 and 2007
Reported Special Items Adjusted 2008 2007 2008 2007 2008 2007 Pre-tax earnings (loss): *
GMNA $ (14,076) $ (3,314) $ 4,634 $ 1,779 $ (9,442) $ (1,535)GME (2,798) (524) 1,165 579 (1,633) 55GMLAAM 1,295 1,348 27 — 1,322 1,348GMAP (800) 681 136 63 (664) 744Auto Elimination (a) 34 (59) — — 34 (59)Total GMA (16,345) (1,868) 5,962 2,421 (10,383) 553Corporate & Other (a) (5,742) (3,605) 4,171 2,344 (1,571) (1,261)Total Auto & Other (22,087) (5,473) 10,133 4,765 (11,954) (708)GMAC (7,161) (1,147) 2,504 — (4,657) (1,147)Other Financing (a) 154 485 (13) — 141 485 Total Financing (7,007) (662) 2,491 — (4,516) (662)
Total $ (29,094) $ (6,135) $ 12,624 $ 4,765 $ (16,470) $ (1,370) Income tax (expense) benefit: Corporate & Other $ (2,458) $ (37,129) $ 1,431 $ 38,130 $ (1,027) $ 1,001 Other Financing (a) 692 (33) 19 123 711 90Total $ (1,766) $ (37,162) $ 1,450 $ 38,253 $ (316) $ 1,091
See footnotes on page 26.
* Defined here as Income (loss) from continuing operations before income taxes and after equity income and minority interests.
23
General Motors Corporation Summary Corporate Financial Results
(Dollars in billions)
(Unaudited)
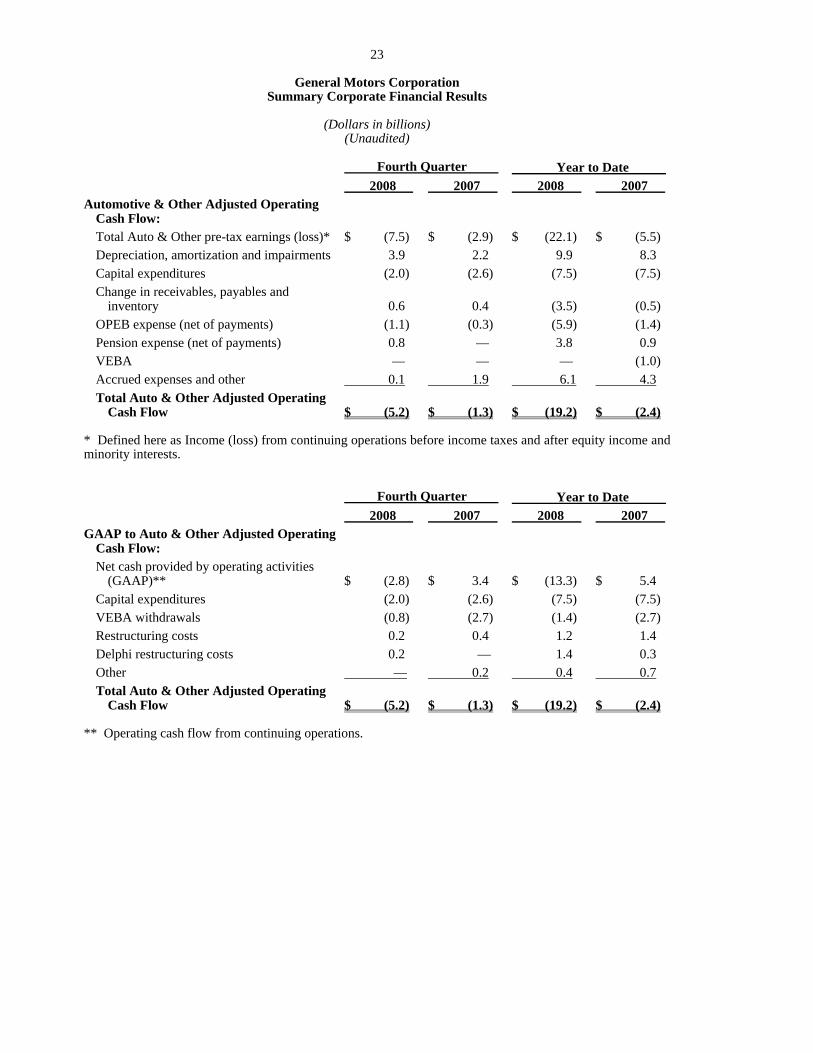
Fourth Quarter Year to Date 2008 2007 2008 2007 Automotive & Other Adjusted Operating
Cash Flow: Total Auto & Other pre-tax earnings (loss)* $ (7.5) $ (2.9) $ (22.1) $ (5.5)Depreciation, amortization and impairments 3.9 2.2 9.9 8.3Capital expenditures (2.0) (2.6) (7.5) (7.5)Change in receivables, payables and
inventory 0.6 0.4 (3.5) (0.5)OPEB expense (net of payments) (1.1) (0.3) (5.9) (1.4)Pension expense (net of payments) 0.8 — 3.8 0.9VEBA — — — (1.0)Accrued expenses and other 0.1 1.9 6.1 4.3Total Auto & Other Adjusted Operating
Cash Flow $ (5.2) $ (1.3) $ (19.2) $ (2.4) * Defined here as Income (loss) from continuing operations before income taxes and after equity income and minority interests.
Fourth Quarter Year to Date 2008 2007 2008 2007 GAAP to Auto & Other Adjusted Operating
Cash Flow: Net cash provided by operating activities
(GAAP)** $ (2.8) $ 3.4 $ (13.3) $ 5.4Capital expenditures (2.0) (2.6) (7.5) (7.5)VEBA withdrawals (0.8) (2.7) (1.4) (2.7)Restructuring costs 0.2 0.4 1.2 1.4Delphi restructuring costs 0.2 — 1.4 0.3Other — 0.2 0.4 0.7Total Auto & Other Adjusted Operating
Cash Flow $ (5.2) $ (1.3) $ (19.2) $ (2.4)
** Operating cash flow from continuing operations.
24
General Motors Corporation Operating Statistics
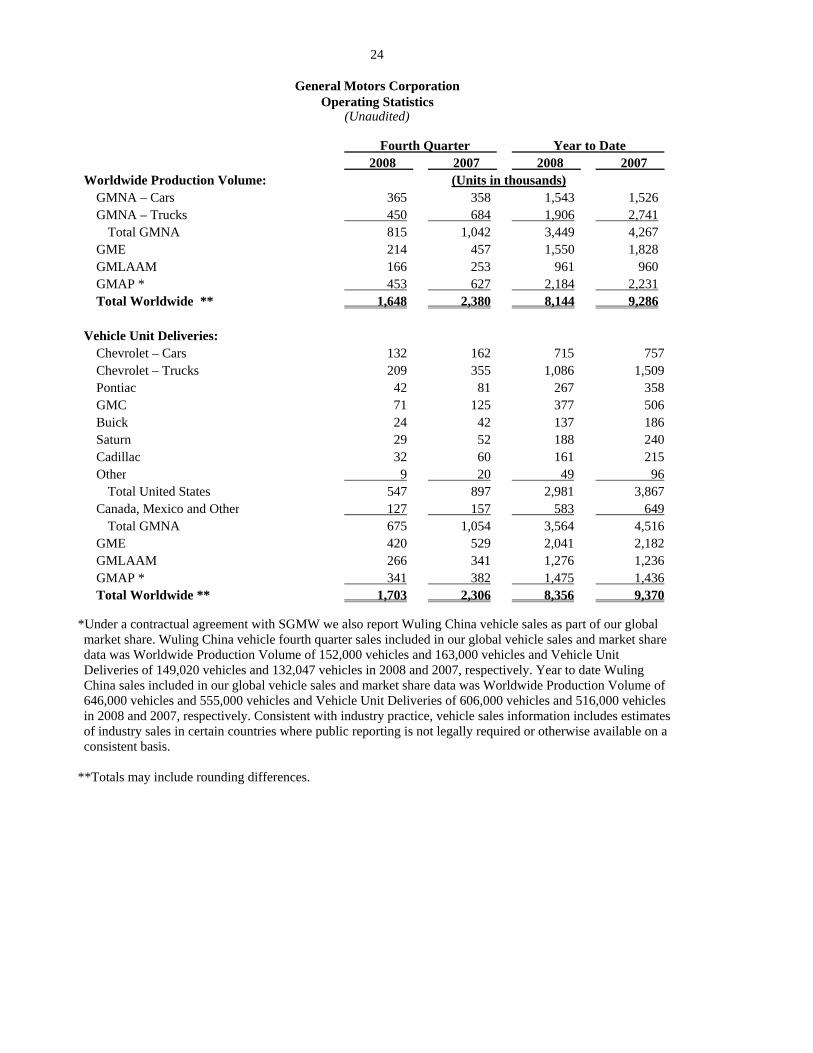
(Unaudited) Fourth Quarter Year to Date 2008 2007 2008 2007 Worldwide Production Volume: (Units in thousands) GMNA – Cars 365 358 1,543 1,526 GMNA – Trucks 450 684 1,906 2,741 Total GMNA 815 1,042 3,449 4,267 GME 214 457 1,550 1,828 GMLAAM 166 253 961 960 GMAP * 453 627 2,184 2,231 Total Worldwide ** 1,648 2,380 8,144 9,286 Vehicle Unit Deliveries: Chevrolet – Cars 132 162 715 757 Chevrolet – Trucks 209 355 1,086 1,509 Pontiac 42 81 267 358 GMC 71 125 377 506 Buick 24 42 137 186 Saturn 29 52 188 240 Cadillac 32 60 161 215 Other 9 20 49 96 Total United States 547 897 2,981 3,867 Canada, Mexico and Other 127 157 583 649 Total GMNA 675 1,054 3,564 4,516 GME 420 529 2,041 2,182 GMLAAM 266 341 1,276 1,236 GMAP * 341 382 1,475 1,436 Total Worldwide ** 1,703 2,306 8,356 9,370
*Under a contractual agreement with SGMW we also report Wuling China vehicle sales as part of our global market share. Wuling China vehicle fourth quarter sales included in our global vehicle sales and market share data was Worldwide Production Volume of 152,000 vehicles and 163,000 vehicles and Vehicle Unit Deliveries of 149,020 vehicles and 132,047 vehicles in 2008 and 2007, respectively. Year to date Wuling China sales included in our global vehicle sales and market share data was Worldwide Production Volume of 646,000 vehicles and 555,000 vehicles and Vehicle Unit Deliveries of 606,000 vehicles and 516,000 vehicles in 2008 and 2007, respectively. Consistent with industry practice, vehicle sales information includes estimates of industry sales in certain countries where public reporting is not legally required or otherwise available on a consistent basis.
**Totals may include rounding differences.

25
General Motors Corporation Operating Statistics
(Unaudited)
Fourth Quarter Year to Date 2008 2007 2008 2007 Market Share: (Units in thousands) United States – Cars 18.2% 19.0% 18.6% 19.7% United States – Trucks 24.6% 26.6% 25.6% 26.7% Total United States 21.6% 23.2% 22.1% 23.5% Total GMNA 21.0% 22.7% 21.5% 23.1% Total GME 9.1% 9.2% 9.3% 9.4% Total GMLAAM 16.2% 17.3% 17.1% 17.0% Total GMAP * 7.2% 7.3% 7.0% 6.9% Total Worldwide 12.0% 13.1% 12.4% 13.3% U.S. Retail/Fleet Mix (selling day adjusted): % Fleet Sales - Cars 45.6% 31.2% 34.8% 34.9% % Fleet Sales - Trucks 23.2% 19.6% 22.4% 20.5% Total Vehicles 32.2% 23.9% 27.6% 26.1% GMNA Capacity Utilization *** 72.1% 86.2% 74.7% 88.5%
***Two shift rated, annualized.

26
General Motors Corporation Operating Statistics
(Unaudited)
Fourth Quarter Year to Date 2008 2007 2008 2007 GMAC’s share of GM retail sales (U.S. only) Total consumer volume (retail and lease) as %
of retail 5% 43% 33% 45%SmartLease/SmartBuy as % of retail 0% 13% 11% 17% Worldwide Employment at December 31: (Thousands) United States – Hourly 62 78 United States – Salaried 29 32 Total United States 91 110 Canada, Mexico and Other 25 29 GMNA 116 139 GME 55 57 GMLAAM 35 34 GMAP 35 34 Other 2 2 Total GM 243 266 (Billions)Worldwide Payroll $ 3.8 $ 4.6 $ 16.8 $ 18.0 Footnotes: (a) Auto Eliminations, Corporate & Other and Other Financing include inter-company eliminations.

27
GENERAL MOTORS CORPORATION AND SUBSIDIARIES
CONDENSED CONSOLIDATED STATEMENTS OF OPERATIONS
(Dollars in millions, except per share amounts) (Unaudited)
Three Months Ended December 31, 2008 2007Net sales and revenue
Automotive sales ................................................................................................................ $ 30,612 $ 46,518Financial services and insurance revenue ........................................................................... 166 286Total net sales and revenue ................................................................................................ 30,778 46,804
Costs and expenses Automotive cost of sales .................................................................................................... 33,092 43,805Selling, general and administrative expense ....................................................................... 3,549 4,207Financial services and insurance expense .......................................................................... 202 301Other expenses ................................................................................................................... 1,271 1,174Total costs and expenses .................................................................................................... 38,114 49,487
Operating loss ................................................................................................................. (7,336) (2,683)Equity in loss of GMAC LLC (Note 9) ................................................................................. (1,406) (371)Automotive and other interest expense .................................................................................. (308) (664)Automotive interest income and other non-operating income, net ........................................ 259 509Loss from continuing operations before income taxes, equity income and minority
interests .............................................................................................................................. (8,791) (3,209)Income tax expense (benefit) ................................................................................................. 737 (1,643)Equity income (loss), net of tax ............................................................................................. (124) 84Minority interests, net of tax .................................................................................................. 56 (45)Loss from continuing operations ........................................................................................... (9,596) (1,527)Discontinued operations (Note 4)
Income from discontinued operations, net of tax ............................................................... — —Gain on sale of discontinued operations, net of tax............................................................ — 805Income from discontinued operations ................................................................................ — 805
Net loss .................................................................................................................................. $ (9,596) $ (722) Earnings (loss) per share, basic and diluted
Continuing operations ........................................................................................................ $ (15.71) $ (2.70)Discontinued operations ..................................................................................................... — 1.42Net loss per share basic and diluted ................................................................................... $ (15.71) $ (1.28)
Weighted-average common shares outstanding, basic and diluted (millions) ....................... 611 566 Cash dividends per share ....................................................................................................... $ — $ 0.25
28
GENERAL MOTORS CORPORATION AND SUBSIDIARIES
CONDENSED CONSOLIDATED STATEMENTS OF OPERATIONS
(Dollars in millions, except per share amounts) (Unaudited)
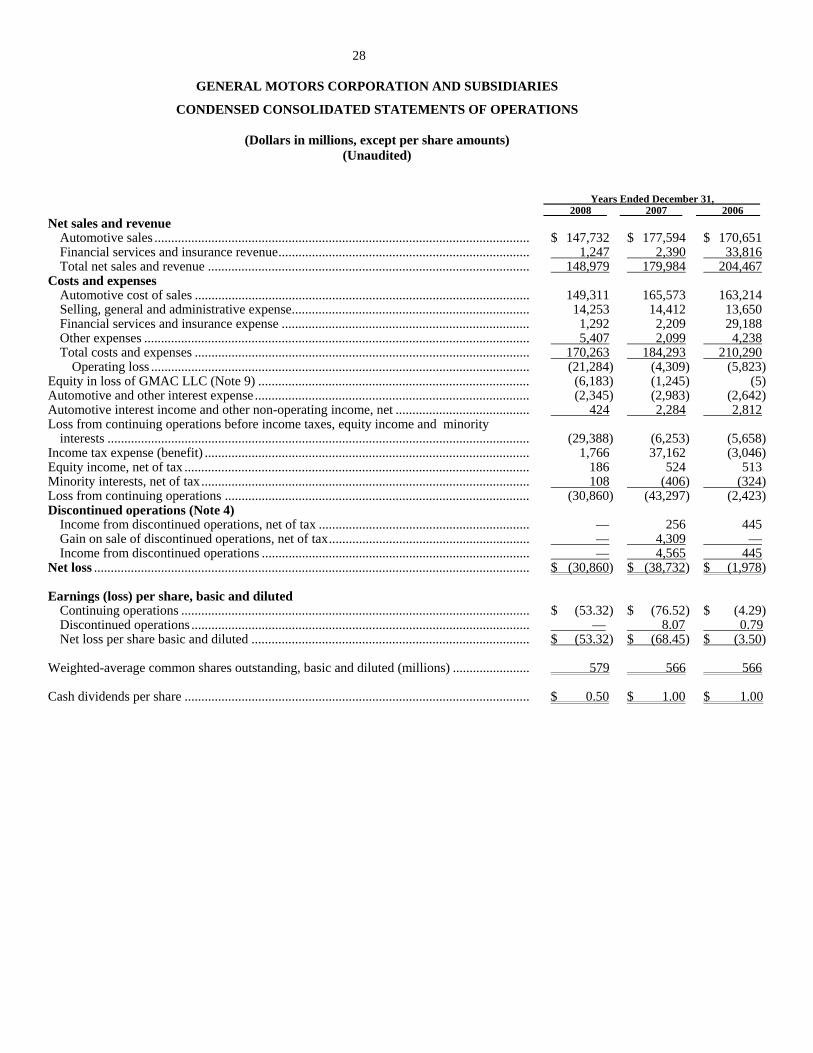
Years Ended December 31, 2008 2007 2006Net sales and revenue
Automotive sales ................................................................................................................ $ 147,732 $ 177,594 $ 170,651Financial services and insurance revenue ........................................................................... 1,247 2,390 33,816Total net sales and revenue ................................................................................................ 148,979 179,984 204,467
Costs and expenses Automotive cost of sales .................................................................................................... 149,311 165,573 163,214Selling, general and administrative expense ....................................................................... 14,253 14,412 13,650Financial services and insurance expense .......................................................................... 1,292 2,209 29,188Other expenses ................................................................................................................... 5,407 2,099 4,238Total costs and expenses .................................................................................................... 170,263 184,293 210,290
Operating loss ................................................................................................................. (21,284) (4,309) (5,823)Equity in loss of GMAC LLC (Note 9) ................................................................................. (6,183) (1,245) (5)Automotive and other interest expense .................................................................................. (2,345) (2,983) (2,642)Automotive interest income and other non-operating income, net ........................................ 424 2,284 2,812Loss from continuing operations before income taxes, equity income and minority
interests .............................................................................................................................. (29,388) (6,253) (5,658)Income tax expense (benefit) ................................................................................................. 1,766 37,162 (3,046)Equity income, net of tax ....................................................................................................... 186 524 513Minority interests, net of tax .................................................................................................. 108 (406) (324)Loss from continuing operations ........................................................................................... (30,860) (43,297) (2,423)Discontinued operations (Note 4)
Income from discontinued operations, net of tax ............................................................... — 256 445Gain on sale of discontinued operations, net of tax............................................................ — 4,309 —Income from discontinued operations ................................................................................ — 4,565 445
Net loss .................................................................................................................................. $ (30,860) $ (38,732) $ (1,978) Earnings (loss) per share, basic and diluted
Continuing operations ........................................................................................................ $ (53.32) $ (76.52) $ (4.29)Discontinued operations ..................................................................................................... — 8.07 0.79Net loss per share basic and diluted ................................................................................... $ (53.32) $ (68.45) $ (3.50)
Weighted-average common shares outstanding, basic and diluted (millions) ....................... 579 566 566 Cash dividends per share ....................................................................................................... $ 0.50 $ 1.00 $ 1.00
29
GENERAL MOTORS CORPORATION AND SUBSIDIARIES
CONDENSED CONSOLIDATED BALANCE SHEETS
(Dollars in millions) (Unaudited)
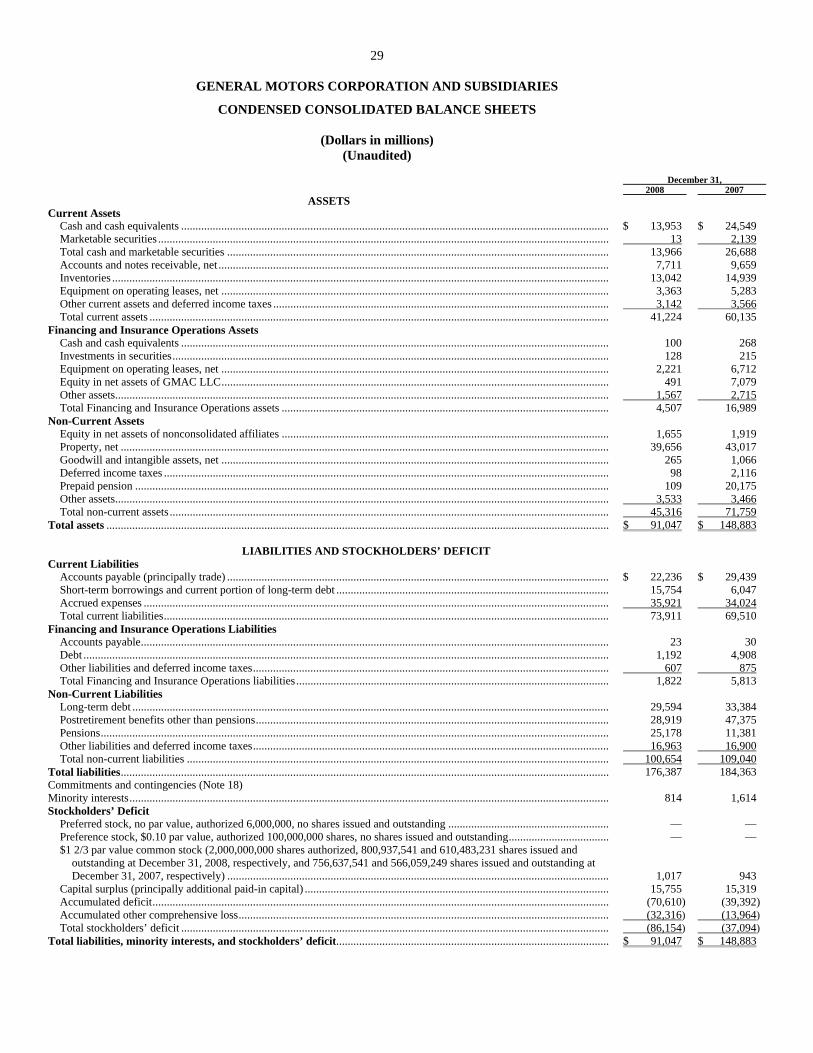
December 31, 2008 2007
ASSETSCurrent Assets
Cash and cash equivalents ..................................................................................................................................................... $ 13,953 $ 24,549 Marketable securities ............................................................................................................................................................. 13 2,139 Total cash and marketable securities ..................................................................................................................................... 13,966 26,688 Accounts and notes receivable, net ........................................................................................................................................ 7,711 9,659 Inventories ............................................................................................................................................................................. 13,042 14,939 Equipment on operating leases, net ....................................................................................................................................... 3,363 5,283 Other current assets and deferred income taxes ..................................................................................................................... 3,142 3,566 Total current assets ................................................................................................................................................................ 41,224 60,135
Financing and Insurance Operations Assets Cash and cash equivalents ..................................................................................................................................................... 100 268 Investments in securities ........................................................................................................................................................ 128 215 Equipment on operating leases, net ....................................................................................................................................... 2,221 6,712 Equity in net assets of GMAC LLC ....................................................................................................................................... 491 7,079 Other assets ............................................................................................................................................................................ 1,567 2,715 Total Financing and Insurance Operations assets .................................................................................................................. 4,507 16,989
Non-Current Assets Equity in net assets of nonconsolidated affiliates .................................................................................................................. 1,655 1,919 Property, net .......................................................................................................................................................................... 39,656 43,017 Goodwill and intangible assets, net ....................................................................................................................................... 265 1,066 Deferred income taxes ........................................................................................................................................................... 98 2,116 Prepaid pension ..................................................................................................................................................................... 109 20,175 Other assets ............................................................................................................................................................................ 3,533 3,466 Total non-current assets ......................................................................................................................................................... 45,316 71,759
Total assets ............................................................................................................................................................................... $ 91,047 $ 148,883
LIABILITIES AND STOCKHOLDERS’ DEFICIT Current Liabilities
Accounts payable (principally trade) ..................................................................................................................................... $ 22,236 $ 29,439 Short-term borrowings and current portion of long-term debt ............................................................................................... 15,754 6,047 Accrued expenses .................................................................................................................................................................. 35,921 34,024 Total current liabilities ........................................................................................................................................................... 73,911 69,510
Financing and Insurance Operations Liabilities Accounts payable ................................................................................................................................................................... 23 30 Debt ....................................................................................................................................................................................... 1,192 4,908 Other liabilities and deferred income taxes ............................................................................................................................ 607 875 Total Financing and Insurance Operations liabilities ............................................................................................................. 1,822 5,813
Non-Current Liabilities Long-term debt ...................................................................................................................................................................... 29,594 33,384 Postretirement benefits other than pensions ........................................................................................................................... 28,919 47,375 Pensions ................................................................................................................................................................................. 25,178 11,381 Other liabilities and deferred income taxes ............................................................................................................................ 16,963 16,900 Total non-current liabilities ................................................................................................................................................... 100,654 109,040
Total liabilities .......................................................................................................................................................................... 176,387 184,363 Commitments and contingencies (Note 18) Minority interests ....................................................................................................................................................................... 814 1,614 Stockholders’ Deficit
Preferred stock, no par value, authorized 6,000,000, no shares issued and outstanding ........................................................ — — Preference stock, $0.10 par value, authorized 100,000,000 shares, no shares issued and outstanding ................................... — — $1 2/3 par value common stock (2,000,000,000 shares authorized, 800,937,541 and 610,483,231 shares issued and
outstanding at December 31, 2008, respectively, and 756,637,541 and 566,059,249 shares issued and outstanding at December 31, 2007, respectively) ..................................................................................................................................... 1,017 943
Capital surplus (principally additional paid-in capital) .......................................................................................................... 15,755 15,319 Accumulated deficit ............................................................................................................................................................... (70,610) (39,392) Accumulated other comprehensive loss ................................................................................................................................. (32,316) (13,964) Total stockholders’ deficit ..................................................................................................................................................... (86,154) (37,094)
Total liabilities, minority interests, and stockholders’ deficit............................................................................................... $ 91,047 $ 148,883


