General Manual of Costing Tools
29
1 Adaptation developed by: Eng. Azucena Serrano Technical Assistant in Financial Sustainability Water For People Honduras [email protected] Eng. Maricela Rodriguez Associate in Honduras IRC rodriguez@ircwash.org Andres Gil Associate in Honduras IRC [email protected] General Manual of Costing Tools
Transcript of General Manual of Costing Tools

1
Adaptation developed by:
Eng. Azucena Serrano Technical Assistant in Financial Sustainability Water For People Honduras [email protected]
Eng. Maricela Rodriguez Associate in Honduras IRC [email protected]
Andres Gil Associate in Honduras IRC [email protected]
General Manual of Costing Tools

2
This manual is an adaptation of the document "Costing Tools for Municipal Level Water Services" by Smits, S, Schweitzer, R. and Ward, R., published in 2014, as a result of a consultancy between IRC and Aguaconsult financed with IDB-MIF fund and Water For People in Bolivia.
Revised by:
Stef Smits Coordinator Latin America Regional Program IRC [email protected]
Eng. Martin Rivera PTPS Coordinator [email protected]
Adaptation prepared by:
Ing. Azucena Serrano Technical Assistant in Financial Sustainability Water For People Honduras [email protected]
Ing. Maricela Rodriguez Associate in Honduras IRC [email protected]
Andres Gil Associate in Honduras IRC [email protected]

3
Table of Contents
Introduction ................................................................................................................................. 3
1.1 Objectives ............................................................................................................................. 4
Conceptual Framework ............................................................................................................... 5
2.1 Life Cycle Costs .................................................................................................................... 5
2.2 Relationship of Cost and Impact in Service Provision ........................................................... 6
2.3 Use of the Tools .................................................................................................................... 8
Costing Tools .............................................................................................................................. 9
3.1 Introduction to the Toolkit ..................................................................................................... 9
3.2 Summary of the Toolkit ...................................................................................................... 10
3.3 Asset Analysis .................................................................................................................... 11
3.4 Historical Investment .......................................................................................................... 13
3.5 AtWhatCost ........................................................................................................................ 14
3.6 Direct Support Costs .......................................................................................................... 19
3.7 Municipal Financial Sustainability Card ............................................................................. 21
References ................................................................................................................................ 24
Appendices ............................................................................................................................... 25
5.1 Appendix 1: Description of the Physical State of System Components .............................. 25
5.2 Appendix 2: Staff Profile Required for Implementation ....................................................... 25
5.3 Appendix 3: Tool Application Protocols ............................................................................. 26

4
Introduction Sustainable provision of drinking water service requires financial mechanisms to ensure it lasts Forever. Thus, the Government of Honduras, through the Financial Policy of the drinking water and sanitation sector, assigns a lot of responsibility to the municipalities to establish such mechanisms.
In this regard and in support of the municipalities, the Para Todos Por Siempre (PTPS) initiative has leveraged work developed in Bolivia by Water For People, IRC, and Aguaconsult, with funding support from the Inter-American Development Bank - Multilateral Investment Fund (IDB-MIF), in which a kit of costing tools was developed to improve understanding of the costs to reach Everyone Forever. These tools have been contextualized and are intended to be presented to the municipalities in this document.
After the adoption and application of these tools in Honduras, is it expected that municipalities can do the following:
- Budget for investments to reach Everyone: Knowing what they are investing in water and sanitation to understand how much they must budget to achieve their ambitions.
- Identify possible gaps in or risks to financial sustainability: Many studies and analyses indicate that not all operation and maintenance and replacement costs are adequately covered. Although it is true that communities, through tariffs, must cover recurring costs, in reality, they only collect enough for the operating costs and a portion of replacement costs, thus generating a financial gap. If this financial gap is not filled with other financial sources (such as the municipality), the sustainability of services is put at risk.
- Budgeting for support activities by the municipality: The municipalities must not only invest in the water infrastructure, but also support the Drinking Water and Sanitation Administration Boards (JAAPS, for the Spanish acronym) in their systems management activities. This includes activities such as technical assistance and monitoring, which must also be properly budgeted. In Diagram 1, the different costs and possible financial sources to maintain the water systems in the municipality are identified.
Diagram 1: Costs and Financial Sources to Maintain Municipal Water Systems
Municipal budget: taxes, government transfers
Tariffs
Municipal budget: taxes, government transfers
Municipality, government, NGOs,, donors, and development partners
Infrastructure development
and replacement
costs Technical support Costs
Institutional structure
costs Operation and maintenance costs

5
This document is an orientation guide on why, when, and how to use the tools.
1.1 Objectives
The main objective of the toolkit is to serve as a guide for municipalities to establish the level of probability where the municipality has sufficient financial sources to reach coverage in water and sanitation services that lasts forever, as well as estimating possible financial gaps in costs.
To reach this objective, the toolkit aims to: - Create background information and an analysis guide through the evaluation of existing
water infrastructure assets in the municipality, based on different risk areas such as age, physical condition, functionality, and level of service.
- Identify which communities and systems will require investment in the development of new systems, expansions, or replacements in the medium term (10 years).
- Estimate how much investment is required in the implementation of new systems, expansions, and replacements and optimize investments over time.
- Support in setting tariffs that cover operation and maintenance costs and a portion of asset replacement costs.
- Establish the difference between the ideal and current costs of municipal support for technical assistance, with an eye toward improving and maintaining the adequate service provision.
- Identify the financial possibility of reaching Everyone Forever at the municipal level.
Each tool presented below has its own objectives, but among all of them, the specific objectives mentioned above will be achieved and can serve as a guide for the Municipal Water and Sanitation Commissions (COMAS, for the Spanish acronym) in the preparation of the Municipal Strategic Plans for Water and Sanitation (PEMAS, for the Spanish acronym) and the Local Supervisory and Control Unit (USCL, for the Spanish acronym) in the setting of tariffs with the Water Boards.

6
Conceptual Framework
2.1 Life Cycle Costs
Life cycle costs (Diagram 2) refer to all costs for sustainable provision - that is, for an indefinite period - of water, sanitation, and hygiene services for a specific population. It refers to the costs of each phase in the life cycle of a service. Sustainable service provision requires financial mechanisms to ensure that replacement occurs and that there is the direct and indirect support necessary for the service to continue when the infrastructure reaches the end of its useful life. A distinction is made between the following categories of costs (Fonseca et al., 2013):
Initial investment cost: Capital invested in the construction of fixed assets, such as latrines, pipes, and tanks. This can be done in three ways: 1) initial construction of a new system where there was a system before, 2) extension of existing systems to neighborhoods or populations who had no prior service, and 3) improvement in the level of service (for example, adding a treatment plant, chlorination systems, etc.). In addition, it includes the initial costs of studies, mobilization of actors, establishment of a service provider and their training, as well as initial investments in water resource management, such as the purchase of land around the source or the costs of obtaining a permit or environmental license. Finally, it includes administrative or indirect costs related to the investment program.
Capital costs: Costs of obtaining financing for a program or project, including interest on loans, dividends, and opportunity costs.
Operation and maintenance costs. Labor costs, energy, chemicals, and materials to operate the service and routine maintenance, excluding major repairs or replacements. It also includes recurring administrative and legal costs, such as accounting costs or payments for environmental services. In the case of sanitation, it also includes the emptying of latrines.
Asset replacement costs: Cost of replacing a water or sanitation system in its entirety (known as replacement) or one or more components of a system, such as a tank or pipeline (known as rehabilitation). Ideally, this category of costs is equivalent to the depreciation of assets. Just as with the initial investment, it includes the administrative or indirect costs of replacement or rehabilitation programs.
Direct support costs: Spending on post-construction support. It includes technical assistance, re-training of the provider, monitoring, and water quality tests. It also includes the activities of the municipality's service authority, such as coordination and planning.
Indirect support costs: Support that is not specific to a program or project, and typically includes macro-level sectoral planning, policy development, and the development of general training materials.

7
Diagram 2: Project Cycle and Service Life Cycle
For purposes of estimating financial gaps at the municipal level, only initial investment costs and costs incurred for sustainability are considered, such as costs for operation and maintenance and direct support costs.
2.2 Relationship of Cost and Impact on Service Provision
When we talk about service levels, we refer to the characteristics that are expected from the provision of services, where the most common indicators are:
- Quantity: The average volume that the user receives daily. - Quality: Water quality parameters in accordance with those established and regulated by
the government. - Continuity: An indicator of the frequency with which water is received according to the
seasonality of the sources. - Coverage or accessibility: The percentage of the population that has access to water and
the ease with which they can access it, for example, expressed as the distance to travel to carry the water or the time a family spends in accessing the water.
Normally these indicators are classified by groups to give us a baseline service level. See the example in Table 1.
Table 1. Household Water Service Level
Score Color Label
0 Black No Improved Service
1 Red Inadequate Level of Service
2-4 Orange Basic Level of Service
5 Yellow Intermediate Level of Service
6 Green High Level of Service
PRE-INVESTMENT
PHASE (Research)
INVESTMENT PHASE
(Implementation)
POST INVESTMENT
PHASE (Sustainability)
Project Study
Before project final study
Implementation Monitoring
Follow-up action
Replacement, expansion or rehabilitation of
infrastructure assets (30% of the initial investment)
Service provision through administration, operation and maintenance, and support to
service providers
Planning for infrastructure development

8
Service levels are assigned a key score that sums different metrics. There are six metrics that make up the Household Water Service Level score. Table 2 summarizes the metrics.1
Table 2. Summary of Metrics Household Water Service Level Metrics Possible Points The house gets drinking water from an improved point/system
1
Water is available from an improved system, on the day of the visit
1
There is no seasonal shortage of water that significantly limits the availability of water
1
The water point/system was neither broken nor out of service for more than 1 day per month, in the past year
1
The tariff for water service meets the criteria for affordability
1
Distance to water point/system meets government standards
1
Total 6
Under this framework, we must ensure that infrastructure provides an adequate level of service at a low cost, considering the principles of the sectoral financial policy. The best way to cover these principles and comply with the main objective of the policy is to start with management of water and sanitation infrastructure assets, an uncommon practice in the sector, especially in rural areas. Reasons for lack of application include a lack of knowledge of the life cycle costs and lack of clarity on the responsibility to maintain and replace the assets among the various actors (e.g., community, municipality, or national government).
According to the experience and evidence of how to implement in rural areas (Boulenouar and Schweitzer, 2014), a continuously repeated process is recommended that responds to the life cycle of the project and the provision of services (see Diagram 3).
It is important to 1) keep an accurate and updated record of existing assets in the area, 2) define the levels of service to be provided, and 3) determine the useful life and vulnerability of each of the components of a system.
With this, we can develop a strategic plan that allows municipalities and lenders to understand and anticipate the risks in relation to the system, and thus control it optimally in relation to cost. In this way, an efficient and effective operation and maintenance can be designed with the greatest possibility of sustainability. This process is then repeated continuously.
1 Water For People (2018), Annual Monitoring System
9
Diagram 3: Infrastructure Asset Management Cycle
2.3 Use of the tools
Unit of Analysis The unit of analysis for the toolkit is the municipality. This refers not only to the municipal government, but to all the financial flows within a municipality, wherever they come from. That’s because certain costs, by definition, are incurred at the municipal level (such as support costs for technical assistance). In this way, the tools capture all necessary expenses to reach the objectives of Everyone Forever.
This toolkit is intended for rural municipalities, which typically have a large number of small systems. For urban systems, the level of complexity in managing costs is often greater, and the tools, as developed, are not adequate for that.
Timeframe The expected projection for the tools is 10 years. This is considered to be a sufficient period to see the implications of replacement expenses, investments for new systems, or other possible changes made in the communities.
Orders of Magnitude The purpose of the exercise is to determine an overall gap or surplus at the municipal level, to establish the degree of probability of reaching the objectives of Everyone Forever. It is not an exercise to budget engineering works in detail. Therefore, it is a matter of obtaining significant figures rather than exact amounts, also considering that a 10-year horizon is quite long, in which many external factors (such as the population growth rate, or the inflation rate) may have a big impact.
Asset Analysis
Service level
Mode of Failure
Maintenance strategy
Financing

10
Costing Tools 3.1 Introduction to the Toolkit
Costing tools were developed to analyze the different categories of costs necessary to provide a sustainable service, and to determine the degree to which these categories can be covered. The results are then synthesized in the Municipal Financial Sustainability Card tool. In Diagram 4, you can see the interrelationship of the tools and the type of analysis performed with each.
Diagram 4: Interrelationship toward a Financial Balance at a Municipal Level
Here is a summary description of each of the tools:
1. Registry of communities and systems (Asset Analysis) This is the only tool that is not used for costing directly. It is a tool to identify systems and communities in a municipality that will require new or replacement investments in the coming years. The combination of this identification of priorities with cost data from the other tools allows you to make the eventual synthesis.
2. Historical Investment This tool aims to identify baseline unit costs for different types of investments (including for new systems, expansions, and replacements for different technologies) through a breakdown of actual
Necessary investment
Projection of
necessary financing
#1 Registry of communities and assets (Asset Analysis)
#2 Historical Investment
#3 AtWhatCost
Replacement cost gaps
#4 Direct Support
Historical spending on direct support vs ideal
Unit cost ranges for new systems and expansions
Operation and maintenance cost gaps
# 5 Municipal Financial Sustainability Card

11
investments made during a determined period, such as the last five years.
3. AtWhatCost This is a tool to be used at the Water Board level. It allows service providers to evaluate their level of income and expenses over time and analyze necessary changes in their cost management. It allows them to analyze the required expenses for operation and maintenance and set the necessary tariff to find the financial breakeven point. 4. Direct Support This is a tool for municipal technical staff and seeks to analyze whether their current expenses are adequate to fulfill all of their functions. It also allows them to analyze changes in municipality's budget that are necessary to fulfill its functions. 5. Municipal Financial Sustainability Card This is a synthesis tool because it presents all the financial resources needed in the coming years to reach Everyone Forever. The Asset Analysis can be used in combination with the unit costs to estimate the necessary investments in new systems, expansions, and replacements and their distribution over time. The application of AtWhatCost in a sample of communities allows for calculating the degree of co-financing needed by communities for these investments. Finally, it includes the difference between the current cost of direct support and the required costs.
3.2 Summary of the Toolkit
In summary, the kit consists of five tools that can be used independently. It allows one to enter the detail of each category of costs for various specific uses. Only the Municipal Financial Sustainability Card requires the results of the other tools.
Table 3 summarizes each tool’s primary use, suggested users, and the frequency of use. Financial information requires a certain level of technical expertise and proficiency with tools (such as Excel) that is not always found at the municipal level, although results of these exercises must be analyzed and interpreted at this level.
Table 3: Toolkit
Tool Main use Who uses it? Level Frequency Registration of communities and assets (Asset Analysis)
Identify systems and communities that require investment to increase or replace coverage; identify risks
Municipality, NGOs
Municipality, community
Every 4 years
Historical Investment
Identify baseline unit costs
National government entities, NGOs
Municipality, country
Every 5 years
AtWhatCost Define and evaluate income and expenses of a JAAP
Municipality, NGOs facilitating the process at the JAAP level
Community Each time a system is installed, using a sample every 3 years
Direct Support
Budget expenses of the municipality
Municipality, NGOs
Municipality Annual
Municipal Financial Sustainability Card
Municipal multi-year planning
Municipality, NGOs
Municipality Every 4 years

12
Each tool is in an Excel file and has a similar structure, consisting of several tabs. The first tab of each tool contains the instructions for its use. It is important to read these instructions before entering data. Each tool consists of one or two tabs in which the main data must be entered. These are used in one or more tabs for calculations. Some tools have a final tab with baseline data, such as financial data or the useful life of different types of infrastructure. The orange cells indicate fields that the user must fill in with the correct data. All other cells are locked to prevent the user from adjusting formulas unintentionally. The user can unprotect each sheet using the password "data." The password must be entered in each sheet the user wants to unprotect.
It should also be noted that the frequency of application differs from one tool to another. Some costs do not change much from one year to the next (such as initial investment) and it is suggested to analyze them only every few years. However, the Asset Analysis mut be updated continuously. Data must be added each time a work is completed. The municipality must monitor the status of assets in the communities frequently to update this record.
The following sections present for each tool its 1) objectives in more detail, 2) operation, 3) structure, 4) steps to use of the tool, and 5) sources of data for the application.
3.3 Asset Analysis
Objective The general objective of the Asset Analysis is to identify the communities that still do not have potable water service and the physical condition of existing system infrastructure to prioritize investments for new systems, expansions, and replacement of components.
Operation of the Tool The tool is based on asset management, which involves a life cycle analysis for each component of a water system to maximize its performance. This involves processes of design, construction, expansion, maintenance, and replacement of assets. Different assets that make up a system have different theoretical useful lifetimes.
The components may require replacement much earlier or after their useful life, depending on their current physical condition. A component that has been maintained in good shape can last much longer than its theoretical useful life. Certain components that have not been maintained or that have suffered any unexpected damage need to be replaced before their theoretical useful life. The combination of the age in relation to its theoretical useful life and its current physical conditions indicates the need to be replaced.
In addition, the tool is based on the concept of efficiency in asset management. It can be more efficient to perform a complete rehabilitation of a water system when there are several components in poor condition and that have fulfilled their useful life, than to replace these components. It allows one to modernize the system once and for all, and avoids the need to intervene again soon. In other cases, it is more efficient to just replace a component that has problems, and not to do a total rehabilitation. This tool then analyzes the state of each one of the components of the system as a whole.

13
Data Sources There are two ways to obtain the data for filling in the tool: 1. From the surveys of communities and systems of the Water and Sanitation Information
System (SIASAR, for the Spanish acronym): Before using the information in SIASAR, one must take into account that this system is currently in the data collection phase. It is possible that the system may not have all communities and systems of the municipality, as SIASAR does not indicate the year in which improvements were made to the systems. The information obtained by municipal staff must be validated and evaluated whether it is necessary to obtain more information from other sources. Appendix 1 contains the information required by the Asset Analysis tool from the SIASAR surveys.
2. Inspection and assessment in the field: This implies having sufficient personnel, time, and capital resources.
Analysis of Results The results obtained with the tool allow us to have a clearer picture of the needs, especially identifying communities that do not have a drinking water system, and prioritize new investments. It also identifies communities whose systems are so old that they require a replacement of the entire system or only of certain components due to their different useful lives.
It also communities ‘on alert’ to do preventive maintenance on their systems, to avoid replacement of their system before the scheduled time due to lack of maintenance. Municipal water and sanitation technicians should be preparing a plan for the proper operation and maintenance of the system with the administrators of these systems (the Water Board).
It is recommended to consult the manual where the explanation about the sources of information and calculation parameters is given in greater detail. Link: Manual 1: Asset Analysis (in Spanish)
3.4 Historical Investment
Objective The objective of the Historical Investment tool is to calculate baseline unit costs for investments in water systems and to analyze the factors that influence these costs. It is based on a snapshot of investment projects carried out over time.
Operation of the Tool It is a database of investment in water projects which were implemented in recent years. For each project, the database contains the total amount invested, adding the contributions of different sources, and provides a breakdown of the costs incurred, which include:
- Pre-investment - Physical works - Community creation or strengthening (Water Board) - Supervision - Overhead (administrative costs of executing entity)
This information is converted to current values. In addition, it captures characteristics of the project, such as the type of investment (in new systems, expansion, or replacement) and the target population. Once the database is established, you can get basic statistics of unit costs (costs per capita), such as the average and interquartile range.

14
Data Sources The sources of data for this tool are the archives of investments in water projects from government entities (such as the Honduran Social Investment Fund/Community Development Institute, Water and Sanitation or National Autonomous Service of Aqueducts and Sewers), municipalities, and other organizations. Oftentimes, these archives are related to projects, and may include elements of sanitation or other issues. If this is the case, it is necessary to distinguish between expenses, estimating the expenses for water components as precisely as possible.
Analysis of Results Once the information for all projects has been completed and the form is filled out, these data are used to analyze investment and replacement costs. You can calculate for each cost variable: average ranges (quartiles), percentages, and frequency distribution histograms. It is also possible to research the crosses between variables for correlation using dynamic tables. All possible dynamic tables and statistics have not been included in the tool.
To determine the baseline unit costs (baseline per capita costs), take the total investment and divide it by the corresponding population. Do this for each program and then with the data totals, determine the median. That result will detremine the baseline cost. It is recommended that you get the median for new projects, both for rural dispersed (less than 200 inhabitants) and concentrated populations (between 200 and 2,000 inhabitants). It is the same process for expansion and replacement projects.
This breakdown of baseline costs will help you plan investments, as with the Municipal Financial Sustainability Card Tool, if applicable.
It is recommended to consult the manual where the information and type of variables to be used for this tool are explained in greater detail. Link: Manual 2: Historical Investment (in Spanish)
3.5 AtWhatCost
Objective The main objective of the AtWhatCost tool is to evaluate the balance of costs and revenues of a rural Water Board (JAAP, for the Spanish acronym), in order to analyze adjustments toward a financial balance that allows for adequate operation and maintenance and is affordable for users.
Operation of the Tool In general, using the tool consists of making a projection of the JAAP's expenses based on the annual expenses on operation and maintenance, in addition to the expenses necessary for replacements based on useful life. It projects what income is expected from any source that has been identified and a financial balance is calculated on an annual basis, establishing the amounts that the Water Board would have in reserves.
Data Source The main data source for the tool is a participatory meeting or interview with the JAAP, or a review of accounting books, trying to get acquainted with the financial management of the system.

15
Analysis of Results For any analysis, it is important to review the projection of expenses in tab 3, where each budget line added in expense table number 4 of the tab "Input data" will be projected out 20 years, considering the inflation and growth rate. With this, we can observe how the operation and maintenance costs increase each year, and identify the replacement costs of minor and major components in the year corresponding to their useful life. For replacement costs, which are occasional, a percentage of the user contribution established in table number 6 is considered according to the classification of the components. Then, the tool provides a summary of expenses and income in 20 years (Figure 1). This tab is divided into three sections or three tables.
Within Figure 2, Table 1 projects how water service coverage could be developed, considering the growth rate, and it also provides an alert as to whether source production will be sufficient to supply all users in the region in the future. Table 2 shows the projection of all possible income and expenses, including the resulting balance for each year. Table 3 presents the annual financial balance and the cash flow forecast for each year. As shown in the structure of the tool, tab 5 provides 4 different graphs to illustrate the projections of the expenses and revenues.

16
Figure 1: Expenditure Projection Table 2.1. Minor Operation and Maintenance Expenses 2018 2019 2020 2021 2022 2023 15 16 17 18 19 20 Operating costs Plumber, Watershed Warden HNL 53,760 HNL 56,448 HNL 59,270 HNL 62,234 HNL 65,346 HNL 68,613 Office supplies HNL 5,267 HNL 5,530 HNL 5,807 HNL 6,097 HNL 6,402 HNL 6,722 Transportation (hauling material) HNL 1,400 HNL 1,470 HNL 1,544 HNL 1,621 HNL 1,702 HNL 1,787 Per diem for Water Board members HNL 600 HNL 630 HNL 662 HNL 695 HNL 729 HNL 766 Materials, fixtures and fittings HNL 7,550 HNL 7,928 HNL 8,324 HNL 8,740 HNL 9,177 HNL 9,636 Electric power or gasoline pump HNL 0 HNL 0 HNL 0 HNL 0 HNL 0 HNL 0 Chlorine HNL 5,400 HNL 5,670 HNL 5,954 HNL 6,251 HNL 6,564 HNL 6,892 Water analysis. HNL 900 HNL 945 HNL 992 HNL 1,042 HNL 1,094 HNL 1,149 Others (contribution fee to the Board Association) HNL 2,064 HNL 2,167 HNL 2,276 HNL 2,389 HNL 2,509 HNL 2,634 Other (specify): HNL 0 HNL 0 HNL 0 HNL 0 HNL 0 HNL 0 Other (specify): HNL 0 HNL 0 HNL 0 HNL 0 HNL 0 HNL 0 Sub-Total operating expenses HNL 76,941 HNL 80,788 HNL 84,827 HNL 89,068 HNL 93,522 HNL 98,198 Maintenance Expenses and Minor Replacements
Year of
investment
Expenditure by the CAPYS
Replacement Time 2018 2019 2020 2021 2022 2023
Micro-meters 0 HNL 0 8 HNL 0 HNL 0 HNL 0 HNL 0 HNL 0 HNL 0 Chlorinator system 0 HNL 0 10 HNL 0 HNL 0 HNL 0 HNL 0 HNL 0 HNL 0 Pump and electrical equipment, includes electrical connection 0 HNL 0 7 HNL 0 HNL 0 HNL 0 HNL 0 HNL 0 HNL 0
Sub-Total costs in maintenance and minor replacements HNL 0 HNL 0 HNL 0 HNL 0 HNL 0 HNL 0 Total Minor Operation and Maintenance Expenses HNL 76,941 HNL 80,788 HNL 84,827 HNL 89,068 HNL 93,522 HNL 98,198
Table 2.2. Major Replacement Expenses
Maintenance Capital Expense (CapManEx)
Year of investme
nt
Expenditure by the CAPYS
Useful life 2018 2019 2020 2021 2022 2023
Principal Assets Intake 2017 HNL 1,935 15 HNL 0 HNL 0 HNL 0 HNL 0 HNL 0 HNL 0 Water main 2003 HNL 185,725 20 HNL 0 HNL 0 HNL 0 HNL 0 HNL 0 HNL 492,784 Storage tank 2003 HNL 32,244 20 HNL 0 HNL 0 HNL 0 HNL 0 HNL 0 HNL 85,553 Distribution and connections network 2003 HNL 56,427 30 HNL 0 HNL 0 HNL 0 HNL 0 HNL 0 HNL 0 Well 0 HNL 0 10 HNL 0 HNL 0 HNL 0 HNL 0 HNL 0 HNL 0 Pumping station 0 HNL 0 20 HNL 0 HNL 0 HNL 0 HNL 0 HNL 0 HNL 0 Treatment plant 0 HNL 0 17 HNL 0 HNL 0 HNL 0 HNL 0 HNL 0 HNL 0 Total Major Replacement Expenses HNL 0 HNL 0 HNL 0 HNL 0 HNL 0 HNL 578,337

17
Figure 2. Summary of Expenses and Income Table 1. Increase in Coverage
Year 2018 2019 2020 2021 2022 2023 Total population 860 860 860 860 860 860 Population served 860 860 860 860 860 860 Connected homes 172 172 172 172 172 172 Coverage 100% 100% 100% 100% 100% 100% Liters per day required for the entire system 81386.1 81386.1 81386.1 81386.1 81386.1 81386.1 Production of the source Sufficient Sufficient Sufficient Sufficient Sufficient Sufficient Table 2. Income and Expenses
Year 2018 2019 2020 2021 2022 2023 Sources of income Tariffs HNL 103,200 HNL 108,360 HNL 113,778 HNL 119,467 HNL 125,440 HNL 131,712 New connections HNL 0 HNL 0 HNL 0 HNL 0 HNL 0 HNL 0 Fines HNL 1,200 HNL 1,260 HNL 1,323 HNL 1,389 HNL 1,459 HNL 1,532 Emergency fees HNL 0 HNL 0 HNL 0 HNL 0 HNL 0 HNL 0 User contribution toward replacement HNL 0 HNL 0 HNL 0 HNL 0 HNL 0 HNL 0 Interest on the bank balance HNL 7,650 HNL 7,822 HNL 7,998 HNL 8,178 HNL 8,362 HNL 8,550 Interest on loans to members of the Water Board HNL 0 HNL 0 HNL 0 HNL 0 HNL 0 HNL 0 Total annual income HNL 112,050 HNL 117,442 HNL 123,099 HNL 129,034 HNL 135,261 HNL 141,794 Expenditure Minor lperation and maintenance expenses HNL 76,941 HNL 80,788 HNL 84,827 HNL 89,068 HNL 93,522 HNL 98,198 Replacement expenses HNL 0 HNL 0 HNL 0 HNL 0 HNL 0 HNL 578,337 Total annual expenses HNL 76,941 HNL 80,788 HNL 84,827 HNL 89,068 HNL 93,522 HNL 676,535 Annual balance HNL 35,109 HNL 36,654 HNL 38,272 HNL 39,966 HNL 41,739 (HNL 534,741) Table 3. Cash Flow Forecast
Year 2018 2019 2020 2021 2022 2023 Balance HNL 35,109 HNL 36,654 HNL 38,272 HNL 39,966 HNL 41,739 (HNL 534,741) Amount on hand HNL 379,109 HNL 415,764 HNL 454,036 HNL 494,001 HNL 535,741 HNL 1,000

18
Figure 3 illustrates the summary of Table 2 for community "X," where you can view the possible expenses and income for 20 years. In this example, we can see how operating and maintenance expenses (blue bars) and revenue from tariffs (green bars) increase annually with inflation, and that in certain years, significant expenses are reflected by possible replacement of system components (orange bars). If we do not consider the inflation rate, we would not identify the annual increases, but a linear projection.
Figure 3. Summary Expenses and Income for 20 Years
Figure 4 is the projection of what would be the balance and the amount in cash that accumulates annually, considering an initial reserve that is held in a bank account and/or as petty cash. The graph shows an example for community "X".
Figure 4: Annual Balance and Amount in Accumulated Cash
Analyzing the multi-year balance for this community, we see how it remains positive from the year 2017 until year 2023 due to the expense for replacement of system components. In this year, the annual balance is negative, but the on hand amount of accumulated cash can cover these expenses, because the established rate allows one to cover a desired percentage for
2017
2018
2019
2020
2021
2022
2023
2024
2025
2026
2027
2028
2029
2030
2031
2032
2033
2034
2035
2036
2037
2038
HNL 0
HNL 100,000
HNL 200,000
HNL 300,000
HNL 400,000
HNL 500,000
HNL 600,000
HNL 700,000
HNL 800,000
HNL 900,000
HNL 1,000,000
Gasto Operación y mantenimiento
Gasto remplazos
Ingreso
2017
2018
2019
2020
2021
2022
2023
2024
2025
2026
2027
2028
2029
2030
2031
2032
2033
2034
2035
2036
2037
2038
(HNL 1,000,000)
(HNL 500,000)
HNL 0
HNL 500,000
HNL 1,000,000
HNL 1,500,000
HNL 2,000,000
HNL 2,500,000
Monto en caja
Balance anual
Amount on hand
Annual balance
Operation & Maintenance Costs
Replacement Costs
Income

19
replacements. In subsequent years, the tariff is sufficient to recover a positive balance and to accumulate sufficient resources for the next replacement according to the useful life of the components. The graphs in Figures 5 and 6 are an illustrative representation of the breakdown of income and expenditures.
Figure 5: Breakdown of Different Annual Income Sources
Figure 6: Breakdown of Annual Expenses
It is recommended to consult the manual for the use of this tool, including possible scenarios and more detail on how to apply and use information at the community level. Link: Manual 3: AtWhatCost (in Spanish)
3.6 Direct Support Costs
Objective The purpose of this tool is to analyze whether there is adequate annual expenditure for fulfilling the necessary functions of municipal ownership of services. In addition, it enables one to establish whether the Municipal Technical Unit on Water and Sanitation (UTMAS, for the Spanish acronym) requires possible changes in the municipal budget for the fulfillment of these functions.
2017
2018
2019
2020
2021
2022
2023
2024
2025
2026
2027
2028
2029
2030
2031
2032
2033
2034
2035
2036
2037
2038
HNL 0
HNL 50,000
HNL 100,000
HNL 150,000
HNL 200,000
HNL 250,000
HNL 300,000
HNL 350,000
HNL 400,000
HNL 450,000
HNL 500,000 Interés de los prestamos a los socios de la Junta de aguaInterés del saldo bancario
Contraparte de usuarios hacia el remplazo
Cuotas de emergencia
Multas
Conexiones nuevas
Tarifas
2017
2018
2019
2020
2021
2022
2023
2024
2025
2026
2027
2028
2029
2030
2031
2032
2033
2034
2035
2036
2037
2038(HNL 100,000)
HNL 100,000
HNL 300,000
HNL 500,000
HNL 700,000
HNL 900,000
HNL 1,100,000
Gastos de reemplazos menores
Gastos en reemplazos mayores
Gastos en el pago del prestamo
Gastos de operación
Interest on loans to Water Board members
Interest on the bank balance
Counterpart of users towards the replacement
Emergency fees
Fines
New Connections
Tariffs
Minor replacement expenses
Major replacement expenses
Loan payment expenses
Operating expenses

20
HNL -00 HNL 20,000.00 HNL 40,000.00 HNL 60,000.00 HNL 80,000.00
HNL 100,000.00 HNL 120,000.00 HNL 140,000.00 HNL 160,000.00 HNL 180,000.00
Gasto actual
Gasto requerido
Operation of the Tool In general, the tool performs an analysis of the municipality’s investment in technical assistance for communities, having as its sole objective the sustainability of the provision of drinking water and sanitation services.
Data Source Through a series of working meetings, the UTMAS staff collect and consolidate the information needed (costs, wages, functions, and times) to assess and estimate the costs and time required to properly implement the technical assistance that the municipality requires.
Analysis of Results The use of this tool will result in an efficient analysis of the graphs presented in the figures below. This analysis uses the following guiding questions:
- What are the main differences between current and required expenses? - Which functions require a major change, and which require just a minor change? - How does the breakdown change between current and required expenses?
The first two questions are easily answered with Figure 7, where the difference between current expenses (green bars) and those required (orange bars) to provide adequate technical assistance.
Figure 7: Comparison of Current versus Required Expenses
When we observe the major and minor changes in the graph, we have to ask ourselves what these changes are due to, and if it’s ideal. If we have doubts about these questions, it is best to check the costs, since it is possible we forgot some or that we included them in the wrong function. We answer the third question above using the graphs in Figures 8 and 9 that contain the breakdown of current and required costs according to functions, including the activities that require a greater percentage of the budget.
Supe
rvis
ion
of p
roje
ct
Mat
eria
ls a
cqui
sitio
n/es
timat
es
Tech
nica
l Ass
ista
nce
Flow
Mon
itorin
g
Qua
lity/
adm
inis
tratio
n/O
&M
Acco
untin
g
Qua
lity
Tarif
fs
Adm
inis
tratio
n
Ope
ratio
n &
Mai
nten
ance
WR
M P
rom
otio
n
Sour
ce p
rote
ctio
n
Ref
ores
tatio
n/M
onito
ring
Mee
tings
& c
oord
inat
ion
Wor
ksho
ps
Offi
ce (t
ime
& op
erat
ion)
Oth
er n
on-W
ASH
func
tions
Current expenses
Required expenses

21
Supervision de Proyectos6% Adquisision de
materiales/Estimaciones de Obra
5%
Coordinacion/Asistencia Tecnica
16%
Monitoreo Flow6%
Calidad/Administracion/Operacion y Mantenimiento
4%
Rendicion de Cuentas1%
Calidad5%Tarifas
4%Administracion3%
Operacion y Mantenimiento
2%
Promocion GIRH6%
Proteccion de Fuentes6%
Reforestacion/Monitoreo5%
Reuniones y Coordinaciones (COMAS,
AJAAM, USCL)21%
Talleres3%
Oficina (Tiempo y funcionamiento)
5%
Otras Funciones no de Agua y Saneamiento.
1%
AccountingQuality
Administration
Reforestation/monitoring
Figure 8: Breakdown of Current Expenses
Figure 9: Breakdown of Required Expenses
To complete the analysis, an additional calculation is recommended, and it represents a percentage of the estimated cost for technical assistance to maintain adequate service provision with respect to the total budget of the municipality. Table 4 contains an example for a municipality “X."
Supervision Proyecto RD10% Adquisision de
materiales/Estimaciones de Obra
1% Coordinacion/Asistencia Tecnica
3%
Monitoreo Flow8%
Calidad/Administracion/Operacion y Mantenimiento
0%
Rendicion de Cuentas3%Calidad
4%Tarifas3%
Administracion2%
Operacion y Mantenimiento
3%Promocion
0%Proteccion de Fuentes
4%Reforestacion/Monitoreo
8%
Reuniones y Coordinaciones (COMAS, AJAAM, USCL,COMIC)
11%
Talleres3%
Oficina (Tiempo y funcionamiento)
26%
Otras Funciones no de Agua y Saneamiento.
12%
Accounting
Meetings and coordination
Office (time & operation)
Project supervision
Project supervision
Materials acquisition/estimates
Materials acquisition/estimates
Technical Assistance
Technical Assistance
Flow monitoring
Flow monitoring
Quality/administration/ O&M
Quality/administration/ O&M
Quality Tariffs
Tariffs
Administration
Operation & maintenance
Operation & maintenance
WRM promotion
WRM promotion
Source protection
Source protection
Reforestation/monitoring
Workshops
Workshops
Meetings and coordination
Other non-WASH functions 1%
Office (time & operation) 5%
Other non-WASH functions

22
Table 4: Percentage Estimate of Municipal Budget Investment in Direct Support Costs
Annual Municipal Budget L. 19,400,000.00 1 Taxes L. 5,000,000.00 2 Government Transfer L. 14,400,000.00
Year Total Costs in Current Direct Support
% of the Annual Municipal Budget
2018 L. 272,160.00 1,403% It is recommended to consult the manual on the use of this tool to obtain more details. Link: Manual 4: Direct Support Costs (in Spanish)
3.7 Municipal Financial Sustainability Card
Objective The Municipal Financial Sustainability Card is a synthesis tool, based on the results of the other costing tools. It presents all the financial resources needed in the coming years to reach Everyone Forever. These data can be used in multi-year municipal planning processes, and in the municipality's mobilization of resources to implement plans.
Functioning The Municipal Financial Sustainability Card:
- Is based on the Asset Analysis tool to identify which communities and systems require an intervention (new construction, expansion, or replacement) in the coming years.
- Then, that information is combined with the unit costs, obtained in the Historical Investment tool, to project the total investment required in new systems, expansions, and replacements and their distribution over time.
- Then, using the AtWhatCost tool (on a sample of communities), the level of community co-financing of investments is included.
- Finally, the Municipal Financial Sustainability Card takes the information from the Direct Support tool, to include the difference between the cost of current and required direct support. It is added to the total cost required to reach the Everyone to determine the amounts to be mobilized.
The tool can also be used to estimate if one has already reached or when one will reach Everyone.
Data Source The data necessary to complete the Municipal Financial Sustainability Card is obtained from the other costing tools. It does not require additional information.
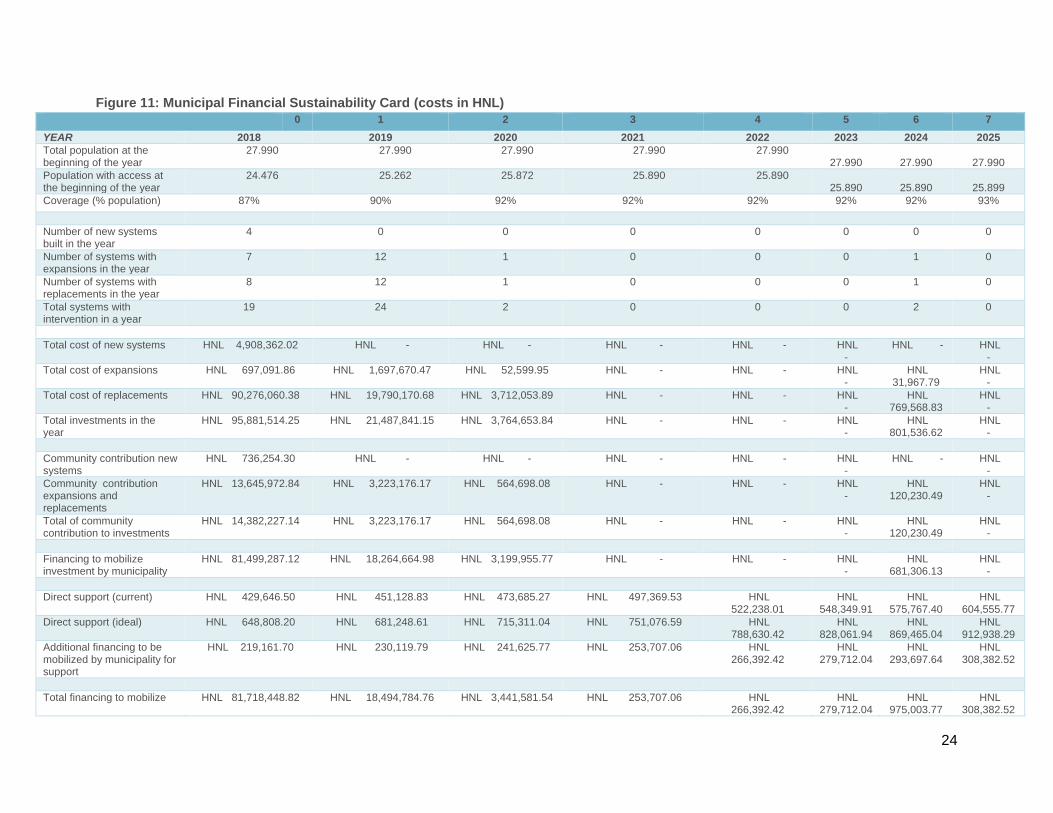
Analysis of Results Every calculation made is summarized in the Municipal Financial Sustainability Card, where all the necessary resources are presented so that water and sanitation services are sustainable in the municipality. This summary is intended to give an indication of the total amount to be mobilized annually to cover these resources, based on population data and how progress is being made in coverage year after year. Then we can obtain the total number of projects per year and the total cost of that intervention (either for new systems, expansions or replacements). This information serves as an orientation at the time the municipality starts planning.

23
Another important aspect of this card is the community contribution investment for the project intervention, using the contribution factor obtained with the AtWhatCost tool. By subtracting this contribution, we determine the total investment to mobilize by the municipality. Finally, the financing for direct support costs is also included, adding it as an additional cost to mobilize, to ensure the sustainability of the services.
To conclude the analysis of the Municipal Financial Sustainability Card, we can use graphs the tool produces, such as in Figure 10, to see the investment required per year.
Figure 10: Projection of Municipal Investment Required to Ensure Full Water & Sanitation Coverage
All results of the tools are considered a fundamental part of an assessment when developing municipal strategic plans, since they provide guidelines as to where, when, and how much should be invested in the municipality.
It is recommended to consult the manual for the use and application of this tool. Link: Manual 5: Municipal Financial Sustainability Card (in Spanish)
2018 2019 2020 2021 2022 2023 2024 2025 2026 2027 2028HNL -00
HNL 10,000,000.00
HNL 20,000,000.00
HNL 30,000,000.00
HNL 40,000,000.00
HNL 50,000,000.00
HNL 60,000,000.00
HNL 70,000,000.00
HNL 80,000,000.00
HNL 90,000,000.00
HNL 100,000,000.00
Inversión en reemplazos
Inversión en ampliaciones
Inversión en sistemas nuevos
Inversión en apoyo directo
Investment in replacements
Investment in expansions
Investment in new systems
Investment in direct support
24
Figure 11: Municipal Financial Sustainability Card (costs in HNL) 0 1 2 3 4 5 6 7
YEAR 2018 2019 2020 2021 2022 2023 2024 2025 Total population at the beginning of the year
27.990 27.990 27.990 27.990 27.990 27.990
27.990
27.990
Population with access at the beginning of the year
24.476 25.262 25.872 25.890 25.890 25.890
25.890
25.899
Coverage (% population) 87% 90% 92% 92% 92% 92% 92% 93% Number of new systems built in the year
4 0 0 0 0 0 0 0
Number of systems with expansions in the year
7 12 1 0 0 0 1 0
Number of systems with replacements in the year
8 12 1 0 0 0 1 0
Total systems with intervention in a year
19 24 2 0 0 0 2 0
Total cost of new systems HNL 4,908,362.02 HNL - HNL - HNL - HNL - HNL
- HNL - HNL
- Total cost of expansions HNL 697,091.86 HNL 1,697,670.47 HNL 52,599.95 HNL - HNL - HNL
- HNL
31,967.79 HNL
- Total cost of replacements HNL 90,276,060.38 HNL 19,790,170.68 HNL 3,712,053.89 HNL - HNL - HNL
- HNL
769,568.83 HNL
- Total investments in the year
HNL 95,881,514.25 HNL 21,487,841.15 HNL 3,764,653.84 HNL - HNL - HNL -
HNL 801,536.62
HNL -
Community contribution new systems
HNL 736,254.30 HNL - HNL - HNL - HNL - HNL -
HNL - HNL -
Community contribution expansions and replacements
HNL 13,645,972.84 HNL 3,223,176.17 HNL 564,698.08 HNL - HNL - HNL -
HNL 120,230.49
HNL -
Total of community contribution to investments
HNL 14,382,227.14 HNL 3,223,176.17 HNL 564,698.08 HNL - HNL - HNL -
HNL 120,230.49
HNL -
Financing to mobilize investment by municipality
HNL 81,499,287.12 HNL 18,264,664.98 HNL 3,199,955.77 HNL - HNL - HNL -
HNL 681,306.13
HNL -
Direct support (current) HNL 429,646.50 HNL 451,128.83 HNL 473,685.27 HNL 497,369.53 HNL
522,238.01 HNL
548,349.91 HNL
575,767.40 HNL
604,555.77 Direct support (ideal) HNL 648,808.20 HNL 681,248.61 HNL 715,311.04 HNL 751,076.59 HNL
788,630.42 HNL
828,061.94 HNL
869,465.04 HNL
912,938.29 Additional financing to be mobilized by municipality for support
HNL 219,161.70 HNL 230,119.79 HNL 241,625.77 HNL 253,707.06 HNL 266,392.42
HNL 279,712.04
HNL 293,697.64
HNL 308,382.52
Total financing to mobilize HNL 81,718,448.82 HNL 18,494,784.76 HNL 3,441,581.54 HNL 253,707.06 HNL
266,392.42 HNL
279,712.04 HNL
975,003.77 HNL
308,382.52

25
References
Smits, S, Schweitzer, R. (2014). Herramientas de Costeo de Servicios de Agua a Nivel Municipal. IRC.
Smits, S, Gil, A., & Rojas, J. (2014). Costos de Inversiones en Agua y Saneamiento Rural Bajo Diferentes Modelos de Intervención en Honduras. IRC. Tegucigalpa, Honduras.
Fonseca, C. et al. (2013). Nota Informativa: Enfoque de Costos del Ciclo de Vida; Costeo de Servicios Sostenibles.
Serrano, A. Rodriguez, M., y Gil, A. (2018). Manuals for Costing Tools.
Manual 1. Asset Analysis (in Spanish)
Manual 2. Historical Investment (in Spanish)
Manual 3. AtWhatCost (in Spanish)
Manual 4. Direct Support Costs (in Spanish)
Manual 5. Municipal Financial Sustainability Card (in Spanish)

26
The number "1" If the physical state of the component is "normal." This means that the current physical state of the component does not affect the functionality of the component. Some small repairs or perhaps more detailed maintenance may be necessary in order to avoid future problems, but these deficiencies will not prevent the functioning of a component at the time of the evaluation.
The number "2" If the physical state of the component is "bad." This means that, currently, the physical state is so severe that the functionality of that component will be affected or impeded. Repairs or replacements are required for the component to operate at full capacity.
The number "3" If the component "does not work" in any way, possibly affecting the functioning of the system. Replacement is required for the component to work again.
If the system does not have the indicated asset, it is left blank.
Appendices 5.1 Appendix 1: Description of the Physical State of System Components
When using the costing tools, it is essential to have an assessment that is fully validated by the technician in the field. Figure 12 refers to which code to enter in the Asset Analysis tool and the meaning of the code according to the physical state of the system components.
Figure 12: Codes and their Meaning for the Asset Analysis
When using SIASAR to fill in the physical state, the systems database should be used. In it, you will find the status of the catchment, pipeline network, storage, and distribution network. There are four ways to express that state:
- Good condition (which is weighted with the number 1) - Requires minor maintenance (which is weighted with the number 2) - Requires minor works (which is weighted with the number 2) - Requires reconstruction (which is weighted with the number 3)
5.2 Appendix 2: Staff Profile Required for Implementation Professional with experience in financial data analysis and Excel management.
Water and sanitation technician with knowledge and qualification to accurately classify a drinking water system and each of its components, in good or bad condition, by their physical condition or age, with Excel handling capacity and good use of time.
For the application of the Costing Tools, this technician will need to be trained on how to analyze the projected results.

27
5.3 Appendix 3: Tool Application Protocols Tool Application Protocol: Asset Analysis
Tool Application Protocol: AtWhatCost
Filling in of general and baseline data of
the municipality Estimated time: 1/2
day Pull data from INE, SIASAR. Collect repair year data for each component per system. Review and validate the information with municipality staff.
Collect data with SIASAR survey
Estimated time: 2.5 days Survey community and system (1.5 days). Survey health centers and schools (1/2 day). Survey service provider (1/2 day). Collect repair year data for each component per system.
Data analysis and Report
Estimated time: 1 day
Review of baseline data. Analysis of the automated calculations of the tool. Preparation of report.
Socialization of results
Estimated time: 1 day
Present results of the data analysis and conclusions with the Mayor and his staff. Ideal to do this together with the financial sustainability card.
Coordination and socialization
Estimated time: 1/4 day Contact the municipal technician, USCL, and AJAAM for support while using the tool. Coordinate with the Water Board on the day of the meeting and highlight the importance of the presence of the treasurer. Consult prior to the meeting, to see if the community or Water Board know the cost of building the system and costs per component; if not, check with the Asset Analysis or Historical Investment tools.
Field interview Estimated time: 1/4 day
Interview with the JAAS. Collect general data from the community (delinquency rates, number of users, housing in the community, source production). Become acquainted with the JAAS financial management model to operate the system. Gather necessary information about expenses and income in the existing model. Verify if the current management model is the right one which considers all necessary expenses to operate, administer, protect, and sustain the system; otherwise, it is a good idea to propose what would be appropriate.
Cont. Field interview Fill in Excel spreadsheet by entering all general community data and financial data obtained on expenses and income. Fill in data on the cost of building the system. Enter a percentage that is considered optimal so the community can recover the system investment through a tariff
Field data analysis Estimated time: 1/4 day
To increase the tariff, analyze different scenarios, using the percentage of recovery of the investment or other important variables that could generate a higher income (recovery of delinquency).
Socialization of results Estimated time: 1 day
If this resulting tariff is approved by the JAAS, a date is agreed for the socialization of a new sustainable tariff before the assembly. Once the tariff is approved, a report is created, based on the projections and graphs. The analysis made with the JAAS and the USCL can be socialized with the municipality to understand how the communities are operating the systems and the capacity to contribute to the recovery of the system's investment.
28
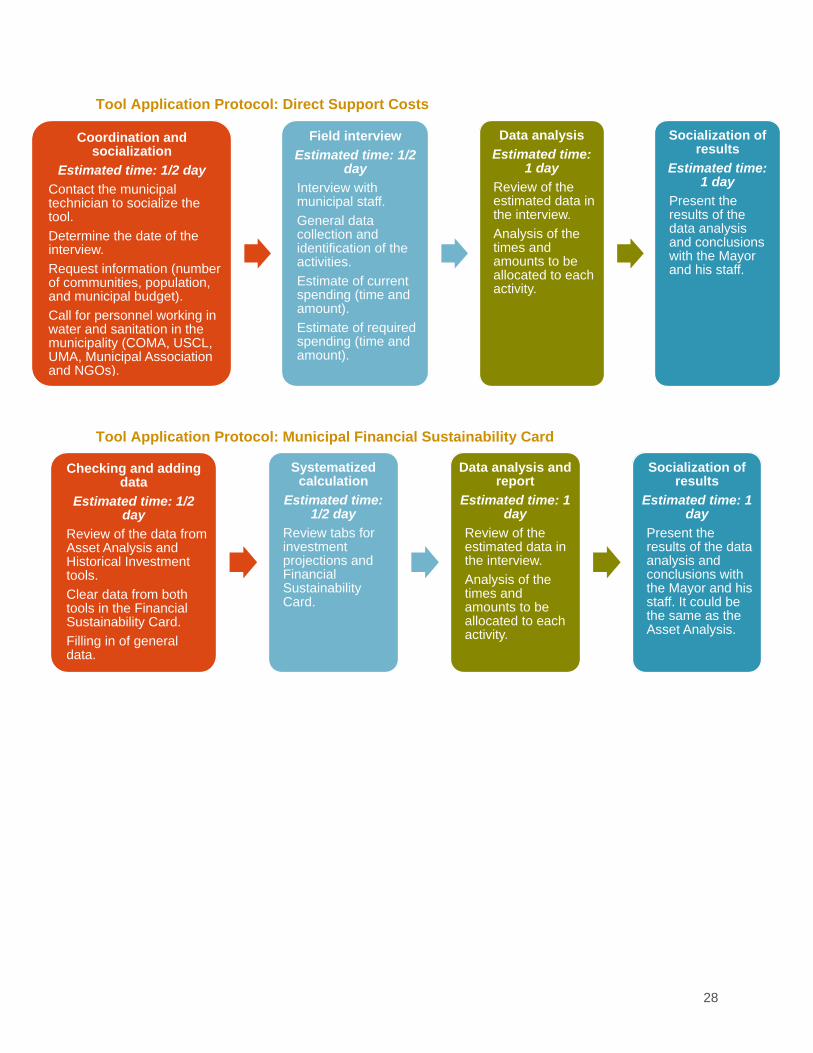
Tool Application Protocol: Direct Support Costs
Tool Application Protocol: Municipal Financial Sustainability Card
Coordination and socialization
Estimated time: 1/2 day Contact the municipal technician to socialize the tool. Determine the date of the interview. Request information (number of communities, population, and municipal budget). Call for personnel working in water and sanitation in the municipality (COMA, USCL, UMA, Municipal Association and NGOs).
Field interview Estimated time: 1/2
day Interview with municipal staff. General data collection and identification of the activities. Estimate of current spending (time and amount). Estimate of required spending (time and amount).
Data analysis Estimated time:
1 day Review of the estimated data in the interview. Analysis of the times and amounts to be allocated to each activity.
Socialization of results
Estimated time: 1 day
Present the results of the data analysis and conclusions with the Mayor and his staff.
Checking and adding data
Estimated time: 1/2 day
Review of the data from Asset Analysis and Historical Investment tools. Clear data from both tools in the Financial Sustainability Card. Filling in of general data.
Systematized calculation
Estimated time: 1/2 day
Review tabs for investment projections and Financial Sustainability Card.
Data analysis and report
Estimated time: 1 day
Review of the estimated data in the interview. Analysis of the times and amounts to be allocated to each activity.
Socialization of results
Estimated time: 1 day
Present the results of the data analysis and conclusions with the Mayor and his staff. It could be the same as the Asset Analysis.

29