GENERAL FUND REVENUE REPORT & ECONOMIC … · will be weak, which means unemployment will ... •...
22
GENERAL FUND REVENUE REPORT & ECONOMIC OUTLOOK November 2011 Barry Boardman, Ph.D. Fiscal Research Division North Carolina General Assembly
Transcript of GENERAL FUND REVENUE REPORT & ECONOMIC … · will be weak, which means unemployment will ... •...

GENERAL FUND REVENUE REPORT & ECONOMIC
OUTLOOK
November 2011Barry Boardman, Ph.D.Fiscal Research DivisionNorth Carolina General Assembly

1
Overview• General Fund revenue through October is $115
million above the revenue target.• Despite little improvement in employment,
withholding income tax and sales tax collections continue to meet or surpass their targets.
• Without further strengthening in the State’s economy, revenue for the second quarter could struggle to meet the modest target increases relative to the first quarter’s target.
• Most economists believe the economic recovery is regaining strength. Unfortunately, economic activity will be weak, which means unemployment will remain elevated.

2
How Does 2011-12 Revenue Look So Far?
• Collections through October are $115 million above the $6.2 billion target. The surplus is $35 million less than was reported last month. – October missed the revenue target by an estimated $10
million, primarily because business tax collections missed this month’s target.
– The rest of the surplus reduction is due to a larger than estimated September sales tax distribution to local governments1.
1 The local government’s share of gross sales tax collections is estimated at the end of the respective month with the actual distribution reported at the end of the following month.

3
How Does 2011-12 Revenue Look So Far?• Tax revenue is $122 million above target. This is primarily due
to the strength in personal income tax collections. – Business taxes (Franchise and Corporate Income) lost a little
ground in October, but remain on target for the first four months.
– Sales Tax collections are also on target for the first four months of the fiscal year.
• Non-tax revenue, which make up about 3% of total General Fund revenues at this time of year, are down $7 million.
• Current economic conditions drive revenues during the first-half of the fiscal year. Volatile revenue sources from taxpayers’ previous investments show up in the second half of the fiscal year.

4
How Does 2011-12 Revenue Look So Far?
Target 2011-12
Actual 2011-12
Actual 2010-11
Tax Revenue $5,887 $6,009 $5,921*
Non-Tax & Transfers
$263 $256 $185
Total General Fund Revenue
$6,150 $6,265 $6,106*
• Fiscal Year-to-Date Revenue ($ millions)
* Includes higher sales tax collections from the temporary 1-cent sales tax increase.

5
How Does 2011-12 Revenue Look So Far?
• Economy-based taxes reflect some of the underlying improvements in the economy:– Gross baseline sales tax growth for July-October is
up 9.2% vs. 2.3% growth last year.– Withholding tax collections are improving and are up
5.1% over last year. The growth in withholding is not entirely consistent with the current employment picture.
– Employment conditions remain very weak. State employment growth, which once appeared to be gaining momentum, has stalled (see pages 10-12).

6
Key Revenue Collection Trends: Sales Tax
Baseline Collections (adjusted for tax law changes) surpass the long-run average growth of 5%.

7
Key Revenue Collection Trends: Sales Tax
Sales Tax Collections have experienced positive monthly increases going back to July of 2010. On a per capita basis, however, collections are on par with the 4th quarter of 2004. This is well below the peak in 2007.

8
Key Revenue Collection Trends: Personal Income Tax
• Recent wage and salary withholding collections, a key revenue source representing 40% of total General Fund revenue, continue to improve with year-over-year growth in the last five quarters.
• Through October, total personal income (including both withholding and non-withholding) are up 6.7%. This time last year, they were down by 0.2%. – Collections increased 4.1% in October compared with last
year.
• Caution is warranted as job growth remains stagnant. Ultimately, employment gains will be needed to sustain yearly growth similar to October’s.

9
Key Revenue Collection Trends:Withholding
Wage & Salary income tax withholding has been very responsive to the modest increase in incomes. Since the 4th quarter of 2010, there has been steady growth. The 4-month moving average for the third quarter of 2011 was 7.1%.

10
Key Revenue Collection Trends• Employment remains the key to a sustained recovery and an
improving revenue picture.• When compared to September of last year, only 4,200 more
people are employed in the State. This means the State still has nearly 300,000 fewer jobs than before the start of the recession in 2007.– According to industry employment data, provided by the NC
Employment Security Commission, private, non-farm employment increased by 26,200 jobs. This was offset with Government sector losses of 21,400.
– Only the Professional and Business Services industry sector posted significant yearly gains.
– The Government sector losses are not unexpected given that they typically have lagged one or two years behind private sector losses. What makes these losses stand out is the absence of private sector jobs to pick up the slack.

11
Key Revenue Collection Trends
Source: North Carolina Employment Security Commission
There has been little rebound in employment. The temporary uptick from Census jobs can be seen in the early summer of 2010 (the dotted line is an FRD estimate of total employment without the census uptick). The uptick begun in early 2011 stalled with global concerns and rising gas prices.
Total Employment (seasonally adjusted, thousands)

12
Key Revenue Collection Trends
Initial claims, a measure of the number of jobless claims filed by individuals seeking to receive State jobless benefits, have dropped significantly since the onset of the recession. They are slightly elevated above the pre-recession levels of 2007.

13
Key Revenue Collection Trends• Will employment conditions improve this fiscal year?
– The National Association of Business Economists’ most recent industry survey indicated “planned business hiring” has weakened. Only 30% of respondents indicated they would be hiring over the next six months. The good news is that only 13% of the respondents expect to cut employment over the next year.
– The importance of the global economy was highlighted in the survey with more than half of the respondents indicating that some portion of their firm’s sales came from foreign markets.
– The Bureau of Labor Statistics reports that temporary employment has picked up over the past four months. Temporary employment is generally a precursor to permanent job hiring.
– Based on our analysis, it will take one to two more quarters of modest economic growth, coupled with global stabilization, in order to favorably tip the scale for businesses to move forward with their hiring decisions.

14
Revenue: Risks to the ForecastPressure on meeting the revenue forecast has increased as growth stalls and the economy weakens . Since the revenue forecast was produced in March, the State’s economic forecast for this fiscal year has been downgraded.
FY 2011-12 Forecast March OctoberGross State Product 5.4% 3.9%
Wage & Salary Income 5.2% 4.5%
Employment 2.1% 0.5%
Unemployment Rate 9.2% 10.1%
Retail Sales 6.0% 5.2%

15
Revenue: Things to Watch• The budget revenue forecast was built on a scenario where the
State’s economic conditions would continue to improve each quarter of the fiscal year.
• Despite weaker than expected economic conditions for the first quarter, revenues exceeded expectations. For continued improvement to occur the State’s employment prospects will have to brighten.– Since the third quarter of 2009, the economy has been growing, and it is
estimated to have grown at an annualized rate of 2.5% in the third quarter of 2011. The most recent report from the Federal Reserve expects growth over the next six months to fall below that pace.
– This is a very sluggish growth scenario. The key to the problem continues to be related to the housing market and consumer demand. Until the housing market heals, a robust economic expansion will remain on the sidelines. The bursting of the housing bubble wiped out nearly $11 trillion in net worth, damaging household balance sheets. The repair to household balance sheets is taking a long time and a recessionary housing market prolongs the process.

16
Key Economic Trends
The real estate market’s main effect on household balance sheets has been the loss in housing value. The median family home in North Carolina has fallen in value by 10% or approximately $15,000. The dotted line traces the long range trends established in the 1990s. The gap in value is nearly $20,000 below what the owner of a median priced home might have expected.
Source: Moody’s Analytics, National Association of Realtors

17
Revenue: Things to Watch• Recovery from a financial crisis, one that wiped out trillions of
dollars of net worth, was expected to follow this slow path to a full recovery. Few, however, expected that gains in the economy would take this long to materialize.
• The November meeting of the Federal Reserve’s Open Market Committee expects to keep interest rates low through 2014. The result of their slow economic growth forecast that will keep the national unemployment rate well above 8%.
• This suggest that the Feds expect the financial deleveraging by households, businesses, and governments to continue six years, possibly stretching to seven years, after the onset of the Great Recession.

18
Revenue: Things to Watch• The housing market appears to be near the bottom in terms of
decline; however, with above normal foreclosures and fewer eligible buyers we still have more houses available than buyers. Housing prices are expected to bottom out this year, but unfortunately little or no rebound in prices is expected for 2012.
• This is one of the key reasons the risk to recession remains elevated. Many economist still hold out a 30% possibility of another economic downturn in the near future. In recent months the risk had elevated to as high as 50% resulting from spiking gas prices and Eurozone debt issues.
• The economy will continue to be weak, and thus, susceptible to mild economic shocks.
19
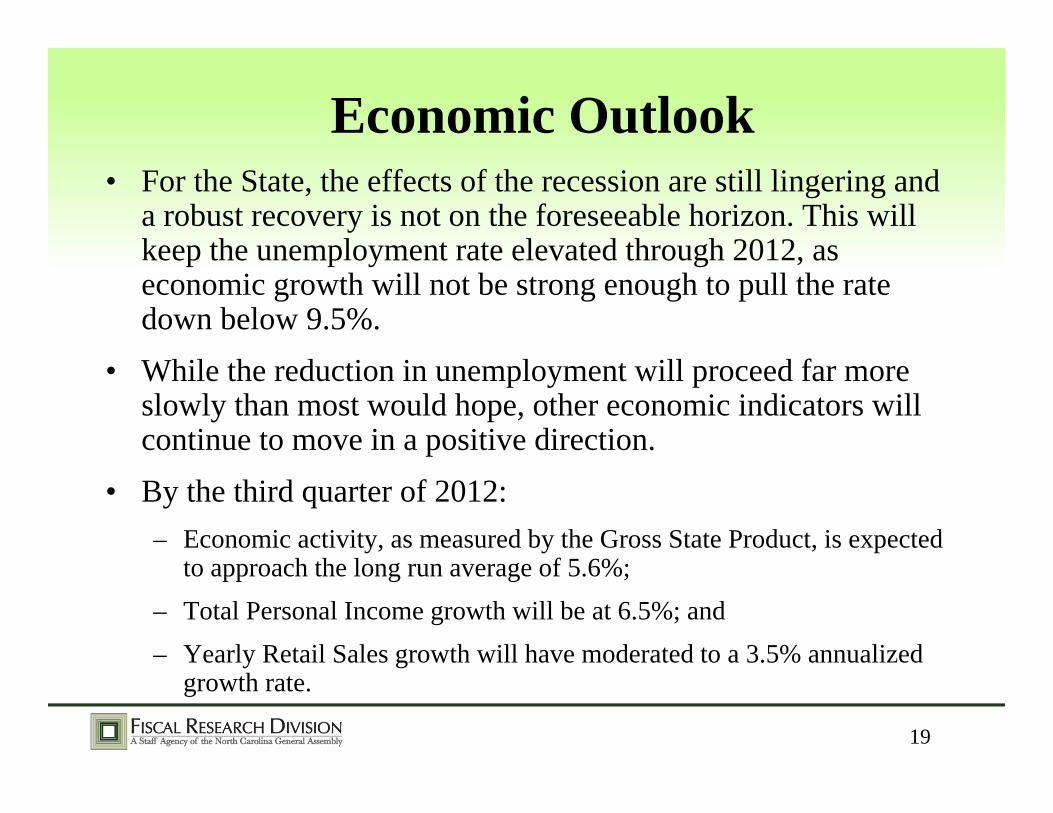
Economic Outlook• For the State, the effects of the recession are still lingering and
a robust recovery is not on the foreseeable horizon. This will keep the unemployment rate elevated through 2012, as economic growth will not be strong enough to pull the rate down below 9.5%.
• While the reduction in unemployment will proceed far more slowly than most would hope, other economic indicators will continue to move in a positive direction.
• By the third quarter of 2012: – Economic activity, as measured by the Gross State Product, is expected
to approach the long run average of 5.6%;– Total Personal Income growth will be at 6.5%; and– Yearly Retail Sales growth will have moderated to a 3.5% annualized
growth rate.

20
Economic Outlook
The forecast for the unemployment rate is shaded in gray.
Historical Average

21
Conclusions• An improving economy will be needed to continue meeting the
monthly revenue targets. • Many of the volatile revenue sources do not show up until the second
half of the fiscal year.– Key collections from corporations and final payments from wealthy taxpayers
including S-corps and LLCs often lead to big swings in collections during April, which is when these payments and refunds are reported.
• Gradual improvements are expected, yet meaningful signs of a recovery in employment may not begin to materialize for another year.
• The economy has proven capable of fending off mild economic shocks such as the energy price spikes and supply disruptions this spring, although these shocks did put a drag on the recovery. If economic conditions can continue to bounce back and move down the path of steady improvement, then the fear of a downturn over the near term from another mild shock will lessen.