General enquiries on this form should be made...
28
General enquiries on this form should be made to: Defra, Science Directorate, Management Support and Finance Team, Telephone No. 020 7238 1612 E-mail: [email protected] SID 5 Research Project Final Report SID 5 (2/05) Page 1 of 28
Transcript of General enquiries on this form should be made...

General enquiries on this form should be made to:Defra, Science Directorate, Management Support and Finance Team,Telephone No. 020 7238 1612E-mail: [email protected]
SID 5 Research Project Final Report
SID 5 (2/05) Page 1 of 20
NoteIn line with the Freedom of Information Act 2000, Defra aims to place the results of its completed research projects in the public domain wherever possible. The SID 5 (Research Project Final Report) is designed to capture the information on the results and outputs of Defra-funded research in a format that is easily publishable through the Defra website. A SID 5 must be completed for all projects.
A SID 5A form must be completed where a project is paid on a monthly basis or against quarterly invoices. No SID 5A is required where payments are made at milestone points. When a SID 5A is required, no SID 5 form will be accepted without the accompanying SID 5A.
This form is in Word format and the boxes may be expanded or reduced, as appropriate.
ACCESS TO INFORMATIONThe information collected on this form will be stored electronically and may be sent to any part of Defra, or to individual researchers or organisations outside Defra for the purposes of reviewing the project. Defra may also disclose the information to any outside organisation acting as an agent authorised by Defra to process final research reports on its behalf. Defra intends to publish this form on its website, unless there are strong reasons not to, which fully comply with exemptions under the Environmental Information Regulations or the Freedom of Information Act 2000.Defra may be required to release information, including personal data and commercial information, on request under the Environmental Information Regulations or the Freedom of Information Act 2000. However, Defra will not permit any unwarranted breach of confidentiality or act in contravention of its obligations under the Data Protection Act 1998. Defra or its appointed agents may use the name, address or other details on your form to contact you in connection with occasional customer research aimed at improving the processes through which Defra works with its contractors.
Project identification
1. Defra Project code SP 0411
2. Project title
DOCUMENTING SOIL EROSION RATES ON AGRICULTURAL LAND IN ENGLAND AND WALES
3. Contractororganisation(s)
Department of Geography,University of Exeter
54. Total Defra project costs £ 212230.42
5. Project: start date................ 1/07/03
end date................. 30/06/05
SID 5 (2/05) Page 2 of 20

6. It is Defra’s intention to publish this form. Please confirm your agreement to do so...................................................................................YES NO (a) When preparing SID 5s contractors should bear in mind that Defra intends that they be made public. They
should be written in a clear and concise manner and represent a full account of the research project which someone not closely associated with the project can follow.Defra recognises that in a small minority of cases there may be information, such as intellectual property or commercially confidential data, used in or generated by the research project, which should not be disclosed. In these cases, such information should be detailed in a separate annex (not to be published) so that the SID 5 can be placed in the public domain. Where it is impossible to complete the Final Report without including references to any sensitive or confidential data, the information should be included and section (b) completed. NB: only in exceptional circumstances will Defra expect contractors to give a "No" answer.In all cases, reasons for withholding information must be fully in line with exemptions under the Environmental Information Regulations or the Freedom of Information Act 2000.
(b) If you have answered NO, please explain why the Final report should not be released into public domain
Executive Summary7. The executive summary must not exceed 2 sides in total of A4 and should be understandable to the
intelligent non-scientist. It should cover the main objectives, methods and findings of the research, together with any other significant events and options for new work.There is currently a general lack of reliable information on rates of soil loss from agricultural land in the UK for use in assessing soil erosion problems and in the development, calibration and validation of national scale models for predicting soil loss and sediment delivery from agricultural land. Traditional methods of erosion rate assessment involve many deficiencies and limitations and the use of environmental radionuclides, and more particularly bomb-derived caesium-137 (Cs-137), offers an effective alternative means of assembling such data. The Cs-137 approach has been validated and used in many areas of the world and offers a unique means of assembling retrospective information on longer-term soil erosion rates on the basis of a single site visit. To date, however, the Cs-137 approach has been primarily used for detailed investigations of individual fields and there remains an important need to develop and test protocols for extending the use of the approach to an essentially reconnaissance level, that can be applied at the national scale. The aim of this project was to pilot the extension of the use of the Cs-137 approach to the reconnaissance level and thus to make it applicable at the national scale, and to commence the assembling of a national database comprising medium-term estimates of both gross and net soil loss for a representative range of soil textures and terrain types within England and Wales. The project was conceived as the first phase of a two-phase investigation aimed at producing a national scale inventory of soil erosion and developing soil erosion indicators. The focus of this first phase was on the development and testing of protocols for using Cs-137 measurements for erosion rate assessment at the reconnaissance level and initiating the assembly of a national database, and thus providing ‘proof of concept’.
The scientific objectives of the project remained unaltered from the original contract (CSA 6362) and were as follows:1) To develop protocols for using the Cs-137 technique for assembling national scale information on rates of both gross and net soil loss from agricultural land. 3) To use the protocols developed in (1) above to commence the assembly of a national database on 4) To explore the potential for extrapolating data of the type assembled in (3) above to support national scale soil erosion assessments.All objectives were successfully achieved and an extension of the project to undertake the second phase of the investigation was approved by DEFRA in June 2005.
Key achievement of the project are as follows:1. Development of protocols for employing the Cs-137 technique at the reconnaissance level for
national scale soil erosion assessment. The primary objective was to provide protocols that would minimise the number of soil cores that needed to be collected from a field and analysed, whilst still providing a reliable assessment of both the gross and net erosion rate associated with that field. Important questions that needed to be addressed included the criteria for selecting the fields to be sampled, the number of cores to be collected from a field, the position of those cores within the field, and the procedure to be used for estimating the gross and net erosion rates for the sampled field. Detailed protocols based on a single sampling transect and covering these and other issues
SID 5 (2/05) Page 3 of 20

have been produced. 2. Validating the proposed protocols. The protocols developed for the single transect approach were
successfully validated by comparing the estimates of gross and net erosion rate obtained from the single transect with the equivalent values obtained for the same field using a dense sampling grid or multiple transects.
3. Testing the application of the protocols. The protocols developed and validated in (1) and (2) above were subsequently applied to a range of fields in Devon, Somerset and Dorset, selected to provide representative examples of a range of erosion rates, based on existing erosion hazard assessments. The results obtained conformed closely to existing understanding of the absolute and relative erosion rates in the sampled fields and confirmed the viability of the approach.
4. Applying and testing the protocols at a range of locations in Southern England. This second stage of testing focussed on the wider implementation of the approach and the need to develop generic guidelines and procedures for establishing key parameters associated with the use of Cs-137 measurements to estimate erosion rates. These included reference inventories, tillage depths, Cs-137 depth distributions at uncultivated sites and grain size correction factors. All were dealt with successfully.
5. Assembling a database of estimates of gross and net soil loss for agricultural land in southern England, representative of a range of land use, soil texture and terrain characteristics and exploring the key controls on erosion rates. The data collected within (4) above were used to establish this database, which was in turn used to explore the influence of land use, soil texture and slope gradient on erosion rates. Clear contrasts were apparent between both gross and net erosion rates in cultivated and pasture fields, with the values for cultivated fields being significantly greater. Soil texture was seen to exert an important control on erosion rates, with maximum values associated with silt loam soils and lowest values with clay soils. Whilst apparent at the local scale, the effects of slope gradient were less easy to discern at the regional scale, due to the important influence of other variables such as soil texture and land use.
6. Data comparisons. It is important to recognise that estimates of erosion rate are, to a degree, operationally defined. Nevertheless, the data collected in this study were found to be highly consistent with other information on erosion rates available for various sites in southern England and past work involving Cs-137 measurements.
The successful completion of the project provided clear confirmation of the potential for using the Cs-137 approach at the reconnaissance level to assemble a national scale data base of gross and net erosion rates for fields characterized by a range of land use, soil texture, topography and hydrometeorological conditions. A proposal for the second phase of the project was approved by DEFRA and this commenced in July 2005.
Project Report to Defra8. As a guide this report should be no longer than 20 sides of A4. This report is to provide Defra with
details of the outputs of the research project for internal purposes; to meet the terms of the contract; and to allow Defra to publish details of the outputs to meet Environmental Information Regulation or Freedom of Information obligations. This short report to Defra does not preclude contractors from also seeking to publish a full, formal scientific report/paper in an appropriate scientific or other journal/publication. Indeed, Defra actively encourages such publications as part of the contract terms. The report to Defra should include: the scientific objectives as set out in the contract; the extent to which the objectives set out in the contract have been met; details of methods used and the results obtained, including statistical analysis (if appropriate); a discussion of the results and their reliability; the main implications of the findings; possible future work; and any action resulting from the research (e.g. IP, Knowledge Transfer).
8.1 PROJECT OBJECTIVES
There is currently a general lack of reliable information on rates of soil loss from agricultural land in the UK for use in assessing soil erosion problems and in the development, calibration and validation of national scale models for predicting soil loss and sediment delivery from agricultural land. Traditional methods of erosion rate assessment involve many deficiencies and limitations and the use of environmental radionuclides and more particularly caesium-137 (Cs-137) offers an effective alternative
SID 5 (2/05) Page 4 of 20
means of assembling such data. The Cs-137 approach has been validated and used in many areas of the world (see Zapata, 2002) and offers a unique means of assembling retrospective information on longer-term soil erosion rates on the basis of a single site visit. To date, however, the Cs-137 approach has been primarily used for detailed investigations of individual fields and there remains an important need to develop and test protocols for extending the use o the approach to an essentially reconnaissance level that can be applied at the national scale. The aim of this project was to pilot the extension of the use of the Cs-137 approach to the reconnaissance level and thus to make it applicable at the national scale, and to commence the assembling of a national database comprising medium-term estimates of both gross and net soil loss for a representative range of soil textures, terrain types and hydrometeorological conditions within England and Wales.
The scientific objectives of the project are unaltered from the original contract (CSA 6362) and are as follows:
Objective 1. To develop protocols for using the Cs-137 technique for assembling national scale information on rates of both gross and net soil loss from agricultural land.
Objective 2. To test and ‘validate’ the protocols developed in (1) above.
Objective 3. To use the protocols developed in (1) above to commence the assembly of a national database on rates of gross and net soil loss from agricultural land characterised by different soil types, different terrain characteristics and different land use, by producing a database for southern England.
Objective 4. To explore the potential for extrapolating data of the type assembled in (3) above to support national scale soil erosion assessments.
8.2 PROJECT BACKGROUND AND ACHIEVEMENT OF OBJECTIVES
The project proceeded according to plan and achieved all the original objectives. The project was originally conceived as part of a 2-phase investigation aimed at developing the use of Cs-137 measurements for reconnaissance assessment of gross and net soil erosion rates and applying this approach to assemble a national scale database on soil erosion rates. The first phase of the investigation, represented by this project, focussed on developing and testing the protocols for using Cs-137 measurements in a reconnaissance mode and commencing the assembly of a national data-base of erosion rates. It was therefore seen as providing ‘proof of concept’ for a second phase of work that would focus on assembling information on rates of gross and net soil loss from a range of fields within England and Wales, representative of a wide range of physiographic and land use conditions. This information would in turn be used to identify the key controls on rates of soil loss at the national scale and to provide the basis for developing prediction models and indicator tools for use in developing a national inventory or assessment of soil erosion. Based on the success of the first phase of the investigation, the second phase was recently been funded as project SP0413, which commenced in July 2005. The primary focus of the work undertaken by project SP0411 was therefore the development, testing and initial application of protocols for applying the Cs-137 technique for assessing soil erosion rates in reconnaissance surveys. Previous applications of the Cs-137 technique by the authors and other workers, both in the UK and overseas, had focussed primarily on intensive sampling of small areas (i.e. individual fields) and examination of detailed patterns of soil redistribution within those areas (cf. Zapata, 2002). Typically, 50-200 samples might be collected from a field using either a series of transects or a sampling grid. Both manpower requirements for sampling and the costs of sample analysis limits the use of this approach to individual fields or small areas and thus effectively precluded its use for reconnaissance surveys and national-scale data collection. In this project, attention has been directed to devising protocols that would permit the use of a limited number of samples to produce reliable estimates of both gross and net erosion rates for individual fields. Successful development and
SID 5 (2/05) Page 5 of 20

testing of these protocols was seen as a precursor to their use to collect soil erosion data from representative sites on agricultural land, in order to document national patterns of soil loss related to soil type, terrain characteristics and land use. The objectives of this project are therefore of direct relevance to DEFRA’s goal of monitoring the extent of soil erosion at the national scale, protecting and managing the soil resource, and providing advice to farmers on remedial measures and practices.
8.3 METHODS AND RESULTS
8.3.1 Development of Sampling Protocols:
Development of the protocols for reconnaissance sampling required the following three questions to be addressed:
1) Within a designated area, which fields should be targeted for sampling?2) Within a selected field, how many soil cores should be collected and from where should they be
taken? 3) Based on the Cs-137-derived estimates of erosion and deposition rate obtained for the individual
samples collected from a selected field, how should the gross and net erosion rate for the field be estimated?
Taking into account existing understanding of soil erosion processes and the use of the Cs-137 technique to document the resulting erosion and deposition rates, a three-stage protocol was developed for using a limited number of samples from a field to assemble representative and consistent data at the reconnaissance level. This involves selection of fields for sampling based on erosion risk, designation of the number and the position of the soil cores to be collected, based on the slope characteristics, and a numerical procedure for deriving representative field-scale estimates of gross and net erosion. The associated protocols for each of these three components are briefly described below.
(a) Field Selection:
In order to reduce the amount of sampling required to establish local reference inventories, where possible a small cluster of fields from a single farm or adjacent farms, but with, for example, different soil types, topography or land use, should be targeted for sampling. Fields selected for sampling should meet the following requirements:
(a) Linear contours, so that the terrain can be represented by a single sampling transect.(b) A maximum slope gradient greater than 3 degrees.(c) A documented land use history.(d) No sediment inputs from upslope fields or road networks.(e) Representative in terms of land use, terrain and soil properties.
(f) Easy access and farmer(s) cooperation.
For each field selected, background information regarding farm type, land use history (e.g. rotation scheme), plough depth and field boundary conditions should be recorded with the farmer’s help.
(b) Number and position of cores:
To obtain maximum information from a limited number of core samples collected within a field, the cores should be located along a single mid-field downslope transect, following the flow line. The individual coring points should be positioned to reflect downslope changes in erosion and deposition rates and their selection should be based on existing knowledge regarding the relationship between erosion and deposition rates and terrain characteristics. The siting of coring points on a hypothetical slope is illustrated in Figure 1. Changes in slope along the transect exert an important control, with additional coring points being located near boundaries and areas where deposition is expected. With an increase in field size and terrain complexity, the number of cores should be increased. As a general guideline, between 10 and 15 cores would normally be required. Reference cores should be collected from an adjacent field that meets the requirements for a reference site, or from the top of a sampled
SID 5 (2/05) Page 6 of 20

grass field, where no erosion or deposition would be expected. The latter has advantages, in that it can also provide information on potential across-slope variability within a field.
Figure 1: Location of sampling points on a typical slope
(c) Deriving representative erosion and deposition rates for sampled fields:
Assuming that estimates of erosion and deposition rates have been obtained for the coring points along the slope transect using existing conversion models (cf. Walling & He, 1999; Zapata et al., 2002) estimates of the gross and net soil loss from the field must be obtained from these data. Three algorithms have been developed to quantify the down-slope trend, namely, slope length-weighted histograms, cubic-spline curve fitting, and polynomial trend analysis. The first approach is the method commonly used to estimate the erosion and deposition rates for a field. The other two have been introduced to account for the irregularity of sample spacing. They have been implemented as Ms Excel Macros and tested on hypothetical slope profiles with simulated erosion and deposition rates. The test shows that the new algorithms perform well, if a sampling scheme such as that shown in Figure 1 is used. When only a limited number of samples has been collected, the cubic-spline curve-fitting algorithm has been shown to perform better than the other two algorithms, because it makes full use of the available data points and has more flexibility to accommodate changes in erosion / deposition rates occurring within a short distance. A procedure for deriving field-based soil loss data from the trend line has been developed.
A schematic representation of the overall protocol is presented in Figure 2.
8.3.2 Testing and validating the protocols
(a) Validating the transect sampling strategy:
Initial work on validating the protocols described above focussed on using existing detailed data sets of Cs-137 inventories available for individual fields with simple (rectilinear plan form) topography, in order to test the validity of the estimates of gross and net erosion obtained using a single transect coupled with a limited number of samples positioned according to the proposed sampling protocols. By using the detailed data sets to establish the spatial distribution of Cs-137 inventories within these fields and thus the pattern of soil redistribution (i.e. erosion and deposition), it was possible to calculate the spatially-averaged gross and net soil loss for the field. These values were used as the ‘actual’ erosion rates against which estimates derived from the more limited sampling programme, involving a single transect, could be assessed by direct comparison. This approach was also complemented by employing existing understanding of the spatial distribution of soil redistribution rates in agricultural fields (both cultivated and pasture), to model the likely spatial patterns involved and using these to provide estimates of the gross and net rates of soil loss, which could again be used as ‘actual’ values. This analysis confirmed the viability of the proposed approach. More detailed validation of the sampling protocols was provided by undertaking intensive sampling (multiple transects with closely spaced coring along the transects) for a number of fields in the local region selected according to the protocols outlined above and again using the results of the detailed sampling to provide an ‘actual’ value with which the value obtained from the standard sampling protocol could be compared. Some results from this exercise are presented in Table 1. Again these were judged to be highly encouraging.
SID 5 (2/05) Page 7 of 20

Figure 2: Flowchart for employing Cs-137 measurements at the reconnaissance level in England and Wales.
Table 1: A comparison of estimates of gross and net erosion rates obtained for individual fields using the proposed sampling strategy with those obtained from more detailed sampling involving multiple transects and grid sampling
SID 5 (2/05) Page 8 of 20

Location Land use Gross soil loss (t ha-1 year-1) Net soil loss ( t ha-1 year-1)Protocol Intensive
samplingProtocol Intensive
samplingCrediton Arable 6.2 7.1 0.7 0.6Yeovil Arable 9.7 8.7 5.7 6.3Yeovil Grass 2.1 1.7 0.2 0.2Cadeleigh Grass 0.6 0.4 0 0Crediton Arable 8.3 9.1 3.6 4.4Cadeleigh Arable 6.2 5.4 0.5 0.8
(b) Testing the overall approach:
For this component of the work, the protocols described above were employed to collect data from 39 fields in Devon, Dorset and Somerset, with a view to confirming the ability of the reconnaissance approach to provide data consistent with current understanding of the spatial variability of erosion risk, according to soil type, terrain characteristics and land use. With the aid of erosion risk maps produced by MAFF, SSLRC and ADAS, a selection of grass and arable fields in Devon, Somerset and Dorset, representative of soils with a wide range of textures was identified. Several fields that had been under maize and potatoes for more than 10 years were included in this selection. The locations of the 39 fields are shown in Figure 3.
Figure 3: The spatial distribution of sampling sites within Devon, Somerset and Dorset used for validation of the proposed protocols.
Soil cores for Cs-137 analysis were collected from the sampled fields using a purpose-built steel corer with a cross-sectional area of 38 cm2, which was driven into the soil to a depth of 50-60 cm, using a petrol-driven percussion drill. At selected points, additional cores were collected using a corer fitted with a larger 80 cm2 plastic core tube, in order to facilitate removal and sectioning of the core to establish the Cs-137 depth distribution. Additional samples of surface soil were collected from different parts of each field, in order to characterize the soil texture. Coring point locations were recorded using a Leica GPS500 system, that provided a relative positioning accuracy of ca. ± 2cm. All survey coordinates were converted to national grid references, to facilitate their integration with existing national spatial datasets.
SID 5 (2/05) Page 9 of 20
a) Permanent grass field with median slope of 10 degrees
b) Arable field with median slope gradient of 7 degrees
c) Arable field with median slope gradient of 11 degrees
Figure 4: Slope profiles and Cs-137 residuals for three fields with contrasting characteristics, located at a site near Exeter.
All samples were oven-dried, manually or mechanically disaggregated, and sieved to < 2 mm. The < 2 mm fraction was sub-sampled for 137Cs analysis in the Environmental Radioactivity Laboratory in the Department of Geography at the University of Exeter. Samples were counted for at least 25 000 seconds or more to provide a precision of better than ±10% at the 95% level of confidence. Because of the substantial number of samples involved, several detectors were employed for the gamma counting. To ensure consistency, the detectors were re-calibrated every month using standards of a known Cs-137 activity, to monitor and correct for any drift over time.
The estimates of gross and net soil loss obtained from the 39 fields were fully consistent with expectations and demonstrated the anticipated interaction of land use, terrain and soil characteristics. Erosion rates on grass fields were in most cases lower than arable fields and the downslope trends in soil redistribution documented for grass fields were generally less well-developed than for arable fields. Sandy soils were generally characterised by higher erosion rates than other soils, and steep slopes
SID 5 (2/05) Page 10 of 20

evidenced higher erosion rates than more gentle slopes. Plots of Cs-137 residuals (i.e. the deviation of the measured inventory from the reference inventory) for the transects from several sampled fields near Exeter, with different land use and slope gradients, are presented in Figure 4. These again show patterns consistent with existing knowledge and understanding of rates of soil loss from agricultural fields.
8.3.3 Applying and testing the approach more extensively in southern England
(a) The coverage of the field sampling programme
The field sampling programme associated with 8.3.2 above was subsequently extended to a wider area of southern England to test the protocols more broadly, whilst commencing the assembly of a national database of rates of gross and net soil loss from agricultural fields characterised by different soil types, terrain characteristics and land use. A range of representative sites were selected by reference to erosion risk maps produced by MAFF(Marks et al., 1997), ADAS (Richardson & Goodlass, 1997), and SSLRC (1993), and other spatial datasets. Including the fields in Devon, Somerset and Dorset represented in Figure 3, a total of 140 fields were sampled across southern England and their locations are shown in Figure 5. During the farm visits, relevant background information on land use and management was obtained from the farmers or landowners. This included information on tillage depth, planting directions, rotation schemes, etc. A summary of the characteristics of the sampled fields is provided in Table 2 and their coverage of different soil textures is shown in Figure 6.
Figure 5 The spatial distribution of the sampling sites.
Table 2 Topographic characteristics of the sampled fields
Summary
statistics
Elevation
(m)
Slope
(degrees)
Relief
(m)
Field length
(m)
Convexity
ratio*
Maximum 227.6 13 57.8 520.9 0.94
Minimum 14.2 2.7 8.9 85.5 0.3
Average 109.3 5.53 26.3 200.6 0.57
CV (%) 46 32 41 44 27
* the proportion of the slope length characterized by convexity.
SID 5 (2/05) Page 11 of 20

Figure 6 Grouping of the sampled fields by soil texture
(b) Reference inventories
The reference inventory is a critical parameter for deriving estimates of erosion and deposition rates within the sampled fields. It assumes increased significance in reconnaissance level investigations, since the reference inventory has to be determined for each sampling location. In this investigation, reference inventories were established for 43 locations. At each reference site, five to six cores were collected, in order to obtain a representative value. In most cases, flat areas of fields under permanent pasture were used as reference sites. In view of the emphasis of the sampling programme on southern England, Chernobyl inputs were assumed to be negligible for most sites. The measured reference inventories ranged from 160 to 350 mBq cm-2, with a coefficient of variation of 24.8%. The variation of the magnitude of the reference inventories between sites was closely linked to variations in mean annual precipitation and a well defined positive relationship was established between the two variables (see Figure 7). However, the associated regression relationship is characterized by significant scatter, reflecting the influence of controls other than mean annual rainfall, and explains less than half of the variance of the inventory values. The relationship is therefore of limited value for predicting the reference inventory for individual study sites and direct measurements of the reference inventory at the individual sampling locations was deemed to be essential. Since most of the bomb-derived Cs-137 fallout occurred in the late 1950s and 1960s, a measure of the mean annual precipitation during this period may provide a better predictor of the measured inventories than the long-term mean annual precipitation.
Figure 7 The relationship between the magnitude of the reference inventories measured at the sampling locations in southern England and mean annual precipitation.
SID 5 (2/05) Page 12 of 20

(c) Tillage depths for cultivated fields
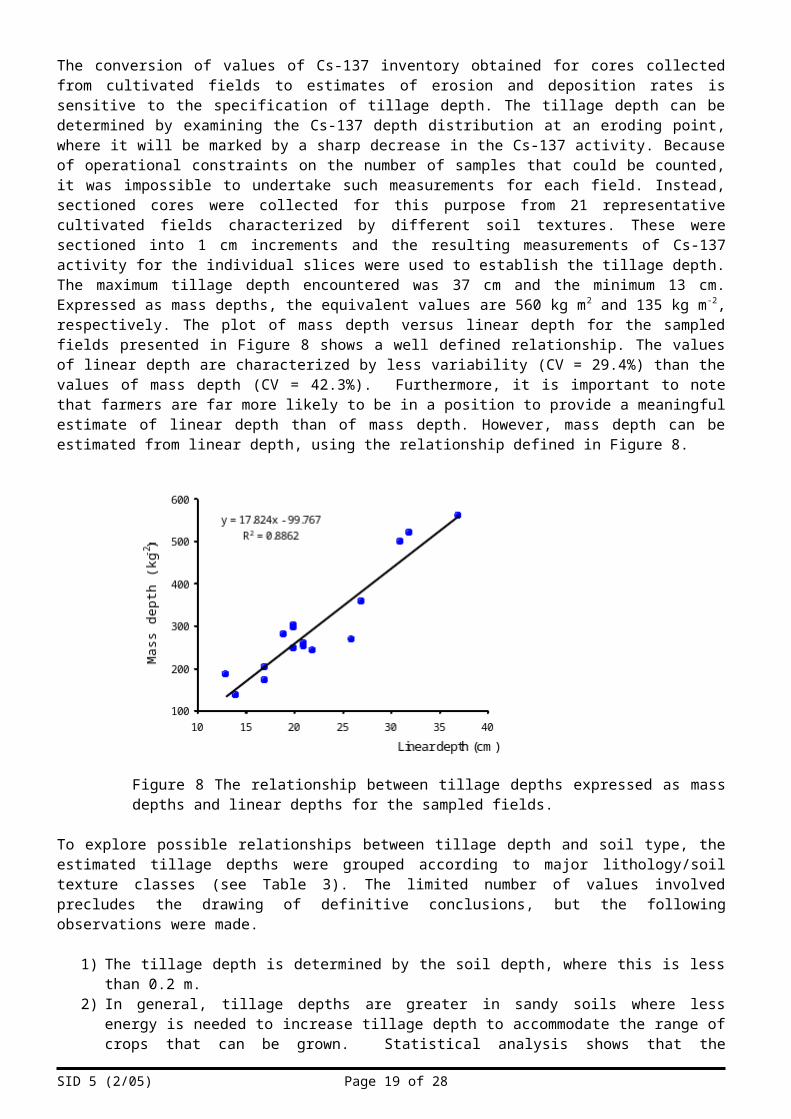
The conversion of values of Cs-137 inventory obtained for cores collected from cultivated fields to estimates of erosion and deposition rates is sensitive to the specification of tillage depth. The tillage depth can be determined by examining the Cs-137 depth distribution at an eroding point, where it will be marked by a sharp decrease in the Cs-137 activity. Because of operational constraints on the number of samples that could be counted, it was impossible to undertake such measurements for each field. Instead, sectioned cores were collected for this purpose from 21 representative cultivated fields characterized by different soil textures. These were sectioned into 1 cm increments and the resulting measurements of Cs-137 activity for the individual slices were used to establish the tillage depth. The maximum tillage depth encountered was 37 cm and the minimum 13 cm. Expressed as mass depths, the equivalent values are 560 kg m2 and 135 kg m-2, respectively. The plot of mass depth versus linear depth for the sampled fields presented in Figure 8 shows a well defined relationship. The values of linear depth are characterized by less variability (CV = 29.4%) than the values of mass depth (CV = 42.3%). Furthermore, it is important to note that farmers are far more likely to be in a position to provide a meaningful estimate of linear depth than of mass depth. However, mass depth can be estimated from linear depth, using the relationship defined in Figure 8.
Figure 8 The relationship between tillage depths expressed as mass depths and linear depths for the sampled fields.
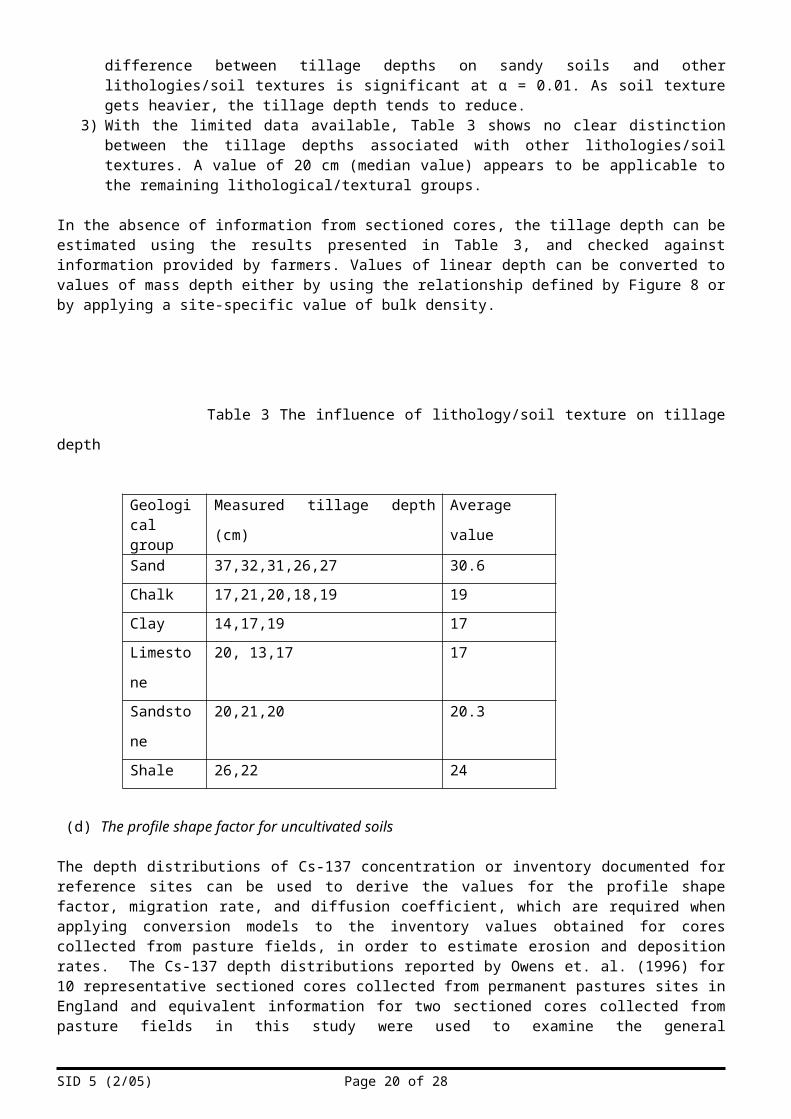
To explore possible relationships between tillage depth and soil type, the estimated tillage depths were grouped according to major lithology/soil texture classes (see Table 3). The limited number of values involved precludes the drawing of definitive conclusions, but the following observations were made.
1) The tillage depth is determined by the soil depth, where this is less than 0.2 m. 2) In general, tillage depths are greater in sandy soils where less energy is needed to increase
tillage depth to accommodate the range of crops that can be grown. Statistical analysis shows that the difference between tillage depths on sandy soils and other lithologies/soil textures is significant at α = 0.01. As soil texture gets heavier, the tillage depth tends to reduce.
3) With the limited data available, Table 3 shows no clear distinction between the tillage depths associated with other lithologies/soil textures. A value of 20 cm (median value) appears to be applicable to the remaining lithological/textural groups.
In the absence of information from sectioned cores, the tillage depth can be estimated using the results presented in Table 3, and checked against information provided by farmers. Values of linear depth can be converted to values of mass depth either by using the relationship defined by Figure 8 or by applying a site-specific value of bulk density.
SID 5 (2/05) Page 13 of 20

Table 3 The influence of lithology/soil texture on tillage depth
Geological group
Measured tillage depth (cm) Average value
Sand 37,32,31,26,27 30.6
Chalk 17,21,20,18,19 19
Clay 14,17,19 17
Limestone 20, 13,17 17
Sandstone 20,21,20 20.3
Shale 26,22 24
(d) The profile shape factor for uncultivated soils
The depth distributions of Cs-137 concentration or inventory documented for reference sites can be used to derive the values for the profile shape factor, migration rate, and diffusion coefficient, which are required when applying conversion models to the inventory values obtained for cores collected from pasture fields, in order to estimate erosion and deposition rates. The Cs-137 depth distributions reported by Owens et. al. (1996) for 10 representative sectioned cores collected from permanent pastures sites in England and equivalent information for two sectioned cores collected from pasture fields in this study were used to examine the general characteristics of such depth distributions. An exponential function taking the form:
(Eq. 1)
has been widely used to describe such depth distributions, where y is the measured activity in mBq cm-
2, x is the linear depth in cm, and a and b are site-specific parameters. Using the fitted equation, the profile shape factor can be estimated from b, taking account of soil bulk density. Values of the parameter a, as well as the profile shape factor, obtained for the 12 documented profiles are presented in Table 4. The exponential function can be seen to provide a good representation of most (9 out of 12) of the profiles, where the r2 values exceed 0.8. No clear relationship between the derived profile shape factors and soil texture was apparent. The
Table 4 Parameters of the exponential depth distribution (Eq. 1)Fitted to the Cs-137 depth distributions for uncultivated soils.
Profile b Profile shape factor r2 for Eq. 1 fit
1 0.153 50 0.8669
2 0.135 57 0.882
3 0.115 67 0.813
4 0.089 86 0.841
5 0.178 43 0.864
6 0.119 64 0.898
7 0.091 85 0.431
8 0.158 49 0.77
9 0.122 63 0.73
10 0.169 46 0.873
11 0.114 67 0.854
12 0.135 57 0.877
SID 5 (2/05) Page 14 of 20

profile shape factor values listed in Table 4 are also little higher than those recommended by Walling and He (1999) who suggested that they were likely to lie in the range 30 to 50. In the absence of any confirmed relationship between the profile shape factor and soil texture, the average value derived from all sectioned cores (ie. 61) was used to represent the profile shape factor for pasture fields within the current investigation. This value was, however, adjusted for bulk density.
(e) The particle size correction factor
Water erosion is frequently a selective process, wherein fine particles are preferably mobilized by erosion and the coarser fractions of the mobilized sediment are more likely to be deposited. Since the strong affinity of Cs-137 for fine soil particles is well known, a particle size correction factor is frequently incorporated into conversion models, to take account of the grain size selectivity of erosion and deposition. Specific surface areas (SSA) is often used as a simple summary measure of the grain size distribution of soils and sediments, when estimating particle size correction factors. Measurements of SSA were undertaken on surface samples from 52 representative fields from which cores had been collected. These samples covered a wide range of soil textures, with the values of percentage sand, silt and clay being characterized by coefficients of variation of 32%, 12% and 30%, respectively. For these samples SSA was closely related to clay content (See Figure 9).
Figure 9 The relationship between SSA and clay content for surfacesamples collected from the 52 fields.
In an attempt to identify the likely significance of size selective erosion and deposition within the study fields, a comparison was made between the SSA values associated with eroding and depositional areas, with the ratio of the latter to the former being calculated. The results presented in Figure 10 indicate that in most fields there is little evidence of size selective erosion and deposition, with more than 80% of the fields being characterized by ratio values < 1.2. The few fields that have higher values are mostly on sandy silt loams, where higher erosion rates were found (see Section 8.3.4(c)). The measured SSA ratios were used in specifying the particle size correction factors required by the conversion models employed to derive estimates of erosion and deposition rates from the inventories measured for individual cores.
8.3.4 Assembling a database of rates of gross and net soil loss from agricultural land in southern England characterized by a range of soil types, terrain characteristics and land use and exploring the key controls on erosion rates
(a) Data processing
Soil redistribution rates were estimated for the soil cores collected from the individual fields and gross and net erosion rates have been calculated for each field using the procedures described in section 8.3.1(c). The gross erosion rate is calculated as the average erosion rate within eroding sections of the transect and the net erosion rate is calculated as the difference between total erosion and deposition divided by the transect or field length. The net erosion reflects sediment export from a field as it takes account of within-field deposition or storage.
SID 5 (2/05) Page 15 of 20

Figure 10 The range of SSA ratios documented for the sampled fields.
(b) The influence of land use on soil redistribution rates
To explore the influence of land use on the documented soil redistribution rates, these were grouped into two groups, representing cultivated fields and pasture fields. The relative frequency distributions of gross and net erosion on each group are shown in Figures 11 and 12, respectively. As expected, the estimates of medium-term erosion intensity provided by the Cs-137 measurements are substantially higher for the cultivated fields than for the pasture fields. The highest gross erosion rate recorded for a cultivated field is 16.7 t ha-1 year-1 and the median gross erosion rate for this group is 7.7 t ha -1 year-1. In contrast, the median value for the pasture fields is 1.3 t ha-1 year-1. For net rates of soil loss, the median values are 4.1 t ha-1 year-1 and 0.6 t ha-1 year-1, respectively. If, following Robinson & Blackman (1989), a soil loss tolerance of 1 t ha-1 year-1 is used and values of net soil loss are considered, it would seem that the land use practices of a substantial proportion of the pasture fields are sustainable in terms of maintaining the soil resource, but the rates of soil loss for most cultivated fields significantly exceed this critical level. The ratio of net erosion to gross erosion, which can be viewed as the sediment delivery ratio for a field, provides a median value of 0.6 for cultivated fields and 0.5 for pasture fields. Within-field storages is clearly significant in the gentle rolling terrain that characterizes most arable fields.
Figure 11 Relative frequency distribution of gross and net erosion rates for thesampled cultivated fields in southern England
SID 5 (2/05) Page 16 of 20

Figure 12: Relative frequency distribution of gross and net erosion rates for thesampled pasture fields in southern England
(c) The influence of soil texture on soil redistribution rates
To assess the influence of broad-scale variation of soil textures on soil redistribution rates, the percentage sand, silt, and clay contents of the soils of the sampled fields were extracted from a national soil dataset at a resolution of 1 km. For this analysis, only cultivated fields were considered. The individual fields were then classified into predefined texture groups, according to the methodology described by the British Standard for soil surveys. Four major soil texture groups were identified: clay, clay loam, silt loam, and sand loam. The results of this exercise are presented in Table 5, which demonstrates that erosion rates are highest on silt loam soils and lowest on clay soils. The Kruskal-Wallis test shows that, taking the dataset as a whole, there are statistically significant differences between the major texture groups at α = 0,05. There is, however, high variability within the texture groups and pair-wise tests showed that only erosion rates on fields with clay soils are significantly lower than those associated with silt loam and sand loam soils.
Table 5 The variation of gross erosion rates according to soil texture
Soil texture Number of
sites
Gross erosion rates ( t ha-1 year-1)
Median STD
Clay 8 4.2 2.6
Clay loam 26 7.7 2.5
Silt loam 13 12.8 4.5
Sand loam 15 9.9 3.6
(d) The influence of slope gradient on soil redistribution rates
Using the GPS survey results for each sampled field, the gradients associated with the individual transect segments were calculated and the average slope gradient for the convex portion of the transect was computed and used to characterize the steepness of a given field. The effects of slope gradient on soil erosion rates were examined at both the local and regional scale.
Where possible, efforts were made to include fields with contrasting slope gradients within each farm-based sampling location, in order to hold other factors such as soil texture and land use constant. However, it was generally difficult to find suitable fields, since slope gradient was frequently a key determinant of land use. However, the available results clearly demonstrate that slope gradient can be an important controlling factor at the local scale, when water erosion is a significant agent of soil redistribution. Results from several representative locations are listed in Table 6. The small number of sites for which data are available, nevertheless precludes statistical testing of the results. More
SID 5 (2/05) Page 17 of 20

targeted sampling would be required to confirm any relationship and to establish its form for use for prediction purposes.
Table 6 The influence of slope gradient on soil erosion rates at the local scale
Soil texture
Land use Slope (degree)
Gross erosion rate (t ha-1 year-1)
Sandy loam
Grass 4 0.86 1.5
Sandy loam
Cultivated 4 12.95 14.2
Clay loam
Cultivated 5 6.66 8.4
Figure 11 The relationship between gross erosion rate and slope gradient for the sampled fields.
Using the total dataset, no significant relationship between gross erosion rate and the measure of slope gradient used in this study could be discerned. The results from the current survey have been plotted on Figure 11, and the apparent lack of a relationship between erosion rate and slope could reflect the confounding influence of other controls, the limited range of gradients represented and the temporal averaging associated with erosion rate estimates derived from Cs-137 measurements. A similar lack of a clear relationship between erosion rate and slope gradient was reported by Evans and Cook (1986) in an analysis of rill erosion rates on agricultural fields.
The results presented above confirm the importance of land use, soil texture and slope gradient as key variables for erosion risk assessment on a national scale, but further work is clearly required to expand the database to provide further data from areas of high erosion risk, to elucidate further the key controls, and to include areas providing new combinations of land use, soil texture and slope gradient and a range of hydrometeorological conditions.
8.3.5 Data comparability
It is clearly important to compare the estimates of soil redistribution rates obtained using Cs-137 measurements with other erosion rate estimates, in order to establish their consistency. However, in making such comparisons it is necessary to recognise that all erosion rate estimates are, at least to some degreee, operationally defined. Brazier (2004) has discussed some of the problems associated
SID 5 (2/05) Page 18 of 20
with comparing data derived using different methods. Cs-137 based estimates represent a time-averaged estimate of the mean annual soil redistribution rate by sheet and rill erosion for a period extending from the late 1950s to the present. Previous work aimed at using Cs-137 measurements to obtain estimates of soil erosion rates for 12 cultivated fields in England and Wales, located in areas of known erosion risk, reported by Quine and Walling (1991) provided estimates of gross erosion rates in the range 2.2 to 12.2 t ha-1 year-1, with a median value of 5.7 t ha-1 year-1. These values are fully consistent with those presented from the current study in Figure 9, which range from 2.7 to 16 t ha -1
year-1 with a median of 7.2 t ha-1 year-1. The average erosion rate for fields with silty loam soils documented in the present study is about 12.8 t ha-1 year-1. This value is again consistent with the value of 15.03 t ha-1 year-1 reported by Robinson and Boardman (1988) for an 180 m plot on the South Downs in Sussex. Evans and Cook (1986) report erosion rates for fields on clay and sandy loam in the ranges 1.4 to 5.7 t ha-1 year-1 and 12 to 17 t ha-1 year-1, respectively. The mean erosion rates for equivalent soils generated by the present study of 4.2 t ha-1 year-1 and 10 t ha-1 year-1 match closely with those values. Further examination of the range of erosion rates documented by the present study indicates that the fields producing high values closely match the hotspots highlighted in the erosion risk maps presented by Richardson and Goodlass (1997). In conclusion, therefore, the rates derived from Cs-137 measurements using the protocols developed in this investigation provide clear evidence of being consistent with existing information on rates of soil loss in southern England obtained using other methods and procedures.
8.4 IMPLICATIONS AND FUTURE WORK
The results presented above are seen as amply fulfilling the ‘proof of concept’ purpose of the project. Protocols for using Cs-137 measurements in a reconnaissance mode applicable at the national scale, to derive estimates of soil redistribution rates, has been successfully developed, validated and tested. This testing has included successfully commencing the assembly of a national database on rates of gross and net soil loss from agricultural land characterized by different land use, terrain characteristics and soil types. The value of these data for identifying key controls on erosion rates, establishing a national inventory of soil erosion rates on agricultural land and thereby supporting national scale soil erosion assessments has been clearly demonstrated.
Against this background, an application to extend the project, to permit the second phase, as outlined in Section 8.1, to be undertaken, was submitted to DEFRA and approved. The second phase represented by project SP0413 commenced on 1/7/2005 and will extend for 3 years.
REFERENCES
Brazier, R.E., 2004. Quantifying soil erosion by water in the UK: a review of monitoring and modelling approaches. Progress in Physical Geography 28 (3), 340-365.
Evans, R. and Cook, S. (1986). Soil erosion in Britain. SEESOIL 3, 28-59.Marks, M.J., D. R. Soloman, P. A. Johnson, R. L. Watson, S.M. Royal, S.J. Richardson, and G. Goodlass, 1997.
Soil protection studies: Identification of areas of the country at high or very high risk to soil erosion by water. ADAS report to the Ministry of Agiculture, Fisheries and Food, 1997. Controlling soil erosion.- an advisory booklet for the management of agricultural land.
Owens, P.N., D.E. Walling, and Q. He, 1996. The behaviour of bomb-derived caesium-137 fallout in catchment soils. J. Environ. Radioactivity 32(3),169-191
Quine, T. A. and D. E. Walling, 1991. Rates of soil erosion on arable fields in Britain: quantitative data from caesium-137 measurements. Soil Use and Management 7, 169 – 175
Richardson, and G. Goodlass, 1997. Soil protection studies: Identification of areas of the country at high or very high risk to soil erosion by water. ADAS report to the Ministry of Agiculture, Fisheries and Food, UK
Robinson,D.A., J .D. Blackman, 1989. Soil erosion, soil conservation and agricultural policy for arable land in the UK. Geoforum 20, 83-92
Robinson,D.A. and J. Boardman, 1988. Cultivation practice,sowing season and soil erosion on the South Downs, England: a preliminary study. J. Agric. Sci. Camb. 110,169-177
Soil Survey and Land Research Centre 1993. Risk of soil erosion in England and Wales by water on land under winter cereal cropping. SSLRC, Cranfield University, Silsoe, Bedford
Walling, D.E. and He, Q. 1999. Improved models for estimating soil erosion rates from 137Cs measurements. Journal of Environmental Quality 28, 611-622.
Zapata, F. (Ed.) 2002. Handbook for the Assessment of Soil Erosion and Sedimentation using Environmental Radioniclides. Kluwer, Dordrecht, The Netherlands.
SID 5 (2/05) Page 19 of 20
References to published material9. This section should be used to record links (hypertext links where possible) or references to other
published material generated by, or relating to this project.
In view of the intensive nature of the 2 year project, the iterative nature of the work and the emphasis on preparing the proposal to continue the investigation into the second phase, no publications have been produced to date. However, a paper describing the sampling protocols and their validation and testing is currently in the final stages of preparation. Publication of the results relating to the analysis and identification of factors influencing soil erosion rates, as well as the magnitude of the values obtained, will await further work based on the extended database to be assembled and analysed during the second phase of the investigation. Results from the project have been incorporated into several presentations at international meetings, including an IAEA workshop on the use of environmental radionuclides in soil erosion investigations, held in Istanbul, Turkey in October, 2004. Further presentations are also planned.
SID 5 (2/05) Page 20 of 20