GENERAL ELECTION 2015 PRE ELECTION OPINION...
13
AUGUST 2015 SOCIAL INDICATOR CENTRE FOR POLICY ALTERNATIVES GENERAL ELECTION 2015 PRE ELECTION OPINION POLL TOP LINE REPORT
Transcript of GENERAL ELECTION 2015 PRE ELECTION OPINION...

AUGUST 2015SOCIAL INDICATOR CENTRE FOR POLICY ALTERNATIVES
GENERAL ELECTION 2015 PRE ELECTION OPINION POLLTOP LINE REPORT

The Centre for Policy Alternatives (CPA) is an independent, non-partisan organisation that focuses primarily on
issues of governance and conflict resolution. Formed in 1996 in the firm belief that the vital contribution of civil
society to the public policy debate is in need of strengthening, CPA is committed to programmes of research
and advocacy through which public policy is critiqued, alternatives identified and disseminated.
Address: 24/2 28th Lane, off Flower Road
Colombo 7, Sri Lanka
Telephone: +94 (11four) 2565304/5/6
Fax: +94 (11) 4714460
Web www.cpalanka.org
Email [email protected]
Social Indicator (SI) is the survey research unit of the Centre for Policy Alternatives (CPA) and was established in September 1999, filling a longstanding vacuum for a permanent, professional and independent polling facility in Sri Lanka on social and political issues. Driven by the strong belief that polling is an instrument that empowers democracy, SI has been conducting polls on a large range of socio‐economic and political issues since its inception.
Address: 105, Fifth Lane, Colombo 03
Telephone: +94(11)2370472/4/6 Fax: +94(11) 2370475
Web: http://cpalanka.org/survey-research/ Email: [email protected]
Cover page photo credit: International Business Times (http://www.ibtimes.co.in/sri-lanka-1-dead-gunmen-shoot-election-rally-641156)

General Election 2015 - Pre election poll | August 2015
SUMMARY OF FINDINGS • Only 4 % of Sri Lankans believe that the 2015 General Election will not be free and fair and
66.9% believe that it will be. The Muslim community is the most optimistic compared to the other three main ethnic communities, with 80.4% saying that the election will be free and fair.
• When asked about who they think is best suited to be the Prime Minister of Sri Lanka, majority from the Tamil (62.3%), Up Country Tamil (71.1%) and Muslim (62.3%) communities said Ranil Wickremesinghe, with less than 2% from each community saying that it should be Mahinda Rajapaksa. Opinion in the Sinhala community is divided, with 36% saying that it should be Mahinda Rajapaksa and 31.9% saying Ranil Wickremesinghe.
• Sri Lankans are divided on the question about whether former President Mahinda Rajapaksa should be contesting in the upcoming General Elections. 40% of Sri Lankans say that the former President should contest while 42% say that he should not contest.
• The key issues that Sri Lankans believe the next Parliament should address are employment and employment opportunities for youth, reduction in the cost of living, accelerating the development of the country and improving the education system.
• The three most important characteristics that Sri Lankans look for in a candidate are what that candidate has done for the country (19.4%), education (17.5%) and that they are not corrupt (15.6%).
• For almost 50% of Sri Lankans it is extremely important that the candidates they plan on voting for have declared their assets while 18.5% say that it is somewhat important for them.
• For an overwhelming majority of Sri Lankans (86.4%), the media is a source of information during election time. When asked what their primary source of media is during election time, 80.9% of Sri Lankans said television, 7.1% said radio and 5.9% said newspapers.
• 59% of Sri Lankans say that the information they get from the media influences how they vote, while 29.6% say that it does not.
Page �1

General Election 2015 - Pre election poll | August 2015
METHODOLOGY The survey was carried out using a semi-structured questionnaire administered through face-to-face interviews. Trained Field Researchers conducted interviews with 1986 respondents in both the Sinhala and Tamil languages across all 25 districts.
Sampling and fieldwork
In this survey, Social Indicator (SI) used a multi-stage stratified random sampling technique. A sample of 2000 respondents spread across all districts using the Population Proportionate Sampling (PPS) method was polled and ethnic proportions accounted for. The sample size was determined in order to produce results within a 2% error margin at 95% confidence level. Electorates were chosen as the strata to distribute the sample and polling centres within each electorate were chosen randomly. From each selected polling centre the starting point (first household selected for the survey) of the survey was selected randomly from the 2008 voter registry. Following the completion of an interview at the first household, 19 other households that come under the same polling centre were selected using the right hand rule. At each selected household, a respondent was determined using the last birthday method.
When allocating samples in the Northern Province, SI adhered to a slightly different method due to the difficulties in accessing current data for a sound sample frame. As with the rest of the country, the sample was stratified across electorates and within each electorate polling centres were selected randomly. However, the starting point of each polling centre was selected by the field researcher, whilst the households were selected randomly using the right hand rule and respondents selected using the last birthday method.
Fieldwork for the entire study was conducted from 22 July - 29 July 2015.
Training of Field Researchers
45 Field Researchers (male and female) were given an extensive training on the study, the survey instrument and field techniques. In order to ensure the quality of field research, SI deployed a group of Supervisors to conduct quality control processes during and after fieldwork such as accompanied visits, spot-checks and back-checks to ensure the quality of the data collected.
Analysis
The dataset was weighted in order to reflect actual geographical and ethnic proportion. The data set was analysed using the Statistical Package for Social Sciences (SPSS).
Page �2

General Election 2015 - Pre election poll | August 2015
FINDINGS FROM THE SURVEY
Page �3
General Election 2015 - Pre election poll | August 2015
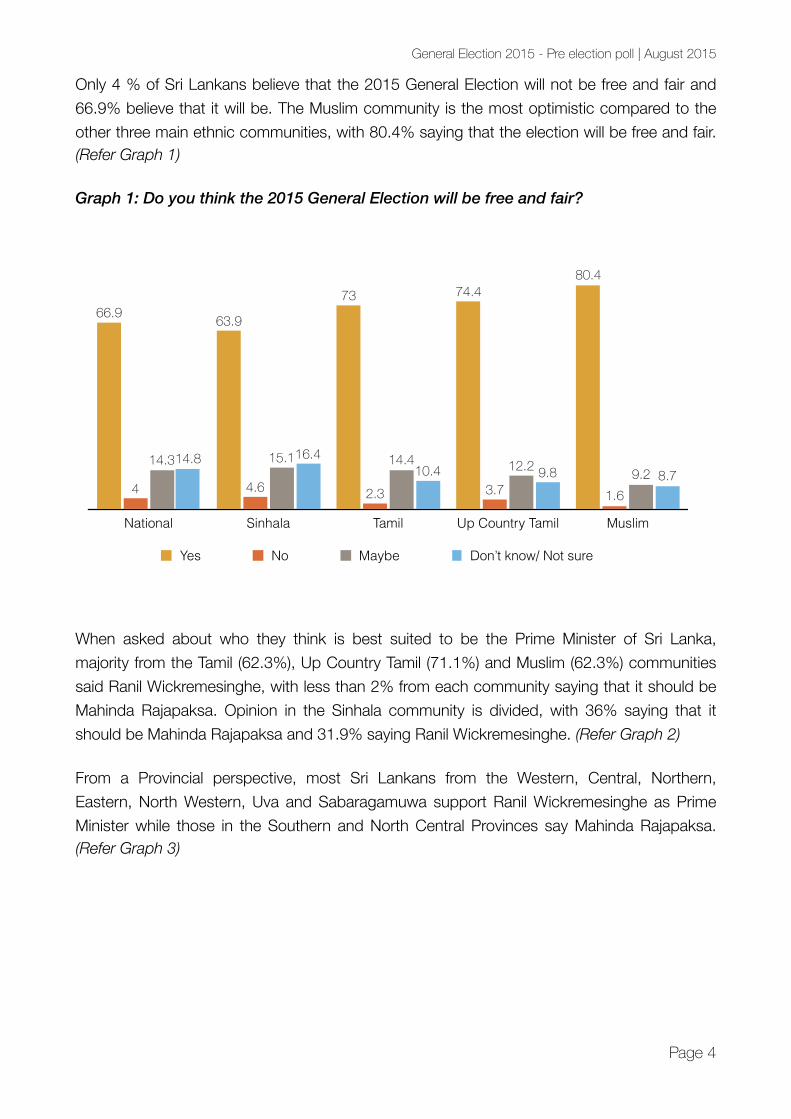
Only 4 % of Sri Lankans believe that the 2015 General Election will not be free and fair and 66.9% believe that it will be. The Muslim community is the most optimistic compared to the other three main ethnic communities, with 80.4% saying that the election will be free and fair. (Refer Graph 1)
Graph 1: Do you think the 2015 General Election will be free and fair? !
When asked about who they think is best suited to be the Prime Minister of Sri Lanka, majority from the Tamil (62.3%), Up Country Tamil (71.1%) and Muslim (62.3%) communities said Ranil Wickremesinghe, with less than 2% from each community saying that it should be Mahinda Rajapaksa. Opinion in the Sinhala community is divided, with 36% saying that it should be Mahinda Rajapaksa and 31.9% saying Ranil Wickremesinghe. (Refer Graph 2)
From a Provincial perspective, most Sri Lankans from the Western, Central, Northern, Eastern, North Western, Uva and Sabaragamuwa support Ranil Wickremesinghe as Prime Minister while those in the Southern and North Central Provinces say Mahinda Rajapaksa. (Refer Graph 3)
Page �4
National Sinhala Tamil Up Country Tamil Muslim
8.79.810.416.414.8
9.212.214.415.114.3
1.63.72.34.64
80.474.473
63.966.9
Yes No Maybe Don’t know/ Not sure

General Election 2015 - Pre election poll | August 2015
Graph 2: In your opinion, who do you think is best suited to be the Prime Minister of Sri Lanka?
Graph 3: In your opinion, who do you think is best suited to be the Prime Minister of Sri Lanka? (Provincial)
Page �5
National Sinhala Tamil Up Country Tamil Muslim
62.3
71.1
62.3
31.9
39.8
1.61.21.8
36
27.5
Mahinda Rajapaksa Ranil Wickremesinghe
Western
Central
Southern
Northern
Eastern
North Western
North Central
Uva
Sabaragamuwa 44
39.3
30.3
46.4
62.4
48.1
30.1
38.4
36.4
38.1
25.2
46.5
23.7
8.5
3.8
40.1
17.5
26.6
Mahinda Rajapaksa Ranil Wickremesinghe

General Election 2015 - Pre election poll | August 2015
Sri Lankans are divided on the question about whether former President Mahinda Rajapaksa should be contesting in the upcoming General Elections. 40% of Sri Lankans say that the former President should contest while 42% say that he should not contest. Almost 50% from the Sinhala community say that he should contest while only 14.8% from the Tamil, 8.4% from the Up Country Tamil and 8.2% from the Muslim communities state the same. (Refer
Graph 4)
Graph 4: Some people say that former President Mahinda Rajapaksa should not be contesting the General Elections. What is your opinion?
Graph 5: What sort of party representation should we have in our next Parliament?
Page �6
National Sinhala Tamil Up Country Tamil Muslim
22.818.1
30
15.618
6973.5
55.2
3542
8.28.414.8
49.5
40
The former President should contest The former President should not contestDon’t know/ Not sure
National Sinhala Tamil Up Country Tamil Muslim
24.72222
5.39.7
31.3
24.4
38.6
8.2
14.419.2
14.612.6
28.725.4 24.7
39
26.9
57.8
50.5
More representation of one party More representation to larger partiesGreater representation of minority parties Don’t know/ Not sure

General Election 2015 - Pre election poll | August 2015
When asked about what sort of party representation Sri Lanka should have in the next Parliament, 50.5% of Sri Lankans said that there should be more representation of one party, 25.4% said more representation to larger parties while 14.4% said greater representation of minority parties. For majority from the Sinhala community (57.8%), more representation of one party is preferable while 38.6% from the Tamil community and 31.3% from the Muslim community would prefer to see a greater representation of minority parties in the next Parliament. (Refer Graph 5)
The key issues that Sri Lankans believe the next Parliament should address are employment and employment opportunities for youth, reduction in the cost of living, accelerating the development of the country and improving the education system.
The three most important characteristics that Sri Lankans look for in a candidate are what that candidate has done for the country (19.4%), education (17.5%) and that they are not corrupt (15.6%). (Refer Graph 6)
These characteristics are similar across the four main ethnic groups as well, although education is also an important feature for both the Tamil community and the Up Country Tamil community.
When asked what issues are most important to them when determining which party/alliance to vote for people said the policies they promise to introduce, corruption related issues, development and the future of the country.
Page �7

General Election 2015 - Pre election poll | August 2015
Graph 6: What are the three most important characteristics you look for in a candidate?
National
Page �8
What they have done for the
country 19.4%
Education
17.5%
That they are not corrupt 15.6%
What they have done for the
country 19.3%
Education
17.7%
That they are not corrupt 15.7%
What they have done for the
country 20.5%
That they are not corrupt 14.8%
Education
13.4%
Experience
13.4%
What they have done for the
country 21.1%
Education
20.3%
Experience
16.6%
Education
19.5%
That they are not corrupt 18.8%
What they have done for the
country 17.8%
Sinhala
Tamil
Up Country Tamil
Muslim

General Election 2015 - Pre election poll | August 2015
The fieldwork for this survey was conducted during the last two weeks of July and at that time 58.1% of Sri Lankans said that they have already made up their mind about whom they will vote for. 61.4% from the Sinhala community, 45.9% from the Tamil community and around 50% from the Up Country Tamil and Muslim communities say that they have already made up their mind. Almost 30% from the Tamil community stated that they will make up their mind a week before the election while 15.2% from the Muslim community say that they will make up their mind on election day. (Refer Graph 7)
Graph 7: When do you think you will make up your mind about who you will vote for?
Graph 8: How important is it to you that candidates you plan on voting for have declared his/her assets?
Page �9
National Sinhala Tamil Up Country Tamil Muslim
7.112.3
2.39.28.3
15.2
3.7
13.18.29.3 10.37.4
10.45.86.8
18.525.928.4
15.417.6
48.950.645.9
61.458.1
I have already made up my mind A week before electionsThe day before elections On election dayDon’t know/ Not sure
National Sinhala Tamil Up Country Tamil Muslim
18.6
6.113.514.614.5
7.72.44.96.56.3
1.61.247.36.1 7.71.22.7
7.36.6
17.58.5
23.318.518.5
47
80.5
51.645.747.9
Extremely important Somewhat importantNeither important nor unimportant Somewhat unimportantExtremely unimportant Don’t know/ Not sure
General Election 2015 - Pre election poll | August 2015
For almost 50% of Sri Lankans it is extremely important that the candidates they plan on voting for have declared their assets while 18.5% say that it is somewhat important for them. For 80.5% of the Up Country Tamil community it is extremely important while 45.7% from the Sinhala community, 51.6% from the Tamil community and 47% from the Muslim community feel the same. (Refer Graph 8)
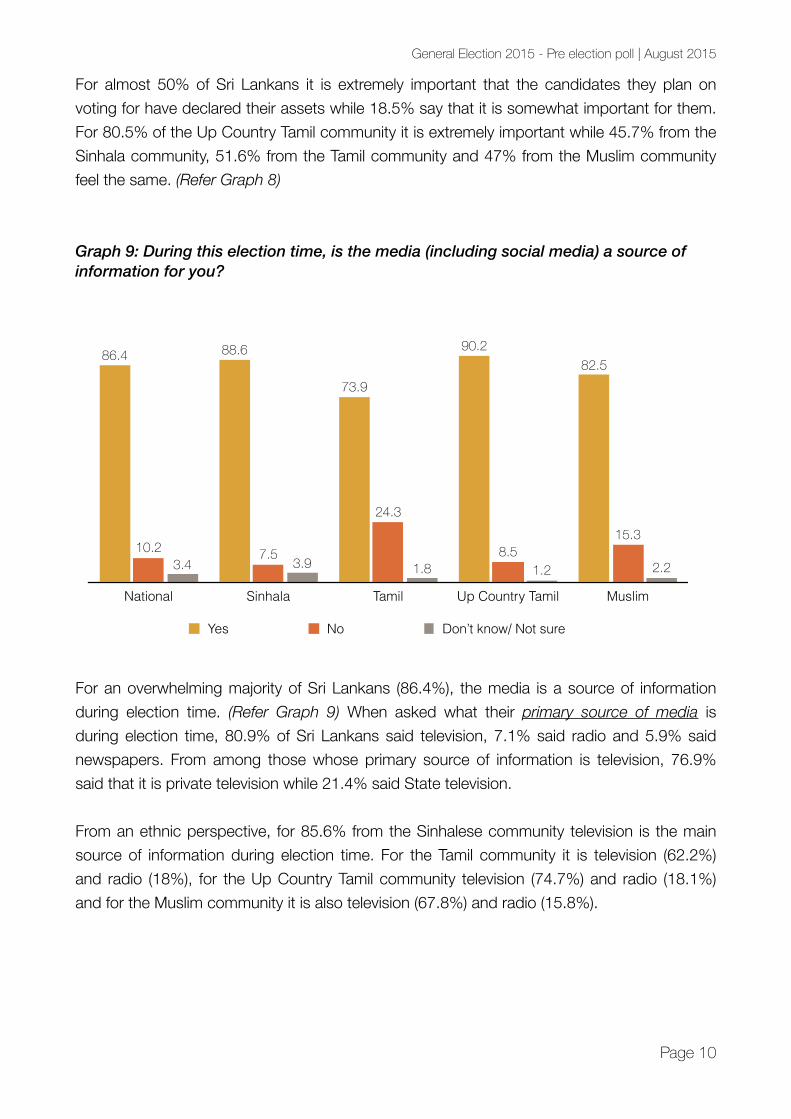
Graph 9: During this election time, is the media (including social media) a source of information for you?
For an overwhelming majority of Sri Lankans (86.4%), the media is a source of information during election time. (Refer Graph 9) When asked what their primary source of media is during election time, 80.9% of Sri Lankans said television, 7.1% said radio and 5.9% said newspapers. From among those whose primary source of information is television, 76.9% said that it is private television while 21.4% said State television.
From an ethnic perspective, for 85.6% from the Sinhalese community television is the main source of information during election time. For the Tamil community it is television (62.2%) and radio (18%), for the Up Country Tamil community television (74.7%) and radio (18.1%) and for the Muslim community it is also television (67.8%) and radio (15.8%).
Page �10
National Sinhala Tamil Up Country Tamil Muslim
2.21.21.83.93.4
15.38.5
24.3
7.510.2
82.590.2
73.9
88.686.4
Yes No Don’t know/ Not sure

General Election 2015 - Pre election poll | August 2015
59% of Sri Lankans say that the information they get from the media influence how they vote while 29.6% say that it does not influence. Information received from the media influencing people’s voting choices is highest in the Tamil community and Muslim community with around 40% from both communities stating that the information they get from the media influences how they vote. (Refer Graph 10)
When asked which media has the most influence on their opinion during this election time, 75.2% of Sri Lankans said television, 6.8% said radio and 5.5% said newspapers.
Graph 10: Does the information you get from the media influence how you vote?
Page �11
National Sinhala Tamil Up Country Tamil Muslim
136.15.8
12.311.4
38
20.7
41.3
27.329.6
48.9
73.2
52.960.459
Yes No Don’t know/ Not sure