GENERAL ASSEMBLY RETIREMENT SYSTEM OF ILLINOIS · PDF fileGENERAL ASSEMBLY RETIREMENT SYSTEM...
52
GENERAL ASSEMBLY RETIREMENT SYSTEM OF ILLINOIS GASB STATEMENT NOS. 67 AND 68 ACCOUNTING AND FINANCIAL REPORTING FOR PENSIONS JUNE 30, 2015
Transcript of GENERAL ASSEMBLY RETIREMENT SYSTEM OF ILLINOIS · PDF fileGENERAL ASSEMBLY RETIREMENT SYSTEM...

GE N E R A L A SS E M BLY R ET I R E ME NT S YS T E M OF
I L LI N OI S G A S B S T A T E M E N T N O S . 6 7 A N D 6 8 A C C O U N T I N G A N D
F I N A N C I A L R E P O R T I N G F O R P E N S I O N S
J U N E 3 0 , 2 0 1 5
October 27, 2015
The Board of Trustees
General Assembly Retirement System of Illinois
Springfield, IL
Dear Board Members:
This report provides accounting and financial reporting information that is intended to comply with
the Governmental Accounting Standards Board (GASB) Statements Nos. 67 and 68 for the General
Assembly Retirement System of Illinois (“GARS”). These calculations have been made on a basis
that is consistent with our understanding of these Statements.
GASB Statement No. 67 is the accounting standard that applies to the stand-alone financial reports
issued by retirement systems. GASB Statement No. 68 establishes accounting and financial
reporting for state and local government employers who provide their employees (including former
employees) pension benefits through a trust.
Our calculation of the liability associated with the benefits described in this report was performed
for the purpose of providing reporting and disclosure information that satisfies the requirements of
GASB Statements Nos. 67 and 68. The calculation of the plan’s liability for this report is not
applicable for funding purposes of the plan. A calculation of the plan’s liability for purposes other
than satisfying the requirements of GASB Statements Nos. 67 and 68 may produce significantly
different results. This report may be provided to parties other than the General Assembly
Retirement System of Illinois (“GARS”) only in its entirety and only with the permission of GARS.
Our valuation and projections assume the sponsor will make the contributions required by state
statute. To the extent the sponsor does not make the statutory required contribution the results
contained in this report could be significantly different.
This report is based upon information furnished to us by GARS concerning retirement and ancillary
benefits, active members, deferred vested members, retirees and beneficiaries and financial data.
This information was checked for internal consistency, but it was not otherwise audited.
This report complements the actuarial valuation report that was provided to GARS and should be
considered in conjunction with that report. Please see the actuarial valuation report as of June 30,
2015, for additional discussion of the nature of actuarial calculations and more information related
to participant data, economic and demographic assumptions, and benefit provisions.
To the best of our knowledge, the information contained with this report is accurate and fairly
represents the actuarial position of the General Assembly Retirement System of Illinois. All
calculations have been made in conformity with generally accepted actuarial principles and
practices as well as with the Actuarial Standards of Practice issued by the Actuarial Standards
Board.

The Board of Trustees
General Assembly Retirement System of Illinois
October 27, 2015
Page 2
The signing actuaries are independent of the plan sponsor.
Alex Rivera, David Kausch and Paul T. Wood are Members of the American Academy of
Actuaries (MAAA) and meet the Qualification Standards of the American Academy of Actuaries
to render the actuarial opinion contained herein.
Respectfully submitted,
By
Alex Rivera
FSA, EA, MAAA
By
David Kausch
FSA, EA, MAAA
By
Paul T. Wood
ASA, MAAA
General Assembly Retirement System of Illinois
Auditor’s Note – This information is intended to assist in preparation of the financial statements of
the General Assembly Retirement System of Illinois. Financial statements are the responsibility of
management, subject to the auditor’s review. Please let us know if the auditor recommends any
changes.
General Assembly Retirement System of Illinois
TABLE OF CONTENTS
Page Section A Executive Summary
Executive Summary ...................................................................................................... 1
Discussion ..................................................................................................................... 2
Section B Financial Statements
Statement of Pension Expense ...................................................................................... 5
Statement of Outflows and Inflows Arising from Current and Prior Periods ............... 6
Statement of Fiduciary Net Position ............................................................................. 7
Statement of Changes in Fiduciary Net Position .......................................................... 8
Section C Required Supplementary Information
Schedule of Changes in Net Pension Liability and Related Ratios Current Period ...... 9
Schedule of Changes in Net Pension Liability and Related Ratios Multiyear ............ 10
Additional Notes to the Schedule of Changes in Net Pension Liability and Related
Ratios Multiyear ....................................................................................................... 11
Schedule of Net Pension Liability Multiyear .............................................................. 12
Schedule of Contributions Multiyear .......................................................................... 13
Notes to Schedule of Contributions ............................................................................ 14
Schedule of Investment Returns Multiyear ................................................................. 15
Section D Notes to Financial Statements
Asset Allocation .......................................................................................................... 16
Sensitivity of Net Pension Liability to the Single Discount Rate Assumption ........... 17
Summary of Population Statistics ............................................................................... 18
Section E Summary of Benefits .................................................................................................. 19
Section F Actuarial Cost Method and Actuarial Assumptions
Valuation Methods, Entry Age Normal ...................................................................... 23
Actuarial Assumptions, Input to Discount Rates, Mortality Assumptions, and
Experience Studies ................................................................................................... 24
Miscellaneous and Technical Assumptions ................................................................ 29
Section G Calculation of the Single Discount Rate
Calculation of the Single Discount Rate ..................................................................... 31
Projection of Funded Status and Assignment of Assets ............................................. 32
Current Member Projection of Assets and Assignment of Employer Contributions .. 33
Development of Single Discount Rate ........................................................................ 34
Projection of Plan Net Position and Benefit Payments ............................................... 35
Section H Glossary of Terms ....................................................................................................... 36

0
SECTION A
EXECUTIVE SUMMARY Section A Executive Summary
Section A
1
General Assembly Retirement System of Illinois
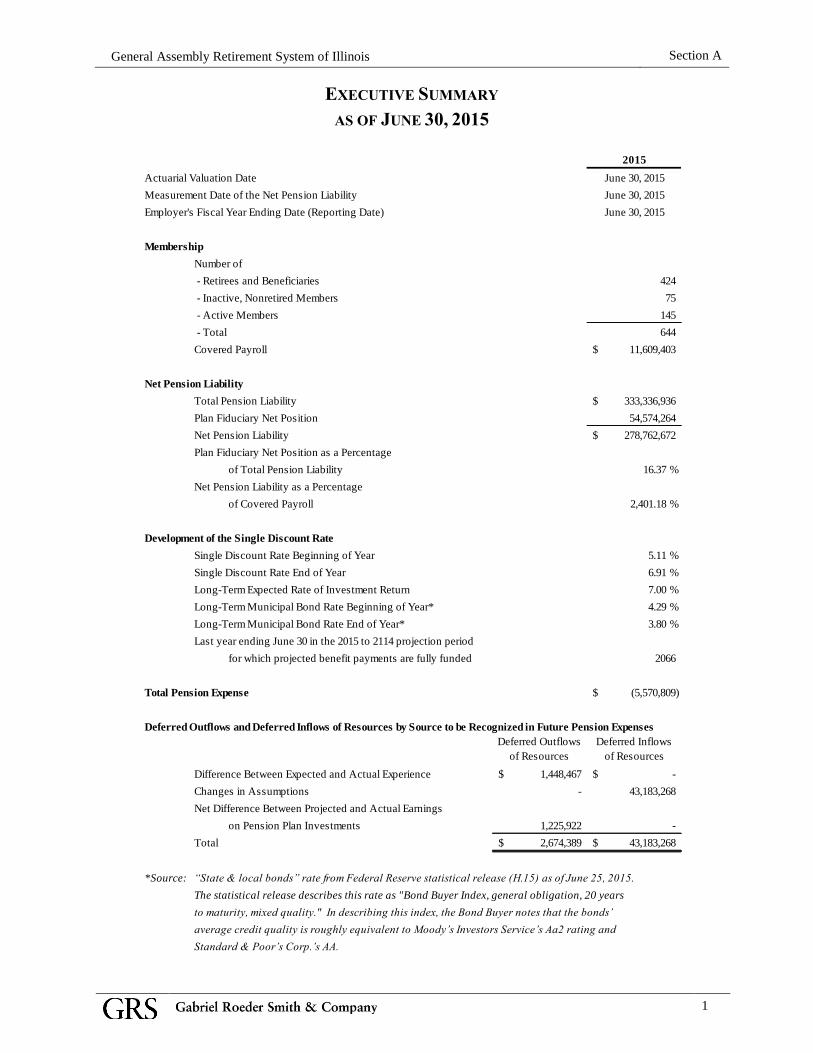
EXECUTIVE SUMMARY
AS OF JUNE 30, 2015
2015
Actuarial Valuation Date June 30, 2015
Measurement Date of the Net Pension Liability June 30, 2015
Employer's Fiscal Year Ending Date (Reporting Date) June 30, 2015
Membership
Number of
- Retirees and Beneficiaries 424
- Inactive, Nonretired Members 75
- Active Members 145
- Total 644
Covered Payroll 11,609,403$
Net Pension Liability
Total Pension Liability 333,336,936$
Plan Fiduciary Net Position 54,574,264
Net Pension Liability 278,762,672$
Plan Fiduciary Net Position as a Percentage
of Total Pension Liability 16.37 %
Net Pension Liability as a Percentage
of Covered Payroll 2,401.18 %
Development of the Single Discount Rate
Single Discount Rate Beginning of Year 5.11 %
Single Discount Rate End of Year 6.91 %
Long-Term Expected Rate of Investment Return 7.00 %
Long-Term Municipal Bond Rate Beginning of Year* 4.29 %
Long-Term Municipal Bond Rate End of Year* 3.80 %
Last year ending June 30 in the 2015 to 2114 projection period
for which projected benefit payments are fully funded 2066
Total Pension Expense (5,570,809)$
Deferred Outflows and Deferred Inflows of Resources by Source to be Recognized in Future Pension Expenses
Deferred Outflows
of Resources
Deferred Inflows
of Resources
Difference Between Expected and Actual Experience 1,448,467$ -$
Changes in Assumptions - 43,183,268
Net Difference Between Projected and Actual Earnings
on Pension Plan Investments 1,225,922 -
Total 2,674,389$ 43,183,268$
*Source: “State & local bonds” rate from Federal Reserve statistical release (H.15) as of June 25, 2015.
The statistical release describes this rate as "Bond Buyer Index, general obligation, 20 years
to maturity, mixed quality." In describing this index, the Bond Buyer notes that the bonds’
average credit quality is roughly equivalent to Moody’s Investors Service’s Aa2 rating and
Standard & Poor’s Corp.’s AA.

Section A
2
General Assembly Retirement System of Illinois
DISCUSSION
Accounting Standard
For pension plans that are administered through trusts or equivalent arrangements, Governmental
Accounting Standards Board (GASB) Statement No. 67 establishes standards of financial
reporting for separately issued financial reports and specifies the required approach for measuring
the pension liability. Similarly, GASB Statement No. 68 establishes standards for state and local
government employers (as well as non-employer contributing entities) to account for and disclose
the net pension liability, pension expense, and other information associated with providing
retirement benefits to their employees (and former employees) on their basic financial statements.
The following discussion provides a summary of the information that is required to be disclosed
under these accounting standards. A number of these disclosure items are provided in this report.
However, certain information, such as notes regarding accounting policies and investments, is not
included in this report and the retirement system and/or plan sponsor will be responsible for
preparing and disclosing that information to comply with these accounting standards.
Financial Statements
GASB Statement No. 68 requires state or local governments to recognize the net pension liability
and the pension expense on their financial statements. The net pension liability is the difference
between the total pension liability and the plan’s fiduciary net position. In traditional actuarial
terms, this is analogous to the accrued liability less the market value of assets (not the smoothed
actuarial value of assets that is often encountered in actuarial valuations performed to determine
the employer’s contribution requirement).
Paragraph 57 of GASB Statement No. 68 states, “Contributions to the pension plan from the
employer subsequent to the measurement date of the collective net pension liability and before the
end of the employer’s reporting period should be reported as a deferred outflow of resources
related to pensions.” The information contained in this report does not incorporate any
contributions made to GARS subsequent to the measurement date of June 30, 2015.
The pension expense recognized each fiscal year is equal to the change in the net pension liability
from the beginning of the year to the end of the year, adjusted for deferred recognition of the
liability and investment experience.
Pension plans that prepare their own, stand-alone financial statements are required to present two
financial statements – a statement of fiduciary net position and a statement of changes in fiduciary
net position in accordance with GASB Statement No. 67. The statement of fiduciary net position
presents the assets and liabilities of the pension plan at the end of the pension plan’s reporting
period. The statement of changes in fiduciary net position presents the additions, such as
contributions and investment income, and deductions, such as benefit payments and expenses, and
net increase or decrease in the fiduciary net position.

Section A
3
General Assembly Retirement System of Illinois
Notes to Financial Statements
GASB Statement No. 68 requires the notes of the employer’s financial statements to disclose the
total pension expense, the pension plan’s liabilities and assets and deferred outflows and inflows
of resources related to pensions.
GASB Statements Nos. 67 and 68 require the notes of the financial statements for the employers
and pension plans, to include certain additional information. The list of disclosure items should
include:
A description of benefits provided by the plan;
The type of employees and number of members covered by the pension plan;
A description of the plan’s funding policy, which includes member and employer
contribution requirements;
The pension plan’s investment policies;
The pension plan’s fiduciary net position, net pension liability, and the pension plan’s
fiduciary net position as a percentage of the total pension liability;
The net pension liability using a discount rate that is 1 percent higher and 1 percent lower
than used to calculate the total pension liability and net pension liability for financial
reporting purposes;
Significant assumptions and methods used to calculate the total pension liability;
Inputs to the discount rates; and
Certain information about mortality assumptions and the dates of experience studies.
Retirement systems that issue stand-alone financial statements are required to disclose additional
information in accordance with GASB Statement No. 67. This information includes:
The composition of the pension plan’s board and the authority under which benefit terms
may be amended;
A description of how fair value is determined;
Information regarding certain reserves and investments, which include concentrations of
investments greater than or equal to 5 percent, receivables and insurance contracts
excluded from plan assets; and
Annual money-weighted rate of return.

Section A
4
General Assembly Retirement System of Illinois
Required Supplementary Information
GASB Statement No. 67 requires a 10-year fiscal history of:
Sources of changes in the net pension liability;
Information about the components of the net pension liability and related ratios, including
the pension plan’s fiduciary net position as a percentage of the total pension liability, and
the net pension liability as a percent of covered-employee payroll; and
A comparison of the actual employer contributions to the actuarially determined
contributions based on the plan’s funding policy.
Timing of the Valuation
An actuarial valuation to determine the total pension liability is required to be performed at least
every two years. The net pension liability and pension expense should be measured as of the
pension plan’s fiscal year end (measurement date) on a date that is within the employer’s prior
fiscal year. If the actuarial valuation used to determine the total pension liability is not calculated
as of the measurement date, the total pension liability is required to be rolled forward from the
actuarial valuation date to the measurement date.
The total pension liability shown in this report is based on an actuarial valuation performed as of
June 30, 2015, and a measurement date of June 30, 2015.
Single Discount Rate
Projected benefit payments are required to be discounted to their actuarial present values using a
Single Discount Rate that reflects (1) a long-term expected rate of return on pension plan
investments (to the extent that the plan’s fiduciary net position is projected to be sufficient to pay
benefits) and (2) tax-exempt municipal bond rate based on an index of 20-year general obligation
bonds with an average AA credit rating (which is published by the Federal Reserve) as of the
measurement date (to the extent that the contributions for use with the long-term expected rate of
return are not met).
For the purpose of this valuation, the expected rate of return on pension plan investments is 7.00
percent; the municipal bond rate is 3.80 percent (based on the weekly rate closest to but not later
than the measurement date of the “state & local bonds” rate from Federal Reserve statistical
release (H.15)); and the resulting Single Discount Rate is 6.91percent.
The GASB Statements Nos. 67 and 68 Single Discount Rate increased from 5.11 percent as of
June 30, 2014, to 6.91 percent as of June 30, 2015. The key reason for the increase was due to the
membership projection assumption used to determine projected statutory contributions. The
valuation as of June 30, 2014, assumed a constant number of active members in the future. The
valuation as of June 30, 2015, assumed 50 percent of future eligible active members would elect
not to participate in the plan. The reduction in future entrants and future payroll increased the
sponsor’s contributions and extended the projected year that the plan’s fiduciary net position
would be available to pay benefits for current members, from 2030 to 2066. Please refer to the
funding valuation for additional details on the development of the statutory funding contribution.
Effective Date and Transition
GASB Statements Nos. 67 and 68 are effective for fiscal years beginning after June 15, 2013, and
June 15, 2014, respectively, earlier application is encouraged by the GASB.

5
SECTION B
FINANCIAL STATEMENTS
Section B Financial Statements
Auditor’s Note – This information is intended to assist in preparation of the financial statements of
the General Assembly Retirement System of Illinois. Financial statements are the responsibility of
management, subject to the auditor’s review. Please let us know if the auditor recommends any
changes.

Section B
5
General Assembly Retirement System of Illinois
PENSION EXPENSE UNDER GASB STATEMENT NO. 68
FISCAL YEAR ENDED JUNE 30, 2015
A. Expense
1. Service Cost Including Pension Plan Administrative Expense 5,957,132$
2. Interest on the Total Pension Liability 19,911,100
3. Current-Period Benefit Changes -
4. Employee Contributions (made negative for addition here) (1,487,346)
5. Projected Earnings on Plan Investments (made negative for addition here) (3,820,319)
6. Other Changes in Plan Fiduciary Net Position -
7. Recognition of Outflow (Inflow) of Resources due to Liabilities (26,437,857)
8. Recognition of Outflow (Inflow) of Resources due to Assets 306,481
9. Total Pension Expense (5,570,809)$
B. Reconciliation of Net Pension Liability
1. Net Pension Liability Beginning of Year 340,713,301$
2. Pension Expense (5,570,809)
3. Employer Contributions (made negative for addition here) (15,870,941)
4. Deferred Investment Experience (Inflows)/Outflows 1,225,922
5. Deferred Liability Experience (Inflows)/Outflows 1,448,467
6. Deferred Assumption Changes (Inflows)/Outflows (43,183,268)
7. Net Pension Liability End of Year 278,762,672$
Section B
6
General Assembly Retirement System of Illinois
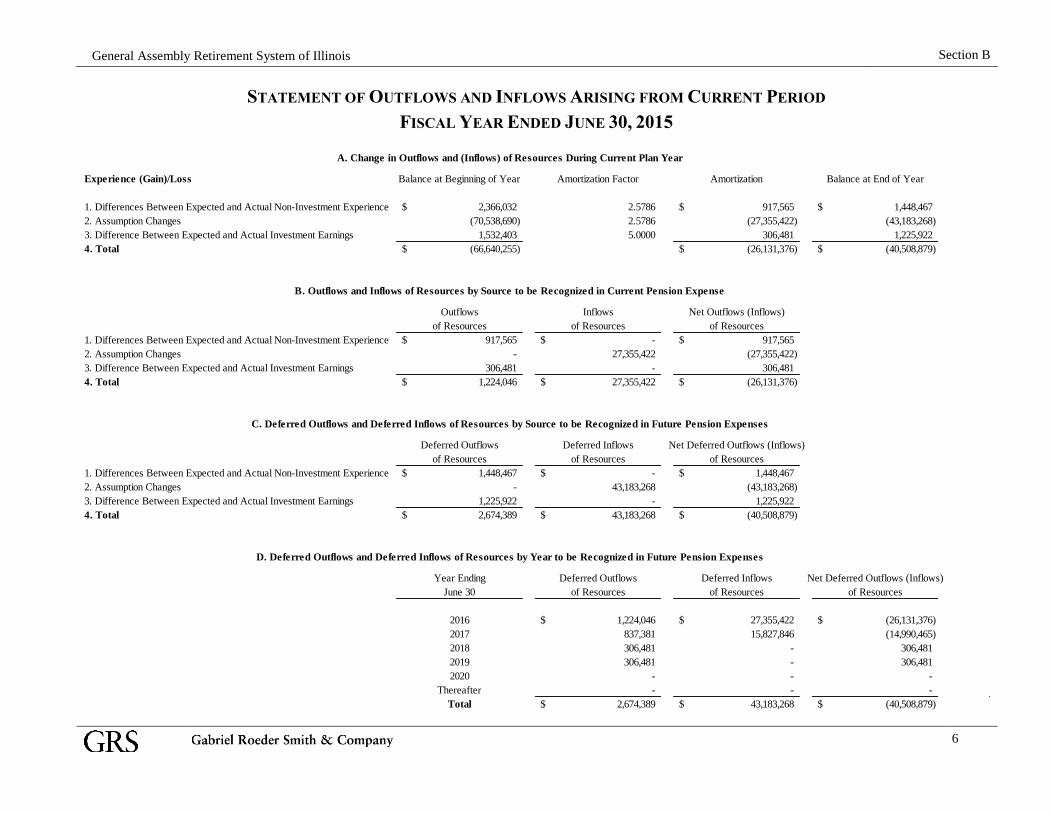
STATEMENT OF OUTFLOWS AND INFLOWS ARISING FROM CURRENT PERIOD
FISCAL YEAR ENDED JUNE 30, 2015
Experience (Gain)/Loss Balance at Beginning of Year Amortization Factor Amortization Balance at End of Year
1. Differences Between Expected and Actual Non-Investment Experience 2,366,032$ 2.5786 917,565$ 1,448,467$
2. Assumption Changes (70,538,690) 2.5786 (27,355,422) (43,183,268)
3. Difference Between Expected and Actual Investment Earnings 1,532,403 5.0000 306,481 1,225,922
4. Total (66,640,255)$ (26,131,376)$ (40,508,879)$
Outflows Inflows Net Outflows (Inflows)
of Resources of Resources of Resources
1. Differences Between Expected and Actual Non-Investment Experience 917,565$ -$ 917,565$
2. Assumption Changes - 27,355,422 (27,355,422)
3. Difference Between Expected and Actual Investment Earnings 306,481 - 306,481
4. Total 1,224,046$ 27,355,422$ (26,131,376)$
Deferred Outflows Deferred Inflows Net Deferred Outflows (Inflows)
of Resources of Resources of Resources
1. Differences Between Expected and Actual Non-Investment Experience 1,448,467$ -$ 1,448,467$
2. Assumption Changes - 43,183,268 (43,183,268)
3. Difference Between Expected and Actual Investment Earnings 1,225,922 - 1,225,922
4. Total 2,674,389$ 43,183,268$ (40,508,879)$
Year Ending Deferred Outflows Deferred Inflows Net Deferred Outflows (Inflows)
June 30 of Resources of Resources of Resources
2016 1,224,046$ 27,355,422$ (26,131,376)$
2017 837,381 15,827,846 (14,990,465)
2018 306,481 - 306,481
2019 306,481 - 306,481
2020 - - -
Thereafter - - -
Total 2,674,389$ 43,183,268$ (40,508,879)$
A. Change in Outflows and (Inflows) of Resources During Current Plan Year
B. Outflows and Inflows of Resources by Source to be Recognized in Current Pension Expense
C. Deferred Outflows and Deferred Inflows of Resources by Source to be Recognized in Future Pension Expenses
D. Deferred Outflows and Deferred Inflows of Resources by Year to be Recognized in Future Pension Expenses

Section B
7
General Assembly Retirement System of Illinois
STATEMENT OF FIDUCIARY NET POSITION
YEARS ENDED JUNE 30, 2015 AND 2014
2015 2014
Assets
Cash 4,904,253$ 4,767,584$
Receivables
Contributions:
Participants 63$ 63$
Employing state agencies 658,709 577,370
Other Accounts 8,518 12,445
Total Receivables 667,290$ 589,878$
Investments
Held in the Illinois State Board of Investment
Commingled Fund at fair value 49,165,676$ 51,549,374$
Securities lending collateral with State Treasurer 2,174,000 2,269,000
Total Investments 51,339,676$ 53,818,374$
Property and equipment, net of accumulated
depreciation 9,118$ 3,187$
Total Assets 56,920,337$ 59,179,023$
Liabilities
Payables
Benefits payable 1,823$ 16,294$
Refunds payable 38,627 5,210
Adminstrative expenses payable 36,918 27,520
Participants' deferred service credit accounts - -
Due to State of Illinois 94,705 71,539
Securities lending collateral with State Treasurer 2,174,000 2,269,000
Total Liabilities 2,346,073$ 2,389,563$
Net Position Restricted for Pensions 54,574,264$ 56,789,460$

Section B
8
General Assembly Retirement System of Illinois
STATEMENT OF CHANGES IN FIDUCIARY NET POSITION
YEARS ENDED JUNE 30, 2015 AND 2014
2015 2014
Additions
Contributions
Participants 1,487,346$ 1,502,605$
Employing state agencies and appropriations 15,870,941 13,956,669
Total Contributions 17,358,287$ 15,459,274$
Investment Income
Net investments income 1,497,169$ 1,357,215$
Interest earned on cash balances 21,614 17,838
Net appreciation in fair value of investments 769,133 6,988,375
Net Investment Income 2,287,916$ 8,363,428$
Total Additions 19,646,203$ 23,822,702$
Deductions
Benefits
Retirement annuities 17,663,009$ 17,218,504$
Survivors' annuities 3,611,940 3,581,998
Disability benefits - -
Lump-sum benefits - -
Total Benefits 21,274,949$ 20,800,502$
Refunds 191,755 245,133
Administrative 394,695 334,628
Total Deductions 21,861,399$ 21,380,263$
Net Increase in Net Position (2,215,196)$ 2,442,439$
Net Position Restricted for Pensions
Beginning of Year 56,789,460$ 54,347,021$
End of Year 54,574,264$ 56,789,460$

9
SECTION C
REQUIRED SUPPLEMENTARY INFORMATION
Section C Required Supplementary Information
Auditor’s Note – This information is intended to assist in preparation of the financial statements of
the General Assembly Retirement System of Illinois. Financial statements are the responsibility of
management, subject to the auditor’s review. Please let us know if the auditor recommends any
changes.

Section C
9
General Assembly Retirement System of Illinois
SCHEDULE OF CHANGES IN NET PENSION LIABILITY AND RELATED RATIOS
CURRENT PERIOD
FISCAL YEAR ENDED JUNE 30, 2015
A. Total Pension Liability
1. Service Cost Including Pension Plan Administrative Expense 5,957,132$
2. Interest on the Total Pension Liability 19,911,100
3. Changes of Benefit Terms -
4. Difference Between Expected and Actual Experience
of the Total Pension Liability 2,366,032
5. Changes of Assumptions (70,538,690)
6. Benefit Payments, Including Refunds
of Employee Contributions (21,466,704)
7. Pension Plan Administrative Expense (394,695)
8. Net Change in Total Pension Liability (64,165,825)$
9. Total Pension Liability – Beginning 397,502,761
10. Total Pension Liability – Ending 333,336,936$
B. Plan Fiduciary Net Position
1. Contributions – Employer 15,870,941$
2. Contributions – Employee 1,487,346
3. Net Investment Income 2,287,916
4. Benefit Payments, Including Refunds
of Employee Contributions (21,466,704)
5. Pension Plan Administrative Expense (394,695)
6. Other -
7. Net Change in Plan Fiduciary Net Position (2,215,196)$
8. Plan Fiduciary Net Position – Beginning 56,789,460
9. Plan Fiduciary Net Position – Ending 54,574,264$
C. Net Pension Liability 278,762,672$
D. Plan Fiduciary Net Position as a Percentage
of the Total Pension Liability 16.37%
E. Covered-Employee Payroll 11,609,403$
F. Net Pension Liability as a Percentage
of Covered Employee Payroll 2401.18%
Section C
10
General Assembly Retirement System of Illinois
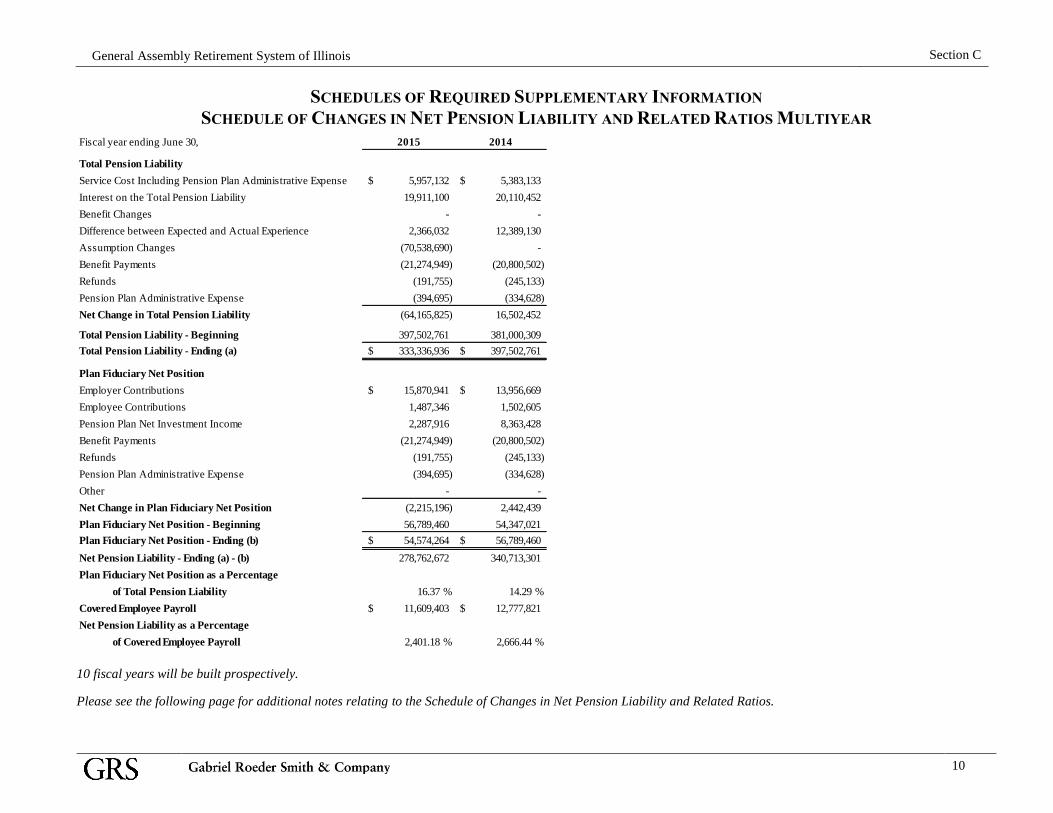
SCHEDULES OF REQUIRED SUPPLEMENTARY INFORMATION
SCHEDULE OF CHANGES IN NET PENSION LIABILITY AND RELATED RATIOS MULTIYEAR
Fiscal year ending June 30, 2015 2014
Total Pension Liability
Service Cost Including Pension Plan Administrative Expense 5,957,132$ 5,383,133$
Interest on the Total Pension Liability 19,911,100 20,110,452
Benefit Changes - -
Difference between Expected and Actual Experience 2,366,032 12,389,130
Assumption Changes (70,538,690) -
Benefit Payments (21,274,949) (20,800,502)
Refunds (191,755) (245,133)
Pension Plan Administrative Expense (394,695) (334,628)
Net Change in Total Pension Liability (64,165,825) 16,502,452
Total Pension Liability - Beginning 397,502,761 381,000,309
Total Pension Liability - Ending (a) 333,336,936$ 397,502,761$
Plan Fiduciary Net Position
Employer Contributions 15,870,941$ 13,956,669$
Employee Contributions 1,487,346 1,502,605
Pension Plan Net Investment Income 2,287,916 8,363,428
Benefit Payments (21,274,949) (20,800,502)
Refunds (191,755) (245,133)
Pension Plan Administrative Expense (394,695) (334,628)
Other - -
Net Change in Plan Fiduciary Net Position (2,215,196) 2,442,439
Plan Fiduciary Net Position - Beginning 56,789,460 54,347,021
Plan Fiduciary Net Position - Ending (b) 54,574,264$ 56,789,460$
Net Pension Liability - Ending (a) - (b) 278,762,672 340,713,301
Plan Fiduciary Net Position as a Percentage
of Total Pension Liability 16.37 % 14.29 %
Covered Employee Payroll 11,609,403$ 12,777,821$
Net Pension Liability as a Percentage
of Covered Employee Payroll 2,401.18 % 2,666.44 %
10 fiscal years will be built prospectively.
Please see the following page for additional notes relating to the Schedule of Changes in Net Pension Liability and Related Ratios.

Section C
11
General Assembly Retirement System of Illinois
SCHEDULES OF REQUIRED SUPPLEMENTARY INFORMATION
ADDITIONAL NOTES TO THE SCHEDULE OF CHANGES IN NET PENSION LIABILITY
AND RELATED RATIOS MULTIYEAR
End of year Total Pension Liability for fiscal year 2014 uses a Single Discount Rate of 5.11
percent. The Single Discount Rate of 5.11 percent was based on a long-term expected rate of
return on pension plan investments of 7.00 percent used in the June 30, 2014, funding valuation
and a long-term municipal bond rate as of June 26, 2014, of 4.29 percent.
Difference between actual and expected experience includes impact of the change in the Single
Discount Rate from 5.39 percent to 5.11 percent based on the long-term expected rate of return on
pension plan investments of 7.00 percent used in the June 30, 2014, funding valuation and the
long-term municipal bond rate of 4.63 percent as of June 27, 2013, and 4.29 percent as of June 26,
2014, respectively. This change was measured as of June 30, 2014.
Beginning of year Total Pension Liability for fiscal year 2015 uses a Single Discount Rate of 5.11
percent, which was based on a long-term expected rate of return on pension plan investments of
7.00 percent used in the June 30, 2014, funding valuation and a long-term municipal bond rate as
of June 26, 2014, of 4.29 percent.
End of year Total Pension Liability for fiscal year 2015 uses a Single Discount Rate of 6.91
percent which was based on a long-term expected rate of return on pension plan investments of
7.00 percent used in the June 30, 2015, funding valuation and a long-term municipal bond rate as
of June 25, 2015, of 3.80 percent.
The increase in the Total Pension Liability for fiscal year 2015 due to assumption changes
includes changing the assumption of future members eligible to participate in the pension system
from 100 percent to 50 percent and the change in the long-term municipal bond rate of 4.29
percent as of June 26, 2014, and 3.80 percent as of June 25, 2015, respectively. As a result of
these assumption changes the Single Discount Rate increased from 5.11 percent to 6.91 percent
based on the long-term expected rate of return on pension plan investments of 7.00 percent used in
the June 30, 2015. This change was measured at the end of the year.

Section C
12
General Assembly Retirement System of Illinois
SCHEDULES OF REQUIRED SUPPLEMENTARY INFORMATION
SCHEDULE OF THE NET PENSION LIABILITY MULTIYEAR
Total Plan Net Position Net Pension Liability
FY Ending Pension Plan Net Net Pension as a % of Total Covered as a % of
June 30, Liability Position Liability Pension Liability Payroll* Covered Payroll
2014 397,502,761$ 56,789,460$ 340,713,301$ 14.29 % 12,777,821$ 2,666.44 %
2015 333,336,936 54,574,264 278,762,672 16.37 % 11,609,403 2,401.18 %
* Covered payroll is the amount in force as of the valuation date and likely differs from actual payroll paid during the fiscal
year.
10 fiscal years will be built prospectively.

Section C
13
General Assembly Retirement System of Illinois
SCHEDULE OF CONTRIBUTIONS MULTIYEAR
LAST 10 FISCAL YEARS
Actuarially Contribution Actual Contribution Statutory
Determined Actual Deficiency Covered as a % of Statutory Contribution
Fiscal Year Contribution* Contribution** (Excess) Payroll*** Covered Payroll Contribution Deficiency/(Excess)
7/1/05 - 6/30/06 8,593,196$ 4,175,390$ 4,417,806$ 12,739,000$ 32.78% 4,157,000$ (18,390)$
7/1/06 - 6/30/07 10,125,503 5,470,429 4,655,074 12,701,000 43.07% 5,220,300 (250,129)
7/1/07 - 6/30/08 10,672,535 6,809,800 3,862,735 12,871,000 52.91% 6,809,800 -
7/1/08 - 6/30/09 11,129,440 8,856,422 2,273,018 14,728,000 60.13% 8,847,000 (9,422)
7/1/09 - 6/30/10 12,064,078 10,411,274 1,652,804 14,775,000 70.47% 10,454,000 42,726
7/1/10 - 6/30/11 13,086,199 11,433,614 1,652,585 15,188,000 75.28% 11,039,000 (394,614)
7/1/11 - 6/30/12 13,365,820 10,502,000 2,863,820 15,275,000 68.75% 10,502,000 -
7/1/12 - 6/30/13 17,064,640 14,150,000 2,914,640 14,902,000 94.95% 14,150,000 -
7/1/13 - 6/30/14 17,110,135 13,956,669 3,153,466 12,777,821 109.23% 13,856,000 (100,669)
7/1/14 - 6/30/15 16,900,876 15,870,941 1,029,935 11,609,403 136.71% 15,809,000 (61,941)
* The GARS Statutory Funding may not conform to Actuarial Standards of Practice, therefore, the actuarially determined contribution is equal to the normal cost plus an amount to
amortize the unfunded actuarial accrued liability as a level percentage of total payroll. The amortization period for fiscal years prior to 2007 is 40 years and the amortization period for
fiscal years 2007 and beyond is 30 years.
**The actual contributions for FYE 6/30/2006 through 6/30/2014 were obtained from the System's comprehensive annual financial reports. The actual contribution for FYE 6/30/2015
was provided by the System.
***Covered payroll shown is the amount in force as of the valuation date and likely differs from actual payroll paid during the fiscal year.
Section C
14
General Assembly Retirement System of Illinois
NOTES TO SCHEDULE OF CONTRIBUTIONS
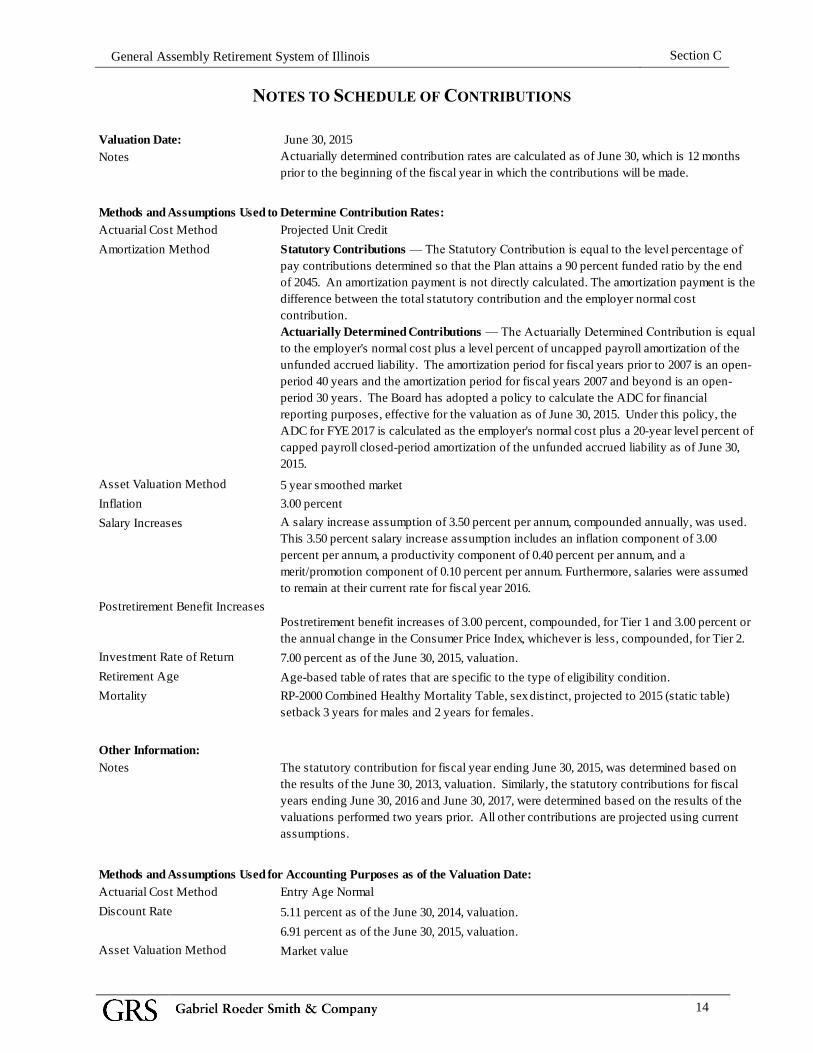
Valuation Date: June 30, 2015
Notes Actuarially determined contribution rates are calculated as of June 30, which is 12 months
prior to the beginning of the fiscal year in which the contributions will be made.
Methods and Assumptions Used to Determine Contribution Rates:
Actuarial Cost Method Projected Unit Credit
Amortization Method Statutory Contributions — The Statutory Contribution is equal to the level percentage of
pay contributions determined so that the Plan attains a 90 percent funded ratio by the end
of 2045. An amortization payment is not directly calculated. The amortization payment is the
difference between the total statutory contribution and the employer normal cost
contribution.
Actuarially Determined Contributions — The Actuarially Determined Contribution is equal
to the employer's normal cost plus a level percent of uncapped payroll amortization of the
unfunded accrued liability. The amortization period for fiscal years prior to 2007 is an open-
period 40 years and the amortization period for fiscal years 2007 and beyond is an open-
period 30 years. The Board has adopted a policy to calculate the ADC for financial
reporting purposes, effective for the valuation as of June 30, 2015. Under this policy, the
ADC for FYE 2017 is calculated as the employer's normal cost plus a 20-year level percent of
capped payroll closed-period amortization of the unfunded accrued liability as of June 30,
2015.
Asset Valuation Method 5 year smoothed market
Inflation 3.00 percent
Salary Increases A salary increase assumption of 3.50 percent per annum, compounded annually, was used.
This 3.50 percent salary increase assumption includes an inflation component of 3.00
percent per annum, a productivity component of 0.40 percent per annum, and a
merit/promotion component of 0.10 percent per annum. Furthermore, salaries were assumed
to remain at their current rate for fiscal year 2016.
Postretirement Benefit Increases
Postretirement benefit increases of 3.00 percent, compounded, for Tier 1 and 3.00 percent or
the annual change in the Consumer Price Index, whichever is less, compounded, for Tier 2.
Investment Rate of Return 7.00 percent as of the June 30, 2015, valuation.
Retirement Age Age-based table of rates that are specific to the type of eligibility condition.
Mortality RP-2000 Combined Healthy Mortality Table, sex distinct, projected to 2015 (static table)
setback 3 years for males and 2 years for females.
Other Information:
Notes The statutory contribution for fiscal year ending June 30, 2015, was determined based on
the results of the June 30, 2013, valuation. Similarly, the statutory contributions for fiscal
years ending June 30, 2016 and June 30, 2017, were determined based on the results of the
valuations performed two years prior. All other contributions are projected using current
assumptions.
Methods and Assumptions Used for Accounting Purposes as of the Valuation Date:
Actuarial Cost Method Entry Age Normal
Discount Rate 5.11 percent as of the June 30, 2014, valuation.
6.91 percent as of the June 30, 2015, valuation.
Asset Valuation Method Market value

Section C
15
General Assembly Retirement System of Illinois
SCHEDULE OF INVESTMENT RETURNS MULTIYEAR
FY Ending
June 30,
2014 18.12%
2015 3.24%
1 Annual money-weighted rate of return, net of investment expenses.
Annual
Return1
The annual money-weighted rate of returns, net of investment expenses for fiscal years ending June 30, 2014, and
June 30, 2015, were provided by the System.

16
SECTION D
NOTES TO FINANCIAL STATEMENTS Section D Notes to Financial Statements
Auditor’s Note – This information is intended to assist in preparation of the financial statements of
the General Assembly Retirement System of Illinois. Financial statements are the responsibility of
management, subject to the auditor’s review. Please let us know if the auditor recommends any
changes.
Section D
16
General Assembly Retirement System of Illinois
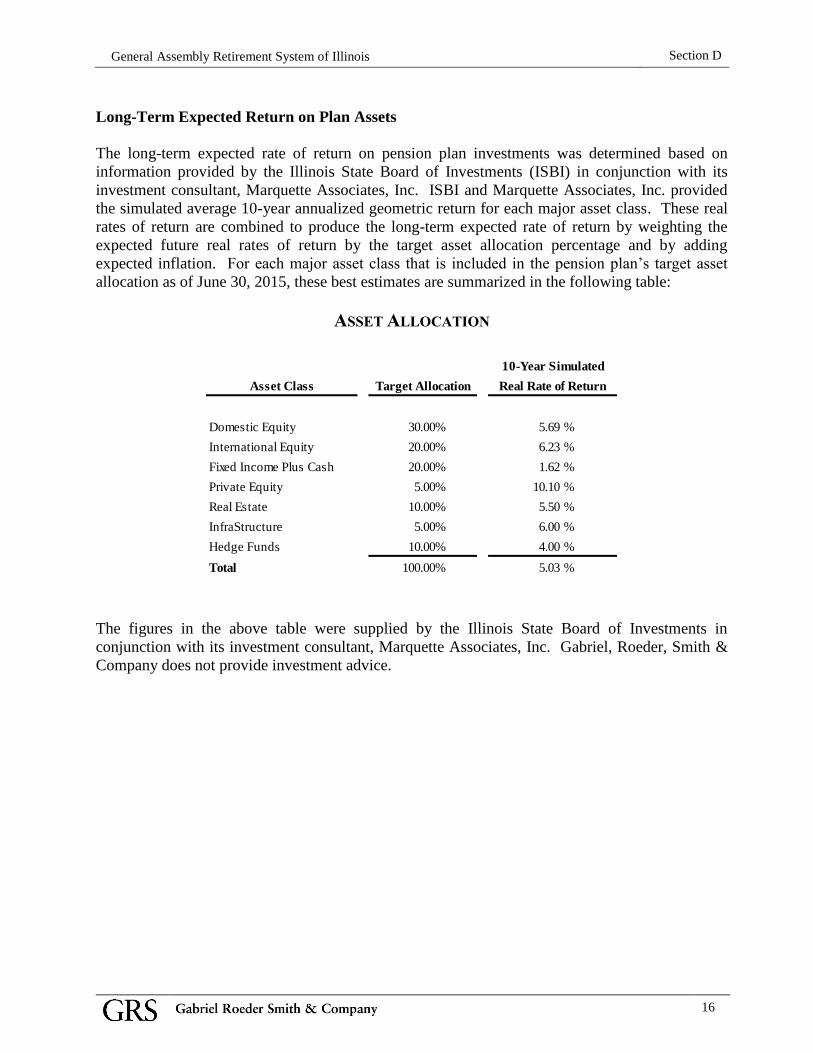
Long-Term Expected Return on Plan Assets
The long-term expected rate of return on pension plan investments was determined based on
information provided by the Illinois State Board of Investments (ISBI) in conjunction with its
investment consultant, Marquette Associates, Inc. ISBI and Marquette Associates, Inc. provided
the simulated average 10-year annualized geometric return for each major asset class. These real
rates of return are combined to produce the long-term expected rate of return by weighting the
expected future real rates of return by the target asset allocation percentage and by adding
expected inflation. For each major asset class that is included in the pension plan’s target asset
allocation as of June 30, 2015, these best estimates are summarized in the following table:
ASSET ALLOCATION
Asset Class
Domestic Equity 30.00% 5.69 %
International Equity 20.00% 6.23 %
Fixed Income Plus Cash 20.00% 1.62 %
Private Equity 5.00% 10.10 %
Real Estate 10.00% 5.50 %
InfraStructure 5.00% 6.00 %
Hedge Funds 10.00% 4.00 %
Total 100.00% 5.03 %
10-Year Simulated
Real Rate of ReturnTarget Allocation
The figures in the above table were supplied by the Illinois State Board of Investments in
conjunction with its investment consultant, Marquette Associates, Inc. Gabriel, Roeder, Smith &
Company does not provide investment advice.

Section D
17
General Assembly Retirement System of Illinois
Single Discount Rate
A Single Discount Rate of 6.91 percent was used to measure the total pension liability. This
Single Discount Rate was based on an expected rate of return on pension plan investments of 7.00
percent and a municipal bond rate of 3.80 percent. The projection of cash flows used to determine
this Single Discount Rate assumed that plan member contributions will be made at the current
contribution rate and that employer contributions will be made at rates equal to the difference
between actuarially determined contribution rates and the member rate. Based on these
assumptions, the pension plan’s fiduciary net position and future contributions were sufficient to
finance the benefit payments through the year 2066. As a result, the long-term expected rate of
return on pension plan investments was applied to projected benefit payments through the year
2066, and the municipal bond rate was applied to all benefit payments after that date.
Regarding the sensitivity of the net pension liability to changes in the Single Discount Rate, the
following presents the plan’s net pension liability, calculated using a Single Discount Rate of 6.91
percent, as well as what the plan’s net pension liability would be if it were calculated using a
Single Discount Rate that is one percent lower or one percent higher:
SENSITIVITY OF NET PENSION LIABILITY
TO THE SINGLE DISCOUNT RATE ASSUMPTION
Current Single Discount
1% Decrease Rate Assumption 1% Increase
5.91% 6.91% 7.91%
$ 315,165,353 $ 278,762,672 $ 248,033,875

Section D
18
General Assembly Retirement System of Illinois
SUMMARY OF POPULATION STATISTICS
Inactive Plan Members or Beneficiaries Currently Receiving Benefits 424
Inactive Plan Members Entitled to But Not Yet Receiving Benefits 75
Active Plan Members 145
Total Plan Members 644 Additional information about the member data used is included in the June 30, 2015, actuarial valuation report.

19
SECTION E
SUMMARY OF BENEFITS Section E Summary of Benefits

Section E
19
General Assembly Retirement System of Illinois
Summary of Retirement System Plan Provisions (As of June 30,
2015)
1. Participation. A person eligible for membership must participate in the system as a condition
of employment unless an “Election Not to Participate” is filed within 24 months from the date
of assuming office.
2. Member Contributions. All members of the system are required to contribute to the system the
following percentage of their salaries:
Retirement Annuity 8.5%
Automatic Annuity Increase 1.0
Survivor's Annuity 2.0
Total 11.5%
3. Retirement Annuity – Eligibility. A member who has at least 8 years of creditable service is
entitled to a retirement annuity upon attainment of age 55. A member with at least 4 years of
service but less than 8 years of service is entitled to a retirement annuity upon attainment of
age 62.
A member with at least 8 years of service who becomes disabled while in service is entitled to
a retirement annuity regardless of age.
4. Retirement Annuity – Amount. The retirement annuity is determined according to the
following formula based upon the member's final rate of salary:
- 3.0% for each of the first 4 years of service, plus
- 3.5% for each of the next 2 years of service, plus
- 4.0% for each of the next 2 years of service, plus
- 4.5% for each of the next 4 years of service, plus
- 5.0% for each year of service in excess of 12
The maximum retirement annuity is 85% of the final rate of salary.
5. Automatic Increase In Retirement Annuity. (a) Annual automatic increases of 3% of the
current amount of retirement annuity are provided. The initial increase is effective in the
month of January or July of the year next following the year in which the first anniversary of
retirement occurs, but in no event prior to attainment of age 60.
(b) Beginning January 1, 1990, for persons who become participants prior to August 8,
2003 and who remain in service after attaining 20 years of creditable service, 3%
annual automatic increases begin to accrue on January 1 next following the date the
participant attains age 55 or completes 20 years of creditable service, whichever occurs
later. For any person who has service credit for the entire period from January 15,
1969 through December 31, 1992, the increases shall accrue from age 50 instead of age
55. However, such increases shall not become payable until the January 1 or July 1
next following the first anniversary of retirement, or the first of the month following
attainment of age 60, whichever occurs later.

Section E
20
General Assembly Retirement System of Illinois
6. Survivor's Annuity – Eligibility. A surviving spouse without children is eligible for survivor
benefits at age 50 or over provided marriage to the member had been in effect for at least 1
year immediately prior to the member's death.
A surviving spouse with unmarried eligible children is eligible for a survivor's annuity benefit
at any age provided the above marriage requirements have been met. When all children are
disqualified because of death, marriage or attainment of age 18 or age 22 in the case of a
fulltime student, the spouse's benefit is suspended if the spouse is under age 50 until the
attainment of such age.
An unmarried eligible child under age 18 or under age 22 and a full-time student or over age
18 and disabled may qualify for the survivor's annuity if there is no surviving spouse or if the
spouse dies. Legally adopted children are eligible for survivor benefits on the same basis as
other children.
If the member dies in service as a member, the member must have at least 2 years of service
credit for survivor's annuity eligibility. If death occurs after termination of service but before
retirement, the deceased member must have at least 4 years of service credit for survivor's
annuity eligibility.
7. Survivor's Annuity – Amount. (a) A surviving spouse is entitled to a survivor's annuity of 66
2/3% of the amount of retirement annuity to which the member was entitled on the date of
death, without regard to whether the member had attained age 55 as of the time of death,
subject to a minimum payment of 10% of salary.
(b) If a surviving spouse has in his or her care eligible children, the survivor's annuity shall be
the greater of the following:
(1) 66 2/3% of the amount of retirement annuity to which the member was entitled on the date
of death, or (2) 30% of the member's salary increased by 10% of salary on account of each
eligible child, subject to a total payment for the surviving spouse and children of 50% of
salary. If only unmarried children survive, each such child shall be entitled to an annuity of
20% of salary, subject to a maximum total payment for all children of 50% of salary.
(c) Upon the death of a member after termination of service, or upon the death of an annuitant,
the maximum total payment to a surviving spouse and eligible children, or eligible children
alone if there is no surviving spouse, shall be 75% of the retirement annuity to which the
member or annuitant was entitled.
(d) Survivor's annuities are subject to annual automatic increases of 3% of the current amount
of annuity.
(e) The minimum survivor's annuity provided by the system is $300 per month.
(f) In the case of a proportional survivor's annuity under the Retirement Systems Reciprocal
Act, if the amount payable by the system on January 1, 1993, is less than $300 per month, the
amount shall be increased as of that date by $2 per month for each full year elapsed since the
annuity began.
Section E
21
General Assembly Retirement System of Illinois
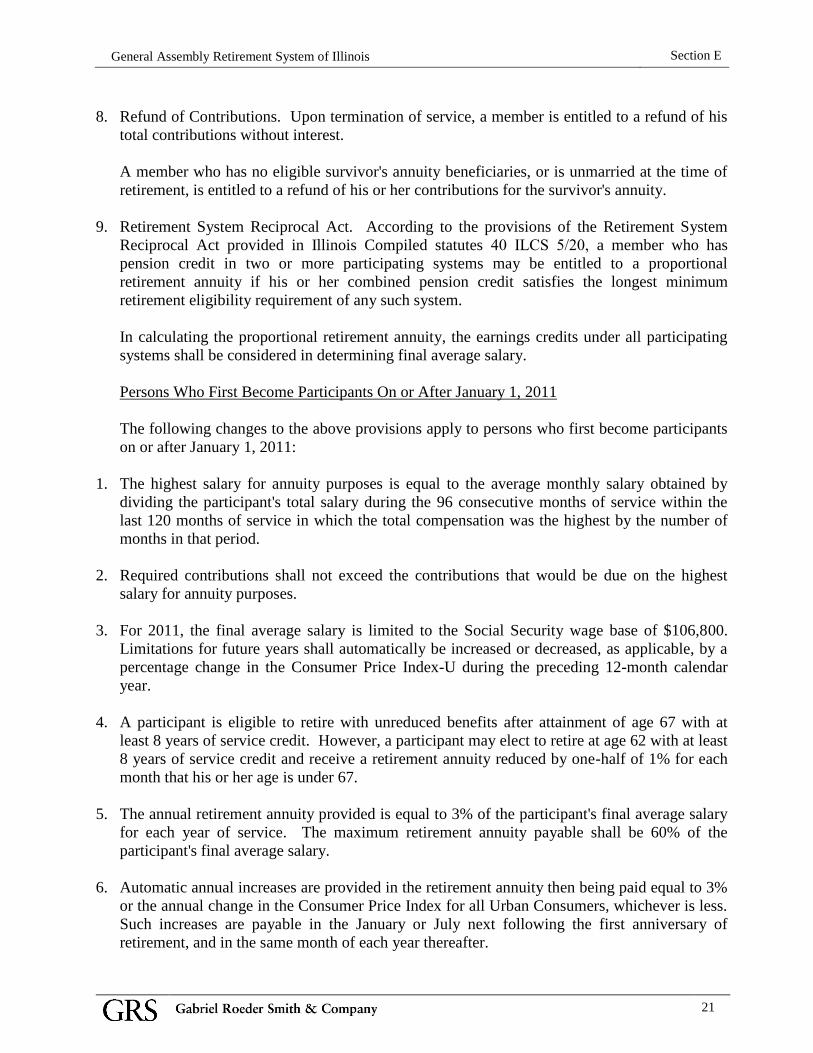
8. Refund of Contributions. Upon termination of service, a member is entitled to a refund of his
total contributions without interest.
A member who has no eligible survivor's annuity beneficiaries, or is unmarried at the time of
retirement, is entitled to a refund of his or her contributions for the survivor's annuity.
9. Retirement System Reciprocal Act. According to the provisions of the Retirement System
Reciprocal Act provided in Illinois Compiled statutes 40 ILCS 5/20, a member who has
pension credit in two or more participating systems may be entitled to a proportional
retirement annuity if his or her combined pension credit satisfies the longest minimum
retirement eligibility requirement of any such system.
In calculating the proportional retirement annuity, the earnings credits under all participating
systems shall be considered in determining final average salary.
Persons Who First Become Participants On or After January 1, 2011
The following changes to the above provisions apply to persons who first become participants
on or after January 1, 2011:
1. The highest salary for annuity purposes is equal to the average monthly salary obtained by
dividing the participant's total salary during the 96 consecutive months of service within the
last 120 months of service in which the total compensation was the highest by the number of
months in that period.
2. Required contributions shall not exceed the contributions that would be due on the highest
salary for annuity purposes.
3. For 2011, the final average salary is limited to the Social Security wage base of $106,800.
Limitations for future years shall automatically be increased or decreased, as applicable, by a
percentage change in the Consumer Price Index-U during the preceding 12-month calendar
year.
4. A participant is eligible to retire with unreduced benefits after attainment of age 67 with at
least 8 years of service credit. However, a participant may elect to retire at age 62 with at least
8 years of service credit and receive a retirement annuity reduced by one-half of 1% for each
month that his or her age is under 67.
5. The annual retirement annuity provided is equal to 3% of the participant's final average salary
for each year of service. The maximum retirement annuity payable shall be 60% of the
participant's final average salary.
6. Automatic annual increases are provided in the retirement annuity then being paid equal to 3%
or the annual change in the Consumer Price Index for all Urban Consumers, whichever is less.
Such increases are payable in the January or July next following the first anniversary of
retirement, and in the same month of each year thereafter.

Section E
22
General Assembly Retirement System of Illinois
7. Automatic annual increases are provided in the survivor annuity then being paid equal to 3%
or the annual change in the Consumer Price Index for all Urban Consumers, whichever is less.
Such increases are payable (1) on each January 1 occurring on or after the commencement of
the annuity if the deceased member died while receiving a retirement annuity, or (2) in other
cases, on each January 1 occurring on or after the first anniversary of the commencement of
the annuity.
8. The retirement annuity being paid is suspended when an annuitant accepts full time
employment in a position covered under the General Assembly Retirement System or any
other Article of the Illinois Pension Code. Upon termination of the employment, the
retirement annuity shall resume and, if appropriate, be recalculated.
9. Salary and COLA development for members hired on or after January 1, 2011, are shown in
the table below:
Year Maximum Annual
Ending CPI-U COLA Pensionable Earnings
2011 3.00% $106,800.00
2012 3.90% 3.00% $110,004.00
2013 2.00% 2.00% $112,204.08
2014 1.20% 1.20% $113,550.53
2015 1.70% 1.70% $115,480.89

23
SECTION F
ACTUARIAL COST METHOD AND ACTUARIAL ASSUMPTIONS Section F Actuarial Cost Methods and Assumptions

Section F
23
General Assembly Retirement System of Illinois
Valuation Methods — Calculation of the Total Pension Liability
Actuarial Cost Method – Normal cost and the allocation of benefit values between service
rendered before and after the valuation date were determined using an Individual Entry-Age
Actuarial Cost Method having the following characteristics:
(i) The annual normal cost for each individual active member, payable from the date of
employment to the date of retirement, is sufficient to accumulate the value of the
member’s benefit at the time of retirement; and
(ii) Each annual normal cost is a constant percentage of the member’s year by year
projected covered pay.
Valuation Methods — Calculation of the Statutory Contributions,
Actuarial Cost Method as Mandated by 40 ILCS 5/2-124, Adopted
June 30, 1989
The projected unit credit normal cost method is used. Under this method, the projected pension at
retirement age is first calculated and the value thereof at the individual member's current or
attained age is determined. The normal cost for the member for the current year is equal to the
value so determined divided by the member's projected service at retirement. The normal cost for
the plan for the year is the sum of the individual normal costs.
The actuarial liability at any point in time is the value of the projected pensions at that time less
the value of future normal costs.
For ancillary benefits for active members, in particular death and survivor benefits, termination
benefits, and the postretirement increases, the same procedure as outlined above is followed.
Estimated annual administrative expenses are added to the normal cost.
For valuation purposes, as well as projection purposes, an actuarial value of assets is used.
Appropriation Requirements Under P.A. 88-0593
The law governing the System under P.A. 88-0593 provides that:
For fiscal years 2011 through 2045, the minimum contribution to the System for each fiscal year
shall be an amount determined to be sufficient to cause the total assets of the System to equal 90
percent of the total actuarial liabilities of the System by the end of fiscal year 2045. In making
these determinations, the required contribution shall be calculated each year as a level-percentage-
of-payroll over the years remaining to and including fiscal year 2045 and shall be determined
under the projected unit credit actuarial cost method. For fiscal years 1997 through 2010, the
minimum contribution to the System, as a percentage of the payroll, shall be increased in equal
annual increments so that by fiscal year 2010, the contribution rate is at the same level as the
contribution rate for fiscal years 2011 through 2045.
Section F
24
General Assembly Retirement System of Illinois
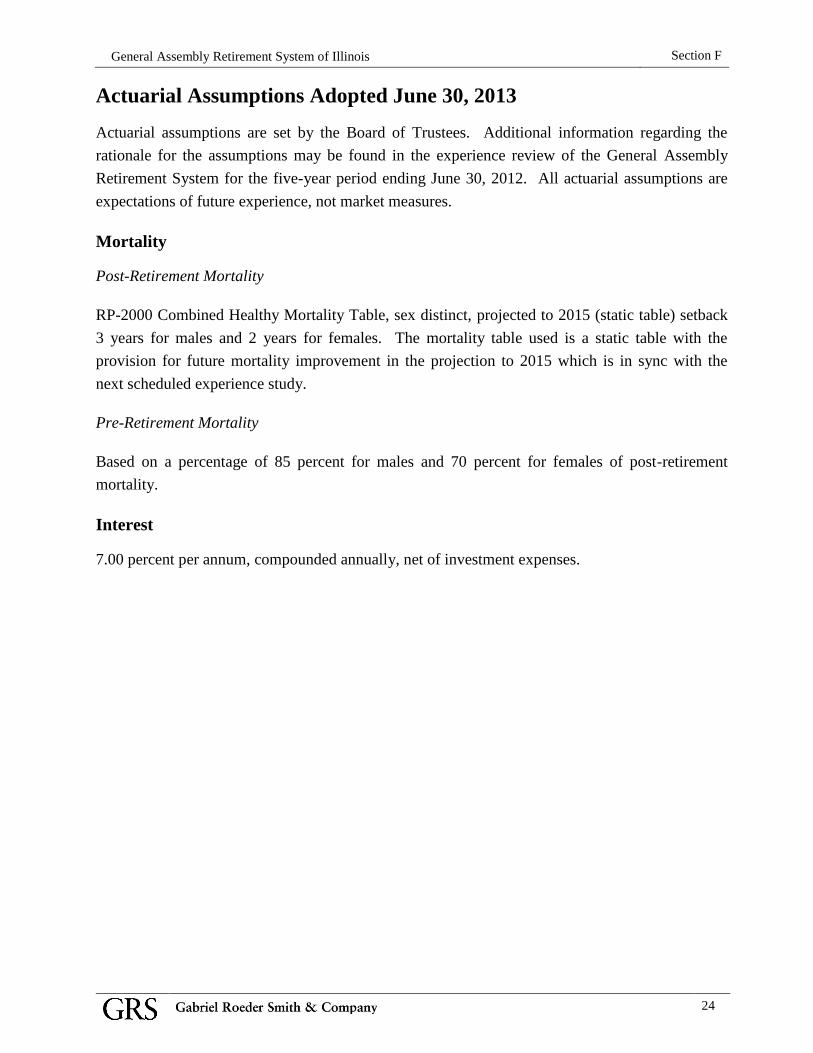
Actuarial Assumptions Adopted June 30, 2013
Actuarial assumptions are set by the Board of Trustees. Additional information regarding the
rationale for the assumptions may be found in the experience review of the General Assembly
Retirement System for the five-year period ending June 30, 2012. All actuarial assumptions are
expectations of future experience, not market measures.
Mortality
Post-Retirement Mortality
RP-2000 Combined Healthy Mortality Table, sex distinct, projected to 2015 (static table) setback
3 years for males and 2 years for females. The mortality table used is a static table with the
provision for future mortality improvement in the projection to 2015 which is in sync with the
next scheduled experience study.
Pre-Retirement Mortality
Based on a percentage of 85 percent for males and 70 percent for females of post-retirement
mortality.
Interest
7.00 percent per annum, compounded annually, net of investment expenses.

Section F
25
General Assembly Retirement System of Illinois
General Inflation
3.00 percent per annum, compounded annually.
This assumption serves as the basis for the determination of Tier Two pay cap growth and annual
increases that are equal to the lesser of 3.0 percent or the annual change in the consumer price
index-u during the preceding 12-month calendar year.
Marriage Assumption
75.0 percent of active and retired participants are assumed to be married.
Termination
Rates of withdrawal are assumed to be equal to 0.04 for all ages 20 through 65.
It is assumed that terminated employees will not be rehired. The rates apply only to employees
who have not fulfilled the service requirement necessary for retirement at any given age.
Salary Increases
A salary increase assumption of 3.50 percent per annum, compounded annually, was used. This
3.50 percent salary increase assumption includes an inflation component of 3.00 percent per
annum, a productivity component of 0.40 percent per annum, and a merit/promotion component of
0.10 percent per annum. Furthermore, salaries were assumed to remain at their current rate for
fiscal year 2016.
Inactive Member Pay Increases
Ten percent load on inactive vested liabilities to reflect increases in inactive members’ pay due to
current participation in a reciprocal retirement system.
Disability
No assumption for disability.

Section F
26
General Assembly Retirement System of Illinois
Population Projection
For purposes of determining annual appropriation as a percent of total covered payroll, the size of
the active group is projected to decrease from 145 members as of the valuation date, to 75
members in 2045 and ultimately reach 73 members in 2051, due to the assumption that 50 percent
of future members will elect to opt out of the pension system. New entrants are assumed to enter
with an average age and average pay as disclosed below. The new entrant profile is based on the
averages for all current active members. The average increase in uncapped payroll for the
projection period is 3.5 percent per annum.
New Entrant Profile
Age
Uncapped Capped
Group No. Salary Salary
Under 20 20-24 25-29 10 $ 810,810 $ 810,810 30-34 22 1,888,084 1,826,836 35-39 28 2,309,787 2,309,787 40-44 25 1,937,646 1,937,646 45-49 21 1,734,358 1,693,298 50-54 16 1,226,499 1,226,499 55-59 13 1,003,205 1,003,205 60-64 1 78,163 78,163 65-69 70 & Over
Total 136 $ 10,988,552 $ 10,886,244
Avg. Salary
$ 80,798 $ 80,046
Avg. Age
42.54 Percent Male
72.06%
Retirement
Employees are assumed to retire in accordance with the rates shown below. The rates apply only
to employees who have fulfilled the service requirement necessary for retirement at any given age.
Age Male & Female
55 10.00%
56 - 79 8.50%
80 100.00%
Retirement Rates

Section F
27
General Assembly Retirement System of Illinois
Assets
The Plan Fiduciary Net Position is used for GASB reporting purposes. The asset method used to
project contributions is prescribed by statute. A description of this method can be found in the
June 30, 2015, actuarial valuation report.
Expenses
As estimated and advised by GARS staff, based on current expenses and are expected to increase
in relation to the projected capped payroll.
Spouse's Age
The female spouse is assumed to be four years younger than the male spouse.
Decrement Timing
All decrements are assumed to occur beginning of year.
Decrement Relativity
Decrement rates are used directly from the experience study, without adjustment for multiple
decrement table effects.
Decrement Operation
Turnover decrements do not operate after member reaches retirement eligibility.
Eligibility Testing
Eligibility for benefits is determined based upon the age nearest birthday and service on the date
the decrement is assumed to occur.

Section F
28
General Assembly Retirement System of Illinois
Assumptions as a Result of Public Act 96-0889
Members hired after December 31, 2010, are assumed to make contributions on salary up to the
final average compensation cap in a given year until this plan provision or administrative
procedure is clarified.
State contributions, expressed as a percentage of pay, are calculated based upon capped pay.
Retirement rates for tier two members to account for the change in retirement age, as follows:
Age Male & Female
62 40.00%
63 15.00%
64 20.00%
65 25.00%
66 30.00%
67 40.00%
68 - 79 5.00%
80 100.00%
Retirement Rates

Section F
29
General Assembly Retirement System of Illinois
Projection Methodology Adopted June 30, 2005, and Amended June
30, 2009
Appropriation Requirements Under P.A. 93-0002, P.A. 94-0004, and
P.A. 96-0043
State Contributions under P.A. 93-0002
In general, for each year during the life of the GOB program, the state contributions to the System
are to be calculated as follows:
1. Calculation of the contribution maximum
a. A projection of contributions will be made from the valuation date to June 30, 2045. Such
projection will be based on hypothetical asset values determined using the following
assumptions:
i) That the System had received no portion of the general obligation bond proceeds in
excess of the scheduled contributions for the remainder of fiscal 2003 and for the
entirety of 2004,
ii) That hypothetical state contributions had been made each fiscal year from 2005
through the valuation date, based on the funding process in place prior to P.A. 93-0002
(without regard to prior state minimum requirements),
iii) That the actual amounts of member contributions and the actual cash outflows (benefit
payments, refunds and administrative expenses) for each year prior to the valuation
date were realized, and
iv) That the hypothetical fund earned returns in each prior fiscal year equal to the rate of
total return actually earned by the retirement fund in that year.
b. The hypothetical asset values developed in a., above, will not exceed the actual assets of
the fund.
c. A projection of maximum contributions for each year of the GOB program will be
performed each year, by reducing the contributions produced in a., above, by the respective
amount of debt service allocated to the System for each year.
2. Calculation of the contribution with GOB proceeds
a. The basic projection of state contributions from the valuation date through June 30, 2045,
will be made, taking into account all assets of the System, including the GOB proceeds.
b. State contribution rates (expressed as a percentage of covered pay), in the pattern required
by the funding sections of the statutes, are calculated.
c. In those projections, the dollars of state contributions which are added to assets each year
during the GOB program are limited by the contribution maximum. Because the bonds are
to be liquidated by the end of fiscal 2033, there is no contribution maximum thereafter.
Section F
30
General Assembly Retirement System of Illinois
State Contributions under P.A. 94-0004
The following is an excerpt from the Illinois Compiled statutes 40 ILCS 5/2-124:
(c) Notwithstanding any other provision of this Article, the total required State contribution
for fiscal year 2006 is $4,157,000.
Notwithstanding any other provision of this Article, the total required State contribution
for fiscal year 2007 is $5,220,300.
For each State fiscal years 2008 through 2010, the State contribution to the System, as a
percentage of the applicable employee payroll, shall be increased in equal annual increments
from the required State contribution for State fiscal year 2007, so that by State fiscal year
2011, the State is contributing at a rate otherwise required under this Section.
State Contributions under P.A. 96-0043
The following is an excerpt from the Illinois Compiled statutes 40 ILCS 5/2-124:
(d) For purposes of determining the required State contribution to the System, the value of the
System's assets shall be equal to the actuarial value of the System's assets, which shall be
calculated as follows:
As of June 30, 2008, the actuarial value of the System's assets shall be equal to the market
value of the assets as of that date. In determining the actuarial value of the System's assets
for fiscal years after June 30, 2008, any actuarial gains or losses from investment return
incurred in a fiscal year shall be recognized in equal annual amounts over the 5-year period
following that fiscal year.
(e) For purposes of determining the required State contribution to the system for a particular
year, the actuarial value of assets shall be assumed to earn a rate of return equal to the system's
actuarially assumed rate of return.

31
SECTION G
CALCULATION OF THE SINGLE DISCOUNT RATE Section G Calculation of the Single Discount Rate

Section G
31
General Assembly Retirement System of Illinois
CALCULATION OF THE SINGLE DISCOUNT RATE
GASB Statements Nos. 67 and 68 includes a specific requirement for the discount rate that is used
for the purpose of the measurement of the Total Pension Liability. This rate considers the ability
of the fund to meet benefit obligations in the future. To make this determination, employer
contributions, employee contributions, benefit payments, expenses and investment returns are
projected into the future. The Plan Net Position (assets) in future years can then be determined
and compared to its obligation to make benefit payments in those years. As long as assets are
projected to be on hand in a future year, the assumed valuation discount rate is used. In years
where assets are not projected to be sufficient to meet benefit payments, the use of a municipal
bond rate is required, as described in the following paragraph.
The Single Discount Rate (SDR) is equivalent to applying these two rates to the benefits that are
projected to be paid during the different time periods. The SDR reflects (1) the long-term
expected rate of return on pension plan investments (during the period in which the fiduciary net
position is projected to be sufficient to pay benefits) and (2) tax-exempt municipal bond rate based
on an index of 20-year general obligation bonds with an average AA credit rating (which is
published by the Federal Reserve) as of the measurement date (to the extent that the contributions
for use with the long-term expected rate of return are not met).
For the purpose of this valuation, the expected rate of return on pension plan investments is 7.00
percent; the municipal bond rate is 3.80 percent; and the resulting Single Discount Rate is 6.91
percent.
The sponsor finances benefits using a funding policy defined in state statute. Sponsor
contributions are calculated as a level percentage of payroll contributions needed to attain a funded
status of 90 percent in 2045 under the Projected Unit Credit cost method. After 2045, the sponsor
makes a contribution such that the funded status remains at 90 percent. The statutory contribution
does not explicitly separate projected employer contributions between current plan members and
future plan members.
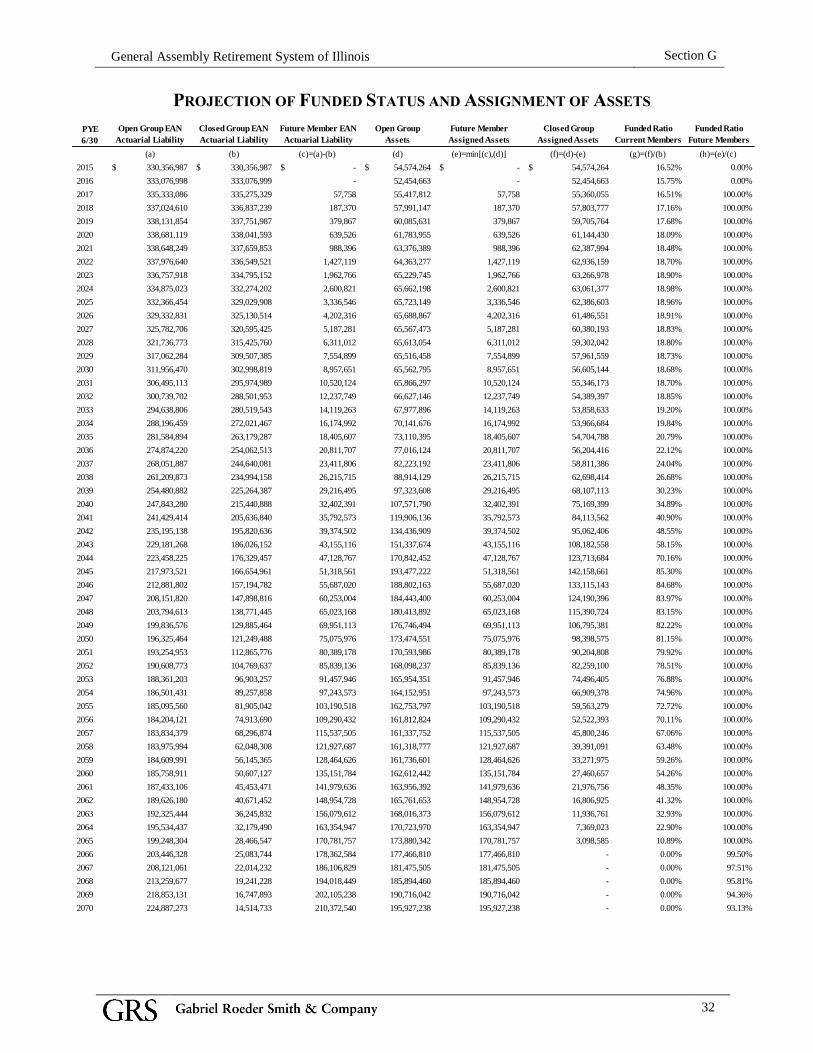
For purposes of developing the Single Discount Rate, we have projected actuarial liabilities on an
Entry Age Normal basis, and compared against projected market value of assets. We have
assumed the actuarial liability for future members will be fully financed, to the extent that assets
are available, and any remaining asset will be assigned to current plan members. Based on this
assignment of assets and employer contributions, plan assets assigned to current plan members are
projected to be depleted by 2066.
The tables in this section provide background for the development of the Single Discount Rate.
The following tables show the assignment of assets and employer contributions and the projection
of assets for current members as of the valuation date. Our projections assume the sponsor will
make the required statutory contributions. The projections are based on the statutory funding
projections performed during the June 30, 2015, actuarial valuation.
Total administrative expenses are assumed to increase at the same rate of payroll increases. Total
administrative expenses are allocated between current and future hires by total payroll.
Section G
32
General Assembly Retirement System of Illinois
PROJECTION OF FUNDED STATUS AND ASSIGNMENT OF ASSETS
Open Group EAN
Actuarial Liability
Closed Group EAN
Actuarial Liability
Future Member EAN
Actuarial Liability
Open Group
Assets
Future Member
Assigned Assets
Closed Group
Assigned Assets
Funded Ratio
Current Members
Funded Ratio
Future Members
(a) (b) (c)=(a)-(b) (d) (e)=min[(c),(d)] (f)=(d)-(e) (g)=(f)/(b) (h)=(e)/(c)
2015 330,356,987$ 330,356,987$ -$ 54,574,264$ -$ 54,574,264$ 16.52% 0.00%
2016 333,076,998 333,076,999 - 52,454,663 - 52,454,663 15.75% 0.00%
2017 335,333,086 335,275,329 57,758 55,417,812 57,758 55,360,055 16.51% 100.00%
2018 337,024,610 336,837,239 187,370 57,991,147 187,370 57,803,777 17.16% 100.00%
2019 338,131,854 337,751,987 379,867 60,085,631 379,867 59,705,764 17.68% 100.00%
2020 338,681,119 338,041,593 639,526 61,783,955 639,526 61,144,430 18.09% 100.00%
2021 338,648,249 337,659,853 988,396 63,376,389 988,396 62,387,994 18.48% 100.00%
2022 337,976,640 336,549,521 1,427,119 64,363,277 1,427,119 62,936,159 18.70% 100.00%
2023 336,757,918 334,795,152 1,962,766 65,229,745 1,962,766 63,266,978 18.90% 100.00%
2024 334,875,023 332,274,202 2,600,821 65,662,198 2,600,821 63,061,377 18.98% 100.00%
2025 332,366,454 329,029,908 3,336,546 65,723,149 3,336,546 62,386,603 18.96% 100.00%
2026 329,332,831 325,130,514 4,202,316 65,688,867 4,202,316 61,486,551 18.91% 100.00%
2027 325,782,706 320,595,425 5,187,281 65,567,473 5,187,281 60,380,193 18.83% 100.00%
2028 321,736,773 315,425,760 6,311,012 65,613,054 6,311,012 59,302,042 18.80% 100.00%
2029 317,062,284 309,507,385 7,554,899 65,516,458 7,554,899 57,961,559 18.73% 100.00%
2030 311,956,470 302,998,819 8,957,651 65,562,795 8,957,651 56,605,144 18.68% 100.00%
2031 306,495,113 295,974,989 10,520,124 65,866,297 10,520,124 55,346,173 18.70% 100.00%
2032 300,739,702 288,501,953 12,237,749 66,627,146 12,237,749 54,389,397 18.85% 100.00%
2033 294,638,806 280,519,543 14,119,263 67,977,896 14,119,263 53,858,633 19.20% 100.00%
2034 288,196,459 272,021,467 16,174,992 70,141,676 16,174,992 53,966,684 19.84% 100.00%
2035 281,584,894 263,179,287 18,405,607 73,110,395 18,405,607 54,704,788 20.79% 100.00%
2036 274,874,220 254,062,513 20,811,707 77,016,124 20,811,707 56,204,416 22.12% 100.00%
2037 268,051,887 244,640,081 23,411,806 82,223,192 23,411,806 58,811,386 24.04% 100.00%
2038 261,209,873 234,994,158 26,215,715 88,914,129 26,215,715 62,698,414 26.68% 100.00%
2039 254,480,882 225,264,387 29,216,495 97,323,608 29,216,495 68,107,113 30.23% 100.00%
2040 247,843,280 215,440,888 32,402,391 107,571,790 32,402,391 75,169,399 34.89% 100.00%
2041 241,429,414 205,636,840 35,792,573 119,906,136 35,792,573 84,113,562 40.90% 100.00%
2042 235,195,138 195,820,636 39,374,502 134,436,909 39,374,502 95,062,406 48.55% 100.00%
2043 229,181,268 186,026,152 43,155,116 151,337,674 43,155,116 108,182,558 58.15% 100.00%
2044 223,458,225 176,329,457 47,128,767 170,842,452 47,128,767 123,713,684 70.16% 100.00%
2045 217,973,521 166,654,961 51,318,561 193,477,222 51,318,561 142,158,661 85.30% 100.00%
2046 212,881,802 157,194,782 55,687,020 188,802,163 55,687,020 133,115,143 84.68% 100.00%
2047 208,151,820 147,898,816 60,253,004 184,443,400 60,253,004 124,190,396 83.97% 100.00%
2048 203,794,613 138,771,445 65,023,168 180,413,892 65,023,168 115,390,724 83.15% 100.00%
2049 199,836,576 129,885,464 69,951,113 176,746,494 69,951,113 106,795,381 82.22% 100.00%
2050 196,325,464 121,249,488 75,075,976 173,474,551 75,075,976 98,398,575 81.15% 100.00%
2051 193,254,953 112,865,776 80,389,178 170,593,986 80,389,178 90,204,808 79.92% 100.00%
2052 190,608,773 104,769,637 85,839,136 168,098,237 85,839,136 82,259,100 78.51% 100.00%
2053 188,361,203 96,903,257 91,457,946 165,954,351 91,457,946 74,496,405 76.88% 100.00%
2054 186,501,431 89,257,858 97,243,573 164,152,951 97,243,573 66,909,378 74.96% 100.00%
2055 185,095,560 81,905,042 103,190,518 162,753,797 103,190,518 59,563,279 72.72% 100.00%
2056 184,204,121 74,913,690 109,290,432 161,812,824 109,290,432 52,522,393 70.11% 100.00%
2057 183,834,379 68,296,874 115,537,505 161,337,752 115,537,505 45,800,246 67.06% 100.00%
2058 183,975,994 62,048,308 121,927,687 161,318,777 121,927,687 39,391,091 63.48% 100.00%
2059 184,609,991 56,145,365 128,464,626 161,736,601 128,464,626 33,271,975 59.26% 100.00%
2060 185,758,911 50,607,127 135,151,784 162,612,442 135,151,784 27,460,657 54.26% 100.00%
2061 187,433,106 45,453,471 141,979,636 163,956,392 141,979,636 21,976,756 48.35% 100.00%
2062 189,626,180 40,671,452 148,954,728 165,761,653 148,954,728 16,806,925 41.32% 100.00%
2063 192,325,444 36,245,832 156,079,612 168,016,373 156,079,612 11,936,761 32.93% 100.00%
2064 195,534,437 32,179,490 163,354,947 170,723,970 163,354,947 7,369,023 22.90% 100.00%
2065 199,248,304 28,466,547 170,781,757 173,880,342 170,781,757 3,098,585 10.89% 100.00%
2066 203,446,328 25,083,744 178,362,584 177,466,810 177,466,810 - 0.00% 99.50%
2067 208,121,061 22,014,232 186,106,829 181,475,505 181,475,505 - 0.00% 97.51%
2068 213,259,677 19,241,228 194,018,449 185,894,460 185,894,460 - 0.00% 95.81%
2069 218,853,131 16,747,893 202,105,238 190,716,042 190,716,042 - 0.00% 94.36%
2070 224,887,273 14,514,733 210,372,540 195,927,238 195,927,238 - 0.00% 93.13%
PYE
6/30

Section G
33
General Assembly Retirement System of Illinois
CURRENT MEMBER PROJECTION OF ASSETS AND ASSIGNMENT OF EMPLOYER
CONTRIBUTIONS
Assets (boy)
Member
Contributions
Administrative
Expenses Benefit Payments
Assigned Employer
Contribution
Income on Cash
Flow
Income on
Assigned
Contribution
Total Investment
Income Assets (eoy)
2016 54,574,264$ 1,458,866$ 414,000$ 22,860,086$ 16,073,000$ 3,069,579$ 553,040$ 3,622,620$ 52,454,663$
2017 52,454,663 1,240,153 351,933 23,324,063 21,694,903 2,899,853 746,479 3,646,332 55,360,055
2018 55,360,055 1,198,706 340,171 23,990,118 21,747,718 3,079,291 748,296 3,827,588 57,803,777
2019 57,803,777 1,164,380 330,430 24,617,290 21,710,388 3,227,926 747,012 3,974,938 59,705,764
2020 59,705,764 1,127,721 320,027 25,171,246 21,713,981 3,341,101 747,136 4,088,237 61,144,430
2021 61,144,430 1,087,365 308,575 25,679,383 21,965,053 3,423,329 755,774 4,179,104 62,387,994
2022 62,387,994 1,027,434 291,567 26,244,372 21,816,545 3,489,462 750,665 4,240,126 62,936,159
2023 62,936,159 985,956 279,797 26,654,619 22,009,287 3,512,695 757,297 4,269,992 63,266,978
2024 63,266,978 932,350 264,584 27,153,868 22,005,966 3,517,354 757,182 4,274,536 63,061,377
2025 63,061,377 886,225 251,495 27,538,619 21,984,098 3,488,586 756,430 4,245,016 62,386,603
2026 62,386,603 834,077 236,696 27,832,574 22,143,282 3,429,952 761,907 4,191,859 61,486,551
2027 61,486,551 791,280 224,551 28,070,913 22,273,737 3,357,693 766,396 4,124,089 60,380,193
2028 60,380,193 750,085 212,861 28,271,054 22,605,521 3,272,347 777,812 4,050,158 59,302,042
2029 59,302,042 712,448 202,180 28,519,560 22,700,337 3,187,398 781,074 3,968,472 57,961,559
2030 57,961,559 664,368 188,536 28,579,002 22,869,526 3,090,334 786,896 3,877,230 56,605,144
2031 56,605,144 620,917 176,205 28,546,582 23,054,219 2,995,430 793,251 3,788,680 55,346,173
2032 55,346,173 583,300 165,530 28,410,150 23,322,069 2,911,069 802,467 3,713,536 54,389,397
2033 54,389,397 543,203 154,151 28,292,705 23,709,930 2,847,148 815,812 3,662,960 53,858,633
2034 53,858,633 498,080 141,346 28,152,449 24,255,474 2,813,708 834,583 3,648,292 53,966,684
2035 53,966,684 456,429 129,526 27,823,715 24,558,356 2,831,556 845,005 3,676,561 54,704,788
2036 54,704,788 417,108 118,368 27,414,940 24,863,987 2,896,320 855,521 3,751,841 56,204,416
2037 56,204,416 383,463 108,820 27,007,930 25,450,099 3,014,469 875,688 3,890,157 58,811,386
2038 58,811,386 346,976 98,465 26,520,842 26,050,205 3,212,817 896,337 4,109,154 62,698,414
2039 62,698,414 317,044 89,972 25,895,107 26,653,922 3,505,702 917,109 4,422,811 68,107,113
2040 68,107,113 294,669 83,622 25,258,288 27,265,696 3,905,671 938,159 4,843,831 75,169,399
2041 75,169,399 260,392 73,895 24,520,499 27,893,820 4,424,573 959,772 5,384,344 84,113,562
2042 84,113,562 235,869 66,935 23,799,976 28,523,594 5,074,851 981,441 6,056,292 95,062,406
2043 95,062,406 206,174 58,508 23,058,471 29,161,515 5,866,052 1,003,391 6,869,443 108,182,558
2044 108,182,558 178,927 50,776 22,250,845 29,816,319 6,811,580 1,025,921 7,837,502 123,713,684
2045 123,713,684 156,562 44,429 21,522,419 30,869,821 7,923,272 1,062,170 8,985,442 142,158,661
2046 142,158,661 135,302 38,396 20,639,883 2,180,180 9,244,263 75,016 9,319,278 133,115,143
2047 133,115,143 125,350 35,572 19,795,324 2,069,559 8,640,031 71,209 8,711,240 124,190,396
2048 124,190,396 106,090 30,106 18,981,416 1,994,311 8,042,829 68,620 8,111,449 115,390,724
2049 115,390,724 91,748 26,037 18,103,279 1,919,467 7,456,713 66,045 7,522,758 106,795,381
2050 106,795,381 75,358 21,385 17,239,462 1,840,981 6,884,358 63,345 6,947,702 98,398,575
2051 98,398,575 62,629 17,773 16,387,965 1,763,111 6,325,566 60,665 6,386,231 90,204,808
2052 90,204,808 50,298 14,274 15,530,874 1,709,144 5,781,189 58,808 5,839,997 82,259,100
2053 82,259,100 42,307 12,006 14,748,448 1,647,066 5,251,714 56,672 5,308,387 74,496,405
2054 74,496,405 33,888 9,617 13,983,960 1,583,745 4,734,423 54,494 4,788,916 66,909,378
2055 66,909,378 24,673 7,002 13,180,618 1,533,343 4,230,745 52,759 4,283,505 59,563,279
2056 59,563,279 22,210 6,303 12,330,867 1,477,538 3,745,696 50,839 3,796,535 52,522,393
2057 52,522,393 20,347 5,774 11,493,849 1,426,460 3,281,588 49,082 3,330,670 45,800,246
2058 45,800,246 19,231 5,458 10,685,684 1,376,571 2,838,818 47,365 2,886,183 39,391,091
2059 39,391,091 15,534 4,408 9,917,330 1,324,976 2,416,523 45,590 2,462,113 33,271,975
2060 33,271,975 9,912 2,813 9,164,012 1,287,334 2,013,967 44,295 2,058,261 27,460,657
2061 27,460,657 8,817 2,502 8,415,796 1,249,688 1,632,892 42,999 1,675,892 21,976,756
2062 21,976,756 7,191 2,041 7,704,300 1,214,083 1,273,460 41,774 1,315,235 16,806,925
2063 16,806,925 5,244 1,488 7,032,961 1,183,690 934,624 40,728 975,352 11,936,761
2064 11,936,761 3,555 1,009 6,386,062 1,159,936 615,929 39,911 655,840 7,369,023
2065 7,369,023 3,408 967 5,769,141 1,139,639 317,411 39,213 356,623 3,098,585
2066 3,098,585 3,257 924 5,197,787 1,990,254 38,135 68,481 106,616 -
2067 - 1,762 500 4,665,263 4,664,001 (160,479) 160,479 - -
2068 - 575 163 4,170,501 4,170,089 (143,485) 143,485 - -
2069 - - - 3,712,482 3,712,482 (127,739) 127,739 - -
2070 - - - 3,292,233 3,292,233 (113,279) 113,279 - -
PYE 6/30

Section G
34
General Assembly Retirement System of Illinois
DEVELOPMENT OF SINGLE DISCOUNT RATE
Benefit Payments
Discount
Rate
Discounted Benefit
Payment
Single
Discount
Rate
Discounted Benefit
Payment
2016 22,860,086$ 7.00% 22,099,679$ 6.91% 22,109,026$
2017 23,324,063 7.00% 21,073,105 6.91% 21,099,854
2018 23,990,118 7.00% 20,256,898 6.91% 20,299,771
2019 24,617,290 7.00% 19,426,610 6.91% 19,484,196
2020 25,171,246 7.00% 18,564,263 6.91% 18,635,046
2021 25,679,383 7.00% 17,700,022 6.91% 17,782,542
2022 26,244,372 7.00% 16,906,030 6.91% 16,999,219
2023 26,654,619 7.00% 16,047,011 6.91% 16,149,116
2024 27,153,868 7.00% 15,278,109 6.91% 15,388,330
2025 27,538,619 7.00% 14,480,924 6.91% 14,597,734
2026 27,832,574 7.00% 13,678,035 6.91% 13,800,034
2027 28,070,913 7.00% 12,892,677 6.91% 13,018,676
2028 28,271,054 7.00% 12,135,140 6.91% 12,264,103
2029 28,519,560 7.00% 11,440,943 6.91% 11,572,312
2030 28,579,002 7.00% 10,714,756 6.91% 10,846,956
2031 28,546,582 7.00% 10,002,431 6.91% 10,134,409
2032 28,410,150 7.00% 9,303,389 6.91% 9,434,119
2033 28,292,705 7.00% 8,658,813 6.91% 8,787,914
2034 28,152,449 7.00% 8,052,232 6.91% 8,179,203
2035 27,823,715 7.00% 7,437,577 6.91% 7,561,247
2036 27,414,940 7.00% 6,848,885 6.91% 6,968,657
2037 27,007,930 7.00% 6,305,798 6.91% 6,421,502
2038 26,520,842 7.00% 5,786,984 6.91% 5,898,154
2039 25,895,107 7.00% 5,280,790 6.91% 5,386,790
2040 25,258,288 7.00% 4,813,948 6.91% 4,914,731
2041 24,520,499 7.00% 4,367,601 6.91% 4,462,812
2042 23,799,976 7.00% 3,961,926 6.91% 4,051,719
2043 23,058,471 7.00% 3,587,374 6.91% 3,671,782
2044 22,250,845 7.00% 3,235,257 6.91% 3,314,182
2045 21,522,419 7.00% 2,924,621 6.91% 2,998,503
2046 20,639,883 7.00% 2,621,211 6.91% 2,689,701
2047 19,795,324 7.00% 2,349,490 6.91% 2,412,920
2048 18,981,416 7.00% 2,105,503 6.91% 2,164,175
2049 18,103,279 7.00% 1,876,725 6.91% 1,930,655
2050 17,239,462 7.00% 1,670,257 6.91% 1,719,707
2051 16,387,965 7.00% 1,483,887 6.91% 1,529,112
2052 15,530,874 7.00% 1,314,280 6.91% 1,355,482
2053 14,748,448 7.00% 1,166,419 6.91% 1,204,003
2054 13,983,960 7.00% 1,033,605 6.91% 1,067,813
2055 13,180,618 7.00% 910,493 6.91% 941,422
2056 12,330,867 7.00% 796,069 6.91% 823,807
2057 11,493,849 7.00% 693,488 6.91% 718,259
2058 10,685,684 7.00% 602,548 6.91% 624,599
2059 9,917,330 7.00% 522,637 6.91% 542,222
2060 9,164,012 7.00% 451,344 6.91% 468,653
2061 8,415,796 7.00% 387,377 6.91% 402,573
2062 7,704,300 7.00% 331,427 6.91% 344,720
2063 7,032,961 7.00% 282,754 6.91% 294,344
2064 6,386,062 7.00% 239,950 6.91% 249,996
2065 5,769,141 7.00% 202,588 6.91% 211,249
2066 5,197,787 7.00% 286,454 6.91% 178,027
2067 4,665,263 3.80% 683,459 6.91% 149,461
2068 4,170,501 3.80% 588,609 6.91% 124,975
2069 3,712,482 3.80% 504,784 6.91% 104,060
2070 3,292,233 3.80% 431,256 6.91% 86,316
2080 769,714 3.80% 69,438 6.91% 10,346
2090 92,864 3.80% 5,770 6.91% 640
2100 5,460 3.80% 234 6.91% 19
2110 68 3.80% 2 6.91% 0
2111 36 3.80% 1 6.91% 0
2112 18 3.80% 0 6.91% 0
2113 11 3.80% 0 6.91% 0
2114 7 3.80% 0 6.91% 0
Total Present Value 358,940,274$ 358,940,274$
PYE
6/30

Section G
35
General Assembly Retirement System of Illinois
0
20
40
60
80
100
120
140
160
$ [millions]
Year
PROJECTION OF PLAN NET POSITION AND BENEFIT PAYMENTS
Projected Plan Net Position Projected Benefit Payments for Current Members

36
SECTION H
GLOSSARY OF TERMS Section H Financial Statements

Section H
36
General Assembly Retirement System of Illinois
GLOSSARY OF TERMS Accrued Service Service credited under the system which was rendered before the date of
the actuarial valuation.
Actuarial Accrued Liability
(AAL)
The AAL is the difference between the actuarial present value of all
benefits and the actuarial value of future normal costs. The definition
comes from the fundamental equation of funding which states that the
present value of all benefits is the sum of the Actuarial Accrued Liability
and the present value of future normal costs. The AAL may also be
referred to as "accrued liability" or "actuarial liability."
Actuarial Assumptions These assumptions are estimates of future experience with respect to rates
of mortality, disability, turnover, retirement, rate or rates of investment
income and compensation increases. Actuarial assumptions are generally
based on past experience, often modified for projected changes in
conditions. Economic assumptions (compensation increases, payroll
growth, inflation and investment return) consist of an underlying real rate
of return plus an assumption for a long-term average rate of inflation.
Actuarial Cost Method A mathematical budgeting procedure for allocating the dollar amount of the
actuarial present value of the pension trust benefits between future normal
cost and actuarial accrued liability. The actuarial cost method may also be
referred to as the actuarial funding method.
Actuarial Equivalent A single amount or series of amounts of equal actuarial value to another
single amount or series of amounts, computed on the basis of appropriate
actuarial assumptions.
Actuarial Gain (Loss) The difference in liabilities between actual experience and expected
experience during the period between two actuarial valuations is the gain
(loss) on the accrued liabilities.
Actuarial Present Value
(APV)
The amount of funds currently required to provide a payment or series of
payments in the future. The present value is determined by discounting
future payments at predetermined rates of interest and probabilities of
payment.
Actuarial Valuation The actuarial valuation report determines, as of the actuarial valuation
date, the service cost, total pension liability, and related actuarial present
value of projected benefit payments for pensions.
Actuarial Valuation Date The date as of which an actuarial valuation is performed.
Actuarially Determined
Contribution (ADC) or
Annual Required
Contribution (ARC)
A calculated contribution into a defined benefit pension plan for the
reporting period, most often determined based on the funding policy of
the plan. Typically the Actuarially Determined Contribution has a normal
cost payment and an amortization payment.

Section H
37
General Assembly Retirement System of Illinois
GLOSSARY OF TERMS Amortization Method The method used to determine the periodic amortization payment may be
a level dollar amount, or a level percent of pay amount. The period will
typically be expressed in years, and the method will either be “open”
(meaning, reset each year) or “closed” (the number of years remaining
will decline each year.
Amortization Payment The amortization payment is the periodic payment required to pay off an
interest-discounted amount with payments of interest and principal.
Cost-of-Living Adjustments Postemployment benefit changes intended to adjust benefit payments for
the effects of inflation.
Cost-Sharing Multiple-
Employer Defined Benefit
Pension Plan (cost-sharing
pension plan)
A multiple-employer defined benefit pension plan in which the pension
obligations to the employees of more than one employer are pooled and
pension plan assets can be used to pay the benefits of the employees of
any employer that provides pensions through the pension plan.
Covered-Employee Payroll The payroll of employees that are provided with pensions through the
pension plan.
Deferred Inflows and
Outflows
The deferred inflows and outflows of pension resources are amounts used
under GASB Statement No. 68 in developing the annual pension expense.
Deferred inflows and outflows arise with differences between expected
and actual experiences; changes of assumptions. The portion of these
amounts not included in pension expense should be included in the
deferred inflows or outflows of resources.
Deferred Retirement Option
Program (DROP)
A program that permits a plan member to elect a calculation of benefit
payments based on service credits and salary, as applicable, as of the
DROP entry date. The plan member continues to provide service to the
employer and is paid for the service by the employer after the DROP
entry date; however, the pensions that would have been paid to the plan
member are credited to an individual member account within the defined
benefit pension plan until the end of the DROP period. Other variations
for DROP exist and will be more fully detailed in the plan provision
section of the valuation report.
Discount Rate
For GASB purposes, the discount rate is the single rate of return that results
in the present value of all projected benefit payments to be equal to the sum
of the funded and unfunded projected benefit payments, specifically:
1. The benefit payments to be made while the pension plans’ fiduciary
net position is projected to be greater than the benefit payments that
are projected to be made in the period; and
2. The present value of the benefit payments not in (1) above,
discounted using the municipal bond rate.

Section H
38
General Assembly Retirement System of Illinois
GLOSSARY OF TERMS Entry Age Actuarial Cost
Method (EAN)
The EAN is a cost method for allocating the costs of the plan between the
normal cost and the accrued liability. The actuarial present value of the
projected benefits of each individual included in an actuarial valuation is
allocated on a level basis (either level dollar or level percent of pay) over
the earnings or service of the individual between entry age and assumed
exit ages(s). The portion of the actuarial present value allocated to a
valuation year is the normal cost. The portion of this actuarial present
value not provided for at a valuation date by the actuarial present value of
future normal costs is the actuarial accrued liability. The sum of the
accrued liability plus the present value of all future normal costs is the
present value of all benefits.
Fiduciary Net Position The fiduciary net position is the market value of the assets of the trust
dedicated to the defined benefit provisions.
GASB The Governmental Accounting Standards Board is an organization that
exists in order to promulgate accounting standards for governmental
entities.
Long-Term Expected Rate of
Return
The long-term rate of return is the expected return to be earned over the
entire trust portfolio based on the asset allocation of the portfolio.
Money-Weighted Rate of
Return
The money-weighted rate of return is a method of calculating the returns
that adjusts for the changing amounts actually invested. For purposes of
GASB Statement No. 67, money-weighted rate of return is calculated as the
internal rate of return on pension plan investments, net of pension plan
investment expense.
Multiple-Employer Defined
Benefit Pension Plan
A multiple-employer plan is a defined benefit pension plan that is used to
provide pensions to the employees of more than one employer.
Municipal Bond Rate The Municipal Bond Rate is the discount rate to be used for those benefit
payments that occur after the assets of the trust have been depleted.
Net Pension Liability (NPL) The NPL is the liability of employers and non-employer contributing
entities to plan members for benefits provided through a defined benefit
pension plan.
Non-Employer Contributing
Entities
Non-employer contributing entities are entities that make contributions to a
pension plan that is used to provide pensions to the employees of other
entities. For purposes of the GASB accounting statements, plan members
are not considered non-employer contributing entities.
Normal Cost The portion of the actuarial present value allocated to a valuation year is
called the normal cost. For purposes of application to the requirements of
this Statement, the term normal cost is the equivalent of service cost.
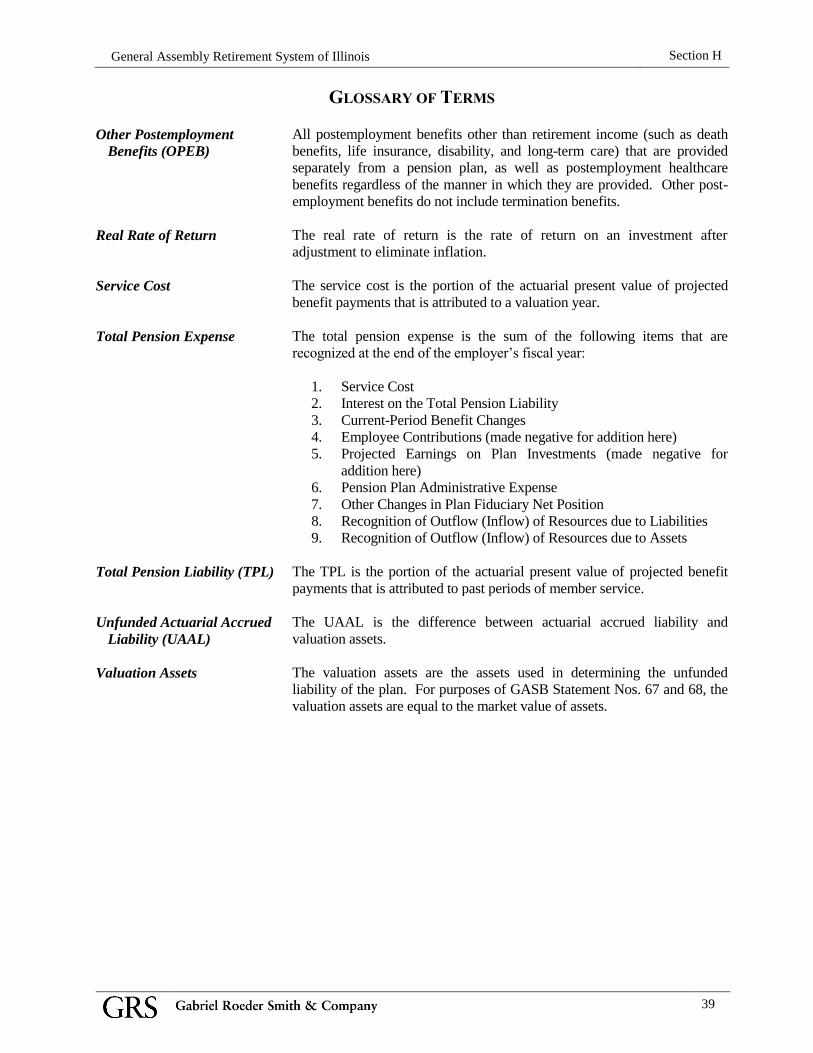
Section H
39
General Assembly Retirement System of Illinois
GLOSSARY OF TERMS Other Postemployment
Benefits (OPEB)
All postemployment benefits other than retirement income (such as death
benefits, life insurance, disability, and long-term care) that are provided
separately from a pension plan, as well as postemployment healthcare
benefits regardless of the manner in which they are provided. Other post-
employment benefits do not include termination benefits.
Real Rate of Return The real rate of return is the rate of return on an investment after
adjustment to eliminate inflation.
Service Cost The service cost is the portion of the actuarial present value of projected
benefit payments that is attributed to a valuation year.
Total Pension Expense The total pension expense is the sum of the following items that are
recognized at the end of the employer’s fiscal year:
1. Service Cost
2. Interest on the Total Pension Liability
3. Current-Period Benefit Changes
4. Employee Contributions (made negative for addition here)
5. Projected Earnings on Plan Investments (made negative for
addition here)
6. Pension Plan Administrative Expense
7. Other Changes in Plan Fiduciary Net Position
8. Recognition of Outflow (Inflow) of Resources due to Liabilities
9. Recognition of Outflow (Inflow) of Resources due to Assets
Total Pension Liability (TPL) The TPL is the portion of the actuarial present value of projected benefit
payments that is attributed to past periods of member service.
Unfunded Actuarial Accrued
Liability (UAAL)
The UAAL is the difference between actuarial accrued liability and
valuation assets.
Valuation Assets
The valuation assets are the assets used in determining the unfunded
liability of the plan. For purposes of GASB Statement Nos. 67 and 68, the
valuation assets are equal to the market value of assets.