Gene expression responses of threespine stickleback to ...people.tamu.edu/~jcai/pdf/33.pdf · Gene...
10
ORIGINAL RESEARCH ARTICLE published: 11 September 2014 doi: 10.3389/fgene.2014.00312 Gene expression responses of threespine stickleback to salinity: implications for salt-sensitive hypertension Gang Wang 1 , Ence Yang 1 , Kerri J. Smith 2 , Yong Zeng 1,3 , Guoli Ji 3 , Richard Connon 4 , Nann A. Fangue 5 * and James J. Cai 1,2 * 1 Department of Veterinary Integrative Biosciences, Texas A&M University, College Station, TX, USA 2 Interdisciplinary Program in Genetics, Texas A&M University, College Station, TX, USA 3 Department of Automation, Xiamen University, Xiamen, China 4 Department of Anatomy, Physiology and Cell Biology, School of Veterinary Medicine, University of California, Davis, CA, USA 5 Department of Wildlife, Fish, and Conservation Biology, University of California, Davis, CA, USA Edited by: Naoki Osada, National Institute of Genetics, Japan Reviewed by: Zachary Cheviron, Univeristy of Illinois, USA Celia M. Schunter, University of Barcelona, Spain *Correspondence: Nann A. Fangue, Department of Wildlife, Fish, and Conservation Biology, University of California, Davis, 1088 Academic Surge, One Shields Avenue, Davis, CA 95616, USA e-mail: [email protected]; James J. Cai, Department of Veterinary Integrative Biosciences, Texas A&M University, 402 Raymond Stotzer Pkwy, College Station, TX 77843–4458, USA e-mail: [email protected] Despite recent success with genome-wide association studies (GWAS), identifying hypertension (HTN)-susceptibility loci in the general population remains difficult. Here, we present a novel strategy to address this challenge by studying salinity adaptation in the threespine stickleback, a fish species with diverse salt-handling ecotypes. We acclimated native freshwater (FW) and anadromous saltwater (SW) threespine sticklebacks to fresh, brackish, and sea water for 30 days, and applied RNA sequencing to determine the gene expression in fish kidneys. We identified 1844 salt-responsive genes that were differentially expressed between FW sticklebacks acclimated to different salinities and/or between SW and FW sticklebacks acclimated to full-strength sea water. Significant overlap between stickleback salt-responsive genes and human genes implicated in HTN was detected (P < 10 −7 , hypergeometric test), suggesting a possible similarity in genetic mechanisms of salt handling between threespine sticklebacks and humans. The overlapping genes included a newly discovered HTN gene—MAP3K15, whose expression in FW stickleback kidneys decreases with salinity. These also included genes located in the GWAS loci such as AGTRAP -PLOD1 and CYP1A1-ULK3, which contain multiple potentially causative genes contributing to HTN susceptibility that need to be prioritized for study. Taken together, we show that stickleback salt-responsive genes provide valuable information facilitating the identification of human HTN genes. Thus, threespine sticklebacks may be used as a model, complementary to existing animal models, in human HTN research. Keywords: salt handling, salt-responsive gene, differential expression, gene-environment interaction, mRNA sequencing INTRODUCTION Hypertension (HTN), or the chronic elevation of blood pressure (BP), is a major human health problem. The pathophysiology of HTN is complex, and multiple potential mechanisms are likely to contribute to the development of higher BP. Identifying genetic loci associated with HTN or BP regulation in the gen- eral population has proved to be challenging (Dominiczak and Munroe, 2010; Hastie et al., 2010; Padmanabhan et al., 2012). Genome-wide association studies (GWAS) of HTN have had varying degrees of success (Levy et al., 2009; Newton-Cheh et al., 2009; International Consortium for Blood Pressure Genome- Wide Association Studies, 2011). Genetic variants identified so far explain only a small portion of the heritability of susceptibility to HTN. Dietary salt appears to be an important environmental fac- tor in raising BP. The association between a high salt intake and high BP has long been known (Guyton et al., 1972; Luft and Weinberger, 1982; Haddy and Pamnani, 1995; Frisoli et al., 2012). Modern humans have the tendency to consume salt in excess—today, almost unanimously worldwide, the average indi- vidual’s dietary salt intake largely exceeds its physiological need (McCarron et al., 2013). Chronic excess salt intake results in the development of HTN in the general human population (Kotchen et al., 2013). Numerous epidemiologic, clinical, and experimental studies have shown that a reduction in dietary salt intake low- ers BP (Luft and Weinberger, 1982; Haddy and Pamnani, 1995; Frisoli et al., 2012; Kotchen et al., 2013). In some populations with very low salt intake, such as Papua New Guineans and Yanomamo Indians in the Amazon region, HTN and age-related increases in BP are virtually absent (Denton, 1982). A general increase in BP in response to salt intake is almost assured, whilst the degree of the response is quite variable among individuals. This variation (or salt sensitivity) depends on the functional interactions among genes that play a role in salt han- dling (Meneton et al., 2005). Many of salt handling genes, such as those encoding molecules that control the ability of the kidney to maintain salt balance, are implicated in HTN (Lifton et al., 2001). Thus, a better understanding of the genetics of salt handling will www.frontiersin.org September 2014 | Volume 5 | Article 312 | 1
Transcript of Gene expression responses of threespine stickleback to ...people.tamu.edu/~jcai/pdf/33.pdf · Gene...

ORIGINAL RESEARCH ARTICLEpublished: 11 September 2014doi: 10.3389/fgene.2014.00312
Gene expression responses of threespine stickleback tosalinity: implications for salt-sensitive hypertensionGang Wang1, Ence Yang1, Kerri J. Smith2, Yong Zeng1,3, Guoli Ji3, Richard Connon4,
Nann A. Fangue5* and James J. Cai1,2*
1 Department of Veterinary Integrative Biosciences, Texas A&M University, College Station, TX, USA2 Interdisciplinary Program in Genetics, Texas A&M University, College Station, TX, USA3 Department of Automation, Xiamen University, Xiamen, China4 Department of Anatomy, Physiology and Cell Biology, School of Veterinary Medicine, University of California, Davis, CA, USA5 Department of Wildlife, Fish, and Conservation Biology, University of California, Davis, CA, USA
Edited by:
Naoki Osada, National Institute ofGenetics, Japan
Reviewed by:
Zachary Cheviron, Univeristy ofIllinois, USACelia M. Schunter, University ofBarcelona, Spain
*Correspondence:
Nann A. Fangue, Department ofWildlife, Fish, and ConservationBiology, University of California,Davis, 1088 Academic Surge, OneShields Avenue, Davis, CA 95616,USAe-mail: [email protected];James J. Cai, Department ofVeterinary Integrative Biosciences,Texas A&M University, 402Raymond Stotzer Pkwy, CollegeStation, TX 77843–4458, USAe-mail: [email protected]
Despite recent success with genome-wide association studies (GWAS), identifyinghypertension (HTN)-susceptibility loci in the general population remains difficult. Here, wepresent a novel strategy to address this challenge by studying salinity adaptation in thethreespine stickleback, a fish species with diverse salt-handling ecotypes. We acclimatednative freshwater (FW) and anadromous saltwater (SW) threespine sticklebacks to fresh,brackish, and sea water for 30 days, and applied RNA sequencing to determine thegene expression in fish kidneys. We identified 1844 salt-responsive genes that weredifferentially expressed between FW sticklebacks acclimated to different salinities and/orbetween SW and FW sticklebacks acclimated to full-strength sea water. Significantoverlap between stickleback salt-responsive genes and human genes implicated inHTN was detected (P < 10−7, hypergeometric test), suggesting a possible similarity ingenetic mechanisms of salt handling between threespine sticklebacks and humans. Theoverlapping genes included a newly discovered HTN gene—MAP3K15, whose expressionin FW stickleback kidneys decreases with salinity. These also included genes locatedin the GWAS loci such as AGTRAP-PLOD1 and CYP1A1-ULK3, which contain multiplepotentially causative genes contributing to HTN susceptibility that need to be prioritizedfor study. Taken together, we show that stickleback salt-responsive genes providevaluable information facilitating the identification of human HTN genes. Thus, threespinesticklebacks may be used as a model, complementary to existing animal models, in humanHTN research.
Keywords: salt handling, salt-responsive gene, differential expression, gene-environment interaction, mRNA
sequencing
INTRODUCTIONHypertension (HTN), or the chronic elevation of blood pressure(BP), is a major human health problem. The pathophysiologyof HTN is complex, and multiple potential mechanisms arelikely to contribute to the development of higher BP. Identifyinggenetic loci associated with HTN or BP regulation in the gen-eral population has proved to be challenging (Dominiczak andMunroe, 2010; Hastie et al., 2010; Padmanabhan et al., 2012).Genome-wide association studies (GWAS) of HTN have hadvarying degrees of success (Levy et al., 2009; Newton-Cheh et al.,2009; International Consortium for Blood Pressure Genome-Wide Association Studies, 2011). Genetic variants identified so farexplain only a small portion of the heritability of susceptibility toHTN.
Dietary salt appears to be an important environmental fac-tor in raising BP. The association between a high salt intakeand high BP has long been known (Guyton et al., 1972; Luftand Weinberger, 1982; Haddy and Pamnani, 1995; Frisoli et al.,2012). Modern humans have the tendency to consume salt in
excess—today, almost unanimously worldwide, the average indi-vidual’s dietary salt intake largely exceeds its physiological need(McCarron et al., 2013). Chronic excess salt intake results in thedevelopment of HTN in the general human population (Kotchenet al., 2013). Numerous epidemiologic, clinical, and experimentalstudies have shown that a reduction in dietary salt intake low-ers BP (Luft and Weinberger, 1982; Haddy and Pamnani, 1995;Frisoli et al., 2012; Kotchen et al., 2013). In some populations withvery low salt intake, such as Papua New Guineans and YanomamoIndians in the Amazon region, HTN and age-related increases inBP are virtually absent (Denton, 1982).
A general increase in BP in response to salt intake is almostassured, whilst the degree of the response is quite variable amongindividuals. This variation (or salt sensitivity) depends on thefunctional interactions among genes that play a role in salt han-dling (Meneton et al., 2005). Many of salt handling genes, such asthose encoding molecules that control the ability of the kidney tomaintain salt balance, are implicated in HTN (Lifton et al., 2001).Thus, a better understanding of the genetics of salt handling will
www.frontiersin.org September 2014 | Volume 5 | Article 312 | 1
Wang et al. Sticklebacks as an animal model for hypertension
facilitate identification of HTN and/or BP-regulating (HTN/BP)genes. To this end, we present a new strategy that involves the useof the threespine stickleback, Gasterosteus aculeatus, to identifysalt handling genes. Threespine stickleback is a short-lived fishspecies with diverse salt-handling ecotypes, commonly found offthe Atlantic and Pacific coasts of North America. The retreat ofglaciers at the end of the last Ice Age resulted in a large num-ber of new freshwater lakes and streams throughout the Northernhemisphere. Marine sticklebacks colonized and adapted to thesenewly formed freshwater habitats (Jones et al., 2012). Owing toits well-studied natural history and extensive genetic resources,threespine stickleback has been a powerful model for studyinggenotype-environment (GxE) interactions and adaptive evolu-tion (McCairns and Bernatchez, 2010; Barrett et al., 2011; Grøtanet al., 2012; Jones et al., 2012).
The rationale for our strategy is based on extensive previ-ous findings in fish genetics research. Salinity tolerance—criticalfor aquatic organisms to manage the osmotic challenges ofthe medium—is genetically determined (Rengmark et al., 2007;McCairns and Bernatchez, 2010; Le Bras et al., 2011; Normanet al., 2011). Gene expression changes contribute to the adap-tation of fish to different environmental salinity (Scott et al.,2004; Bystriansky et al., 2006; Niu et al., 2008; Whitehead et al.,2012; Kozak et al., 2014). Interestingly, ATP2B1 (encoding aplasma membrane calcium-transporting ATPase), is known to beinvolved in salinity adaptation in fish (Rengmark et al., 2007). It isalso the first gene identified in GWAS to be associated with HTNsusceptibility in humans (Levy et al., 2009). Furthermore, geneticmechanisms underlying kit ligand (Kitlg) expression and ectodys-plasin (EDA) signaling in threespine sticklebacks are highly sim-ilar to those in humans (Colosimo et al., 2005; Miller et al.,2007).
In the present study, we used RNA sequencing to deter-mine gene expression levels in threespine sticklebacks acclimatedto various salinities. We identified salt-responsive genes whoseexpression levels vary significantly across samples among differ-ent salinity treatment groups. We also showed evidence that thesesalt-responsive genes provide valuable information facilitatingidentification of putative human HTN/BP genes.
MATERIALS AND METHODSFISH COLLECTION AND ACCLIMATIONIn spring 2012, freshwater (FW) and saltwater (SW) three-spine sticklebacks were collected using Frabill galvanized min-now traps from a freshwater lake in Davis, CA (38◦32′N,122◦12′W) and Bodega Bay, CA (38◦19′N, 123◦3′W), respectively(Figure 1A). Fish were transported in temperature-controlledcoolers equipped with aeration devices to maintain oxygen levelsat >95% saturation. Thirty adult females were randomly selectedfrom each population and assigned into three groups. One groupfrom each population was acclimated to fresh water (“zero salin-ity” treatment), the second group was acclimated to a salinityof 11 g/L (“mid salinity” treatment), and the third group wasacclimated to a salinity of 33 g/L (“high salinity” treatment). Allfish were acclimated for 30 days with no mortality. Male fishwere excluded from experiments as their kidneys may undergovariable structural transformation during the breeding season
(Ruiter and Bonga, 1985). To achieve the desired salinities, syn-thetic sea salt (Instant Ocean) was mixed with aerated well water;tank salinities were monitored with a calibrated light refractome-ter (Vita Sine) and adjusted daily to within 1 g/L of the desiredlevel. Water temperature was held at 11 ± 0.5◦C, the photoperiodset to 12 h day: 12 h night, and all fish were fed daily to sati-ation with frozen brine shrimp. Water quality parameters suchas oxygen, ammonia, nitrate, and nitrite were monitored dailyand adjusted through water changes to keep these parameterswithin optimal husbandry limits for all fish. All fish were treatedin accordance with UC Davis Institutional Animal Care and UseCommittee guidelines (protocol #16474). At the end of acclima-tion, fish were anesthetized with a lethal dose of buffered tricainemesylate (MS-222). Kidneys were dissected following standardsampling techniques for fish gene expression studies and immedi-ately frozen at −80◦C. We processed kidney tissues obtained fromfour (out of six) treatments: (1–3) FW fish acclimated to fresh,brackish, and sea waters, labeled as FW00K, FW11K, and FW33K,respectively, and (4) SW fish acclimated to sea water, SW33K.Three individual fish (biological replicates) were included pertreatment.
RNA EXTRACTION AND SEQUENCINGTotal RNA was extracted from each fish’s kidneys using thecolumn-based RNA extraction kit (Qiagen, Venlo, Netherlands).RNA integrity was assessed by Agilent Bioanalyser 2100 andRNA Nano 6000 Labchip kit (Agilent Technologies, Palo Alto,USA). All samples were concentrated and cleaned using theRNAeasy MiniElute Cleanup kit (Qiagen) obtaining final concen-trations ∼500 ng/μl. Sequencing libraries were produced usingthe Illumina mRNA sequencing sample preparation kit (Illumina,San Diego, USA), following the manufacturer’s instructions.Briefly, 4 μg of total RNA was used as input for poly A+ selec-tion, followed by metal-catalyzed fragmentation of the selectedmRNA (peak of size distribution at ∼240 nt). After reverse tran-scription to cDNA using random hexamer primers, end-repairand A-tailing of the double stranded cDNA was performed. ThecDNA was then ligated to indexed pairs of adapters. The cDNAwas size selected on a 2% agarose gel, and fragments correspond-ing to an insert size of 150 nucleotides were excised from the gel.The cDNA was recovered from the gel slice using a QIAquick gelextraction kit (Qiagen). Thereafter, the libraries were amplified in10 cycles of PCR, quantified using Taqman, and adjusted at a con-centration of 10 pM. The sequencing of 100 bp paired-end readswas carried out on the Illumina HiSeq 2000 platform at the TexasA&M AgriLife Genomics and Bioinformatics Services. All cDNAsamples were individually barcoded, and every four samples werepooled and sequenced on the same sequencing lane.
IDENTIFICATION OF SALT-RESPONSIVE GENESThe reference sequences of the stickleback genome (BROADS1)and the gene annotation were downloaded from the Ensembldatabase (Flicek et al., 2014). The annotation informationincluded the stickleback gene set built using a modified versionof the standard Ensembl genebuild pipeline, and the stickleback-human orthologs predicted using a phylogenetic approach(Vilella et al., 2009). Prior to the mapping, we processed the
Frontiers in Genetics | Evolutionary and Population Genetics September 2014 | Volume 5 | Article 312 | 2

Wang et al. Sticklebacks as an animal model for hypertension
FIGURE 1 | Measuring gene expression in threespine stickleback kidneys.
(A) Sampling locations in Bodega Bay and Davis, California, USA. (B)
Hierarchical clustering of expression profiles for 2000 most variably expressedgenes in samples, with a heat map chart showing 500 genes. (C) Expressionprofile of MAP3K15. The expression levels of MAP3K15 under the fouracclimation conditions: FW00K, FW11K, FW33K, and SW33K, each with three
replicates, are shown. The y-axis indicates the value of FPKM represented asthe means ± s.e.m. The open square symbols indicate the mean FPKMacross three replicates in same condition. The dash line links highlight thechange in expression pattern of FPKM values across acclimation conditions.(D) RNA-seq and qRT-PCR results of relative expression differences (i.e., foldchanges) between FW00K and FW33K for 10 select genes.
reference genome by masking all nucleotides at positions knownto be polymorphic in threespine sticklebacks. More specifically,we replaced nucleotides of the reference genome sequences at 5.9million polymorphic sites discovered by Jones et al. (2012) with“N” (indicating any nucleotides).
The quality control analysis on raw sequence data was doneby using FastQC (http://www.bioinformatics.babraham.ac.uk/projects/fastqc/). To clean the raw sequences, we removed low-quality reads that contained base(s) with a quality score lessthan 20. We then trimmed all remaining reads using the FASTXtoolkit (http://hannonlab.cshl.edu/fastx_toolkit/). The bases atpositions 1–10 and 86–100 were trimmed, leaving 75 base pairsfor each read. The clean reads were aligned to the processedreference genome using TopHat v2.0.3 (Trapnell et al., 2012).The default set of TopHat options was used, except that read-mismatches (mismatches allowed in final read alignments) wasset to 2 and 3 for FW and SW sticklebacks, respectively. Cufflinksv2.0.2 was used to estimate the expression levels of annotatedstickleback genes in fragments per kilobase of exon model permillion mapped reads (FPKM). Cufflinks option GTF-guide wasswitched on to allow the algorithm to use the supplied refer-ence annotation to guide assembly and make the output includeall reference transcripts. SAMMate (Xu et al., 2011) was usedto obtain the count of reads mapped onto each gene from theSAM files generated by TopHat. Three R packages for differen-tial expression analysis: edgeR (Robinson et al., 2010), DESeq
(Anders and Huber, 2010), and baySeq (Hardcastle and Kelly,2010), were applied independently to the same input file contain-ing the number of mapped reads for all genes. The results werejointly evaluated to identify differentially expressed genes. Morespecifically, we considered a gene to be significantly differentiallyexpressed between any two treatments only when all three pro-grams reported that the expression difference was significant atthe threshold of FDR < 0.01.
QUANTITATIVE RT-PCRRNA was extracted using Trizol solution (Life Technologies,Waltham, USA), treated with DNaseI using the DNA-free kit(AMS Biotechnology) and quantified spectrometrically. ThecDNA was synthesized from 3 μg of RNA using the AffinityScriptQPCR cDNA Synthesis Kit (Agilent Technologies) according tothe manufacturer’s instructions. Briefly, the required amount ofRNA (up to 3 μg) was diluted in RNase-free water (up to 7 μlfinal volume) and mixed on ice with 1 × cDNA Synthesis mas-ter mix (10 μl), random primers:oligo-dT primers (3:1) [total,2 μl (200 ng)], and either 1 μl of reverse transcriptase/RNaseblock enzyme mixture for reverse transcription reactions or 1 μlof water for control reactions. Reaction mixtures were mixedand spun down and incubated for 2 min at 25◦C, 40 min at42◦C, and 5 min at 95◦C. cDNA was stored at −20◦C. Dilutionsof this cDNA were used subsequent real-time PCR reactions.Quantitative RT-PCR reactions were performed with designed
www.frontiersin.org September 2014 | Volume 5 | Article 312 | 3

Wang et al. Sticklebacks as an animal model for hypertension
exonic primers for selected stickleback genes (SupplementaryTable 1) and the amount of cDNA was quantified using SYBRGreen real-time PCR (Life Technologies) on a 7900HT Fastreal time PCR system (Life Technologies). The PCR 2× mas-ter mix was based on AmpliTaq Gold DNA polymerase (LifeTechnologies). In the same reaction, cDNA samples (5 μl fora total volume of 25 μl per reaction) were analyzed, cycletemperatures and times were according to the manufacturers’protocols (Life Technologies). Data was analyzed using ��CT
method implemented in the software qbasePLUS (Biogazelle,Zwijnaarde, Belgium). All reactions were run in triplicate andnormalized by comparisons to the reference gene GAPDH(ENSGACG00000010219) (Pei et al., 2007).
COMPILING LIST OF HTN/BP GENESWe compiled a list of HTN/BP genes identified using non-GWAS approaches. The sources of this gene list included theliterature review by Hancock et al. (2008) and the GeneticAssociation Database (Becker et al., 2004). We also compileda list of HTN/BP genes identified using the GWAS approachthrough searching the Catalog of Published GWAS (http://www.genome.gov/gwastudies/) and the original literature (Levyet al., 2009; Newton-Cheh et al., 2009; Ho et al., 2011;International Consortium for Blood Pressure Genome-WideAssociation Studies, 2011; Kato et al., 2011; Wain et al., 2011).
TESTING SIGNIFICANCE OF GENE OVERLAPTo assess the significance of overlap between stickleback salt-responsive genes and human HTN/BP genes, we focused on15,029 stickleback protein-coding genes, of which humanorthologs exist. The probability of overlap was calcu-lated with the hypergeometric probability density function
f (k) =
⎛⎝ m
k
⎞⎠
⎛⎝ N − m
n − k
⎞⎠
⎛⎝ N
n
⎞⎠
, where N (=15,029) is the number
of all stickleback genes considered, m (=1302) is the numberof salt-responsive stickleback genes whose human orthologsexist, and n (=455) is the number of stickleback genes whosehuman orthologs are HTN/BP genes, and k (=75) is thenumber of salt-responsive stickleback genes whose humanorthologs are HTN/BP genes. The computation was done using1-hygecdf(k,N,m,n) in Matlab.
DATA ACCESSIBILITYExpression and sequence data have been deposited atthe Gene Expression Omnibus (GEO) under accessionGSE58447 and Sequence Read Archive (SRA) under accessionSRP043184.
RESULTSUsing high-throughput sequencing, we obtained over 25 mil-lion paired-end 100-bp reads for each RNA sample of the fouracclimation treatments: FW00K, FW11K, FW33K, and SW33K(Supplementary Table 2). The expression levels for all anno-tated stickleback protein-coding genes were quantified, and ahierarchical clustering analysis was performed with the 2000
most variably expressed genes across treatments, showing thatexpression profiles of these genes were largely clustered by accli-mation treatment (Figure 1B). To identify differentially expressedgenes, we applied a rather conservative criterion, which was basedon completely cross-validated results from three different statisti-cal tests, to assess the significance of gene expression differencesbetween acclimation treatments. A gene was considered to besalt-responsive when the expression of the gene is significantlydifferent between FW treatments (e.g., FW00K vs. FW11K orFW00K vs. FW33K) or between FW33K and SW33K. Using thisdefinition, we identified 1844 stickleback salt-responsive genes(Supplementary Table 3), of which 1302 have human orthologs.This list contains a number of genes such as ion transport-ing ATPases (ATP1A1, ATP1A2, ATP1B1, ATP2A2, and ATP5B),aquaporin (AQP4), and transmembrane emp24 domain traffick-ing protein 2 (TMED2), which are known to be involved inthe salinity response and osmoregulation in other fish species(Rengmark et al., 2007; Whitehead et al., 2011; Lamichhaneyet al., 2012). An online interactive resource (http://stickleback.
genomezoo.net) was created to allow easy navigation of theexpression profiles of all genes. The expression levels of MAP3K15in four acclimation treatments is shown in Figure 1C as an exam-ple. Finally, for 9 out of 10 selected genes, the expression levelin FW33K relative to FW00K was confirmed by quantitativeRT-PCR (Figure 1D).
SIGNIFICANT OVERLAP BETWEEN SALT-RESPONSIVE GENES ANDHTN/BP GENESTo examine the overlap between stickleback salt-responsive genesand human HTN/BP genes, we compiled the list of HTN/BPgenes including 560 identified using non-GWAS approaches(e.g., the single association analyses, physiology studies, andanimal model studies) (Supplementary Table 4) and 108 iden-tified using GWAS approach (Supplementary Table 5) (Levyet al., 2009; Newton-Cheh et al., 2009; Ho et al., 2011;International Consortium for Blood Pressure Genome-WideAssociation Studies, 2011; Kato et al., 2011; Wain et al., 2011).Overlap analysis identified 75 stickleback salt-responsive geneswhose human orthologs are HTN/BP genes. This overlap issignificantly higher than expected by random chance (hyperge-ometric test: P = 1.6 × 10⁻⁸), suggesting a striking similarity inthe genetics of salt handling between threespine sticklebacks andhumans. The 75 overlapping genes included 65 non-GWAS and10 GWAS HTN/BP genes (Tables 1, 2).
PRIORITIZING GENES IN GWAS LOCUS WITH MULTIPLE POTENTIALLYCAUSATIVE GENESMany genes identified in GWAS had no obvious mechanistic linkwith HTN or BP regulation. For example, despite being identifiedby GWAS, GOSR2 had not been previously suspected to regulateBP (International Consortium for Blood Pressure Genome-WideAssociation Studies, 2011). The result of gene overlap testing sug-gested that the stickleback salt-responsive genes might be usedto prioritize HTN/BP genes. This will be extremely useful forprioritizing genes in GWAS loci that contain multiple potentialcausative genes contributing to the overall HTN susceptibility.For example, the AGTRAP-PLOD1 locus has been associated with
Frontiers in Genetics | Evolutionary and Population Genetics September 2014 | Volume 5 | Article 312 | 4

Wang et al. Sticklebacks as an animal model for hypertension
Table 1 | Representative stickleback salt-responsive genes whose human orthologs are HTN/BP genes identified by non-GWAS approaches.
Ensembl ID Gene symbol Type of study* Expression level (FPKM)
1 2 3 FW00K FW11K FW33K SW33K
ENSGACG00000009898 ACE X 46.83 29.60 6.49 15.55
ENSGACG00000002433 APOE (2 of 2) X 0.35 0.81 8.42 1.22
ENSGACG00000018525 AR (2 of 2) X 48.81 58.37 84.95 163.23
ENSGACG00000012346 ARG2 X 21.34 16.39 6.91 2.41
ENSGACG00000008681 AVPR2 (1 of 2) X 3.86 2.42 24.89 7.65
ENSGACG00000006921 CXCL12 (2 of 2) X 1143.59 1247.81 304.94 42.77
ENSGACG00000015943 CYBA X 178.56 362.39 53.47 19.60
ENSGACG00000014669 CYP4F2 X X 116.70 144.07 42.90 10.55
ENSGACG00000007514 ESR2 X 6.71 11.00 22.97 18.01
ENSGACG00000018868 GCGR (2 of 2) X 6.30 1.00 0.51 0.42
ENSGACG00000006771 HMOX1 (2 of 2) X 32.18 37.77 3.98 3.80
ENSGACG00000004566 MACROD2 X 19.45 18.99 33.28 32.25
ENSGACG00000008374 MAT2A (1 of 2) X 57.55 80.23 813.40 244.27
ENSGACG00000015329 MTR X X 7.78 5.95 5.83 26.86
ENSGACG00000008228 P2RY2 (2 of 2) X 7.58 9.33 11.29 16.24
ENSGACG00000008313 PDGFB (1 of 2) X X 1.82 1.45 23.24 8.56
ENSGACG00000003693 PLOD2 X 9.96 5.64 1.62 12.76
ENSGACG00000018958 PPARA (2 of 2) X 36.07 14.97 5.86 4.21
ENSGACG00000009151 PRKG1 X X 17.21 5.22 1.97 2.91
ENSGACG00000014838 PTK2B (2 of 2) X 18.05 24.92 5.91 3.01
ENSGACG00000019365 SHBG X 9.60 1.01 0.59 1.08
ENSGACG00000007570 SLC6A19 (1 of 3) X 26.92 13.19 1.03 14.09
ENSGACG00000020600 SLC7A1 (1 of 2) X 13.95 4.66 1.03 2.62
Ensembl gene identifiers of stickleback genes and HGNC approved symbols of human orthologous genes are given. “X” indicates what type of study has been
performed and discovered the corresponding HTN/BP gene. The types of studies are categorized based on the methodology applied to the research.*Explanation coding: 1-physiology or drug target study; 2-single or meta-association analysis for common phenotype; 3-animal model study.
Table 2 | Stickleback salt-responsive genes whose human orthologs are HTN/BP genes identified by GWAS.
Ensembl ID Gene symbol GWAS locus Expression level (FPKM)
FW00K FW11K FW33K SW33K
ENSGACG00000014674 CYP1A2 CYP1A1-ULK3 32.57 5.55 2.73 20.30
ENSGACG00000001963 ENPEP – 24.80 10.19 53.79 91.52
ENSGACG00000011478 FURIN (2 of 2) FURIN-FES 2.82 1.19 0.30 0.38
ENSGACG00000014177 GOSR2 – 32.18 59.34 97.71 84.12
ENSGACG00000004493 JAG1 (1 of 2) – 10.84 4.36 1.83 4.38
ENSGACG00000016429 LMAN1L CYP1A1-ULK3 10.20 21.16 33.68 34.63
ENSGACG00000012633 MTHFR MTHFR(5’)-NPPB 14.96 11.32 6.20 24.10
ENSGACG00000012162 PGR FLJ32810-TMEM133 3.90 0.34 0.49 0.24
ENSGACG00000006801 PLCE1 – 5.20 1.15 0.84 1.79
ENSGACG00000015632 PLEKHA7 (1 of 2) – 7.54 3.09 5.70 3.62
BP regulation in several independent studies (Levy et al., 2009;Newton-Cheh et al., 2009) (see Flister et al., 2013, for a completelist of related references). This locus with high genetic complex-ity contains six genes: AGTRAP, MTHFR, CLCN6, NPPA, NPPB,and PLOD1, among which three (MTHFR, CLCN6, PLOD1) have
corresponding one-to-one orthologs between human and stick-leback. Our results showed that MTHFR is a salt-responsivegene in stickleback, showing significant differential expressionbetween FW33K and SW33K. The other two genes, CLCN6and PLOD1, albeit not classified as salt-responsive genes, also
www.frontiersin.org September 2014 | Volume 5 | Article 312 | 5

Wang et al. Sticklebacks as an animal model for hypertension
show a certain degree of differential expression across acclima-tion treatments (Supplementary Figure 1). In other words, thepattern of gene expression response to salinity suggested thatthe three genes may be implicated in HTN and BP regulation.Indeed, Flister et al. (2013) used the zinc-finger nuclease-basedmutagenesis procedure to introduce damaged alleles into eachof the six genes at the AGTRAP-PLOD1 locus in a mice modelof HTN. They compared the mutant mice with wild-type lit-termates, all on a high salt diet, and found that CLCN6 andPLOD1 mutants showed significantly higher BP, while MTHFRmutants showed increased urinary protein excretion, than thewild-type. Thus, all three genes have confirmed roles in the HTNpathogenesis.
In another example, genetic variants at the locus CYP1A1-ULK3 in a genomic region spanning a 150-kb interval on chromo-some 15q24.1 have been associated with both systolic and diastolicBP (International Consortium for Blood Pressure Genome-WideAssociation Studies, 2011). However, without any further infor-mation, it is difficult to predict which genes, among the totalsix within the region, are most relevant to BP regulation. Wefound that two genes in the region, GYP1A2 and LMAN1L, aresalt-responsive genes that showed decreased and increased geneexpression with the increase of salinity, respectively (Figure 2).Thus, these two genes are more likely to be functionally impli-cated in HTN pathogenesis compared with other genes in thelocus.
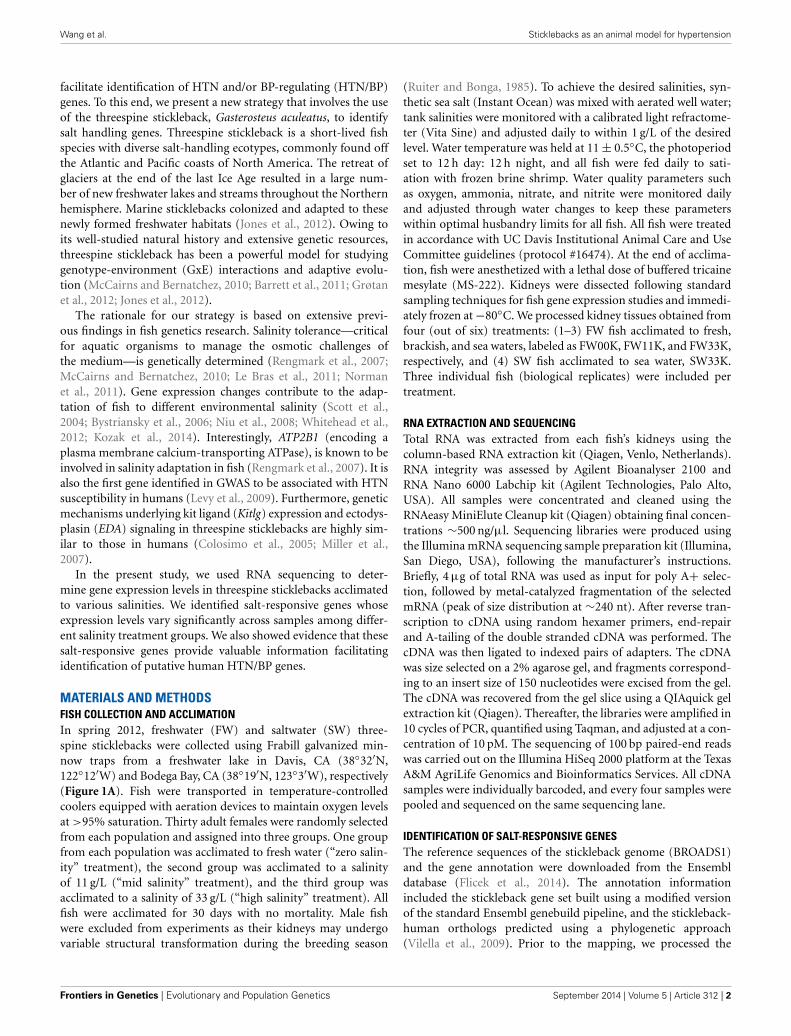
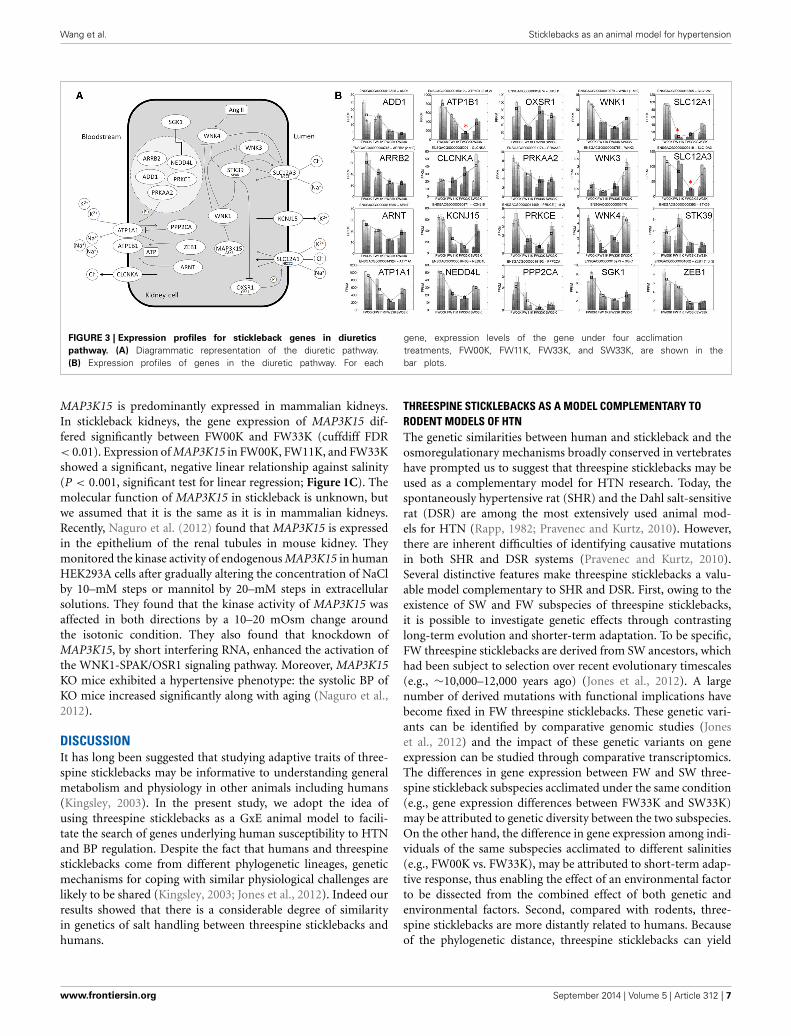
IMPACT OF SALINITY ON BP REGULATORY GENETIC NETWORKBP is regulated by an intricate network of physiological andgenetic pathways involving extracellular fluid volume homeosta-sis (Meneton et al., 2005). We found that the expressions of 20stickleback genes mapped onto the same diuretic pathway wereperturbed simultaneously by salinity. The expression changes ofthese genes were largely orchestrated in response to the salinitychanges (Figure 3). Notably, the expressions of SGK1 and ATP1A1were monotonically decreased with the increase of salinity. This
is expected from the known function of these two genes: SGK1is a major kinase that regulates Na+ intake by phosphorylationof epithelial sodium channels (ENaCs) (Wulff et al., 2002), andATP1A1 encodes the catalytic subunit α1 of Na+/K+-ATPase.ATP1A1 is known to be responsible for freshwater adaptationin threespine sticklebacks (McCairns and Bernatchez, 2010), aswell as the pathogenesis of a common subtype of adrenal HTNin humans (Azizan et al., 2013). Several other examples suggestthat some aspects of the effect of salinity on gene expressionare transferable from sticklebacks to mammals. WNK4 is a salt-responsive gene in sticklebacks, and the WNK4 transgenic miceexhibit hypertensive phenotypes (Ohta et al., 2009). WNK3 isnot a salt-responsive gene in sticklebacks, and WNK3 knockout(KO) mice do not exhibit hypertensive phenotypes (includingnormal expression of kidney epithelial Na+ channels, Na+-H+exchangers, and urine Na+ and K+ excretion) (Oi et al., 2012).Furthermore, in mammals, CLCNKA, SLC12A1, and SLC12A3are known to be involved in regulating osmotic balance betweenblood and the lumen of renal corpuscle. In stickleback kidneys,we found that CLCNKA was down-regulated, and SLC12A1 andSLC12A3 up-regulated, with salinity. This difference in the direc-tion of regulation may be due to the involvement of CLCNKA inreabsorption of Cl− from kidney cells to blood, whereas SLC12A1and SLC12A3 are involved in reabsorption of NaCl from blood tokidney cells (Figure 3).
CANDIDATE HTN/BP GENES IN THE SALT-RESPONSIVE GENE LISTThe association of many stickleback salt-responsive genes withHTN and BP regulation is currently unknown. The salt-responsive genes, however, are likely to be implicated in HTNand BP regulation. To this end, we used the gene MAP3K15 toillustrate this point. MAP3K15 is a newly characterized homologof apoptosis signal-regulating kinase 1 and 2 (MAP3K5 andMAP3K6). All three are members of the mitogen-activatedprotein kinase kinase kinase (MAP3K) family, broadly implicatedin apoptotic cell death, stress responses, and various diseases.
FIGURE 2 | Salt-responsive genes in a multigene locus.
CYP1A1-ULK3 is a multigene locus associated with BP regulation,reported by GWAS (International Consortium for Blood PressureGenome-Wide Association Studies, 2011). Two salt-responsive genes,
GYP1A2 and LMAN1L, are indicated with hashed arrows. CSK,whose expression apparently changes in response to salinity, isalso highlighted. Expression profiles of genes are given in the barplots.
Frontiers in Genetics | Evolutionary and Population Genetics September 2014 | Volume 5 | Article 312 | 6
Wang et al. Sticklebacks as an animal model for hypertension
FIGURE 3 | Expression profiles for stickleback genes in diuretics
pathway. (A) Diagrammatic representation of the diuretic pathway.(B) Expression profiles of genes in the diuretic pathway. For each
gene, expression levels of the gene under four acclimationtreatments, FW00K, FW11K, FW33K, and SW33K, are shown in thebar plots.
MAP3K15 is predominantly expressed in mammalian kidneys.In stickleback kidneys, the gene expression of MAP3K15 dif-fered significantly between FW00K and FW33K (cuffdiff FDR< 0.01). Expression of MAP3K15 in FW00K, FW11K, and FW33Kshowed a significant, negative linear relationship against salinity(P < 0.001, significant test for linear regression; Figure 1C). Themolecular function of MAP3K15 in stickleback is unknown, butwe assumed that it is the same as it is in mammalian kidneys.Recently, Naguro et al. (2012) found that MAP3K15 is expressedin the epithelium of the renal tubules in mouse kidney. Theymonitored the kinase activity of endogenous MAP3K15 in humanHEK293A cells after gradually altering the concentration of NaClby 10–mM steps or mannitol by 20–mM steps in extracellularsolutions. They found that the kinase activity of MAP3K15 wasaffected in both directions by a 10–20 mOsm change aroundthe isotonic condition. They also found that knockdown ofMAP3K15, by short interfering RNA, enhanced the activation ofthe WNK1-SPAK/OSR1 signaling pathway. Moreover, MAP3K15KO mice exhibited a hypertensive phenotype: the systolic BP ofKO mice increased significantly along with aging (Naguro et al.,2012).
DISCUSSIONIt has long been suggested that studying adaptive traits of three-spine sticklebacks may be informative to understanding generalmetabolism and physiology in other animals including humans(Kingsley, 2003). In the present study, we adopt the idea ofusing threespine sticklebacks as a GxE animal model to facili-tate the search of genes underlying human susceptibility to HTNand BP regulation. Despite the fact that humans and threespinesticklebacks come from different phylogenetic lineages, geneticmechanisms for coping with similar physiological challenges arelikely to be shared (Kingsley, 2003; Jones et al., 2012). Indeed ourresults showed that there is a considerable degree of similarityin genetics of salt handling between threespine sticklebacks andhumans.
THREESPINE STICKLEBACKS AS A MODEL COMPLEMENTARY TORODENT MODELS OF HTNThe genetic similarities between human and stickleback and theosmoregulationary mechanisms broadly conserved in vertebrateshave prompted us to suggest that threespine sticklebacks may beused as a complementary model for HTN research. Today, thespontaneously hypertensive rat (SHR) and the Dahl salt-sensitiverat (DSR) are among the most extensively used animal mod-els for HTN (Rapp, 1982; Pravenec and Kurtz, 2010). However,there are inherent difficulties of identifying causative mutationsin both SHR and DSR systems (Pravenec and Kurtz, 2010).Several distinctive features make threespine sticklebacks a valu-able model complementary to SHR and DSR. First, owing to theexistence of SW and FW subspecies of threespine sticklebacks,it is possible to investigate genetic effects through contrastinglong-term evolution and shorter-term adaptation. To be specific,FW threespine sticklebacks are derived from SW ancestors, whichhad been subject to selection over recent evolutionary timescales(e.g., ∼10,000–12,000 years ago) (Jones et al., 2012). A largenumber of derived mutations with functional implications havebecome fixed in FW threespine sticklebacks. These genetic vari-ants can be identified by comparative genomic studies (Joneset al., 2012) and the impact of these genetic variants on geneexpression can be studied through comparative transcriptomics.The differences in gene expression between FW and SW three-spine stickleback subspecies acclimated under the same condition(e.g., gene expression differences between FW33K and SW33K)may be attributed to genetic diversity between the two subspecies.On the other hand, the difference in gene expression among indi-viduals of the same subspecies acclimated to different salinities(e.g., FW00K vs. FW33K), may be attributed to short-term adap-tive response, thus enabling the effect of an environmental factorto be dissected from the combined effect of both genetic andenvironmental factors. Second, compared with rodents, three-spine sticklebacks are more distantly related to humans. Becauseof the phylogenetic distance, threespine sticklebacks can yield
www.frontiersin.org September 2014 | Volume 5 | Article 312 | 7

Wang et al. Sticklebacks as an animal model for hypertension
profound insight into biological processes involved in human dis-eases. Modeling diseases in distantly related organisms can revealthe complexity of human diseases and help uncover core defec-tive processes (Lieschke and Currie, 2007; Albertson et al., 2009;McGurk and Bonini, 2011). Thus, our results may help to dis-tinguish causal genetic variants from downstream complicationsthrough targeting the core problem that is more likely to arrestdisease progression.
CAVEATS AND FUTURE DIRECTIONSAdditional measures could have been implemented to enhanceour experimental results reported in the present paper. For exam-ple, using inbred fish lines might further reduce the influenceof genetic diversity existing in the wild populations and miti-gate residual environmental influence potentially acting on geneexpression. More fish samples from the same location, or new fishsamples from different geographic locations, could be includedto generate greater statistical power in data analysis. Besides kid-ney, fish gut and gill also play dominant roles in osmotic andionic regulation (Evans, 2008). Gene expression in gut and gillcould be examined to give more comprehensive pictures of multi-tissue response to salinity. Nonetheless, our present study onlyfocused on kidney because it plays a central role in maintain-ing appropriate sodium balance in humans and is critical for thedetermination of BP (O’Shaughnessy and Karet, 2006).
Although the majority of stickleback genes were not clas-sified as salt-responsive genes by our definition, they shouldnot be overlooked. Many of these “nonresponsive” genes infact showed some degrees of expression changes in responseto salinity. For example, neither copy of NAFT5 (or TonEBP)was identified as salt-responsive gene; however, in FW stick-leback kidneys, the expression of both copies decreased withsalinity (Supplementary Figure 2). NFAT5 is a Rel homologytranscription factor classically known for its osmosensitive rolein regulating cellular homeostasis during states of hypo- andhypertonic stress (Halterman et al., 2012; Cheung and Ko, 2013).Most recently, it was found that high-salt conditions activatethe p38/MAPK pathway involving NFAT5 and SGK1 duringcytokine-induced TH17 cell polarization, suggesting that dietarysalt may influence autoimmune disease in humans throughT-cell-induced production of IL-17 (Kleinewietfeld et al., 2013;O’Shea and Jones, 2013; Wu et al., 2013).
In conclusion, through examining the changes of threespinestickleback transcriptome in response to different salinities, weidentified stickleback salt-responsive genes and detected signifi-cant overlap between these genes and human HTN/BP genes, sug-gesting the existence of common genetic regulatory mechanismsunderlying fish salinity response and human HTN pathogenesis.Several new candidate genes for understanding HTN and BP reg-ulation were identified along this line. Thus, we demonstratedthat the salt-responsive genes identified through the sticklebackacclimation experiments represent a valuable resource for fishgenetics as well as human HTN research.
ACKNOWLEDGMENTSWe thank Charles Johnson, Scott Schwartz, and Richard Metzat the Genomics and Bioinformatics of Texas A&M AgriLife
Research for technical support, and Kranti Konganti for admin-istration support for the HPC cluster. This work was sup-ported by Texas A&M University, College of Veterinary Medicineand Biomedical Sciences Postdoctoral Trainee Research Grant(02-144002-03504) to Ence Yang, Graduate Trainee ResearchGrant (02-291039-00002) to Gang Wang, the Catalyst ResearchGrant of the Whole Systems Genomics Initiative (WSGI)to James J. Cai. This work was also supported by theNational Natural Science Foundation of China (61174161),the Fundamental Research Funds for the Central Universitiesin China (Xiamen University:2013121025), and the SpecializedResearch Fund for Doctoral Program of Higher Education ofChina (20130121130004) to Guoli Ji.
SUPPLEMENTARY MATERIALThe Supplementary Material for this article can be foundonline at: http://www.frontiersin.org/journal/10.3389/fgene.2014.00312/abstract
REFERENCESAlbertson, R. C., Cresko, W., Detrich, H. W. 3rd., and Postlethwait, J. H. (2009).
Evolutionary mutant models for human disease. Trends Genet. 25, 74–81. doi:10.1016/j.tig.2008.11.006
Anders, S., and Huber, W. (2010). Differential expression analysis for sequencecount data. Genome Biol. 11:R106. doi: 10.1186/gb-2010-11-10-r106
Azizan, E. A., Poulsen, H., Tuluc, P., Zhou, J., Clausen, M. V., Lieb, A., et al. (2013).Somatic mutations in ATP1A1 and CACNA1D underlie a common subtype ofadrenal hypertension. Nat. Genet. 45, 1055–1060. doi: 10.1038/ng.2716
Barrett, R. D., Paccard, A., Healy, T. M., Bergek, S., Schulte, P. M., Schluter, D.,et al. (2011). Rapid evolution of cold tolerance in stickleback. Proc. Biol. Sci.278, 233–238. doi: 10.1098/rspb.2010.0923
Becker, K. G., Barnes, K. C., Bright, T. J., and Wang, S. A. (2004). The geneticassociation database. Nat. Genet. 36, 431–432. doi: 10.1038/ng0504-431
Bystriansky, J. S., Richards, J. G., Schulte, P. M., and Ballantyne, J. S. (2006).Reciprocal expression of gill Na+/K+-ATPase alpha-subunit isoforms alpha 1aand alpha 1b during seawater acclimation of three salmonid fishes that vary intheir salinity tolerance. J. Exp. Biol. 209, 1848–1858. doi: 10.1242/jeb.02188
Cheung, C. Y., and Ko, B. C. (2013). NFAT5 in cellular adaptation to hyper-tonic stress-regulations and functional significance. J. Mol. Signal. 8:5. doi:10.1186/1750-2187-8-5
Colosimo, P. F., Hosemann, K. E., Balabhadra, S., Villarreal, G. Jr., Dickson,M., Grimwood, J., et al. (2005). Widespread parallel evolution in stickle-backs by repeated fixation of Ectodysplasin alleles. Science 307, 1928–1933. doi:10.1126/science.1107239
Denton, D. A. (1982). The Hunger for Salt: An Anthropological, Physiological, andMedical Analysis. Berlin; New York: Springer-Verlag.
Dominiczak, A. F., and Munroe, P. B. (2010). Genome-wide associa-tion studies will unlock the genetic basis of hypertension: pro sideof the argument. Hypertension 56, 1017–1020. discussion: 1025. doi:10.1161/HYPERTENSIONAHA.110.156208
Evans, D. H. (2008). Teleost fish osmoregulation: what have we learned since AugustKrogh, Homer Smith, and Ancel Keys. Am. J. Physiol. Regul. Integr. Comp.Physiol. 295, R704–R713. doi: 10.1152/ajpregu.90337.2008
Flicek, P., Amode, M. R., Barrell, D., Beal, K., Billis, K., Brent, S., et al. (2014).Ensembl 2014. Nucleic Acids Res. 42, D749–D755. doi: 10.1093/nar/gkt1196
Flister, M. J., Tsaih, S. W., O’Meara, C. C., Endres, B., Hoffman, M. J., Geurts, A.M., et al. (2013). Identifying multiple causative genes at a single GWAS locus.Genome Res. 23, 1996–2002. doi: 10.1101/gr.160283.113
Frisoli, T. M., Schmieder, R. E., Grodzicki, T., and Messerli, F. H. (2012). Saltand hypertension: is salt dietary reduction worth the effort? Am. J. Med. 125,433–439. doi: 10.1016/j.amjmed.2011.10.023
Grøtan, K., Østbye, K., Taugbøl, A., and Vøllestad, L. A. (2012). No short-termeffect of salinity on oxygen consumption in threespine stickleback (Gasterosteusaculeatus) from fresh, brackish, and salt water. Can. J. Zool. 90, 1386–1393. doi:10.1139/cjz-2012-0121
Frontiers in Genetics | Evolutionary and Population Genetics September 2014 | Volume 5 | Article 312 | 8

Wang et al. Sticklebacks as an animal model for hypertension
Guyton, A. C., Coleman, T. G., Cowley, A. V. Jr., Scheel, K. W., Manning, R. D. Jr.,and Norman, R. A. Jr. (1972). Arterial pressure regulation. Overriding domi-nance of the kidneys in long-term regulation and in hypertension. Am. J. Med.52, 584–594. doi: 10.1016/0002-9343(72)90050-2
Haddy, F. J., and Pamnani, M. B. (1995). Role of dietary salt in hypertension. J. Am.Coll. Nutr. 14, 428–438. doi: 10.1080/07315724.1995.10718533
Halterman, J. A., Kwon, H. M., and Wamhoff, B. R. (2012). Tonicity-independentregulation of the osmosensitive transcription factor TonEBP (NFAT5). Am. J.Physiol. Cell Physiol. 302, C1–C8. doi: 10.1152/ajpcell.00327.2011
Hancock, A. M., Witonsky, D. B., Gordon, A. S., Eshel, G., Pritchard, J. K., Coop, G.,et al. (2008). Adaptations to climate in candidate genes for common metabolicdisorders. PLoS Genet. 4:e32. doi: 10.1371/journal.pgen.0040032
Hardcastle, T. J., and Kelly, K. A. (2010). baySeq: empirical Bayesian methods foridentifying differential expression in sequence count data. BMC Bioinformatics11:422. doi: 10.1186/1471-2105-11-422
Hastie, C. E., Padmanabhan, S., and Dominiczak, A. F. (2010). Genome-wide asso-ciation studies of hypertension: light at the end of the tunnel. Int. J. Hypertens.2010:509581. doi: 10.4061/2010/509581
Ho, J. E., Levy, D., Rose, L., Johnson, A. D., Ridker, P. M., and Chasman,D. I. (2011). Discovery and replication of novel blood pressure geneticloci in the Women’s Genome Health Study. J. Hypertens. 29, 62–69. doi:10.1097/HJH.0b013e3283406927
International Consortium for Blood Pressure Genome-Wide Association Studies.(2011). Genetic variants in novel pathways influence blood pressure and car-diovascular disease risk. Nature 478, 103–109. doi: 10.1038/nature10405
Jones, F. C., Grabherr, M. G., Chan, Y. F., Russell, P., Mauceli, E., Johnson, J.,et al. (2012). The genomic basis of adaptive evolution in threespine sticklebacks.Nature 484, 55–61. doi: 10.1038/nature10944
Kato, N., Takeuchi, F., Tabara, Y., Kelly, T. N., Go, M. J., Sim, X., et al. (2011).Meta-analysis of genome-wide association studies identifies common variantsassociated with blood pressure variation in east Asians. Nat. Genet. 43, 531–538.doi: 10.1038/ng.834
Kingsley, D. M. (2003). Sequencing the Genome of Threespine Sticklebacks(Gasterosteus Aculeatus). Bethesda, MD: National Human Genome ResearchInstitute (NHGRI) White Paper.
Kleinewietfeld, M., Manzel, A., Titze, J., Kvakan, H., Yosef, N., Linker, R. A.,et al. (2013). Sodium chloride drives autoimmune disease by the induction ofpathogenic TH17 cells. Nature 496, 518–522. doi: 10.1038/nature11868
Kotchen, T. A., Cowley, A. W. Jr., and Frohlich, E. D. (2013). Salt in healthand disease—a delicate balance. N. Engl. J. Med. 368, 1229–1237. doi:10.1056/NEJMra1212606
Kozak, G. M., Brennan, R. S., Berdan, E. L., Fuller, R. C., and Whitehead, A.(2014). Functional and population genomic divergence within and between twospecies of killifish adapted to different osmotic niches. Evolution 68, 63–80. doi:10.1111/evo.12265
Lamichhaney, S., Martinez Barrio, A., Rafati, N., Sundstrom, G., Rubin, C. J.,Gilbert, E. R., et al. (2012). Population-scale sequencing reveals genetic differ-entiation due to local adaptation in Atlantic herring. Proc. Natl. Acad. Sci. U.S.A.109, 19345–19350. doi: 10.1073/pnas.1216128109
Le Bras, Y., Dechamp, N., Krieg, F., Filangi, O., Guyomard, R., Boussaha, M.,et al. (2011). Detection of QTL with effects on osmoregulation capacities in therainbow trout (Oncorhynchus mykiss). BMC Genet. 12:46. doi: 10.1186/1471-2156-12-46
Levy, D., Ehret, G. B., Rice, K., Verwoert, G. C., Launer, L. J., Dehghan, A., et al.(2009). Genome-wide association study of blood pressure and hypertension.Nat. Genet. 41, 677–687. doi: 10.1038/ng.384
Lieschke, G. J., and Currie, P. D. (2007). Animal models of human disease: zebrafishswim into view. Nat. Rev. Genet. 8, 353–367. doi: 10.1038/nrg2091
Lifton, R. P., Gharavi, A. G., and Geller, D. S. (2001). Molecular mechanismsof human hypertension. Cell 104, 545–556. doi: 10.1016/S0092-8674(01)00241-0
Luft, F. C., and Weinberger, M. H. (1982). Sodium intake and essential hyperten-sion. Hypertension 4, III14–III19. doi: 10.1161/01.HYP.4.5_Pt_2.III14
McCairns, R. J., and Bernatchez, L. (2010). Adaptive divergence between freshwaterand marine sticklebacks: insights into the role of phenotypic plasticity from anintegrated analysis of candidate gene expression. Evolution 64, 1029–1047. doi:10.1111/j.1558-5646.2009.00886.x
McCarron, D. A., Kazaks, A. G., Geerling, J. C., Stern, J. S., and Graudal, N. A.(2013). Normal range of human dietary sodium intake: a perspective based on
24-hour urinary sodium excretion worldwide. Am. J. Hypertens. 26, 1218–1223.doi: 10.1093/ajh/hpt139
McGurk, L., and Bonini, N. M. (2011). Cell biology. Yeast informs Alzheimer’sdisease. Science 334, 1212–1213. doi: 10.1126/science.1216073
Meneton, P., Jeunemaitre, X., De Wardener, H. E., and Macgregor, G. A.(2005). Links between dietary salt intake, renal salt handling, blood pressure,and cardiovascular diseases. Physiol. Rev. 85, 679–715. doi: 10.1152/physrev.00056.2003
Miller, C. T., Beleza, S., Pollen, A. A., Schluter, D., Kittles, R. A., Shriver, M. D.,et al. (2007). cis-Regulatory changes in Kit ligand expression and parallel evo-lution of pigmentation in sticklebacks and humans. Cell 131, 1179–1189. doi:10.1016/j.cell.2007.10.055
Naguro, I., Umeda, T., Kobayashi, Y., Maruyama, J., Hattori, K., Shimizu, Y., et al.(2012). ASK3 responds to osmotic stress and regulates blood pressure by sup-pressing WNK1-SPAK/OSR1 signaling in the kidney. Nat. Commun. 3:1285. doi:10.1038/ncomms2283
Newton-Cheh, C., Johnson, T., Gateva, V., Tobin, M. D., Bochud, M., Coin, L.,et al. (2009). Genome-wide association study identifies eight loci associated withblood pressure. Nat. Genet. 41, 666–676. doi: 10.1038/ng.361
Niu, C. J., Rummer, J. L., Brauner, C. J., and Schulte, P. M. (2008). Heat shockprotein (Hsp70) induced by a mild heat shock slightly moderates plasmaosmolarity increases upon salinity transfer in rainbow trout (Oncorhynchusmykiss). Comp. Biochem. Physiol. C-Toxicol. Pharmacol. 148, 437–444. doi:10.1016/j.cbpc.2008.04.011
Norman, J. D., Danzmann, R. G., Glebe, B., and Ferguson, M. M. (2011). Thegenetic basis of salinity tolerance traits in Arctic charr (Salvelinus alpinus). BMCGenet. 12:81. doi: 10.1186/1471-2156-12-81
Ohta, A., Rai, T., Yui, N., Chiga, M., Yang, S. S., Lin, S. H., et al. (2009). Targeteddisruption of the Wnk4 gene decreases phosphorylation of Na-Cl cotrans-porter, increases Na excretion and lowers blood pressure. Hum. Mol. Genet. 18,3978–3986. doi: 10.1093/hmg/ddp344
Oi, K., Sohara, E., Rai, T., Misawa, M., Chiga, M., Alessi, D. R., et al. (2012).A minor role of WNK3 in regulating phosphorylation of renal NKCC2and NCC co-transporters in vivo. Biol. Open 1, 120–127. doi: 10.1242/bio.2011048
O’Shaughnessy, K. M., and Karet, F. E. (2006). Salt handling and hyperten-sion. Annu. Rev. Nutr. 26, 343–365. doi: 10.1146/annurev.nutr.26.061505.111316
O’Shea, J. J., and Jones, R. G. (2013). Autoimmunity: rubbing salt in the wound.Nature 496, 437–439. doi: 10.1038/nature11959
Padmanabhan, S., Newton-Cheh, C., and Dominiczak, A. F. (2012). Geneticbasis of blood pressure and hypertension. Trends Genet. 28, 397–408. doi:10.1016/j.tig.2012.04.001
Pei, D. S., Sun, Y. H., Chen, S. P., Wang, Y. P., Hu, W., and Zhu, Z. Y. (2007).Zebrafish GAPDH can be used as a reference gene for expression analy-sis in cross-subfamily cloned embryos. Anal. Biochem. 363, 291–293. doi:10.1016/j.ab.2006.12.005
Pravenec, M., and Kurtz, T. W. (2010). Recent advances in genetics of the spon-taneously hypertensive rat. Curr. Hypertens. Rep. 12, 5–9. doi: 10.1007/s11906-009-0083-9
Rapp, J. P. (1982). Dahl salt-susceptible and salt-resistant rats. A review.Hypertension 4, 753–763. doi: 10.1161/01.HYP.4.6.753
Rengmark, A. H., Slettan, A., Lee, W. J., Lie, Ø., and Lingaas, F. (2007).Identification and mapping of genes associated with salt tolerance in tilapia.J. Fish Biol. 71, 409–422. doi: 10.1111/j.1095-8649.2007.01664.x
Robinson, M. D., McCarthy, D. J., and Smyth, G. K. (2010). edgeR: a Bioconductorpackage for differential expression analysis of digital gene expression data.Bioinformatics 26, 139–140. doi: 10.1093/bioinformatics/btp616
Ruiter, A. J. H. D., and Bonga, S. E. W. (1985). Consequences of nestbuildingbehaviour for osmoregulation in male three-spined sticklebacks. Behaviour 93,8–20. doi: 10.1163/156853986X00694
Scott, G. R., Richards, J. G., Forbush, B., Isenring, P., and Schulte, P. M. (2004).Changes in gene expression in gills of the euryhaline killifish Fundulus hetero-clitus after abrupt salinity transfer. Am. J. Physiol. Cell Physiol. 287, C300–C309.doi: 10.1152/ajpcell.00054.2004
Trapnell, C., Roberts, A., Goff, L., Pertea, G., Kim, D., Kelley, D. R., et al.(2012). Differential gene and transcript expression analysis of RNA-seqexperiments with TopHat and Cufflinks. Nat. Protoc. 7, 562–578. doi:10.1038/nprot.2012.016
www.frontiersin.org September 2014 | Volume 5 | Article 312 | 9
Wang et al. Sticklebacks as an animal model for hypertension
Vilella, A. J., Severin, J., Ureta-Vidal, A., Heng, L., Durbin, R., and Birney, E. (2009).EnsemblCompara Genetrees: complete, duplication-aware phylogenetic trees invertebrates. Genome Res. 19, 327–335. doi: 10.1101/gr.073585.107
Wain, L. V., Verwoert, G. C., O’Reilly, P. F., Shi, G., Johnson, T., Johnson, A. D.,et al. (2011). Genome-wide association study identifies six new loci influenc-ing pulse pressure and mean arterial pressure. Nat. Genet. 43, 1005–1011. doi:10.1038/ng.922
Whitehead, A., Roach, J. L., Zhang, S., and Galvez, F. (2011). Genomic mechanismsof evolved physiological plasticity in killifish distributed along an environ-mental salinity gradient. Proc. Natl. Acad. Sci. U.S.A. 108, 6193–6198. doi:10.1073/pnas.1017542108
Whitehead, A., Roach, J. L., Zhang, S. J., and Galvez, F. (2012). Salinity- andpopulation-dependent genome regulatory response during osmotic acclima-tion in the killifish (Fundulus heteroclitus) gill. J. Exp. Biol. 215, 1293–1305. doi:10.1242/jeb.062075
Wu, C., Yosef, N., Thalhamer, T., Zhu, C., Xiao, S., Kishi, Y., et al. (2013). Inductionof pathogenic TH17 cells by inducible salt-sensing kinase SGK1. Nature 496,513–517. doi: 10.1038/nature11984
Wulff, P., Vallon, V., Huang, D. Y., Volkl, H., Yu, F., Richter, K., et al. (2002).Impaired renal Na(+) retention in the sgk1-knockout mouse. J. Clin. Invest.110, 1263–1268. doi: 10.1172/JCI0215696
Xu, G., Deng, N., Zhao, Z., Judeh, T., Flemington, E., and Zhu, D. (2011).SAMMate: a GUI tool for processing short read alignments in SAM/BAMformat. Source Code Biol. Med. 6:2. doi: 10.1186/1751-0473-6-2
Conflict of Interest Statement: The authors declare that the research was con-ducted in the absence of any commercial or financial relationships that could beconstrued as a potential conflict of interest.
Received: 19 May 2014; accepted: 20 August 2014; published online: 11 September2014.Citation: Wang G, Yang E, Smith KJ, Zeng Y, Ji G, Connon R, Fangue NA and Cai JJ(2014) Gene expression responses of threespine stickleback to salinity: implications forsalt-sensitive hypertension. Front. Genet. 5:312. doi: 10.3389/fgene.2014.00312This article was submitted to Evolutionary and Population Genetics, a section of thejournal Frontiers in Genetics.Copyright © 2014 Wang, Yang, Smith, Zeng, Ji, Connon, Fangue and Cai. This is anopen-access article distributed under the terms of the Creative Commons AttributionLicense (CC BY). The use, distribution or reproduction in other forums is permitted,provided the original author(s) or licensor are credited and that the original publica-tion in this journal is cited, in accordance with accepted academic practice. No use,distribution or reproduction is permitted which does not comply with these terms.
Frontiers in Genetics | Evolutionary and Population Genetics September 2014 | Volume 5 | Article 312 | 10