Gene expression, protein abundance and enzyme …web2.bgu.ac.il/algal/Presentations/Diana L....
18
Gene expression, Protein abundance and Enzyme activity – How well do they correlate? Diana L. Reinecke-Levi Supervisor: Prof. Sammy Boussiba Microalga Biotechnology Lab Blaustein Institutes of Desert Research, Midreshet Ben-Gurion
Transcript of Gene expression, protein abundance and enzyme …web2.bgu.ac.il/algal/Presentations/Diana L....

Gene expression, Protein abundance and Enzyme activity –
How well do they correlate?
Diana L. Reinecke-Levi
Supervisor: Prof. Sammy Boussiba
Microalga Biotechnology Lab
Blaustein Institutes of Desert Research, Midreshet Ben-Gurion

Table of content
1. Introduction - Gene expression
- Protein abundance
- Enzyme activity
2. Microalga Haematococcus pluvialis
3. Glutamine Synthetase in H. pluvialis
4. Regulation of Glutamine synthetase in H. pluvialis
5. Results – i. Continuous Light Regime
– ii. Diurnal Light Cycling
– iii. Summary
6. Take home message
7. Closure

1. Introduction
Gene expression is the translation of genetic information into functional macromolecules
1. Functional RNAs 2. Proteins
Gene expression in mammalian cells. Adopted from Abdelmohsen, K., ISBN 978-953-51-0758-3
Examples to the two categories of gene products, (1.) hammerhead ribozyme and (2.) tertiary structure of a polypeptide.
Adopted from Protein Data Bank ID 2GOZ and bioinformatik.uni-leipzig.de

Gene Regulation
Gene expression:
I. Epigenetic Regulation – by Histone modification, DNA methylation, ncRNAs, Prions
II. Transcriptional Regulation – by Specificity & General factors, Repressors, Activators, Enhancers, Silencers, DNA-binding proteins
III. Post-transcriptional Regulation – by Capping, Splicing, Poly-A tailing, RNA processing
IV. Translational Regulation – control of the polypeptide level →
DNA methylation as control mechanism of gene rexpression. Adopted from http://learn.genetics.utah.edu/content/epigenetics/

Regulation of Transcript stability & Translation
Major mechanisms of the transcript and translation regulation. Adopted from de Sousa A. et al., 2009
Protein Regulation
Protein abundance:
I. Translational Regulation – by Conformational masking, Ribosome control, Protein binding, 5' UTR like m7G capping & AUG-Codon
II. Polypeptide stability - by Exonucleases, AU-rich elements, Non-sense mediated decay (NMD) & Non-stop decay , siRNA, miRNA, piRNA
III. Polypeptide folding – by Cellular milieu, Chaperons
IV. Polypeptide targeting – Signal recognition particle & Receptor, ER & Golgi
V. Post-translational Regulation – control of the active protein →
Illustration of the process of protein folding. Adopted from wikipedia.org

Enzyme Regulation
Enzyme activity:
I. Compartmentalisation - by Organella
II. Post-translational modification - by Addition of functional groups & proteins/peptides, Chemical conversion, Structural changes
III. Regulation - by Inhibitors (competitive, uncompetitive, non-competitive, suicide, mixed), Activators (allosteric, co-factors like vitamins, non-vitamins & minerals), precursors
IV. Environmental – by Changing pH
Illustration of the substrate specificity of enzymes. Adopted from chem4kids.com
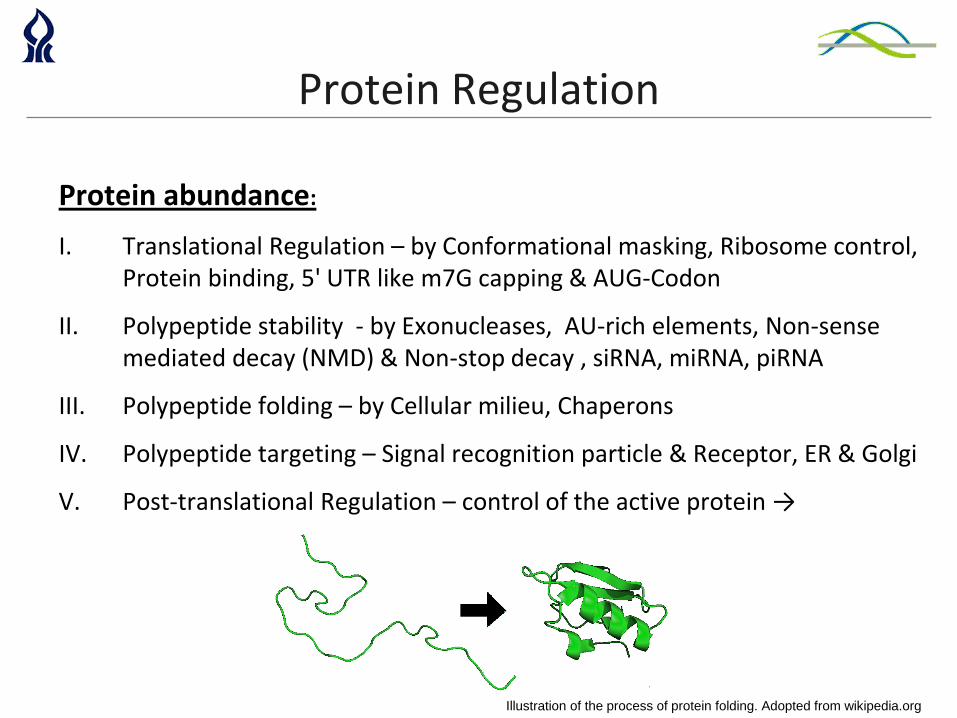
Correlation of mRNA transcript and protein levels
Ratio between mRNA and protein levels, as observed in proteome- and transcriptome-profiling experiments. Adopted from de Sousa A. et al., 2009

Diurnal Protein & Non-diurnal mRNA
Metabolic coordination depends upon temporal regulation of proteins:
Comparison of protein abundance and mRNA level under diurnal cycling in mouse liver. Adopted from Reddy, A. et al., 2006
• 20 % of hepatic proteins are cycling
• Half of them lack the cycling transcript
• Revealing the extent of post-transcriptional regulation

Silicon (Si) starvation in T. pseudonana induces lipid formation and 3 clusters of RNA response:
• 44 % of mRNA are dissociated
• 30 % of mRNA are transient
• 26 % of mRNA are associated
Transcript levels indicate metabolic changes
Comparison of mRNA levels in diatom T. pseudonana under silicon starvation. Adopted from M. Hildebrand lab.

2. Haematococcus pluvialis
• Green plant (Chlorophyta)
• Pigments chlorophyll a + b and carotenoide
• Carotenoide Astaxanthin protects the cell umbrella-like against excessive light
• Economically important as antioxidant in human nutrition
• Non-sequences genome
Tubular photobioreactors with red Haematococcus pluvialis culture.

each subunit binds
glutamate + NH3 + ATP
and converts them to
glutamine + ADP + Pi
3. Glutamine synthetase
Simplified illustration of ammonia assimilation by GS. Adopted from Goodsell, D., 2002 Central role of glutamine synthetase in the N-acquisition and in the C-N-interlink. Adopted from Miflin & Habash, 2002
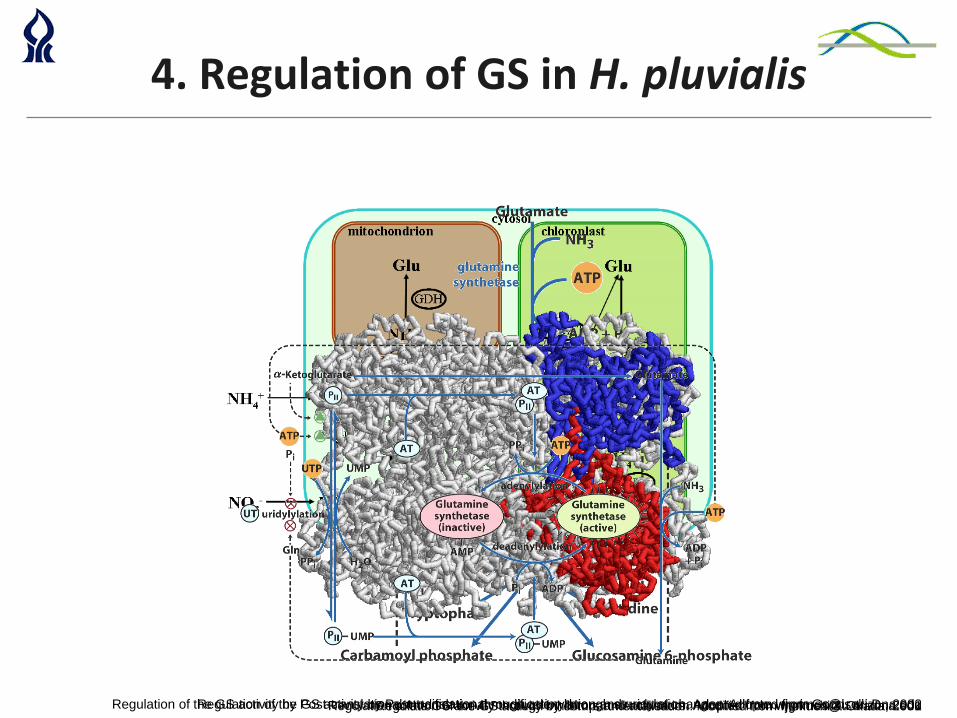
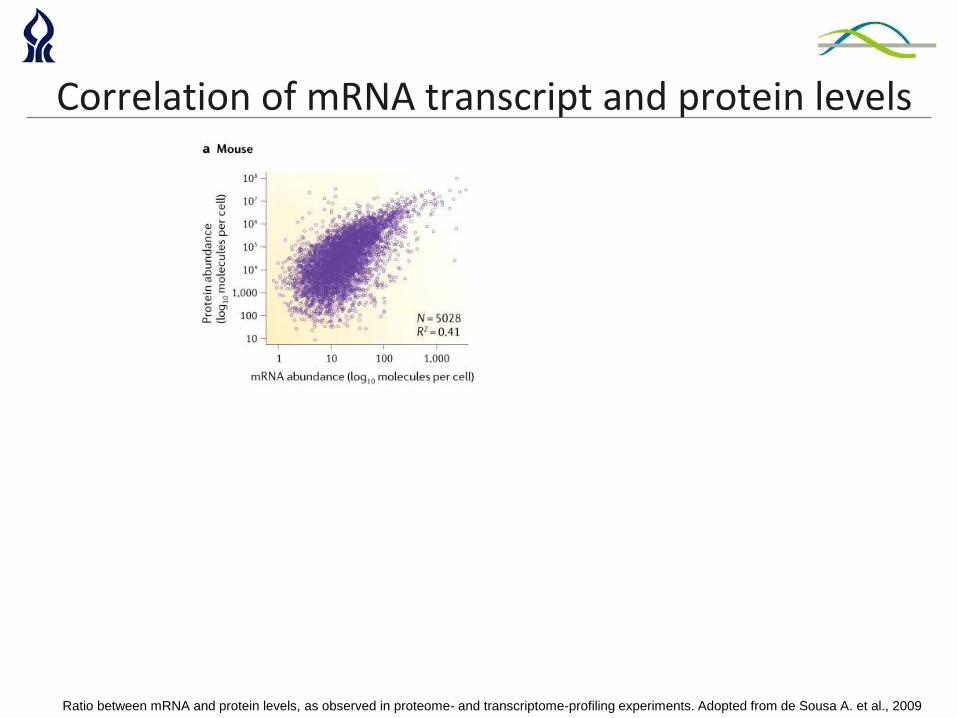
4. Regulation of GS in H. pluvialis
Regulation of the GS activity by compartmentalisation. Modified from Inokuchi & Okada, 2001 Regulation of the GS activity by Post-translational modification through structural changes. Adopted from Goodsell, D., 2002 Regulation of the GS activity by Post-translational modification through adenylation and uridylation. Adopted from [email protected] Regulation of the GS activity through inhibitors and activators. Adopted from [email protected]
5. Results
Transcript level
1
10
100
1000
0 24 48 72 96 120 144
Time [hours]
Ch
loro
ph
yll &
Pro
tein
[µ
g/ m
L]
0
1
2
3
4
GS
ac
tiv
ity
[m
U]
Chll
Protein
GS
Protein abundance
continuous Normal Light
M 0 2 24 48 72 144
GS2
+ +/- ++ + x x
GS1
continuous Normal Light
M 0 2 24 48 72 144
GS2
+ +/- ++ + x x
GS1
continuous Normal Light .
M 0 1 2 4 6 12
gln1
gln2
actin
continuous Normal Light .
M 0 1 2 4 6 12
gln1
gln2
actin
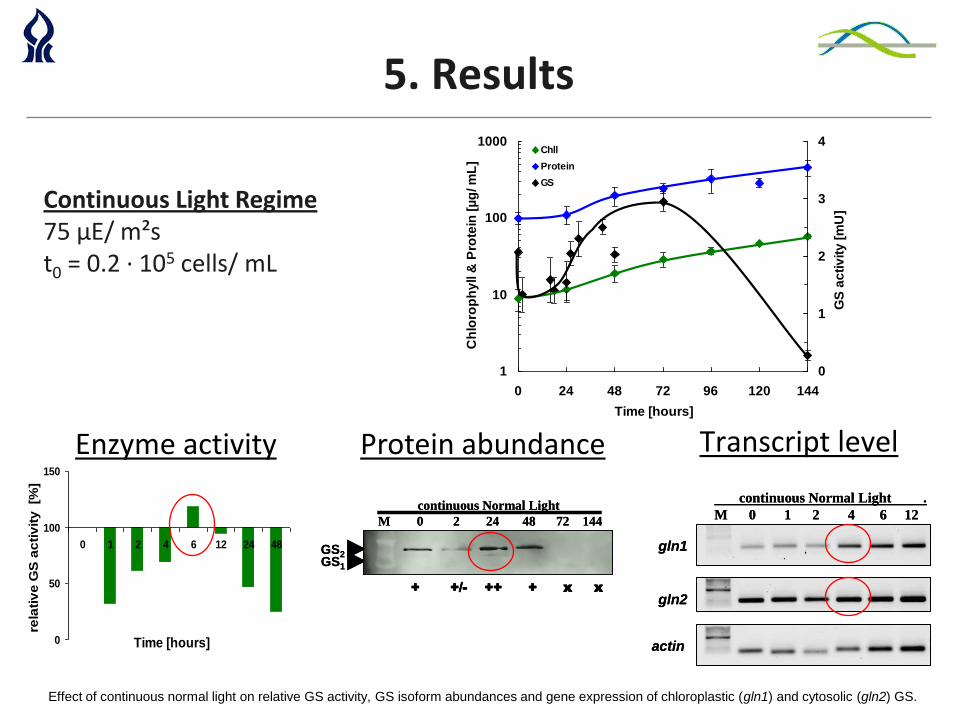
Effect of continuous normal light on relative GS activity, GS isoform abundances and gene expression of chloroplastic (gln1) and cytosolic (gln2) GS.
0
50
100
150
0 1 2 4 6 12 24 48
Time [hours]
rela
tiv
e G
S a
cti
vit
y [%
]
Enzyme activity
Continuous Light Regime 75 µE/ m²s t0 = 0.2 · 105 cells/ mL

Transcript level
Effect of diurnal normal light on relative GS activity, GS isoform abundances and gene expression of chloroplastic (gln1) and cytosolic (gln2) GS.
1
10
100
1000
0 24 48 72 96 120 144
Time [hours]
Ch
loro
ph
yll
& P
rote
in [
µg
/ m
L]
0
1
2
3
4
5
6
7
GS
ac
tiv
ity
[m
U]
Chll
Protein
GS
Protein abundance
diurnal NL
M 0 16 18 24 26 30 42 48
GS2
+ +/- +/- - - - - -
+ +/- +/- - - - - -
GS1
diurnal NL
M 0 16 18 24 26 30 42 48
GS2
+ +/- +/- - - - - -
+ +/- +/- - - - - -
GS1
diurnal NL
M 16 24 26 30 42
gln1
gln2
actin
diurnal NL
M 16 24 26 30 42
gln1
gln2
actin
Enzyme activity
50
100
150
200
16 18 24 26 30 40 42 48
Time [hours]
rela
tiv
e G
S a
cti
vit
y [
%]
Diurnal Light Cycling 75 µE/ m²s L:D/ 16:8 hours t0 = 0.2 · 105 cells/ mL

Summary
Diurnal cycling:
Transcript level Enzyme activity Protein abundance
GS ↑
GS1 ↑ gln1 ↑
GS2 ↑ gln2 ↔
dissociated
Non-rhythmic mRNA
delayed mRNA
GS ↓↑
GS1 x gln1 ↑
GS2 ↓↑ gln2 ↔
associated dissociate mRNA
associated mRNA Continuous light:

6. Take-home message
1. Changes in mRNA levels just indicate metabolic changes.
2. Changes in mRNA levels moderately correlate with changes in protein abundance.
3. Disparity between mRNA levels and protein abundance make it difficult to predict the enzyme activity.
in Haematococcus pluvialis:
• GS transcript-, protein- and activity- levels are significantly affected by the light regime
• GS1 protein and activity increase in the dark
• GS2 protein and activity increase in the light
• gln gene transcript levels are moderately associated to GS levels
Genetic networks & Regulatory mechanisms require more research.

Thank you for your attention.
“And some Haematococcus for anti- ageing.”