Lymphoid tissue and lymphoid-glandular complexes of the colon ...
Gene expression profile of human lymphoid CEM cells sensitive andresistant to glucocorticoid-evoked apoptosis
Rheem D. Medh,a M. Scott Webb,b Aaron L. Miller,b Betty H. Johnson,b Yuriy Fofanov,c
Tongbin Li,c Thomas G. Wood,d Bruce A. Luxon,b and E. Brad Thompsonb,*a Department of Biology, California State University, Northridge, CA 91330-8303, USA
b Department of Human Biological Chemistry and Genetics, The University of Texas Medical Branch, Galveston, TX 77555-0645, USAc Department of Computer Science, The University of Houston, Houston, TX 77204-3010, USA
d Sealy Center for Molecular Science, The University of Texas Medical Branch, Galveston, TX 77555-0645, USA
Received 9 December 2002; accepted 31 January 2003
Abstract
Three closely related clones of leukemic lymphoid CEM cells were compared for their gene expression responses to the glucocorticoiddexamethasone (Dex). All three contained receptors for Dex, but only two responded by undergoing apoptosis. After a time of exposure toDex that ended late in the interval preceding onset of apoptosis, gene microarray analyses were carried out. The results indicate that theexpression of a limited, distinctive set of genes was altered in the two apoptosis-prone clones, not in the resistant clone. That clone showedaltered expression of different sets of genes, suggesting that a molecular switch converted patterns of gene expression between the twophenotypes: apoptosis-prone and apoptosis-resistant. The results are consistent with the hypothesis that altered expression of a distinctivenetwork of genes after glucocorticoid administration ultimately triggers apoptosis of leukemic lymphoid cells. The altered genes identifiedprovide new foci for study of their role in cell death.© 2003 Elsevier Science (USA). All rights reserved.
Keywords: Human lymphoid cells; CEM; Apoptosis; Glucocorticoid sensitivity/resistance; Microarray analysis; Novel genes; Gene expression profile; Datamining
For almost 60 years, it has been known that glucocor-ticoids are capable of lysing certain classes of immaturelymphoid cells [1], and this knowledge has been appliedwidely in the treatment of lymphoid malignancies [2].With the recognition of apoptosis as a form of suicidalcell death, it became clear that lymphoid cells also un-derwent this process when exposed to pharmacologicalconcentrations of glucocorticoids [3,4]. Lymphoid cellapoptosis was shown to be absolutely dependent on glu-cocorticoid occupancy of the glucocorticoid receptor(GR), a specific intracellular glucocorticoid-activatedtranscription factor [5]. This implicated altered gene reg-ulation in apoptosis, evidence for which came from ex-periments on thymocytes and malignant lymphoid cells.
In both, general inhibitors of transcription and/or trans-lation were used to show that blocking macromolecularsynthesis also blocked various morphological and bio-chemical indicators of apoptosis [4,6 –10]. Timing wascritical for these experiments, because the completeblock of either transcription or translation would in itselfbe lethal after a time. Thus the paradigm was establishedthat in these lymphoid apoptotic systems, alterations ingene regulation led to eventual apoptotic death. It is nowclear that, in general, apoptosis occurs by the preciseregulation of a multitude of genes, rather than one or afew genes [11].
The search for genes whose regulation is required forsteroid-induced apoptosis of lymphoid cells has engrossedmany laboratories for years. By knowledge of metabolicprocesses, biochemical pathways, regulatory systems, andcellular organelles, as well as by various forms of differen-
* Corresponding author. Fax: �1-409-772-5159.E-mail address: [email protected] (E.B. Thompson).
R
Available online at www.sciencedirect.com
Genomics 81 (2003) 543–555 www.elsevier.com/locate/ygeno
0888-7543/03/$ – see front matter © 2003 Elsevier Science (USA). All rights reserved.doi:10.1016/S0888-7543(03)00045-4

tial gene product screening, attempts have been made todiscover the critically regulated genes and their mRNA andprotein products [12–17]. This sustained effort has, in fact,produced several interesting and valuable leads. In thymo-cytes or malignantly transformed lymphoid cells, variouslandmarks in the processes leading to apoptosis have beenestablished. Yet it is clear that these experiments, thoughbased on the best biological intuitions or early screeningtechniques, have not completely defined the pathway. Untilrecently, the technologies available for relatively unbiasedscreening simply have not had the resolving power neces-sary to identify the necessary and sufficient genes involved.Now, with the advent of microarray technology, this long-sought goal is within reach. Several studies of lymphoid cellgene expression have now been carried out using this newtechnology, and a few have begun to examine the effects ofglucocorticoids on gene expression. These studies, thoughexciting, have only begun to unravel the skein of complexgene regulations involved. We present here the initial resultsfrom the examination of glucocorticoid-induced changes ingene expression in a closely related set of three malignantlymphoid cell clones. Comparisons of genes regulated in thethree clones have resulted in identification of a relativelysmall number of genes that correlate with cellular sensitivityto glucocorticoids’ evocation of apoptosis.
CEM cells are a line of lymphoblastic cells originallyderived from a child with acute lymphoblastic leukemia[18]. Like all uncloned cell lines, the original CEM cells area mixed population of clones with varied genotypes andphenotypes. Because of this, we have carried out all ourstudies on clones isolated from the original CEM line.Clones CEM-C7 and CEM-C1 provided our prototypicalglucocorticoid-sensitive and -resistant phenotypes, respec-tively. Because of the well-known genetic and phenotypicdrift of all types of cells growing continuously, and ofeukaryotic tissue culture cells especially [19–21], we re-cently recloned each of the parental clones to repurify theoriginal phenotypes. This established CEM-C7 subcloneCEM-C7-14 as the prototypic GR-sensitive clone andCEM-C1 subclone CEM-C1-15 as the GR-resistant clone.In the process, we captured a clone from CEM-C1 that hadreverted to sensitivity. In this paper, we describe and com-pare the changes in gene expression caused by exposure tothe synthetic steroid dexamethasone (Dex) seen in the cellsof these three clones—two sensitive and one resistant toglucocorticoid-induced apoptosis.
Sensitive CEM cells must be incubated in concentrationsof steroid sufficient to occupy fully all GRs present in thecells for �24 h before the onset of biochemical and mostmorphological evidence of apoptosis can be measured [5].The exception regarding morphology is classic pre-apop-totic cell shrinkage that begins as early as 6 h after steroidis added. Nevertheless, if glucocorticoid is removed or anti-glucocorticoid added at times up to �24 h, all processes arereversible and the cells continue to grow without pause.Beyond 24 h, increasing numbers of cells become locked in
the apoptotic processes, which removal of steroid does notreverse.
We therefore have chosen to identify the genes that havechanged at a point just before the irreversible steps of trueapoptosis begin. This tested our working hypothesis that thesensitive subclone CEM-C7-14 and the sensitive revertantCEM-C1-6 shared a set of altered gene products that wouldbe distinctively different from any genes induced or sup-pressed in the resistant subclone, CEM-C1-15.
Results
Characteristics of CEM clones
Three clones of CEM cells were compared: two (C7-14and C1-6) undergo apoptosis when exposed to 1 �M Dex;the third (C1-15) is completely resistant to the growth-inhibiting and apoptotic effects of the steroid. All three arerecent subclones of the original C7 (sensitive) and C1 (re-sistant) clones, derived from the uncloned CEM cell line[22,23]. Subclones C7-14 and C1-15 were chosen for studybecause they re-established the pseudodiploid karyotypesand steroid response phenotypes of the original parentalclones. They contain essentially equal levels of GRs. Sub-clone C1-6 represents a rare spontaneous revertant from C1that has recovered an apoptotic response to Dex. C1-6 cellsare hyperploid, with a mean chromosome number of 94.Some of the properties of the three clones are compared inTable 1 and Fig. 1.
The onset of overt cell loss in the sensitive clones occursafter �24 h (Fig. 1A). The C1-6 revertant-to-sensitive cloneis less stable in phenotype than C7-14, and rapidly accu-mulates a subpopulation of resistant cells, indicated by itsgrowth curve leveling off after 24 h, as a result of therelatively high rate of reaccumulation of resistant cells inthe C1-6 population. As employed herein, however, the vastmajority of the C1-6 cells underwent apoptosis after �48 hin Dex, as demonstrated by typical DNA breakdown tosubdiploid levels by propidium iodide (PI) staining (Fig.1B). Fig. 1C shows that in the two sensitive clones after20 h in Dex, cell death had hardly begun according toseveral markers of apoptosis: phosphotidylserine (PS) ever-sion, mitochondrial membrane integrity, and PI staining ofcellular DNA. No significant difference from control is seenin JC-1 stains for mitochondrial integrity or in the popula-tion with subdiploid DNA (PI, P � 0.5). The PS eversion ofthe lipid from the inner to the outer surface of the plasmamembrane, an early event in apoptosis, was just beginningin one of the sensitive clones after 20 h. From these exper-iments and from previous knowledge of the timing of re-sponses to steroids in CEM-C7 and CEM-C1 cells, wehypothesized that a complex sequence of changes in geneexpression occurs in the sensitive lymphoid cells over aperiod of many hours, eventuating in one or more irrevers-ible steps that triggers the acute apoptotic process. Clones
544 R.D. Medh et al. / Genomics 81 (2003) 543–555
C7-14 and C1-6 should display these gene expressionchanges; clone C1-15 should not.
To test the hypothesis, we analyzed gene expressionprofiles in the three clones by microarray analysis. Datawere obtained on genes with altered expression after 20 h ofcontinual exposure to Dex, a time late in the preliminaryperiod leading to apoptosis. On three occasions over thecourse of 1 year, cells in mid-logarithmic growth at �4 �105 cells/ml were treated with ethanol vehicle or 10�6 MDex. After 20 h, RNA was extracted from the cells anddelivered to the UTMB Genomics Core Laboratory fortarget labeling, hybridization, and initial chip data analysis,using the Affymetrix HG_U95Av2 chip.
Validation of microarray data
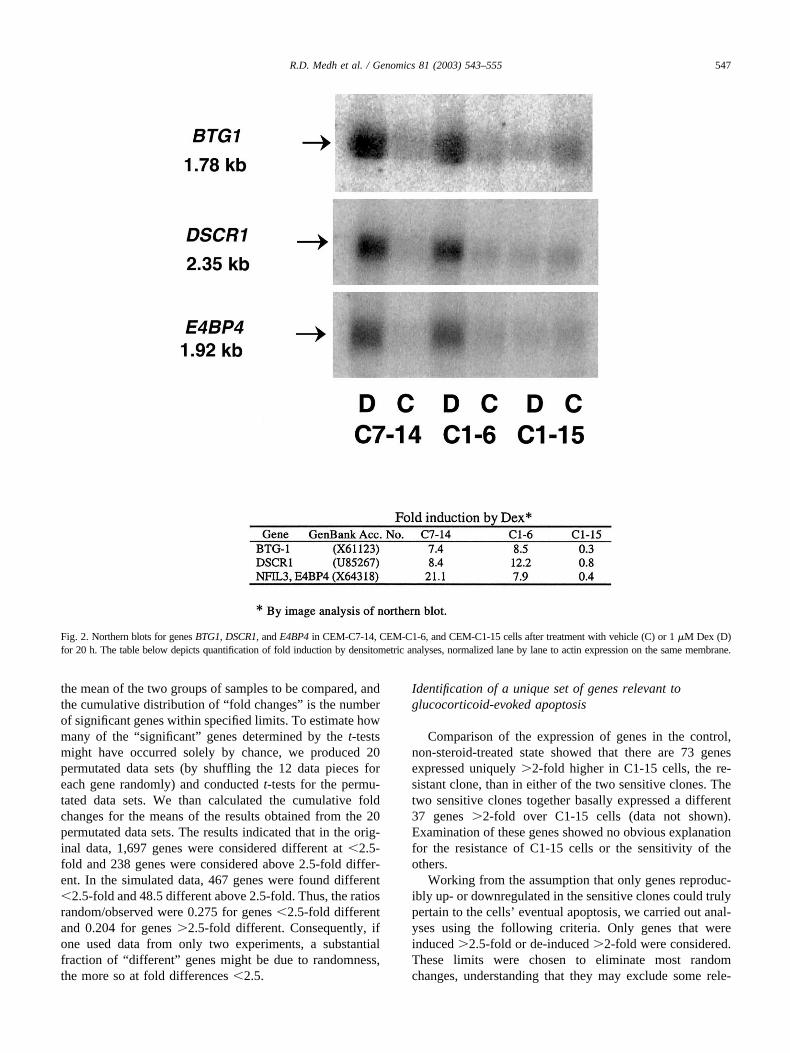
Several data validation experiments were conducted. Ini-tially, the Genomics Core Laboratory independently testedthe general reproducibility of gene expression displayed bythe chips by analyzing a single RNA sample on three sep-arate chips, not related to this study. The number of geneswhose expression appeared to vary �2-fold was 12 of�6,000 genes expressed, or �0.2%. In addition to thisgeneral validation, the data from our chips were checked inseveral ways. First, our microarray data confirmed the reg-ulation of several genes that we had earlier identified bymanual experiments in the sensitive parental C7 clone[5,25]. Thus, c-myc and ornithine decarboxylase were sup-pressed and GR� and c-jun were induced in the C7-14subclone. Second, from the microarray data sets we arbi-trarily selected three genes we had not studied before, thataccording to the chip data were induced in the sensitivecells. We tested for regulation of these three genes bynorthern blot analysis using actin as a normalizing control.The data (Fig. 2) clearly showed that there was induction ofthe mRNA of each by Dex in the sensitive clones but not inthe resistant one. To our knowledge, none of these genes,B-cell translocation gene 1 (BTG1), Down syndrome can-didate region 1 (DSCR1), or E4 promoter-binding protein 4(E4BP4), had previously been associated with glucocorti-coid-evoked lymphoid cell apoptosis. Finally, we noted that
several of the genes detected as regulated were representedat two independent locations on the chips; hence, theyprovided internal independent controls that the observedchange was not due to random causes. Together, theseresults suggested that the data from the gene chips reflectedthe behavior of gene expression in the cells.
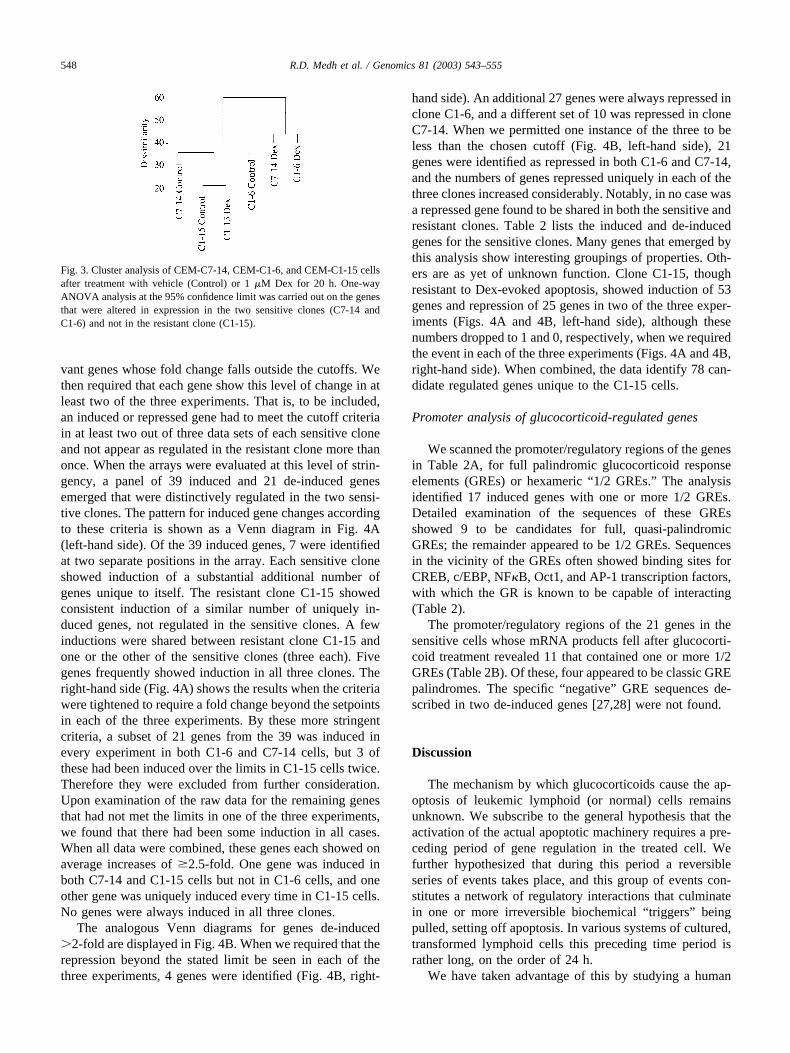
Cluster analyses and evaluation of randomness
The patterns of basal gene versus altered expression werethen compared by cluster analyses. Of the 12,626 genes onthe Affymetrix HG_U95Av2 chip, approximately half weredetected as expressed in the basal state. One-way ANOVAanalysis of these at the 95% confidence limit revealed that inthe basal state the resistant C1-15 clone and the Dex-sensi-tive revertant C1-6 clone clustered more closely than eitherdid to the sensitive cone C7-14 (not shown). After Dextreatment, 751 genes were altered in expression at the 95%confidence limit in the two sensitive clones and not in theresistant clone. When clustering was carried out using onlythese altered genes, the sensitive revertant from C1 nowshifted so as to cluster more closely with the inherentlysensitive clone C7-14 and away from the resistant sisterclone C1-15 (Fig. 3). This is consistent with our hypothesis.However, ANOVA-based statistical methods operate on thepremise that the populations considered follow a Gaussiandistribution. For fold-change data in cellular gene expres-sion, this may not be so, because the apparent increases areoften bunched in the very low-fold range. Several calcula-tions were carried out to estimate the possibility that even atthe 95% confidence limit there remained a considerablechance that some genes scored as altered could have beenrandom events. In one such calculation, unpaired Student’st-tests were conducted between the glucocorticoid-sensitivecell lines C1-6 and C7-14 (control plus Dex, eight chips)and the glucocorticoid-resistant cell line C1-15 (control plusDex, four chips); (for technical reasons, data from only twoof the three experiments could be used). The cumulativedistribution of “fold changes” was calculated for the genesthat were identified as “significantly different” in the t-tests(P � 0.05). “Fold changes” is defined as the ratio (�1) of
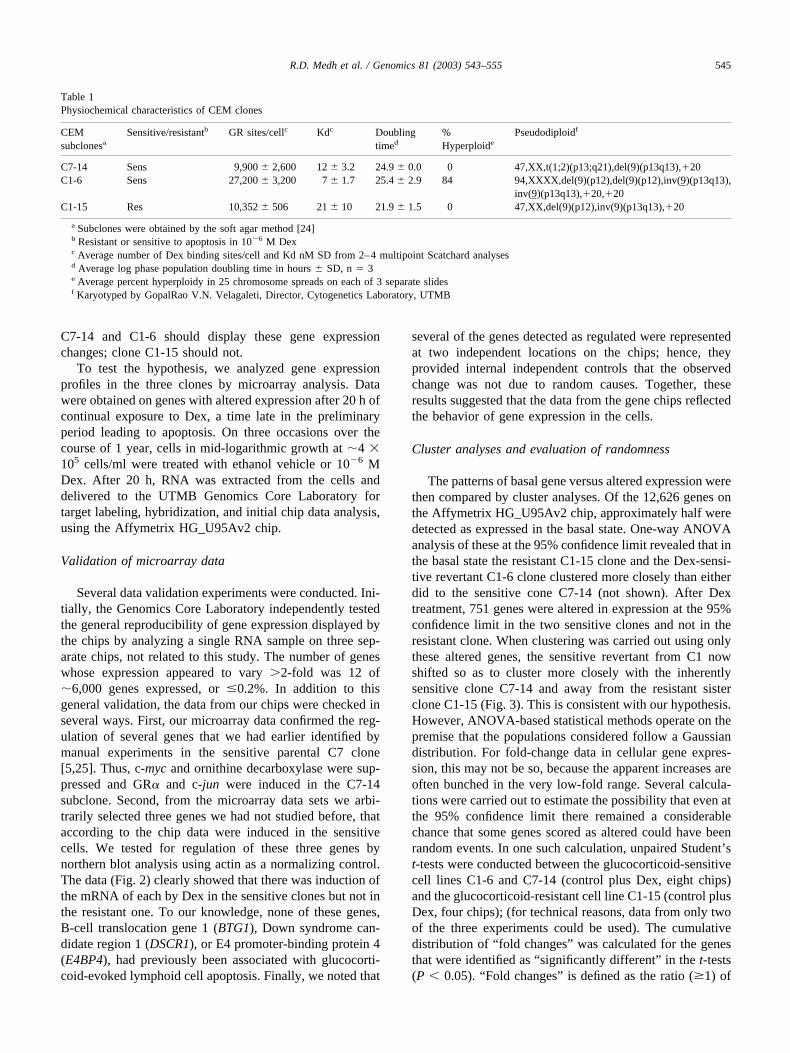
Table 1Physiochemical characteristics of CEM clones
CEMsubclonesa
Sensitive/resistantb GR sites/cellc Kdc Doublingtimed
%Hyperploide
Pseudodiploidf
C7-14 Sens 9,900 � 2,600 12 � 3.2 24.9 � 0.0 0 47,XX,t(1;2)(p13;q21),del(9)(p13q13),�20C1-6 Sens 27,200 � 3,200 7 � 1.7 25.4 � 2.9 84 94,XXXX,del(9)(p12),del(9)(p12),inv(9)(p13q13),
inv(9)(p13q13),�20,�20C1-15 Res 10,352 � 506 21 � 10 21.9 � 1.5 0 47,XX,del(9)(p12),inv(9)(p13q13),�20
a Subclones were obtained by the soft agar method [24]b Resistant or sensitive to apoptosis in 10�6 M Dexc Average number of Dex binding sites/cell and Kd nM SD from 2–4 multipoint Scatchard analysesd Average log phase population doubling time in hours � SD, n � 3e Average percent hyperploidy in 25 chromosome spreads on each of 3 separate slidesf Karyotyped by GopalRao V.N. Velagaleti, Director, Cytogenetics Laboratory, UTMB
545R.D. Medh et al. / Genomics 81 (2003) 543–555
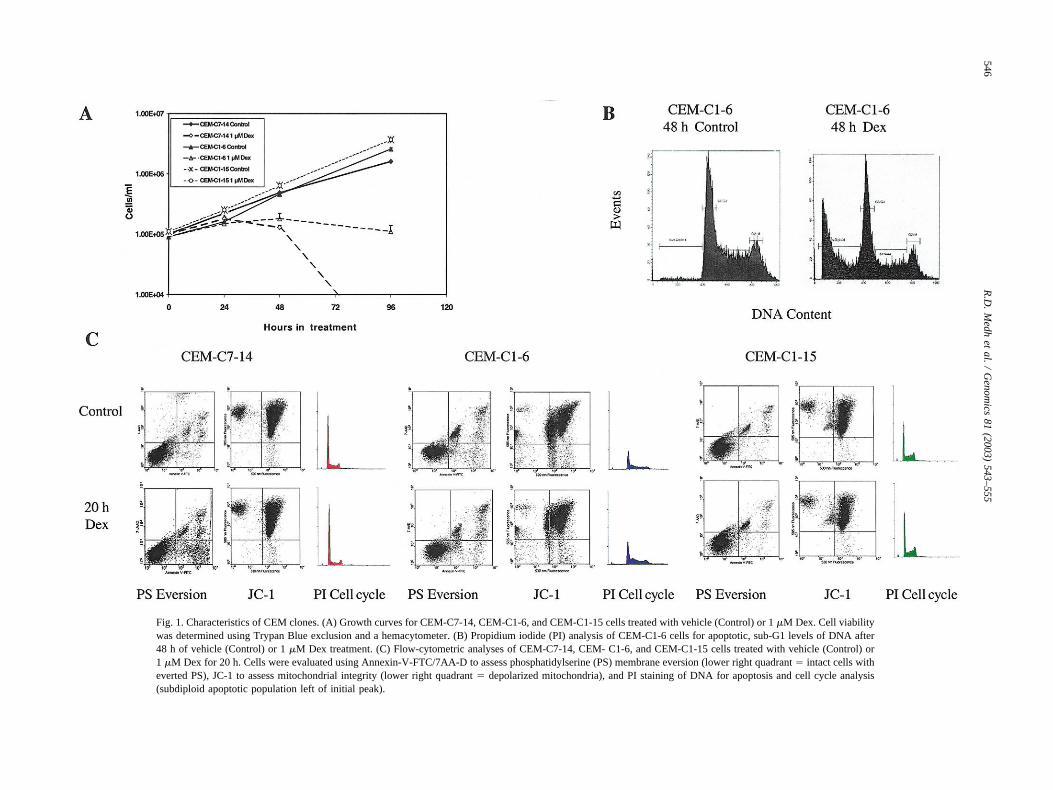
Fig. 1. Characteristics of CEM clones. (A) Growth curves for CEM-C7-14, CEM-C1-6, and CEM-C1-15 cells treated with vehicle (Control) or 1 �M Dex. Cell viabilitywas determined using Trypan Blue exclusion and a hemacytometer. (B) Propidium iodide (PI) analysis of CEM-C1-6 cells for apoptotic, sub-G1 levels of DNA after48 h of vehicle (Control) or 1 �M Dex treatment. (C) Flow-cytometric analyses of CEM-C7-14, CEM- C1-6, and CEM-C1-15 cells treated with vehicle (Control) or1 �M Dex for 20 h. Cells were evaluated using Annexin-V-FTC/7AA-D to assess phosphatidylserine (PS) membrane eversion (lower right quadrant � intact cells witheverted PS), JC-1 to assess mitochondrial integrity (lower right quadrant � depolarized mitochondria), and PI staining of DNA for apoptosis and cell cycle analysis(subdiploid apoptotic population left of initial peak).
546R
.D.
Medh
etal.
/G
enomics
81(2003)
543–555
the mean of the two groups of samples to be compared, andthe cumulative distribution of “fold changes” is the numberof significant genes within specified limits. To estimate howmany of the “significant” genes determined by the t-testsmight have occurred solely by chance, we produced 20permutated data sets (by shuffling the 12 data pieces foreach gene randomly) and conducted t-tests for the permu-tated data sets. We than calculated the cumulative foldchanges for the means of the results obtained from the 20permutated data sets. The results indicated that in the orig-inal data, 1,697 genes were considered different at �2.5-fold and 238 genes were considered above 2.5-fold differ-ent. In the simulated data, 467 genes were found different�2.5-fold and 48.5 different above 2.5-fold. Thus, the ratiosrandom/observed were 0.275 for genes �2.5-fold differentand 0.204 for genes �2.5-fold different. Consequently, ifone used data from only two experiments, a substantialfraction of “different” genes might be due to randomness,the more so at fold differences �2.5.
Identification of a unique set of genes relevant toglucocorticoid-evoked apoptosis
Comparison of the expression of genes in the control,non-steroid-treated state showed that there are 73 genesexpressed uniquely �2-fold higher in C1-15 cells, the re-sistant clone, than in either of the two sensitive clones. Thetwo sensitive clones together basally expressed a different37 genes �2-fold over C1-15 cells (data not shown).Examination of these genes showed no obvious explanationfor the resistance of C1-15 cells or the sensitivity of theothers.
Working from the assumption that only genes reproduc-ibly up- or downregulated in the sensitive clones could trulypertain to the cells’ eventual apoptosis, we carried out anal-yses using the following criteria. Only genes that wereinduced �2.5-fold or de-induced �2-fold were considered.These limits were chosen to eliminate most randomchanges, understanding that they may exclude some rele-
Fig. 2. Northern blots for genes BTG1, DSCR1, and E4BP4 in CEM-C7-14, CEM-C1-6, and CEM-C1-15 cells after treatment with vehicle (C) or 1 �M Dex (D)for 20 h. The table below depicts quantification of fold induction by densitometric analyses, normalized lane by lane to actin expression on the same membrane.
547R.D. Medh et al. / Genomics 81 (2003) 543–555
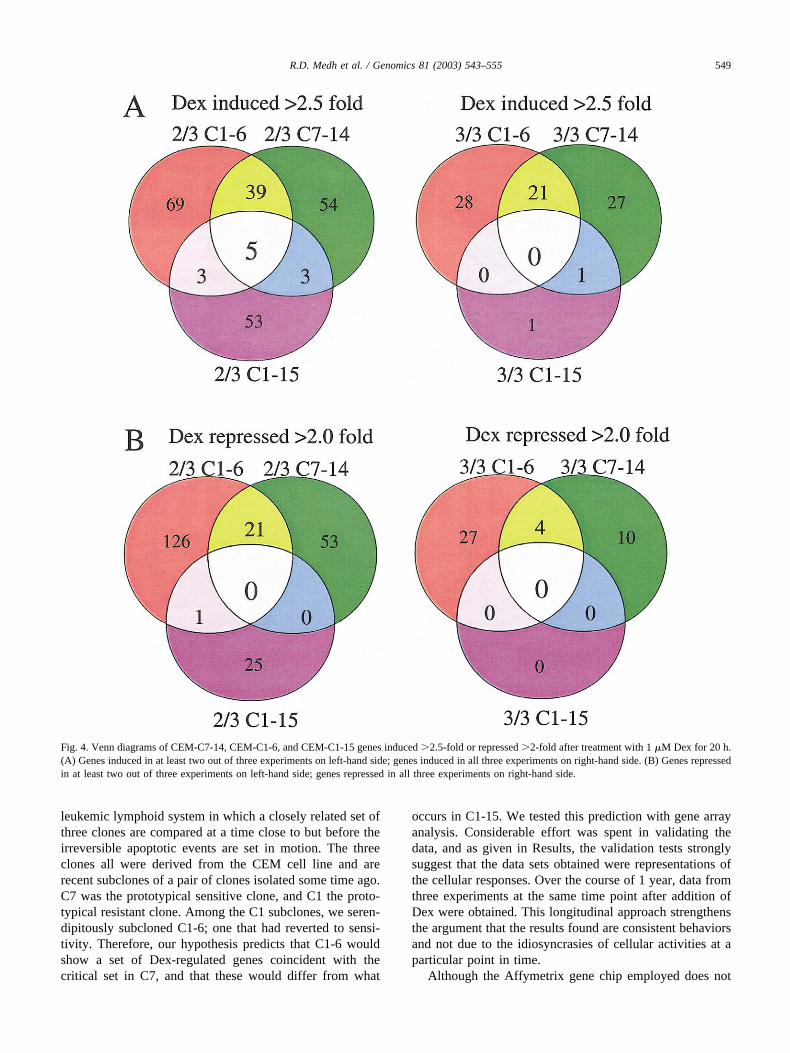
vant genes whose fold change falls outside the cutoffs. Wethen required that each gene show this level of change in atleast two of the three experiments. That is, to be included,an induced or repressed gene had to meet the cutoff criteriain at least two out of three data sets of each sensitive cloneand not appear as regulated in the resistant clone more thanonce. When the arrays were evaluated at this level of strin-gency, a panel of 39 induced and 21 de-induced genesemerged that were distinctively regulated in the two sensi-tive clones. The pattern for induced gene changes accordingto these criteria is shown as a Venn diagram in Fig. 4A(left-hand side). Of the 39 induced genes, 7 were identifiedat two separate positions in the array. Each sensitive cloneshowed induction of a substantial additional number ofgenes unique to itself. The resistant clone C1-15 showedconsistent induction of a similar number of uniquely in-duced genes, not regulated in the sensitive clones. A fewinductions were shared between resistant clone C1-15 andone or the other of the sensitive clones (three each). Fivegenes frequently showed induction in all three clones. Theright-hand side (Fig. 4A) shows the results when the criteriawere tightened to require a fold change beyond the setpointsin each of the three experiments. By these more stringentcriteria, a subset of 21 genes from the 39 was induced inevery experiment in both C1-6 and C7-14 cells, but 3 ofthese had been induced over the limits in C1-15 cells twice.Therefore they were excluded from further consideration.Upon examination of the raw data for the remaining genesthat had not met the limits in one of the three experiments,we found that there had been some induction in all cases.When all data were combined, these genes each showed onaverage increases of �2.5-fold. One gene was induced inboth C7-14 and C1-15 cells but not in C1-6 cells, and oneother gene was uniquely induced every time in C1-15 cells.No genes were always induced in all three clones.
The analogous Venn diagrams for genes de-induced�2-fold are displayed in Fig. 4B. When we required that therepression beyond the stated limit be seen in each of thethree experiments, 4 genes were identified (Fig. 4B, right-
hand side). An additional 27 genes were always repressed inclone C1-6, and a different set of 10 was repressed in cloneC7-14. When we permitted one instance of the three to beless than the chosen cutoff (Fig. 4B, left-hand side), 21genes were identified as repressed in both C1-6 and C7-14,and the numbers of genes repressed uniquely in each of thethree clones increased considerably. Notably, in no case wasa repressed gene found to be shared in both the sensitive andresistant clones. Table 2 lists the induced and de-inducedgenes for the sensitive clones. Many genes that emerged bythis analysis show interesting groupings of properties. Oth-ers are as yet of unknown function. Clone C1-15, thoughresistant to Dex-evoked apoptosis, showed induction of 53genes and repression of 25 genes in two of the three exper-iments (Figs. 4A and 4B, left-hand side), although thesenumbers dropped to 1 and 0, respectively, when we requiredthe event in each of the three experiments (Figs. 4A and 4B,right-hand side). When combined, the data identify 78 can-didate regulated genes unique to the C1-15 cells.
Promoter analysis of glucocorticoid-regulated genes
We scanned the promoter/regulatory regions of the genesin Table 2A, for full palindromic glucocorticoid responseelements (GREs) or hexameric “1/2 GREs.” The analysisidentified 17 induced genes with one or more 1/2 GREs.Detailed examination of the sequences of these GREsshowed 9 to be candidates for full, quasi-palindromicGREs; the remainder appeared to be 1/2 GREs. Sequencesin the vicinity of the GREs often showed binding sites forCREB, c/EBP, NF�B, Oct1, and AP-1 transcription factors,with which the GR is known to be capable of interacting(Table 2).
The promoter/regulatory regions of the 21 genes in thesensitive cells whose mRNA products fell after glucocorti-coid treatment revealed 11 that contained one or more 1/2GREs (Table 2B). Of these, four appeared to be classic GREpalindromes. The specific “negative” GRE sequences de-scribed in two de-induced genes [27,28] were not found.
Discussion
The mechanism by which glucocorticoids cause the ap-optosis of leukemic lymphoid (or normal) cells remainsunknown. We subscribe to the general hypothesis that theactivation of the actual apoptotic machinery requires a pre-ceding period of gene regulation in the treated cell. Wefurther hypothesized that during this period a reversibleseries of events takes place, and this group of events con-stitutes a network of regulatory interactions that culminatein one or more irreversible biochemical “triggers” beingpulled, setting off apoptosis. In various systems of cultured,transformed lymphoid cells this preceding time period israther long, on the order of 24 h.
We have taken advantage of this by studying a human
Fig. 3. Cluster analysis of CEM-C7-14, CEM-C1-6, and CEM-C1-15 cellsafter treatment with vehicle (Control) or 1 �M Dex for 20 h. One-wayANOVA analysis at the 95% confidence limit was carried out on the genesthat were altered in expression in the two sensitive clones (C7-14 andC1-6) and not in the resistant clone (C1-15).
548 R.D. Medh et al. / Genomics 81 (2003) 543–555
leukemic lymphoid system in which a closely related set ofthree clones are compared at a time close to but before theirreversible apoptotic events are set in motion. The threeclones all were derived from the CEM cell line and arerecent subclones of a pair of clones isolated some time ago.C7 was the prototypical sensitive clone, and C1 the proto-typical resistant clone. Among the C1 subclones, we seren-dipitously subcloned C1-6; one that had reverted to sensi-tivity. Therefore, our hypothesis predicts that C1-6 wouldshow a set of Dex-regulated genes coincident with thecritical set in C7, and that these would differ from what
occurs in C1-15. We tested this prediction with gene arrayanalysis. Considerable effort was spent in validating thedata, and as given in Results, the validation tests stronglysuggest that the data sets obtained were representations ofthe cellular responses. Over the course of 1 year, data fromthree experiments at the same time point after addition ofDex were obtained. This longitudinal approach strengthensthe argument that the results found are consistent behaviorsand not due to the idiosyncrasies of cellular activities at aparticular point in time.
Although the Affymetrix gene chip employed does not
Fig. 4. Venn diagrams of CEM-C7-14, CEM-C1-6, and CEM-C1-15 genes induced �2.5-fold or repressed �2-fold after treatment with 1 �M Dex for 20 h.(A) Genes induced in at least two out of three experiments on left-hand side; genes induced in all three experiments on right-hand side. (B) Genes repressedin at least two out of three experiments on left-hand side; genes repressed in all three experiments on right-hand side.
549R.D. Medh et al. / Genomics 81 (2003) 543–555
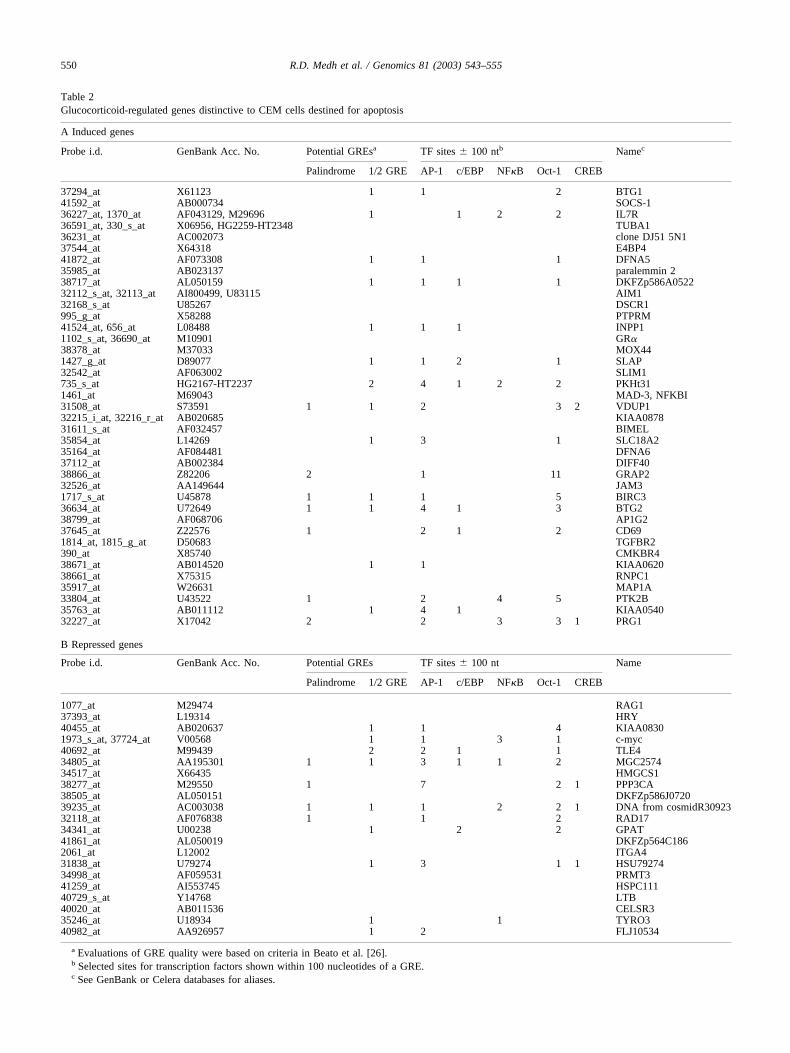
Table 2Glucocorticoid-regulated genes distinctive to CEM cells destined for apoptosis
A Induced genes
Probe i.d. GenBank Acc. No. Potential GREsa TF sites � 100 ntb Namec
Palindrome 1/2 GRE AP-1 c/EBP NF�B Oct-1 CREB
37294_at X61123 1 1 2 BTG141592_at AB000734 SOCS-136227_at, 1370_at AF043129, M29696 1 1 2 2 IL7R36591_at, 330_s_at X06956, HG2259-HT2348 TUBA136231_at AC002073 clone DJ51 5N137544_at X64318 E4BP441872_at AF073308 1 1 1 DFNA535985_at AB023137 paralemmin 238717_at AL050159 1 1 1 1 DKFZp586A052232112_s_at, 32113_at AI800499, U83115 AIM132168_s_at U85267 DSCR1995_g_at X58288 PTPRM41524_at, 656_at L08488 1 1 1 INPP11102_s_at, 36690_at M10901 GR�38378_at M37033 MOX441427_g_at D89077 1 1 2 1 SLAP32542_at AF063002 SLIM1735_s_at HG2167-HT2237 2 4 1 2 2 PKHt311461_at M69043 MAD-3, NFKBI31508_at S73591 1 1 2 3 2 VDUP132215_i_at, 32216_r_at AB020685 KIAA087831611_s_at AF032457 BIMEL35854_at L14269 1 3 1 SLC18A235164_at AF084481 DFNA637112_at AB002384 DIFF4038866_at Z82206 2 1 11 GRAP232526_at AA149644 JAM31717_s_at U45878 1 1 1 5 BIRC336634_at U72649 1 1 4 1 3 BTG238799_at AF068706 AP1G237645_at Z22576 1 2 1 2 CD691814_at, 1815_g_at D50683 TGFBR2390_at X85740 CMKBR438671_at AB014520 1 1 KIAA062038661_at X75315 RNPC135917_at W26631 MAP1A33804_at U43522 1 2 4 5 PTK2B35763_at AB011112 1 4 1 KIAA054032227_at X17042 2 2 3 3 1 PRG1
B Repressed genes
Probe i.d. GenBank Acc. No. Potential GREs TF sites � 100 nt Name
Palindrome 1/2 GRE AP-1 c/EBP NF�B Oct-1 CREB
1077_at M29474 RAG137393_at L19314 HRY40455_at AB020637 1 1 4 KIAA08301973_s_at, 37724_at V00568 1 1 3 1 c-myc40692_at M99439 2 2 1 1 TLE434805_at AA195301 1 1 3 1 1 2 MGC257434517_at X66435 HMGCS138277_at M29550 1 7 2 1 PPP3CA38505_at AL050151 DKFZp586J072039235_at AC003038 1 1 1 2 2 1 DNA from cosmidR3092332118_at AF076838 1 1 2 RAD1734341_at U00238 1 2 2 GPAT41861_at AL050019 DKFZp564C1862061_at L12002 ITGA431838_at U79274 1 3 1 1 HSU7927434998_at AF059531 PRMT341259_at AI553745 HSPC11140729_s_at Y14768 LTB40020_at AB011536 CELSR335246_at U18934 1 1 TYRO340982_at AA926957 1 2 FLJ10534
a Evaluations of GRE quality were based on criteria in Beato et al. [26].b Selected sites for transcription factors shown within 100 nucleotides of a GRE.c See GenBank or Celera databases for aliases.
550 R.D. Medh et al. / Genomics 81 (2003) 543–555
represent the totality of genes expressed in human lymphoidcells, it is an excellent starting point, because the genes onthis chip all represent identified full-length cDNAs. Clusteranalysis based on control expression levels placed C1-6closer to its sister clone C1-15 than to the inherently sensi-tive clone C7-14. These relationships change when onecarries out cluster analysis based on the genes that areinduced after adding Dex. Using that set only, C1-6 clustersmore closely to C7-14 than to C1-15.
A number of genes were induced in response to theglucocorticoid in at least two of three experiments in theresistant clone C1-15; however, in this clone few geneswere induced �2.5-fold in all three experiments. Initialexamination of the induced genes in C1-15 again showed noobvious anti-apoptotic genes. The substantial number ofgenes found frequently induced or repressed in clone C1-15indicates that the GR in these cells is capable of generegulation, although the genes regulated differ from those inthe apoptosis-sensitive clones. We have already shown thatfor a transfected, GR-driven gene in C1-15 cells, the level ofinduction is substantially enhanced by treatment with fors-kolin to activate the protein kinase A pathway [29]. It willbe interesting to study the effects of such treatment onC1-15 endogenous genes.
Because cluster analysis of C7-14 and C1-6 after treat-ment with Dex showed that C1-6 became more closelyclustered with C7-14, the other pro-apoptotic clone, wereasoned that the genes that led to apoptosis would have tobe very consistent in their induction. By applying morestringent criteria than those used in the cluster analyses, weidentified 39 genes that were induced �2.5-fold and 21genes that are suppressed �2-fold in both of the sensitiveclones. Obviously, using other criteria can produce addi-tional genes in both the induced and repressed categories.Our chosen criteria, however, make these initial limited setslikely to be at least some of the genes relevant to thebiological phenomenon of interest. By allowing the foldinduction in one of three experiments to fall below thearbitrary limit, we took into account the possibility of oneresult being randomly aberrant. Of course, for a gene to berequired for apoptosis, it would be expected to change inevery experiment. In fact, the genes identified all did so (seeResults). The variability cannot be attributed to GR mRNAfluctuations, because the chip data show that GR � and �mRNA levels essentially remained constant. It is intriguingthat many of the genes identified encode proteins involvedin regulatory pathways, plus pro- or anti-apoptotic func-tions. Additionally, among the glucocorticoid-inducedgenes are some contributing to structural integrity and mem-brane transport. Other induced genes include several thatencode for cellular structural proteins.
Among the interesting genes induced at 20 h, one isBim-EL, a pro-apoptotic member of the bcl2 family [30].The late increase in such genes may precipitate apoptosis.Another gene specifically induced by Dex in glucocorticoid-sensitive cells is the DSCR1 gene [31]. DSCR1 encodes
monocyte-enriched calcineurin interacting protein 1 (MCIP-1), which blocks calcineurin-dependent transcription [32].Another target of glucocorticoid-mediated induction spe-cific for glucocorticoid-sensitive cells is the gene encodingthe adenovirus E4 promoter-binding protein-4 (E4BP4/NFIL3A), a transcriptional repressor in the bZIP family oftranscription factors [33]. Also induced is inositol polyphos-phate-1-phosphatase, an enzyme of the phosphatidylinositolsignaling pathway that hydrolyzes the 1-phosphate frominositol triphosphate and inositol diphosphate. It has beenimplicated as an inhibitor of DNA synthesis [34]. Closerinvestigation of the Dex-mediated induction of the humanreceptor-like protein tyrosine phosphatase � [35] and theprotein tyrosine kinase interacting protein SOCS-1/TIP3[36] (Table 2) may shed light on the role of protein tyrosinephosphorylation in glucocorticoid-evoked lympholysis.Growth-regulatory genes induced by Dex include BTG1, anantiproliferative gene that arrests cells in G0/G1 phase ofthe cell cycle and induces apoptosis in NIH3T3 cells [37];Mad3, a c-Myc antagonist and hence pro-apoptotic in lym-phoid cells [38]; and BIRC-3/IAP-1 (Table 2), which hasbeen implicated as an anti-apoptotic factor [39]. This couldrepresent a cellular attempt to activate compensatory anti-apoptotic mechanisms. Similar to a recently published re-port [40], our microarray analysis also demonstrated glu-cocorticoid-mediated induction of the interleukin-7 (IL-7)receptor �. In addition, Dex induces a number of geneproducts whose functions are either unknown or not directlyapparent in glucocorticoid-mediated responses in lymphoidcells.
Among the repressed genes, we noted HRY, the humanhomolog of the Drosophila melanogaster gene hairy, whichplays a key role in development and cell proliferation [41].It contains a bHLH motif similar to c-myc, which also isrepressed. Recombination activation gene-1 (RAG1) en-codes a protein that regulates V(D)J recombination andimmunoglobulin and T-cell diversity and may be active inimmune cell survival [42].
As knowledge has grown regarding the ways by whichglucocorticoids, through the GR, regulate gene transcrip-tion, it has become obvious that there are several mecha-nisms. These include GR homodimers binding directly tospecific DNA response elements, GR-DNA interactionswith heterologous transcription factors at composite DNA-binding sites, and strictly heterologous interactions in whichthe GR is tethered to DNA indirectly. Composite sitescontain both a site for the heterologous factor and a 1/2GRE. In heterologous protein-protein interactions, the GRmay be tethered to DNA through the heterologous transcrip-tion factor or GR-factor interactions may prevent DNAbinding.
The genes regulated in our experiments provided anopportunity to examine promoters to see what types ofregulatory elements might be present in relevant genes.Each promoter/regulator region was examined up to �2.5kb upstream from the transcription start site. In 11 of the
551R.D. Medh et al. / Genomics 81 (2003) 543–555
promoters we identified a classic quasi-palindromic GRE; 5of those contained an additional 1/2 GRE. We found 4 of the11 in downregulated genes. Presumably in these, the nega-tive regulation was due to a dominant repressive effect ofother sites. In another 17 genes we noted at least one 1/2GRE. In the vicinity of both types of GREs were found sitesfor other transcription factors known to interact with theGR, including those for Oct1, AP-1, c/EBP, CREB, andNF�B. The remainder of the induced genes showed no GREin the 2.5-kb region examined. It may be that some of theinduced genes are stimulated as secondary events as a con-sequence of changes in other regulatory gene products. Thussome of the changes seen could be indirect and not primaryGR-mediated changes in transcription. For example, reliefof repression due to downregulation of a repressor genewould cause upregulation of the repressed gene. With re-spect to the negatively regulated genes’ promoters, wefound fewer GREs and neither of the negative GREs de-scribed for the pro-opiomelanocortin and prolactin genes.
Our microarray profiling generally correlates with pub-lished reports on known glucocorticoid-mediated effects onthe transcription of individual genes. Our results confirmearly observations that glucocorticoids modulate expressionof a finite set of genes, rather than causing generalizedtranscriptional changes [12–17]. Only a few reports of mi-croarray analyses of glucocorticoid-mediated gene regula-tion have been published: thus, detailed comparison of spe-cific glucocorticoid-regulated genes so identified is difficultbecause of the differences in cells tested, the timing of Dextreatment, and/or the specific gene probes contained withinthe different arrays used. Glucocorticoid treatment of pe-ripheral blood mononuclear cells showed an induction ofcytokines, scavenger and Toll-like receptors, with mixedeffects on apoptosis-related gene clusters [43]. In an attemptto segregate genes that cause growth arrest from those thatcause apoptosis, Tonko et al. [44] compared glucocorticoid-regulated gene expression profiles in proliferating versusG1/G0-arrested CEM-C7-H2 cells, a subclone from theoriginal glucocorticoid-sensitive CEM-C7 cells describedhere. Subsequently, the same laboratory obtained single-experiment data at early times after Dex addition to otherCEM and to GR-containing Jurkat cells [45]. In both stud-ies, single samples were taken at 2 or 3 and 8 h after theaddition of Dex. Time-matched controls were not obtained.As the authors remarked, it is difficult to be certain which,among the genes possibly regulated in those studies, arerandom occurrences. Nevertheless, we note that severalgenes seen as regulated in our data also appear to be regu-lated in their more limited data set taken at earlier timepoints. In sensitive cells these include AIM1, DSCR1, andIL-7 receptor (IL7R) � (induced); c-myc, HRY, and RAG1(repressed).
A death-associated protein kinase (DAP-kinase) familyreported in the literature to participate in apoptotic cascadesinitiated by interferon-�, tumor necrosis factor-� (TNF�),activated Fas, and detachment from extracellular matrix was
evaluated [46]. Our arrays showed that there was basalexpression of some family members but no regulation byDex or differential expression in sensitive versus resistantclones.
In sum, our results support our initial hypothesis that adistinctive set of glucocorticoid-regulated genes would befound in cells destined to undergo apoptosis. Our data alsosuggest that the resistant clone C1-15 does have an activeGR, but that a quite different gene set is regulated by it. Weinterpret this result as an indication that a regulatory switchhas shifted the entire pattern of responses. The data hereshould provide a basis of comparison for glucocorticoidgene-regulatory effects in other apoptotically inclined lym-phoid systems.
Materials and methods
Reagents
Dex and other reagent-grade chemicals were purchasedfrom Sigma-Aldrich Chemical Company (St. Louis, MO,USA). The RNeasy total RNA isolation kit was from Qia-gen (Santa Clara, CA, USA), T7-oligo (dT) promoter primerfrom Affymetrix (Santa Clara, CA, USA), and the BioArrayhigh yield RNA transcription labeling kit from Enzo Bio-chem (New York, NY, USA). The following reagents werepurchased from Invitrogen (Carlsbad, CA, USA): Super-Script II reverse transcriptase, dNTP mix, Escherichia coliDNA ligase, E. coli DNA polymerase I, RNase H, and T4DNA polymerase. The Zeta Probe GT genomic blottingmembrane for northern blots was from Bio-Rad (Richmond,CA, USA), the RediPrime II random primed DNA labelingsystem from Amersham-Pharmacia (Piscataway, NJ, USA),the �-[32P]dCTP from ICN (Irvine, CA, USA), andQuikHyb hybridization solution from Stratagene (La Jolla,CA, USA).
Cell culture
All CEM clones used in this study were cloned in 1996in semisolid agarose medium in the absence of any selectivepressure [47]. Thereafter, the cells were carefully main-tained in logarithmic growth in Cellgro RPMI 1640 tissueculture medium (Mediatech, Herndon, VA, USA) supple-mented with 5% FBS from Atlanta Biologicals (Norcross,GA, USA) at 37°C in a humidified 5% CO2, 95% airincubator.
RNA extraction
When cells had grown to a density of 4 � 105 cells/ml,they were treated with either ethanol vehicle (�1% finalconcentration) or 1 �M Dex in vehicle for 20 h. Approxi-mately 1 � 107 cells were harvested, washed once withchilled PBS, pH 7.4 (Cellgro) and resuspended in lysis
552 R.D. Medh et al. / Genomics 81 (2003) 543–555
buffer (RNeasy kit). The cell lysate was passed through aQIAshredder column (Qiagen) and processed for total RNAisolation as per the protocol provided (RNeasy kit). RNAsamples were stored at �70°C in ethanol until used foreither GeneChip analysis or northern hybridization. In eachexperiment an aliquot fraction of the culture was retainedand followed for growth and apoptosis. The full apoptoticeffect was seen in each experiment in the two sensitiveclones, whereas the C1-15 clone was entirely resistant.
Target labeling and hybridization
First-strand cDNA synthesis was done using 10–25 �gof total RNA, a T7-(dT)24 oligomer (5-GGCCAGTGAAT-TGTA ATACGACTCACTATAGGGAGGCGG-(dT)24-3)and SuperScript II reverse transcriptase (Life Technologies,Baltimore, MD, USA). Second-strand synthesis convertedthe cDNA into a double-stranded DNA template, which wassubjected to an in vitro transcription reaction using bacte-riophage T7 RNA polymerase. The cRNA or target RNAswere labeled with biotin during the in vitro transcriptionreaction, then fragmented to a mean size of 200 bases tofacilitate their hybridization to probe sequences of theHG_U95Av2 Affymetrix GeneChip Arrays. Each targetRNA sample was initially hybridized to a test array thatcontained a set of probes representing genes commonlyexpressed in a majority of human cells, for example, actin,transferrin receptor, transcription factor ISGF-3, 18S RNA,28S RNA, and Alu, to confirm the successful labeling of thetarget RNAs and prevent the use of degraded or nonrepre-sentative target RNA samples. Hybridization of GeneChiparrays was done at 45°C for 16 h in 0.1 M MES buffer, pH6.6, 1 M NaCl, 0.02 M EDTA, and 0.01% Tween 20detergent. Four prokaryotic genes (bioB, bioC, and bioDfrom the E. coli biotin synthesis pathway and cre the re-combinase gene from P bacteriophage) were added to thehybridization cocktail as internal controls. Arrays werewashed using both nonstringent (SSPE-Tween 20 deter-gents, 25°C) and stringent (1 M NaCl, 50°C) conditionsbefore staining with phycoerythrin-streptavidin (10 �g/mlfinal concentration). GeneChip arrays were scanned using aGene Array Scanner (Hewlett Packard, Palo Alto, CA,USA) and analyzed using the Affymetrix GeneChip Suite4.0 software.
Northern blotting
DNA fragments corresponding to the specified cDNAsequences were amplified from CEM-C7-14 cells treatedwith 1 �M Dex by RT-PCR using the following primers:BTG1 (361–751 bp, GenBank Accession No. X61123):sense, 5-CCGTGTCCTTCATCTCCAAG-3; antisense,5-CTGATTCGGCTGTCTACCAT-3; DSCR1 (266–659bp, GenBank Accession No. U85267): sense, 5-GGACAT-CACCTTTCAGTATT-3; antisense, 5-TTCCTCTTCT-TCCTCCTTCT-3; and E4BP4 (273–1,587 bp, GenBank
Accession No. X64318): sense, 5-CAATGTGGACAA-GATGATGGTC-3; antisense, 5-AGCAGAGATTGGTT-GTGTGG-3. The resulting PCR products were confirmedby sequencing and then were used as probes in northernhybridizations. A 245-bp (947–704 bp, GenBank AccessionNo. X00351) �-actin cDNA fragment from Ambion (Aus-tin, TX, USA; catalog no. 7424) was labeled to serve as aprobe for normalization between lanes. Total RNA (5 �g)from ethanol or 1 �M Dex-treated CEM-C7-14, CEM-C1-6, and CEM-C1-15 cells was separated on a 1.4% aga-rose gel under denaturing conditions (6% formaldehyde, 1�MOPS-EDTA buffer, pH 7.4, and 1 �g/ml ethidium bro-mide) for 16 h at 20 V. The resolved RNA was transferredon to ZetaProbe membrane by overnight capillary action,and the membrane was baked at 85°C in a vacuum ovenfor 45 min. For probe preparation, the appropriate gel-purified PCR products or DNA fragments were labeled with�[32P]dCTP using the Rediprime II random primed DNAlabeling system (Amersham Biosciences). The membranewas prehybridized in QuikHyb solution (Stratagene) for 1 hat 60°C. Approximately 1 � 107 c.p.m. of the appropriateradiolabeled DNA probe was boiled with salmon spermDNA (final concentration of 100 �g/ml), chilled on ice, andadded to the QuikHyb prehybridization solution. Hybridiza-tion was carried out for 3 h at 60°C. The hybridized mem-brane was washed once at room temperature with 2 � SSCand 0.1% SDS (w/v) for 15 min, and then washed succes-sively in 0.1% SSC (v/v) and 0.1% SDS for 30 min at 50,55, and 57°C. After hybridization, membranes werestripped and reprobed for actin. Each membrane wasscanned using the Molecular Dynamics Storm PhosphorIm-ager (Sunnyvale, CA, USA) and the bands quantitated on anAlpha Innotech Imager (San Leandro, CA, USA).
Data analysis
Three independent experiments were done within a spanof 1 year. In each, the ethanol- and Dex-treated samplesfrom every cell clone were assessed. The raw data wereobtained using Affymetrix software. Details regarding Af-fymetrix GeneChip design and the Affymetrix GeneChipSuite 4.0 algorithms can be obtained from the Affymetrixexpression analysis technical manual or their website(http://www.affymetrix.com). Initial data processing wasdone using the Affymetrix GeneChip Suite 4.0, which usesabsolute analysis algorithms to yield an average differencevalue for each of the 12,626 genes on the HG_U95Av2array. Analyses were conducted with the software packageGeneSpring (Silicon Genetics, Redwood City, CA, USA),version 4.2.1. Affymetrix 5.0 Pivotdata text files for controland treated chips were imported into GeneSpring and com-bined into single experiments for each replicate. For eachindividual experiment, control and treated chip were nor-malized together using the 50th percentile distribution of allgenes.
553R.D. Medh et al. / Genomics 81 (2003) 543–555

Creating significant gene lists
To determine the genes regulated by Dex, the signals onchips receiving the products derived from Dex-treated cellswere filtered to find the 5,000–6,000 genes called“present,” and all other genes were dismissed for that par-ticular experiment. All present genes were then compared totheir counterparts on the control chips to find those thatwere induced at least 2.5-fold or suppressed at least 2.0-fold. These lists were then compared to elucidate thosegenes induced or suppressed in at least two out of the threeexperiments. Genes regulated by Dex in each of the threeclones were compared with the results expressed by Venndiagrams and lists of specific genes. Differences in basalgene expression were studied using Significant Analysis ofMicroarrays software (Stanford University, Stanford, CA,USA). An unpaired Student’s t-test was used to determinegenes that were significantly different for one group toanother, keeping the false discovery rate below 1%.
DNA-binding site analysis
Using the program BLASTN, GenBank sequences forthe genes identified in Table 2 were compared to the CeleraDiscovery System database to obtain their genomic se-quences. From these, �2.5 kb upstream of the presumptivetranscription initiation site was saved for each gene. Thesequence was then explored for possible transcription factorsites, using Match version 1.5 within the TRANSFAC Pro-fessional 6.2 database, which contains a library of mononu-cleotide weight matrices. Only high-quality matrices (pre-determined on the TRANSFAC database) were used in oursearch. Matrices for GRE and other transcription factors thatare known to bind GR (i.e., NF�B, CREB, AP-1, Oct1, andc/EBP) were employed to search the sequences using auser-defined 0.80 as the cutoff for core and matrix simi-larity.
Clustering
All replicate chips were merged into single experiments.Consolidated control and treated experiments were com-pared using a Welch-ANOVA to reveal any significantgenes (P � 0.05). The significant genes list was used as afilter to cluster individual experiments using a variety ofdifferent algorithms.
Acknowledgments
The authors thank GopalRao V.M. Velagaletia and thestaff of the Cytogenetics Laboratory at UTMB for karyo-typing the clones used in this study. We also wish to rec-ognize the contribution of Michelle Guigneaux of the DNARecombinant Laboratory at UTMB for technical assistancein the microarray analyses.
References
[1] T.F. Dougherty, A. White, Functional alterations in lymphoid tissueinduced by adrenal cortical secretion, Am. J. Anat. 77 (1945) 81–116.
[2] P.S. Gaynon, A.L. Carrel, Glucocorticosteroid therapy in childhoodacute lymphoblastic leukemia, Adv. Exp. Med. Biol. 457 (1999)593–605.
[3] R.W. Blewitt, A.C. Abbott, C.C. Bird, Mode of cell death induced inhuman lymphoid cells by high and low doses of glucocorticoid, Br. J.Cancer 47 (1983) 477–486.
[4] A.H. Wyllie, R.G. Morris, A.L Smith, D. Dunlop, Chromatin cleav-age in apoptosis: association with condensed chromatin morphologyand dependence on macromolecular synthesis, J. Pathol. 142 (1984)67–77.
[5] E.B. Thompson, Glucocorticoids and oxysterols in lymphoid apopto-sis, in: B.W. O’Malley (Ed.), Hormones and Signaling, Vol. 1, Ac-ademic Press, San Diego, CA, 1998, pp. 1–40.
[6] M.M. Compton, J.S. Haskil, J.A. Cidlowski, Analysis of glucocorti-coid actions on rat thymocyte deoxyribonucleic acid by fluorescence-activated flow cytometry, Endocrinology 122 (1988) 2158–2164.
[7] N. Bansel, A. Houle, G. Melnykovych, Apoptosis: mode of cell deathinduced in T-cell leukemia lines by dexamethasone and other agents,FASEB J. 5 (1991) 211–216.
[8] A.C. Wood, C.M. Waters, A. Garner, J.A. Hickman, Changes inc-myc expression and the kinetics of dexamethasone-induced pro-grammed cell death (apoptosis) in human lymphoid leukemic cells,Br. J. Cancer 69 (1994) 663–669.
[9] M. Perrin-Wolff, J. Bertoglio, B. Bressac, C. Bohuon, M. Pallardy,Structure-activity relationships in glucocorticoid-induced apoptosis inT lymphocytes, Biochem. Pharmacol. 50 (1995) 103–110.
[10] J. Ramdas, J.M. Harmon, Glucocorticoid-induced apoptosis and reg-ulation of NFkB activity in human leukemic T cells, Endocrinology139 (1998) 3813–3821.
[11] L. Aravind, V.M. Dixit, E.V. Koonin, Apoptotic molecular machin-ery: vastly increased complexity in vertebrates revealed by genomecomparisons, Science 291 (2001) 1279–1290.
[12] M.M. Briehl, F.A. Flomerfelt, X.P. Wu, R.L. Miesfeld, Transcrip-tional analyses of steroid-regulated gene networks, Mol. Endocrinol.4 (1990) 287–294.
[13] M.T. Harrigan, G. Baughman, N.F. Campbell, S. Bourgeois, Isolationand characterization of glucocorticoid- and cyclic AMP-inducedgenes in T lymphocytes, Mol. Cell Biol. 9 (1989) 3438–3446.
[14] Y.S. Yuh, E.B. Thompson, Glucocorticoid effect on oncogene/growthgene expression in human T-lymphoblastic leukemic cell line CCRF-CEM: specific c-myc RNA suppression by dexamethasone, J. Biol.Chem. 264 (1989) 10904–10910.
[15] M.T. Harrigan, N.F. Campbell, S. Bourgeois, Identification of a geneinduced by glucocorticoids in murine T-cells: a potential G protein-coupled receptor, Mol. Endocrinol. 5 (1991) 1331–1338.
[16] G. Baughman, M.T. Harrigan, N.F. Campbell, S.J. Nurrish, S. Bour-geois, Genes newly identified as regulated by glucocorticoids inmurine thymocytes, Mol. Endocrinol. 5 (1991) 637–644.
[17] M.S. Chapman, et al., Isolation of differentially expressed sequencetags from steroid-responsive cells using mRNA differential display,Mol. Cell Endocrinol. 108 (1995) R1–R7.
[18] G.E. Foley, et al., Continuous culture of human lymphoblasts fromperipheral blood of a child with acute leukemia, Cancer Res 8 (1965)522–529.
[19] A.L. Howell, E.R. Richie, Phenotypic drift and clonal variation indifferentiation antigen expression on AKR T-cell lymphoma linesgrown in vitro, Nat. Immun. Cell Growth Regul. 3 (1983) 143–154.
[20] M.C. Leglise, G.A. Dent, L.H. Ayscue, D.W. Ross, Leukemic cellmaturation: a review, Blood Cells 13 (1988) 319–337.
[21] I. Leger, M. Thomas, X. Ronot, G. Brugal, Detection of chromosome1 aberrations by fluorescent in situ hybridization (FISH) in the humanbreast cancer cell line MCF-7, Anal. Cell. Pathol. 5 (1993) 299–309.
554 R.D. Medh et al. / Genomics 81 (2003) 543–555
[22] M.R. Norman, E.B. Thompson, Characterization of a glucocorticoid-sensitive human lymphoid cell line, Cancer Res. 37 (1977) 3785–3791.
[23] J.M. Harmon, E.B. Thompson, Isolation and characterization of dex-amethasone-resistant mutants from human lymphoid cell line CEM-C7, Mol. Cell Biol. 1 (1981) 512–521.
[24] J.M. Harmon, E.B. Thompson, K.A. Baione, Analysis of glucocorti-coid-resistant human leukemic cells by somatic cell hybridization,Cancer Res. 45 (1985) 1587–1593.
[25] A.L. Miller, B.H. Johnson, R.D. Medh, C.M. Townsend, E.B.Thompson, Glucocorticoids and polyamine inhibitors synergize tokill human leukemic CEM cells, Neoplasia 4 (2002) 68–81.
[26] M. Beato, G. Chalepakis, M. Schauer, E.P. Slater, DNA regulatoryelements for steroid hormones, J. Steroid Biochem. 32 (1989) 737–748.
[27] J. Drouin, et al., Glucocorticoid receptor binding to a specific DNAsequence is required for hormone-dependent repression of pro-opi-omelanocortin gene transcription, Mol. Cell. Biol. 9 (1989) 5305–5314.
[28] N. Subramaniam, W. Cairns, S. Okret, Studies on the mechanism ofglucocorticoid-mediated repression from a negative glucocorticoidresponse element from the bovine prolactin gene, DNA Cell. Biol. 16(1997) 153–163.
[29] R.D. Medh, M.F. Saeed, B.H. Johnson, E.B. Thompson, Resistanceof human leukemic CEM-C1 cells is overcome by synergism betweenglucocorticoid and protein kinase A pathways: correlation with c-Myc suppression, Cancer Res. 58 (1998) 3684–3693.
[30] L. O’Connor, et al., Bim: a novel member of the Bcl-2 family thatpromotes apoptosis, EMBO J. 17 (1998) 384–395.
[31] J.J. Fuentes, et al., A new human gene from the Down syndromecritical region encodes a proline-rich protein highly expressed in fetalbrain and heart, Hum. Mol. Genet. 4 (1995) 1935–1944.
[32] B. Rothermel, et al., A protein encoded within the Down syndromecritical region is enriched in striated muscles and inhibits calcineurinsignaling, J. Biol. Chem. 275 (2000) 8719–8725.
[33] I.G. Cowell, A. Skinner, H.C. Hurst, Transcriptional repression by anovel member of the bZIP family of transcription factors, Mol. Cell.Biol. 12 (1992) 3070–3077.
[34] E.A. Woodcock, et al., Inositol polyphosphate 1-phosphatase is anovel antihypertrophic factor, J. Biol. Chem. 277 (2002) 22734–22742.
[35] M.F. Gebbink, et al., Cloning, expression and chromosomal localiza-tion of a new putative receptor-like protein tyrosine phosphatase,FEBS Lett. 290 (1991) 123–130.
[36] K. Ohya, et al., SOCS-1/JAB/SSI-1 can bind to and suppress Tecprotein-tyrosine kinase, J. Biol. Chem. 272 (1997) 27178–27182.
[37] S. Matsuda, J. Rouault, J. Magaud, C. Berthet, In search of a functionfor the TIS21/PC3/BTG1/TOB family, FEBS Lett. 497 (2001) 67–72.
[38] S. Haskill, et al., Characterization of an immediate-early gene in-duced in adherent monocytes that encodes I �B-like activity, Cell 65(1991) 1281–1289.
[39] P. Liston, et al., Suppression of apoptosis in mammalian cells byNAIP and a related family of IAP genes, Nature 379 (1996) 349–353.
[40] D. Franchimont, et al., Positive effects of glucocorticoids on T cellfunction by up-regulation of IL-7 receptor �, J. Immunol. 168 (2002)2212–2218.
[41] J.M. Feder, L. Li, L.Y. Jan, Y.N. Jan, Genomic cloning and chromo-somal localization of HRY, the human homolog to the Drosophilasegmentation gene, hairy, Genomics 20 (1994) 56–61.
[42] F.W. Alt, G. Rathbun, E. Oltz, G. Taccioli, Y. Shinkai, Function andcontrol of recombination-activating gene activity, Ann. NY Acad.Sci. 651 (1992) 277–294.
[43] J. Galon, et al., Gene profiling reveals unknown enhancing andsuppressive actions of glucocorticoids on immune cells, FASEB J. 16(2002) 61–71.
[44] M. Tonko, M.J. Ausserlechner, D. Bernhard, A. Helmberg, R. Kofler,Gene expression profiles of proliferating vs. G1/G0 arrested humanleukemia cells suggest a mechanism for glucocorticoid-induced apo-ptosis, FASEB J. 15 (2001) 693–699.
[45] P. Obexer, U. Certa, R. Kofler, A. Helmberg, Expression profiling ofglucocorticoid-treated T-ALL cell lines: rapid repression of multiplegenes involved in RNA-, protein-, and nucleotide synthesis, Onco-gene. 20 (2001) 4324–4336.
[46] G. Shohat, et al., The pro-apoptotic function of death-associatedprotein kinase is controlled by a unique inhibitory autophosphoryla-tion-based mechanism, J. Biol. Chem. 276 (2001) 47460–47467.
[47] H.S. Juneja, W.H. Harvey, W.K. Brasher, E.B. Thompson, Successfulin vitro purging of leukemic blasts from marrow by Cortivazol, apyrazolosteroid: a preclinical study for autologous transplantation inacute lymphoblastic leukemia and non-Hodgkin’s lymphoma, Leu-kemia 9 (1995) 1771–1778.
555R.D. Medh et al. / Genomics 81 (2003) 543–555