
Gene expression in the intertidal mussel Mytilus … expression in the intertidal mussel Mytilus...
14
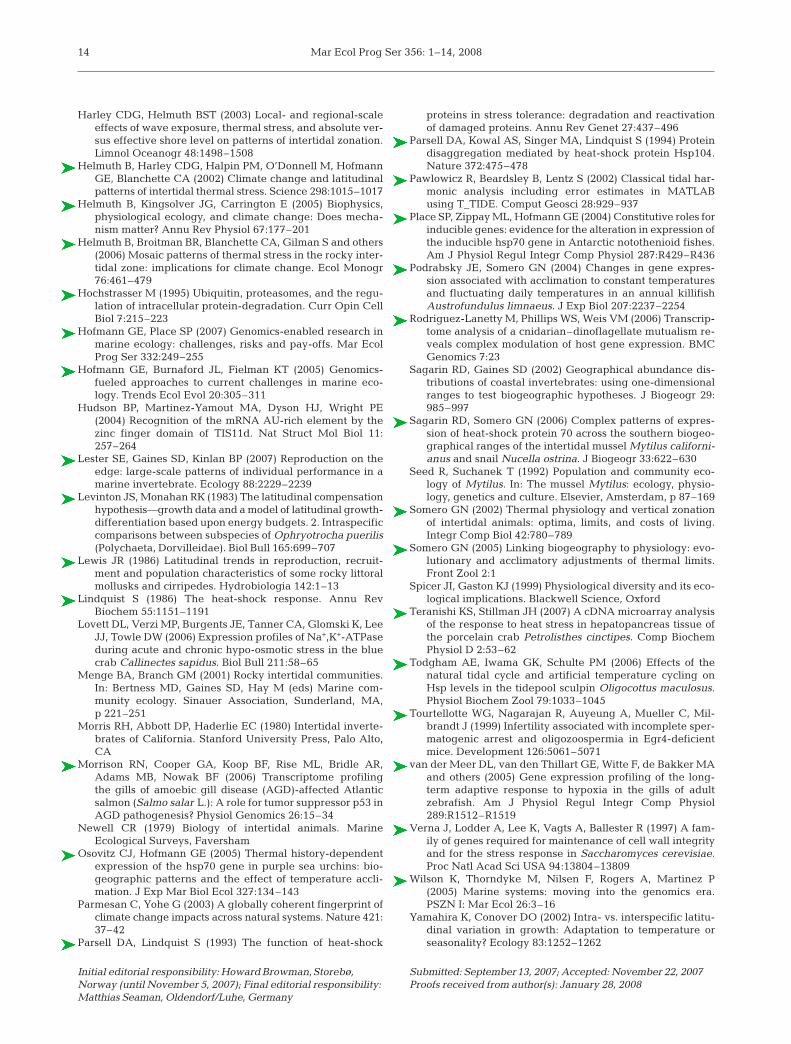
MARINE ECOLOGY PROGRESS SERIES Mar Ecol Prog Ser Vol. 356: 1–14, 2008 doi: 10.3354/meps07354 Published March 18 INTRODUCTION Understanding the mechanisms that set species’ range limits has long been a focus of ecological study in marine ecosystems (Spicer & Gaston 1999). Given the expected alterations in species distributions and abun- dances that will be driven by climate change-related factors (Parmesan & Yohe 2003), the need to under- stand these factors and to identify the physiological plasticity of organisms across their entire range has emerged as an urgent research need. Entering into this © Inter-Research 2008 · www.int-res.com *Corresponding author. Email: [email protected] FEATURE ARTICLE Gene expression in the intertidal mussel Mytilus californianus : physiological response to environmental factors on a biogeographic scale Sean P. Place, Michael J. O’Donnell, Gretchen E. Hofmann* Department of Ecology, Evolution and Marine Biology, University of California Santa Barbara, Santa Barbara, California 93106-9610, USA ABSTRACT: We used a cDNA microarray to profile gene expression in the intertidal mussel Mytilus cali- fornianus across major portions of its biogeographic range. Overall, the expression pattern for the major- ity of genes assessed in this study varied significantly as a function of collection site and provides support for the hypothesis that the physiological response to emersion is distinct across populations of M. califor- nianus. Gill tissue was dissected from adult, field- acclimatized M. californianus collected from 4 sites across 17° of latitude along the west coast of North America. First-strand cDNA prepared from 5 biologi- cal replicates from each site were competitively hybridized to a 2496 feature cDNA microarray. Gene expression patterns in mussels from Strawberry Hill, Oregon, displayed a unique expression pheno- type that was distinct from the other 3 mussel popu- lations sampled. In contrast, mussels sampled from Bamfield, British Columbia, and Jalama Beach, Cali- fornia, showed similar expression patterns. These data suggest that the physiological response of M. californianus to abiotic factors, such as temperature, cannot be predicted by a simple latitudinal gradient. This study highlights the usefulness of genomics- based approaches in assessing physiological re- sponses to environmental variation across large spa- tial scales. KEY WORDS: Environmental genomics · Mytilus cali- fornianus · DNA microarray · Biogeography · Gene expression · Species range · Intertidal invertebrates · Mussel Resale or republication not permitted without written consent of the publisher Gaping mussels in the intertidal zone at Strawberry Hill, Ore- gon, USA, a suspected ecological hotspot with high tempera- ture stress for mussels during summer emersion. Photo: Gretchen E. Hofmann OPEN PEN ACCESS CCESS
Transcript of Gene expression in the intertidal mussel Mytilus … expression in the intertidal mussel Mytilus...
MARINE ECOLOGY PROGRESS SERIESMar Ecol Prog Ser
Vol. 356: 1–14, 2008doi: 10.3354/meps07354
Published March 18
INTRODUCTION
Understanding the mechanisms that set species’range limits has long been a focus of ecological study inmarine ecosystems (Spicer & Gaston 1999). Given theexpected alterations in species distributions and abun-dances that will be driven by climate change-relatedfactors (Parmesan & Yohe 2003), the need to under-stand these factors and to identify the physiologicalplasticity of organisms across their entire range hasemerged as an urgent research need. Entering into this
© Inter-Research 2008 · www.int-res.com*Corresponding author. Email: [email protected]
FEATURE ARTICLE
Gene expression in the intertidal musselMytilus californianus: physiological response toenvironmental factors on a biogeographic scale
Sean P. Place, Michael J. O’Donnell, Gretchen E. Hofmann*
Department of Ecology, Evolution and Marine Biology, University of California Santa Barbara, Santa Barbara, California 93106-9610, USA
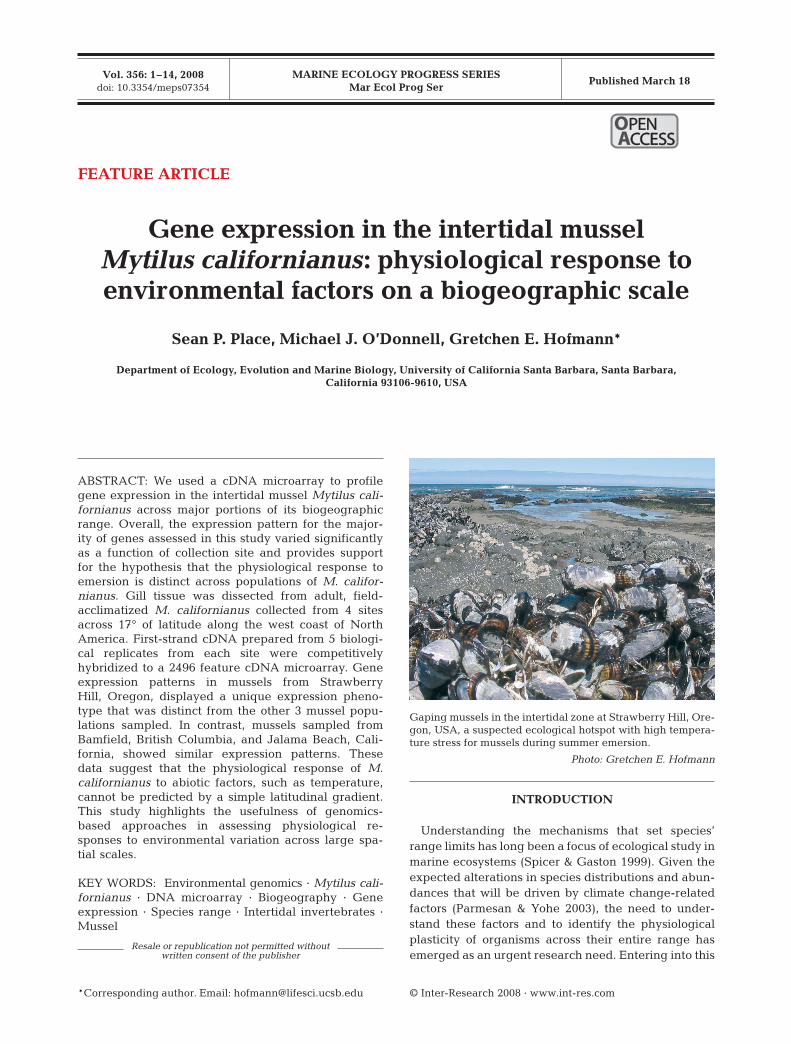
ABSTRACT: We used a cDNA microarray to profilegene expression in the intertidal mussel Mytilus cali-fornianus across major portions of its biogeographicrange. Overall, the expression pattern for the major-ity of genes assessed in this study varied significantlyas a function of collection site and provides supportfor the hypothesis that the physiological response toemersion is distinct across populations of M. califor-nianus. Gill tissue was dissected from adult, field-acclimatized M. californianus collected from 4 sitesacross 17° of latitude along the west coast of NorthAmerica. First-strand cDNA prepared from 5 biologi-cal replicates from each site were competitivelyhybridized to a 2496 feature cDNA microarray. Geneexpression patterns in mussels from StrawberryHill, Oregon, displayed a unique expression pheno-type that was distinct from the other 3 mussel popu-lations sampled. In contrast, mussels sampled fromBamfield, British Columbia, and Jalama Beach, Cali-fornia, showed similar expression patterns. Thesedata suggest that the physiological response of M.californianus to abiotic factors, such as temperature,cannot be predicted by a simple latitudinal gradient.This study highlights the usefulness of genomics-based approaches in assessing physiological re-sponses to environmental variation across large spa-tial scales.
KEY WORDS: Environmental genomics · Mytilus cali-fornianus · DNA microarray · Biogeography · Geneexpression · Species range · Intertidal invertebrates ·Mussel
Resale or republication not permitted without written consent of the publisher
Gaping mussels in the intertidal zone at Strawberry Hill, Ore-gon, USA, a suspected ecological hotspot with high tempera-ture stress for mussels during summer emersion.
Photo: Gretchen E. Hofmann
OPENPEN ACCESSCCESS
Mar Ecol Prog Ser 356: 1–14, 2008
endeavor, physiological ecologists bring to these ques-tions an assortment of tools to understand relevantperformance variation at scales smaller than the wholeorganism. Recently, genomics-based approaches haveallowed a unique view into the mechanisms underlyingsuites of ecological processes. Notably, transcriptomics—the measurement of all mRNAs in a biological sample—is quickly emerging in marine ecology, enhancing ourunderstanding of many important ecological and phys-iological processes in marine systems (for reviews seeHofmann et al. 2005, Wilson et al. 2005, Dupont etal. 2007, Hofmann & Place 2007). The ability to profilethe expression patterns of numerous genes at once isexpanding investigations into ecological processesranging from the mechanisms that maintain coral/algalsymbioses (Rodriguez-Lanetty et al. 2006) to under-standing mechanisms underlying physiological toler-ances (Podrabsky & Somero 2004, Buckley et al. 2006,Teranishi & Stillman 2007) or for detection of diseasein commercially important species (Dhar et al. 2003,Cunningham et al. 2006, Morrison et al. 2006).
Here, we present a study that integrates genomics,physiology, and marine ecology to explore the geneexpression patterns in the mussel Mytilus californianuson a macroecological scale across the biogeographicalrange of this important intertidal species. Physiologicalecologists have often sought to link the internal pro-cesses of organisms with environmental factors con-trolling those processes in order to understand thebroader distributions of populations and species. Thebulk of such work has, until recently, been accom-plished using small spatial scales, often involving labo-ratory manipulations of a single environmental stressor(e.g. Bertness et al. 1999, Somero 2002, Harley &Helmuth 2003). Additionally, of the studies that haveexamined physiological performance across largescales, most have employed relatively basic proxiessuch as RNA:DNA ratios (Byers 2005), growth rates(Levinton & Monahan 1983, Yamahira & Conover2002), or reproductive output (Lewis 1986, Lester et al.2007). Although such work has led to great advancesin our understanding of how individuals perform inresponse to specific environmental conditions, the nextchallenge is to enhance understanding of the impact ofmultiple environmental parameters on physiologicalperformance of populations across large spatial scales.To this end, we have taken initial steps to investigatenatural variation in acclimatization responses of inter-tidal mussels by assessing their transcriptome—the setof all mRNAs in a given cell population—at a specificwindow in time. One can argue that if regulationof mRNA expression confers phenotypic variation,we would expect this variation in expression to bereflected within distinct populations of species inhabit-ing highly variable environments. For this purpose,
Mytilus californianus provides a unique non-modelsystem for these investigations. M. californianus hasbeen especially well studied, both in terms of its ther-mal physiology and its role in structuring intertidalcommunities (reviewed in Menge & Branch 2001). Fur-thermore, one of the most well-studied parametersstructuring these communities is that of the tempera-ture profile experienced by these organisms duringdaily cycling of aerial emersion. Interestingly, the pat-tern of variation experienced by these organisms is notpredictable by a simple latitudinal cline, and thus itbecomes more important to examine organismal func-tion on a genome-wide scale.
Temperature patterns measured along the intertidalzone of the Pacific coast, in addition to mussel bodytemperature models developed by Helmuth and col-leagues, indicate that populations of Mytilus califor-nianus should have very different physiological re-sponses along the latitudinal distribution of this species(Helmuth et al. 2002, 2006). More importantly, it hasbeen suggested that these responses should not varylinearly with latitude, but should exhibit a more com-plex pattern governed by the timing of low tides, withstress responses more evident at sites in Washingtonand Oregon than at sites located further south duringearly summer months (Helmuth et al. 2002, 2006). Byexamining the natural expression state of mussel pop-ulations from sites with known thermal variation, wecan predict that a strong thermal acclimatization im-print will be seen for stress responsive pathways atspecific latitudes based on previous body temperaturemeasurements (Helmuth et al. 2002, 2006) and bio-chemical indicators of stress (Sagarin & Somero 2006).Additionally, genome-wide analyses of M. californianuspopulations may highlight the interplay of multiplephysiological responses outside of the predicted ther-mal response. For instance, if mussel populations inOregon are indeed more thermally stressed than otherpopulations, we would predict greater energy alloca-tion to processes involved in maintaining protein home-ostasis for these individuals. Conversely, we would alsopredict to see evidence for a reduction of energeticallycostly processes associated with growth, proliferation,and gametogenesis in individuals from this particularpopulation. On the other hand, since the samples wereobtained during low tide, we might also predict to seea similar depression in metabolic and aerobic capa-city across all sites, since mussels enter a quiescentstate during emersion events. Thus, from a broaderperspective, this approach could potentially yield a‘transcriptome fingerprint’ of the mechanisms drivingbiogeographic patterning for a particular location.
In the present paper we describe the application of anewly constructed cDNA microarray for Mytilus cali-fornianus to explore a range of physiological pathways
2
Place et al.: Gene expression profiling in Mytilus californianus
in an effort to assess the usefulness of large-scalegene expression screening in addressing major macro-ecological questions. Using a combination of geneexpression profiling and quantitative PCR, we providesupport for the hypothesis that the physiologicalresponse of M. californianus does not vary linearly as afunction of latitude and that individuals sampled fromthe Oregon population show distinct changes inseveral physiological pathways. These results give thefirst look at variations in gene expression betweenorganisms spread over 17° of latitude along the westcoast of North America and provide a proof of the con-cept for the application of genomics techniques toassist in the understanding of complex, large-scaleecological questions.
MATERIALS AND METHODS
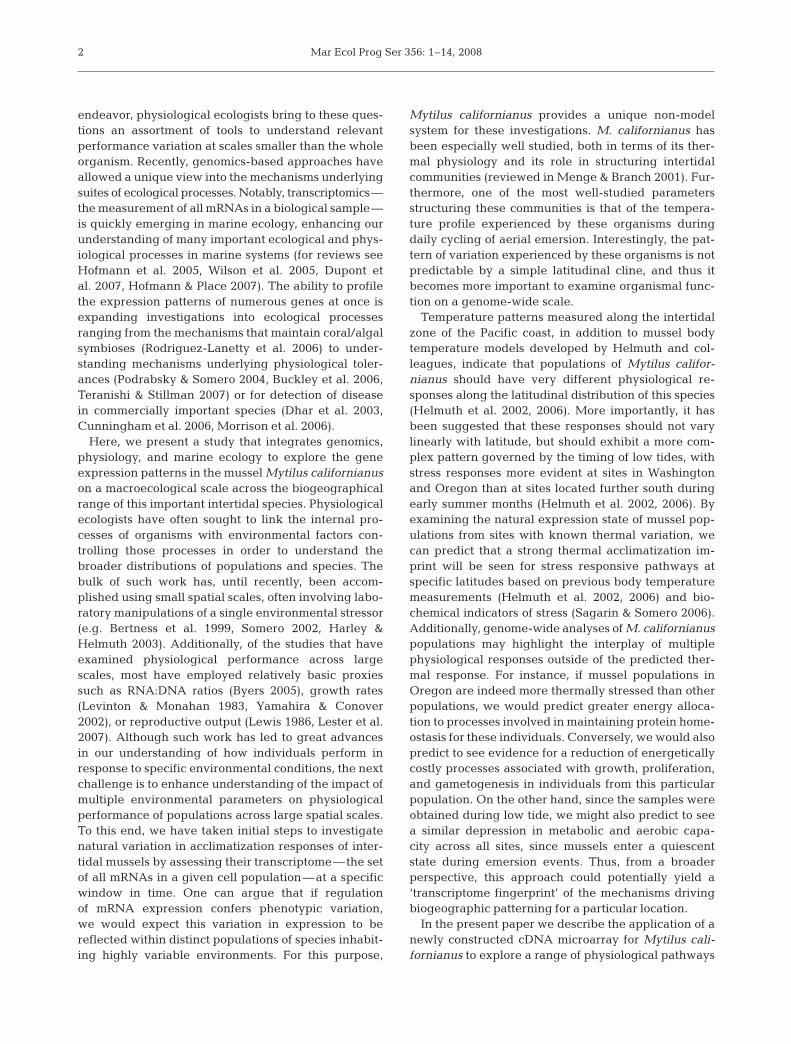
Sample collection. Samples of Mytilus californianuswere collected from 4 sites along the west coast ofNorth America during the same low-tide series thatoccurred from 6 to 15 July 2006. Sampling sites areshown in Fig. 1, and their coordinates are listed inTable 1. At each sampling location, the vertical extentof the mid-intertidal zone was estimated visually, and12 ind. with minimum/maximum shell lengths of 40 to60 mm were randomly chosen from the center of adense mussel bed. Due to the field resources requiredto sample so many sites simultaneously, we were notable to survey the actual tidal heights of our samplinglocations. Individuals sampled were separated by adistance of 1 m. Approximately 200 mg of mussel gillwas immediately dissected out and placed in 1 ml ofRNAlater (Ambion) and treated according to themanufacturer’s protocol. Briefly, samples were held at4°C while being transported to our home institution inSanta Barbara, CA, where they were then removedfrom the RNAlater and stored at –80°C until used foranalysis.
RNA extraction. Total RNA from approximately100 mg of frozen tissue was extracted using TRIzol(Invitrogen) following the manufacturer’s recommen-dations. Following isolation of total RNA, the RNA wasfurther cleaned by resuspending it in 0.1 ml of diethylprocarbonate (DEPC)-treated water and adding 0.3 mlof 6 M guanidine HCl and 0.2 ml of 100% ethylalcohol(EtOH). The entire volume was loaded onto a spin col-umn (Ambion) and centrifuged for 1 min at 12 000 × gat 4°C. Flow-through was discarded, and filters werewashed twice with 0.2 ml 80% EtOH. RNA was elutedoff of the filters twice with 0.1 ml of DEPC-treatedwater. RNA was precipitated by the addition of 0.1 volof 3 M sodium acetate (pH 5.0) and 2.5 vol of 100%EtOH, mixed by inversion of tubes and placed at –80°C
for 1 h. After this period, tubes were centrifuged at12 000 × g for 20 min at 4°C. Pellets were washed twicewith 80% EtOH and resuspended in 30 µl of DEPC-treated water. Final RNA concentrations were de-termined using a ND-1000 UV/visible spectrometer(NanoDrop Technologies). Only RNA samples with a260:280 ratio of ≥ 1.9 were used for this analysis.
Gene expression profiling with cDNA microarrays.Microarray analysis was performed utilizing a 2496feature cDNA array constructed from a cDNA librarydeveloped in the laboratory of George N. Somero atthe Hopkins Marine Station of Stanford University.Briefly, the cDNA library was prepared from differenttissues (gill, adductor muscle, and mantle) of adultMytilus californianus individuals exposed to a varietyof stressors (heat, cold, emersion, hypoxia, hypo-osmolality, cadmium, and low pH) to induce enrich-ment of the mRNA pool for as many stress-responsivegenes as possible (Gracey & Somero unpubl. data).The data discussed in the present paper have beendeposited in the National Center for BiotechnolgyInformation (NCBI) Gene Expression Omnibus (GEO;
3
Fig. 1. Collection sites (d) and abbreviations for the presentstudy. Punta San Isidro, Mexico: Baja-MX; Jalama Beach,California: JB-CA; Strawberry Hill, Oregon: SH-OR;
Bamfield, British Columbia: Bamf-BC
Mar Ecol Prog Ser 356: 1–14, 2008
www.ncbi.nlm.nih.gov/geo/) and are accessible throughGEO Series Accession Number GSE8935.
For the competitive hybridizations, total RNA wasextracted as previously described from the gill tissueof 10 ind. collected from a site in California not used inthe present study, which were laboratory-acclimatedat 13°C for 3 wk, but otherwise untreated, and werepooled for use as a source of reference RNA. It wasagainst this reference sample that the values from thefield-acclimatized samples were initially normalized(see Podrabsky & Somero 2004, Buckley et al. 2006).Ten micrograms of total RNA from 5 ind. at each sitewas reverse transcribed (RT) to cDNA, using anchoredoligo(dT15) primers and amino-allyl dUTP. The RNAtemplate was removed from the RT reactions by incu-bating at 70°C for 15 min in 0.2 mM NaOH and 0.1 mMEDTA. Single-stranded cDNA was EtOH precipitatedat –20°C for 1 h, washed once with 70% EtOH, andre-suspended in 10 µl of 100 mM sodium bicarbonate(pH 9.0). Each sample was labeled with either Cy3(reference samples) or Cy5 (experimental) cyaninemonoreactive dye (GE Healthcare), prepared in 100 µlof dimethylsulfoxide (DMSO). cDNA was incubatedwith 5 µl of either Cy3 or Cy5 for 1 h at room tem-perature in the dark. The fluorescently labeledcDNAs were cleaned by passing over PCR purificationcolumns (Qiagen) and eluted in 33 µl of dH2O. Sampleswere brought to a final volume of 45 µl in 25 mMHepes, 0.75 mg ml–1 tRNA (Sigma), 3 × saline sodiumcitrate (SSC), and 0.2% sodium dodecyl sulphate(SDS). Samples were boiled for 1 min, allowed to coolto room temperature, and then applied to microarrayslides. Hybridizations were conducted for 18 h at 65°Cin hybridization chambers (Genetix). After hybridiza-tion, slides were washed gently by immersion in 1×SSC and 0.1% SDS for 10 min at 45°C with gentle agi-tation to remove unbound dye. Slides were thenwashed gently in 0.1× SSC for 10 min at room temper-ature, dipped 5 times in 0.06 × SSC wash solution, anddried by centrifugation at 600 rpm for 5 min. The slideswere scanned on an AXON GenePix 4000B microarrayscanner (Axon Instruments, Molecular Devices). Fur-thermore, dye swap analysis was performed for eachsample used in this analysis to assess possible dyeaffects that could bias the analysis. Microarray data
from the 40 arrays used in this experiment wereextracted using GenePix Pro 4.0 software and the ratioof Cy5 to Cy3 fluorescence was quantified for eachspot on the arrays (Axon Instruments).
Normalization and statistical analysis of microarraydata. For each array, spatial- and intensity-basedtrends in the data were removed by Lowess normaliza-tion using Acuity 4.0 software. One-way ANOVA wasused to identify genes for which the inter-individualvariation within a collection site did not differ by >2 SDof the median fluorescence ratio (n = 10 arrays). Inaddition, only those genes that displayed a signal tonoise ratio (SNR) of ≥ 3 and displayed at least a 2-foldchange in expression levels relative to the median logratio (635:532) of laboratory-acclimated reference sam-ples were included in the analysis. The 2-fold changein expression as a threshold for consideration is a con-servative convention employed in many transcript-profiling studies (Gracey et al. 2001, Podrabsky &Somero 2004, van der Meer et al. 2005, Buckley et al.2006). To directly compare the ratio of fluorescentintensity of sites to each other and not a reference pool,the median log ratios (635:532) of fluorescence intensi-ties for each site were then normalized against a singleexperimental site (SH-OR). This method of normaliz-ing fluorescence values in spatial experiments is simi-lar to that used for time-course experiments in whichreference samples are employed (see Podrabsky &Somero 2004, Buckley et al. 2006). Lastly, principalcomponent analysis (PCA) was performed using theAcuity 4.0 software to determine the cumulative sepa-ration between sites as a function of the numerousgene level responses. Since trends are easier to see in2-dimensional representations, only component load-ings for the first 2 principal components were used inplot ordination.
Quantitative PCR. To validate the microarray results,we performed targeted quantitative, real-time poly-merase chain reaction (qPCR), a method which pro-vides a highly sensitive and quantified measure of theexpression levels of the mRNA of interest. We mea-sured the expression levels of the constitutive heatshock protein hsc71 and the inducible form hsp70, 2genes commonly employed in studies assessing ther-mal stress in intertidal organisms. We chose to use
4
Table 1. Mytilus californianus. Field-acclimatized gill tissue from M. californianus was collected at 4 sites spanning 17 degrees of latitude along the west coast of North America
Abbreviation Site Latitude Longitude
Baja-MX Punta San Isidro, Mexico 31° 17’ N 116° 24’ WJB-CA Jalama Beach, Santa Barbara, CA 34° 29’ N 120° 29’ WSH-OR Strawberry Hill, OR 44° 15’ N 124° 7’ W0Bamf-BC Bamfield, BC, Canada 48° 49’ N 125° 09’ W
Place et al.: Gene expression profiling in Mytilus californianus
these 2 particular genes due to the wealth of informa-tion on the physiological response of these genes inmussels. In addition, including hsp70 in the qPCRallowed us to verify that the response being measuredwas not a result of a recent stressful insult; the rem-nants of which would be evident in this highly sensi-tive assay. Expression levels of these genes were nor-malized to a ‘house keeping’ gene, elf-α, to correct forloading error and uniformity of the RT reaction. Briefly,100 ng of total RNA was reverse transcribed using aStrataScript cDNA synthesis kit with oligo dT primers(Stratagene) following the manufacturer’s protocol.Quantitative real-time PCR reactions were performedwith 2 µl of cDNA synthesis product in 20 µl SYBRgreen supermix (Bio-Rad). The PCR was run for 40cycles with the following cycle parameters: 10 s at94°C and 10 s at 58°C. The primer concentrations(0.5 µM) were empirically determined based on low-est Ct values and highest efficiencies. Fluorescencethreshold values were set at levels to maximize PCRefficiency, and only reactions with efficiencies within90 to 110% were analyzed. Five, 5-fold serial dilutionsof a single experimental sample from each PCR platewere used as a standard curve to calculate PCR effi-ciency. Melt curve analysis was performed followingeach PCR to confirm that only a single product wasamplified. The sequences of the primers used for theqPCR analysis are reported in Table 2.
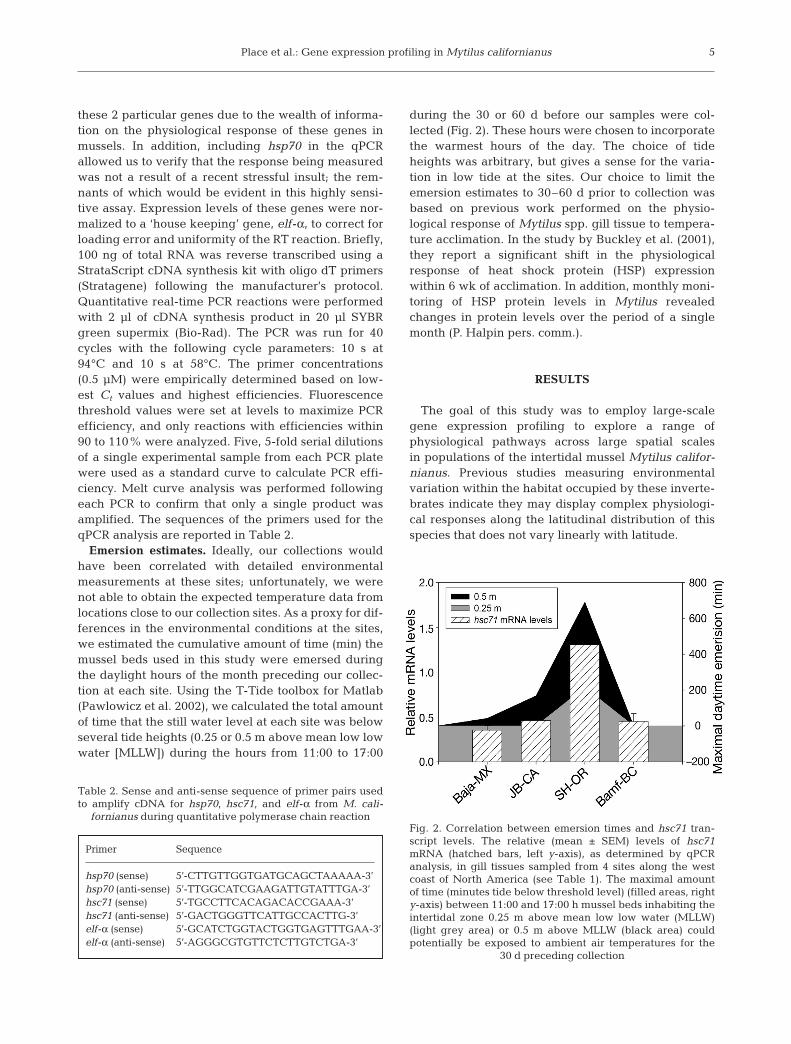
Emersion estimates. Ideally, our collections wouldhave been correlated with detailed environmentalmeasurements at these sites; unfortunately, we werenot able to obtain the expected temperature data fromlocations close to our collection sites. As a proxy for dif-ferences in the environmental conditions at the sites,we estimated the cumulative amount of time (min) themussel beds used in this study were emersed duringthe daylight hours of the month preceding our collec-tion at each site. Using the T-Tide toolbox for Matlab(Pawlowicz et al. 2002), we calculated the total amountof time that the still water level at each site was belowseveral tide heights (0.25 or 0.5 m above mean low lowwater [MLLW]) during the hours from 11:00 to 17:00
during the 30 or 60 d before our samples were col-lected (Fig. 2). These hours were chosen to incorporatethe warmest hours of the day. The choice of tideheights was arbitrary, but gives a sense for the varia-tion in low tide at the sites. Our choice to limit theemersion estimates to 30–60 d prior to collection wasbased on previous work performed on the physio-logical response of Mytilus spp. gill tissue to tempera-ture acclimation. In the study by Buckley et al. (2001),they report a significant shift in the physiologicalresponse of heat shock protein (HSP) expressionwithin 6 wk of acclimation. In addition, monthly moni-toring of HSP protein levels in Mytilus revealedchanges in protein levels over the period of a singlemonth (P. Halpin pers. comm.).
RESULTS
The goal of this study was to employ large-scalegene expression profiling to explore a range ofphysiological pathways across large spatial scalesin populations of the intertidal mussel Mytilus califor-nianus. Previous studies measuring environmentalvariation within the habitat occupied by these inverte-brates indicate they may display complex physiologi-cal responses along the latitudinal distribution of thisspecies that does not vary linearly with latitude.
5
Table 2. Sense and anti-sense sequence of primer pairs usedto amplify cDNA for hsp70, hsc71, and elf-α from M. cali-
fornianus during quantitative polymerase chain reaction
Primer Sequence
hsp70 (sense) 5’-CTTGTTGGTGATGCAGCTAAAAA-3’hsp70 (anti-sense) 5’-TTGGCATCGAAGATTGTATTTGA-3’hsc71 (sense) 5’-TGCCTTCACAGACACCGAAA-3’hsc71 (anti-sense) 5’-GACTGGGTTCATTGCCACTTG-3’elf-α (sense) 5’-GCATCTGGTACTGGTGAGTTTGAA-3’elf-α (anti-sense) 5’-AGGGCGTGTTCTCTTGTCTGA-3’
Fig. 2. Correlation between emersion times and hsc71 tran-script levels. The relative (mean ± SEM) levels of hsc71mRNA (hatched bars, left y-axis), as determined by qPCRanalysis, in gill tissues sampled from 4 sites along the westcoast of North America (see Table 1). The maximal amountof time (minutes tide below threshold level) (filled areas, righty-axis) between 11:00 and 17:00 h mussel beds inhabiting theintertidal zone 0.25 m above mean low low water (MLLW)(light grey area) or 0.5 m above MLLW (black area) couldpotentially be exposed to ambient air temperatures for the
30 d preceding collection
Mar Ecol Prog Ser 356: 1–14, 2008
Microarray analysis
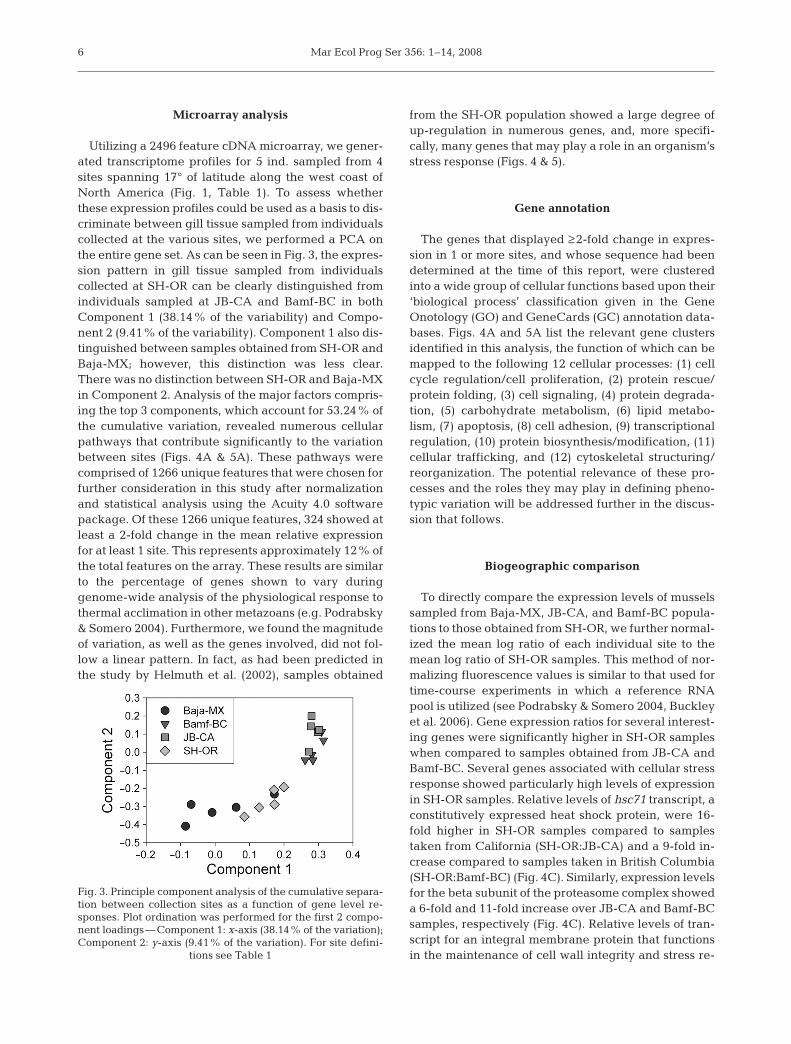
Utilizing a 2496 feature cDNA microarray, we gener-ated transcriptome profiles for 5 ind. sampled from 4sites spanning 17° of latitude along the west coast ofNorth America (Fig. 1, Table 1). To assess whetherthese expression profiles could be used as a basis to dis-criminate between gill tissue sampled from individualscollected at the various sites, we performed a PCA onthe entire gene set. As can be seen in Fig. 3, the expres-sion pattern in gill tissue sampled from individualscollected at SH-OR can be clearly distinguished fromindividuals sampled at JB-CA and Bamf-BC in bothComponent 1 (38.14% of the variability) and Compo-nent 2 (9.41% of the variability). Component 1 also dis-tinguished between samples obtained from SH-OR andBaja-MX; however, this distinction was less clear.There was no distinction between SH-OR and Baja-MXin Component 2. Analysis of the major factors compris-ing the top 3 components, which account for 53.24% ofthe cumulative variation, revealed numerous cellularpathways that contribute significantly to the variationbetween sites (Figs. 4A & 5A). These pathways werecomprised of 1266 unique features that were chosen forfurther consideration in this study after normalizationand statistical analysis using the Acuity 4.0 softwarepackage. Of these 1266 unique features, 324 showed atleast a 2-fold change in the mean relative expressionfor at least 1 site. This represents approximately 12% ofthe total features on the array. These results are similarto the percentage of genes shown to vary duringgenome-wide analysis of the physiological response tothermal acclimation in other metazoans (e.g. Podrabsky& Somero 2004). Furthermore, we found the magnitudeof variation, as well as the genes involved, did not fol-low a linear pattern. In fact, as had been predicted inthe study by Helmuth et al. (2002), samples obtained
from the SH-OR population showed a large degree ofup-regulation in numerous genes, and, more specifi-cally, many genes that may play a role in an organism’sstress response (Figs. 4 & 5).
Gene annotation
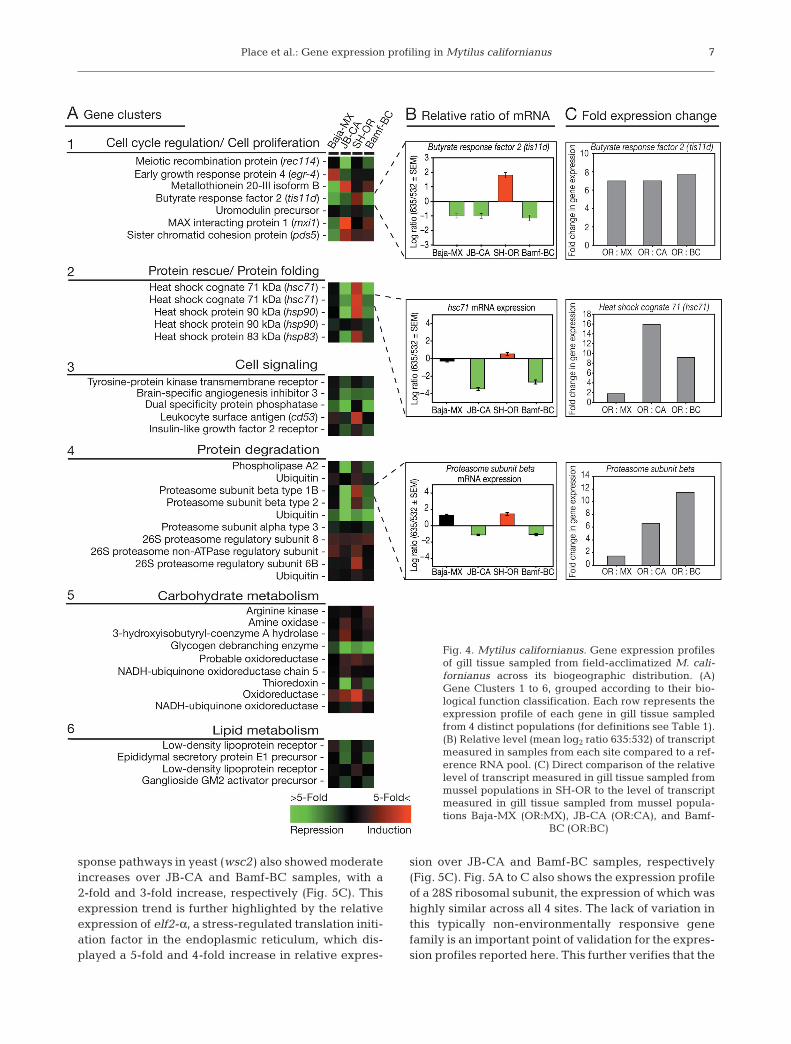
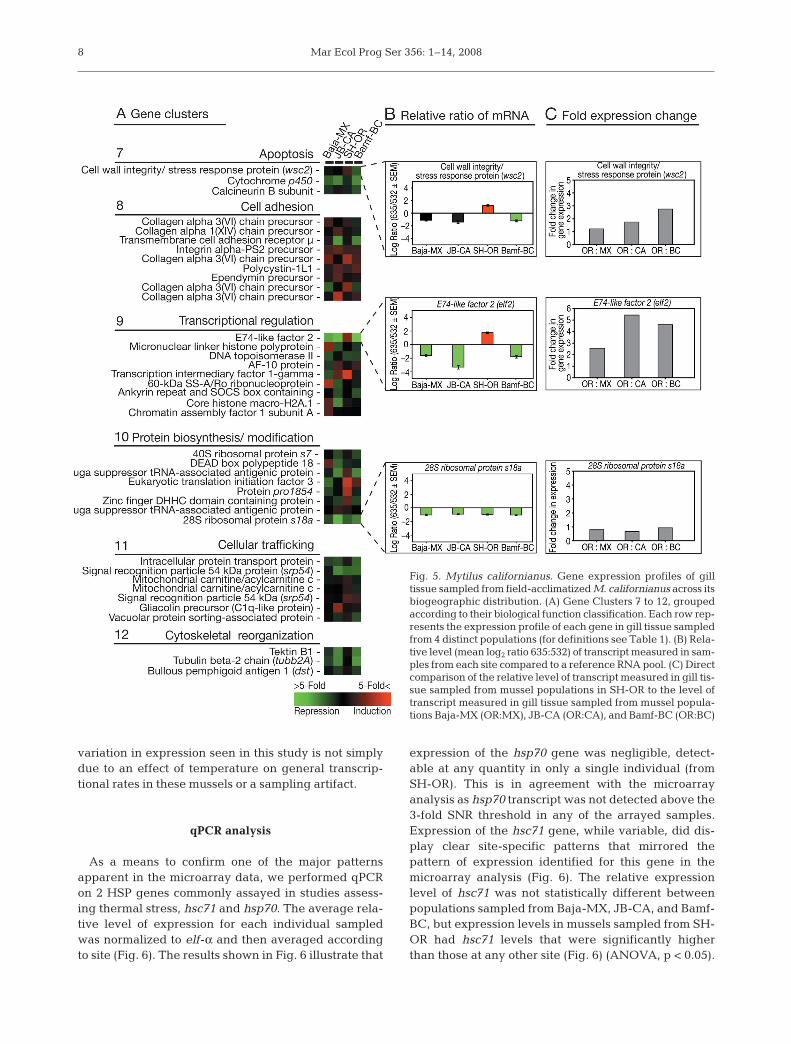
The genes that displayed ≥ 2-fold change in expres-sion in 1 or more sites, and whose sequence had beendetermined at the time of this report, were clusteredinto a wide group of cellular functions based upon their‘biological process’ classification given in the GeneOnotology (GO) and GeneCards (GC) annotation data-bases. Figs. 4A and 5A list the relevant gene clustersidentified in this analysis, the function of which can bemapped to the following 12 cellular processes: (1) cellcycle regulation/cell proliferation, (2) protein rescue/protein folding, (3) cell signaling, (4) protein degrada-tion, (5) carbohydrate metabolism, (6) lipid metabo-lism, (7) apoptosis, (8) cell adhesion, (9) transcriptionalregulation, (10) protein biosynthesis/modification, (11)cellular trafficking, and (12) cytoskeletal structuring/reorganization. The potential relevance of these pro-cesses and the roles they may play in defining pheno-typic variation will be addressed further in the discus-sion that follows.
Biogeographic comparison
To directly compare the expression levels of musselssampled from Baja-MX, JB-CA, and Bamf-BC popula-tions to those obtained from SH-OR, we further normal-ized the mean log ratio of each individual site to themean log ratio of SH-OR samples. This method of nor-malizing fluorescence values is similar to that used fortime-course experiments in which a reference RNApool is utilized (see Podrabsky & Somero 2004, Buckleyet al. 2006). Gene expression ratios for several interest-ing genes were significantly higher in SH-OR sampleswhen compared to samples obtained from JB-CA andBamf-BC. Several genes associated with cellular stressresponse showed particularly high levels of expressionin SH-OR samples. Relative levels of hsc71 transcript, aconstitutively expressed heat shock protein, were 16-fold higher in SH-OR samples compared to samplestaken from California (SH-OR:JB-CA) and a 9-fold in-crease compared to samples taken in British Columbia(SH-OR:Bamf-BC) (Fig. 4C). Similarly, expression levelsfor the beta subunit of the proteasome complex showeda 6-fold and 11-fold increase over JB-CA and Bamf-BCsamples, respectively (Fig. 4C). Relative levels of tran-script for an integral membrane protein that functionsin the maintenance of cell wall integrity and stress re-
6
Fig. 3. Principle component analysis of the cumulative separa-tion between collection sites as a function of gene level re-sponses. Plot ordination was performed for the first 2 compo-nent loadings—Component 1: x-axis (38.14% of the variation);Component 2: y-axis (9.41% of the variation). For site defini-
tions see Table 1
Place et al.: Gene expression profiling in Mytilus californianus
sponse pathways in yeast (wsc2 ) also showed moderateincreases over JB-CA and Bamf-BC samples, with a2-fold and 3-fold increase, respectively (Fig. 5C). Thisexpression trend is further highlighted by the relativeexpression of elf2-α, a stress-regulated translation initi-ation factor in the endoplasmic reticulum, which dis-played a 5-fold and 4-fold increase in relative expres-
sion over JB-CA and Bamf-BC samples, respectively(Fig. 5C). Fig. 5A to C also shows the expression profileof a 28S ribosomal subunit, the expression of which washighly similar across all 4 sites. The lack of variation inthis typically non-environmentally responsive genefamily is an important point of validation for the expres-sion profiles reported here. This further verifies that the
7
Fig. 4. Mytilus californianus. Gene expression profilesof gill tissue sampled from field-acclimatized M. cali-fornianus across its biogeographic distribution. (A)Gene Clusters 1 to 6, grouped according to their bio-logical function classification. Each row represents theexpression profile of each gene in gill tissue sampledfrom 4 distinct populations (for definitions see Table 1).(B) Relative level (mean log2 ratio 635:532) of transcriptmeasured in samples from each site compared to a ref-erence RNA pool. (C) Direct comparison of the relativelevel of transcript measured in gill tissue sampled frommussel populations in SH-OR to the level of transcriptmeasured in gill tissue sampled from mussel popula-tions Baja-MX (OR:MX), JB-CA (OR:CA), and Bamf-
BC (OR:BC)
Mar Ecol Prog Ser 356: 1–14, 2008
variation in expression seen in this study is not simplydue to an effect of temperature on general transcrip-tional rates in these mussels or a sampling artifact.
qPCR analysis
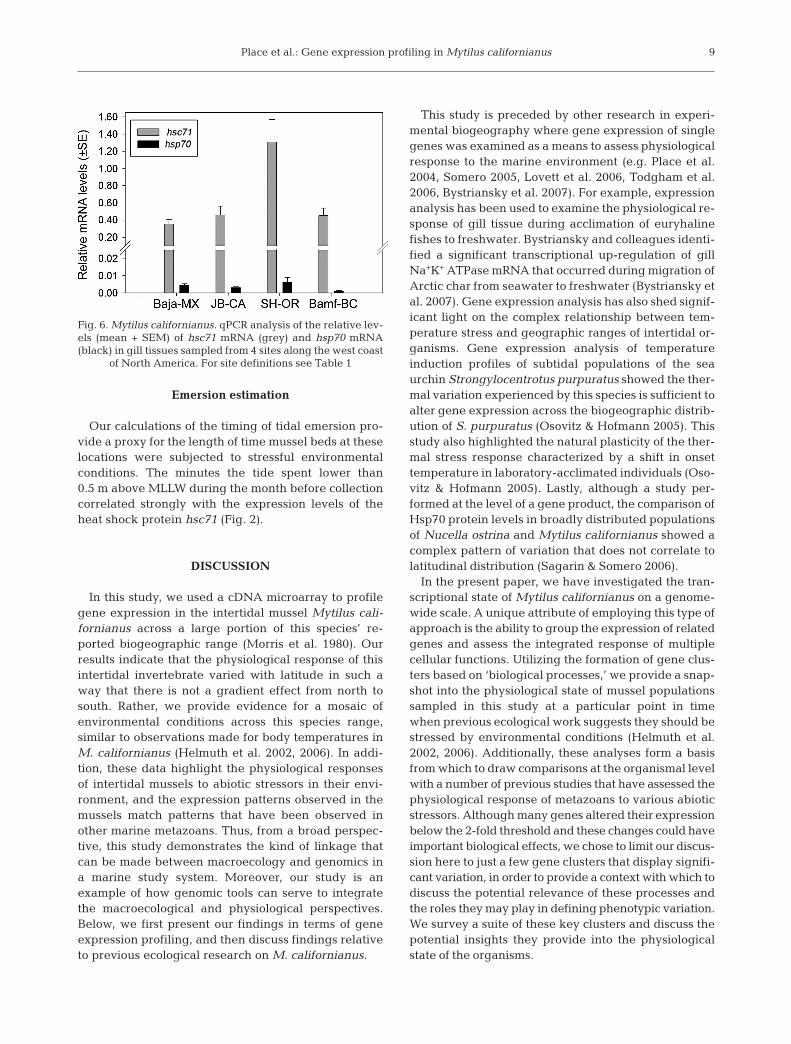
As a means to confirm one of the major patternsapparent in the microarray data, we performed qPCRon 2 HSP genes commonly assayed in studies assess-ing thermal stress, hsc71 and hsp70. The average rela-tive level of expression for each individual sampledwas normalized to elf-α and then averaged accordingto site (Fig. 6). The results shown in Fig. 6 illustrate that
expression of the hsp70 gene was negligible, detect-able at any quantity in only a single individual (fromSH-OR). This is in agreement with the microarrayanalysis as hsp70 transcript was not detected above the3-fold SNR threshold in any of the arrayed samples.Expression of the hsc71 gene, while variable, did dis-play clear site-specific patterns that mirrored thepattern of expression identified for this gene in themicroarray analysis (Fig. 6). The relative expressionlevel of hsc71 was not statistically different betweenpopulations sampled from Baja-MX, JB-CA, and Bamf-BC, but expression levels in mussels sampled from SH-OR had hsc71 levels that were significantly higherthan those at any other site (Fig. 6) (ANOVA, p < 0.05).
8
Fig. 5. Mytilus californianus. Gene expression profiles of gilltissue sampled from field-acclimatized M. californianus across itsbiogeographic distribution. (A) Gene Clusters 7 to 12, groupedaccording to their biological function classification. Each row rep-resents the expression profile of each gene in gill tissue sampledfrom 4 distinct populations (for definitions see Table 1). (B) Rela-tive level (mean log2 ratio 635:532) of transcript measured in sam-ples from each site compared to a reference RNA pool. (C) Directcomparison of the relative level of transcript measured in gill tis-sue sampled from mussel populations in SH-OR to the level oftranscript measured in gill tissue sampled from mussel popula-tions Baja-MX (OR:MX), JB-CA (OR:CA), and Bamf-BC (OR:BC)
Place et al.: Gene expression profiling in Mytilus californianus
Emersion estimation
Our calculations of the timing of tidal emersion pro-vide a proxy for the length of time mussel beds at theselocations were subjected to stressful environmentalconditions. The minutes the tide spent lower than0.5 m above MLLW during the month before collectioncorrelated strongly with the expression levels of theheat shock protein hsc71 (Fig. 2).
DISCUSSION
In this study, we used a cDNA microarray to profilegene expression in the intertidal mussel Mytilus cali-fornianus across a large portion of this species’ re-ported biogeographic range (Morris et al. 1980). Ourresults indicate that the physiological response of thisintertidal invertebrate varied with latitude in such away that there is not a gradient effect from north tosouth. Rather, we provide evidence for a mosaic ofenvironmental conditions across this species range,similar to observations made for body temperatures inM. californianus (Helmuth et al. 2002, 2006). In addi-tion, these data highlight the physiological responsesof intertidal mussels to abiotic stressors in their envi-ronment, and the expression patterns observed in themussels match patterns that have been observed inother marine metazoans. Thus, from a broad perspec-tive, this study demonstrates the kind of linkage thatcan be made between macroecology and genomics ina marine study system. Moreover, our study is anexample of how genomic tools can serve to integratethe macroecological and physiological perspectives.Below, we first present our findings in terms of geneexpression profiling, and then discuss findings relativeto previous ecological research on M. californianus.
This study is preceded by other research in experi-mental biogeography where gene expression of singlegenes was examined as a means to assess physiologicalresponse to the marine environment (e.g. Place et al.2004, Somero 2005, Lovett et al. 2006, Todgham et al.2006, Bystriansky et al. 2007). For example, expressionanalysis has been used to examine the physiological re-sponse of gill tissue during acclimation of euryhalinefishes to freshwater. Bystriansky and colleagues identi-fied a significant transcriptional up-regulation of gillNa+K+ ATPase mRNA that occurred during migration ofArctic char from seawater to freshwater (Bystriansky etal. 2007). Gene expression analysis has also shed signif-icant light on the complex relationship between tem-perature stress and geographic ranges of intertidal or-ganisms. Gene expression analysis of temperatureinduction profiles of subtidal populations of the seaurchin Strongylocentrotus purpuratus showed the ther-mal variation experienced by this species is sufficient toalter gene expression across the biogeographic distrib-ution of S. purpuratus (Osovitz & Hofmann 2005). Thisstudy also highlighted the natural plasticity of the ther-mal stress response characterized by a shift in onsettemperature in laboratory-acclimated individuals (Oso-vitz & Hofmann 2005). Lastly, although a study per-formed at the level of a gene product, the comparison ofHsp70 protein levels in broadly distributed populationsof Nucella ostrina and Mytilus californianus showed acomplex pattern of variation that does not correlate tolatitudinal distribution (Sagarin & Somero 2006).
In the present paper, we have investigated the tran-scriptional state of Mytilus californianus on a genome-wide scale. A unique attribute of employing this type ofapproach is the ability to group the expression of relatedgenes and assess the integrated response of multiplecellular functions. Utilizing the formation of gene clus-ters based on ‘biological processes,’ we provide a snap-shot into the physiological state of mussel populationssampled in this study at a particular point in timewhen previous ecological work suggests they should bestressed by environmental conditions (Helmuth et al.2002, 2006). Additionally, these analyses form a basisfrom which to draw comparisons at the organismal levelwith a number of previous studies that have assessed thephysiological response of metazoans to various abioticstressors. Although many genes altered their expressionbelow the 2-fold threshold and these changes could haveimportant biological effects, we chose to limit our discus-sion here to just a few gene clusters that display signifi-cant variation, in order to provide a context with which todiscuss the potential relevance of these processes andthe roles they may play in defining phenotypic variation.We survey a suite of these key clusters and discuss thepotential insights they provide into the physiologicalstate of the organisms.
9
Fig. 6. Mytilus californianus. qPCR analysis of the relative lev-els (mean + SEM) of hsc71 mRNA (grey) and hsp70 mRNA(black) in gill tissues sampled from 4 sites along the west coast
of North America. For site definitions see Table 1
Mar Ecol Prog Ser 356: 1–14, 2008
Cell cycle regulation/cell proliferation (Cluster 1)
In an effort to cope with the energetic costs of astressful environment, organisms may delay or evenarrest cellular proliferation and growth. On average,mussels sampled from SH-OR displayed a pattern ofgene expression that indicates a lower level of cellularproliferation is occurring in this population of mussels.For example, early growth response protein 4 (egr-4) isstrongly repressed in the gill tissue of SH-OR mussels.Egr-4 activates the transcription of target genes whoseproducts are required for mitogenesis and differentia-tion (Tourtellotte et al. 1999). While egr-4 is also re-pressed to some extent in Bamf-BC and JB-CA sam-ples, it is, in fact, strongly induced in mussels sampledfrom Baja-MX (Fig. 4A). Alternatively, butyrate responsefactor 2 (tis11d) is repressed in all populations exceptSH-OR, where it is strongly up-regulated (Fig. 4A to C).Tis11d is a protein involved in regulating the responseto growth factors by promoting the deadenylationand degradation of tumor necrosis factor α (TNF-α)(Hudson et al. 2004), a potent cytokine that plays animportant role in cell proliferation, differentiation, andapoptosis (Baud & Karin 2001). Similar effects of envi-ronmental stressors on cell growth have been observedfor the marine goby Gillichthys mirabilis when sub-jected to hypoxic stress (Gracey et al. 2001) and fortissue-specific responses to temperature (Buckley et al.2006). Although an arrest in cell division may havebeen expected, since mussels are believed to be quies-cent during low tide (the time at which samples wereobtained for this study), the expression profiles of thegenes identified in this functional cluster point out thatthere are gradients of activity. For example, musselssampled at low tide in Baja-MX show signs of activecell proliferation, while the gene expression profile ofthe gill tissue samples from SH-OR are consistent withthe inhibition of cell growth and proliferation (Fig. 4A).
Protein rescue/protein folding (Cluster 2)
The most highly up-regulated genes on the arraybelonged to the family of molecular chaperones, agroup of proteins that primarily function to maintainprotein homeostasis within the cell by assisting in thefolding of nascent polypeptides. In addition, molecularchaperones play a pivotal role in maintaining proteinhomeostasis during cellular exposure to proteotoxicstressors such as heat or heavy metals by interactingwith stress-denatured proteins and preventing theiraggregation and/or degradation (Parsell & Lindquist1993). In response to a number of cellular insults, sev-eral members of this family known as heat shock pro-teins (HSP) are rapidly up-regulated and preferentially
translated in a phylogenetically conserved ‘heat shockresponse’ (Lindquist 1986). Some HSPs, such as Hsp40and Hsc71/Hsp70, directly interact with the hydropho-bic regions of misfolded proteins, preventing themfrom forming aggregates (Fink 1999) that can poten-tially become cytotoxic (Bucciantini et al. 2002). Morespecialized members of the family, such as Hsp108,have the ability to disassociate large protein aggre-gates, which can then be re-folded or shuttled downthe proteolytic pathway (Parsell et al. 1994).
Three of the 4 specific size classes of HSPs identifiedon the array showed increased levels of expression inmussels sampled from SH-OR as compared to all othersites (Fig. 4A). hsc71, hsp83, and hsp90 all show a dis-tinct increase in the level of transcript in SH-OR sam-ples, with hsc71 transcript being expressed at the high-est levels. Gill tissue sampled from mussels in SH-ORdisplayed a 16-fold and 9-fold higher level of expres-sion when compared to JB-CA and Bamf-BC, respec-tively (Fig. 4C). Expression of hsp90 appears to beinconsistent, with 1 of 2 features identified as ‘hsp90’,showing decidedly up-regulated expression in SH-ORsamples at levels similar to that seen for hsc71 and thesecond feature for hsp90 showing no variation acrosssites (Fig. 4A). However, it is very plausible the differ-ential expression of hsp90 seen in the array is due tothe presence of 2 separate isoforms; the inducibleisoform, hsp90 α, and the constitutively expressed iso-form, hsp90 β (as is the case for hsc71/hsp70). Unfortu-nately, we currently do not have enough sequenceinformation from these clones to distinguish betweenthe 2 separate isoforms at this time and, thus, are pre-vented from drawing any further conclusions about thenature of the expression differences seen for thesegenes. Similar gene expression patterns for the consti-tutive transcripts of hsc70 and hsp90 were reported byPodrabsky & Somero (2004) in the annual killifish.Transcripts for these genes were only mildly inducedfrom several rounds of temperature cycling; however,when killifish were subjected to chronically elevatedtemperatures, both hsc70 and hsp90 were strongly up-regulated (Podrabsky & Somero 2004). Of the 4 HSPscurrently known to be present on the array, only thehighly inducible hsp70 isoform of the 70 kDa familywas not detected in any of the arrayed mussels. Underconditions of acute stress, the rapid increase and sub-sequent return to basal levels of inducible transcripts(hsp70/hsp90 α) are highly dynamic events. In porce-lain crabs, hsp70 levels can increase 25-fold within thefirst hour of recovery from acute heat shock, whilehsp90 α can increase 5-fold within the same timeframe (Teranishi & Stillman 2007). Similarly, hsp70 andhsp90 α show a 19-fold and 11-fold increase, respec-tively, in tissues of a marine goby after a 2 h heat shock(Buckley et al. 2006). These studies suggest the re-
10
Place et al.: Gene expression profiling in Mytilus californianus
sponse of these chaperones to temperature cycling andchronic temperature stress are distinct and are distin-guished by the relative level of constitutive versusinducible transcript present, providing a signature forpopulations experiencing chronic temperature stress.Interestingly, in our study, neither the microarrayanalysis, nor the more sensitive qPCR analysis, de-tected a significant level of the inducible hsp70 isoform(Fig. 6). The lack of detectible hsp70 mRNA combinedwith the strikingly high levels of the constitutive iso-form, hsc71, found within SH-OR mussel samples sug-gests the unique physiological phenotype displayed inthe SH-OR population is not in response to a singleacute stressful event that immediately preceded thecollection window. Rather, these results suggest thevariation in expression patterns seen within this genecluster may be the physiological signature of dif-ferential acclimatization amongst this population inresponse to seasonal differences in ambient exposure.
Protein degradation (Cluster 4)
Damaged proteins in the cell have 2 cellular fates.Moderately damaged proteins can often be rescued bythe molecular chaperone pathway previously dis-cussed. Alternatively, irreversibly damaged proteinsare shuttled down the proteasome degradation path-way via covalent tagging with ubiquitin, a small, 76amino acid protein. Conjugation of multiple ubiquitinmolecules to polypeptides (‘polyubiquitination’) targetsthe damaged polypeptide for proteolytic degradationby the proteasome, a multi-subunit protein complexthat binds the polyubiquitin chain and actively cleavespeptides. In the present study, we identified variouscomponents of the ubiquitin–proteasome pathway, in-cluding proteasome-associated proteins and subunitsthat show a complex expression pattern (Fig. 4A). Sev-eral beta subunits of the 26S proteasome core complexwere found to be expressed at greater levels in SH-ORpopulations; however, the inverse situation was foundfor an alpha subunit, psma3 (Fig. 4A). In Baja-MX andSH-OR gill samples, proteasome subunit beta type 1B(psmb1) was found to be expressed at equivalent levels;however, JB-CA and Bamf-BC populations displayed6.5-fold and 11.4-fold lower expression, respectively(Fig. 4A to C). Likewise, proteasome subunit betatype 2 (psmb2) displayed similar expression patternsin these populations of mussels (Fig. 4A). Conversely,psma3 showed the exact opposite expression profile,with higher levels being recorded in JB-CA and Bamf-BC populations (Fig. 4A). These conflicting expressionpatterns may arise from the different roles for alpha-and beta-type subunits, with the beta subunits servingsolely as the catalytic subunits of the machinery (Bau-
meister et al. 1998). Again, these data are in agreementwith expression patterns identified in other marinespecies that incur irreversible protein damage whenexposed to environmentally relevant temperature ex-tremes. Both porcelain crabs (Teranishi & Stillman2007) and marine gobies (Buckley et al. 2006) showsustained up-regulation of genes involved in the ubi-quitin–proteasome pathway at temperatures near theupper extremes experienced by each species.
In addition to the proteasome subunit beta tran-scripts, multiple regulatory protein transcripts werepicked up in the arrayed samples (26S proteasome reg-ulatory subunit 6B, subunit 8, and the 26S proteasomenon-ATPase regulatory subunit). However, unlike thegenes that encode for the proteasome complex itself,these regulatory genes show little variation betweensites (Fig. 4A). Acclimation to chronically elevated tem-peratures has been shown to result in a weak responseof proteasome regulatory subunits in killifish (Podrab-sky & Somero 2004). Conversely, these same genes ap-pear to be highly responsive to short-term temperaturecycling, indicating different regulatory mechanisms ex-ist to balance protein turnover in the cell during tem-perature acclimation (Podrabsky & Somero 2004). Thiscomplex pattern of expression is most likely due, inpart, to the intricate mechanism of proteasome assem-bly, regulation, and action. For example, eukaryoticproteasomes contain 2 copies each of 14 different sub-units, which, based on their sequence similarity, are di-vided into the noncatalytic α- and the catalytic β-typesubunits (Baumeister et al. 1998). Furthermore, there isevidence that variation in the heterogeneity of the betasubunit may serve to regulate substrate specificity ofthe proteasome. Hochstrasser and colleagues foundproteasomal populations with distinct subunit composi-tions can exist in the same cell in mammals. They show3 variant β subunits, lmp2, lmp7, and mecl1, are in-ducible by γ-interferon and can specifically replacehomologous proteasome subunits during assembly ofnewly formed proteasomes (Hochstrasser 1995). Thesedata taken together with the separate roles for thealpha and beta subunits indicate the general trendsidentified in this cluster of genes may reflect a shift inprotein homeostasis that requires a greater need forcompartmentalized proteolytic activity in the SH-ORpopulation of mussels.
Apoptosis (Cluster 7)
In some cases, prolonged environmental stressmay cause significant enough damage to the cellularmachinery that repair mechanisms are insufficient toprevent cell death. Under these circumstances, severalregulators of stress-responsive pathways can be modu-
11
Mar Ecol Prog Ser 356: 1–14, 2008
lated to shift their biological function to potentiateapoptosis in the cell. In general, this occurrence wasnot observed in this study. There was little variation ingene expression associated specifically with apoptosisobserved in the gill samples from the 4 different popu-lations; however, a putative cell wall integrity and stressresponse protein (wsc2) was up-regulated in SH-ORmussels (Fig. 5A to C). Members of the Wsc family ofproteins are putative regulators of the Pkc1–Mpk1pathway in yeast that functions in the maintenance ofcell wall integrity and stress response pathways andmay laterally activate pro-apoptotic pathways (Verna etal. 1997). These data suggest that, despite the strongexpression of stress-responsive genes in the SH-ORpopulation of mussels, the stressors were not sufficientenough to increase the level of apoptosis above steady-state cell maintenance. The increased expression seenin some gene families associated with apoptotis (i.e.wsc2, cytochrom p450 ) may indicate the mussels sam-pled from Baja-MX and SH-OR may be preparing toinitiate an apoptotic response.
If the expression patterns of the gene clusters areviewed as an integrated response, they may be high-lighting significant changes in the physiological re-sponse and may underscore environmental factors im-pacting the performance of Mytilus californianus. Thephysiological phenotype from the SH-OR population isdistinctly different when compared to the other 3 popu-lations. In fact, of the other 3 populations sampled, thegeographically distant Baja-MX population appearsmore similar with respect to gene expression (Fig. 3).Viewed at the organismal level and not just individualpathways, one can argue that the mussels in the SH-ORpopulation display a distinct physiological phenotypethat indicates a shift in energy allocation from growthand proliferation to active cellular defense and repairmechanisms in response to environmental stress.
These data may also begin to provide insight into theimpact of aerial body temperatures on mussel growthpatterns. While the positive correlation between seasurface temperature (SST) and mussel growth hasbeen well established (Newell 1979, Behrens Yamada& Peters 1988, Seed & Suchanek 1992), to a largeextent, we still know little about the physiologicaleffects of aerial body temperature on mussel growth. Arecent study assessing the spatial patterns of growth inMytilus californianus near Point Conception identifieda strong correlation between mean intertidal bodytemperature and growth rates at sites spanning thePoint Conception geographic boundary (Blanchette etal. 2007). However, this study was unable to separatethe effects of aerial versus seawater temperature, bothof which contribute to the mean intertidal body tem-perature of mussels. Blanchette and colleagues specu-late that the growth differences observed in their study
were either due solely to the influence of SST onmean intertidal temperature, as generally expected forgrowth of marine invertebrates (Newell 1979), or thatchronic exposure to overall cooler intertidal tempera-tures reduces growth rates at sites north of Point Con-ception. Our data suggest that aerial body temperaturecan, in fact, negatively impact growth in mussel popu-lations that otherwise display relatively fast growthrates. These data would seem to lend support to thehypothesis that both aerial and seawater temperaturesimpact growth and that cumulative temperature expo-sure is the best predictor of growth rates across siteswhen nutrient availability is not limiting.
Overall, these expression patterns provide furtherempirical support for emerging models predicting thecomplexity of environmental conditions along thebiogeographic range of these intertidal invertebrates(Helmuth et al. 2002, 2005, Sagarin & Gaines 2002).Our previous understanding of the physiologicalresponse to thermal variation in these organisms andthe expression data for several classes of HSP makesthe strongest case between an environmental parame-ter and physiological function. By calculating the totalminutes the tide levels were 0.5 m above MLLW duringdaylight hours in the month preceding our collection, astrong correlation can be drawn between emersiontime and expression levels of the heat shock proteinhsc71 (Fig. 2), thus, suggesting temperature may be asignificant environmental factor driving the differen-tial gene expression identified in this study. Althoughcompelling, the role temperature plays in setting thephenotype of different populations is just one exampleof the strength of expression analysis across largespatial scales. With appropriate consideration, equallycompelling analyses can potentially be made for multi-ple environmental parameters, as indicated by thediverse cellular pathways implicated in this study.
It should also be mentioned that this study repre-sents only a snapshot of the physiological state of theorganism collected at a single point in time. If the studywere conducted at a different point in time, there is thepotential that the physiological response could bereversed, signifying more stressful conditions at south-ern sites, or potentially identifying alternative mecha-nisms driving gene expression (e.g. food availability,gametogenesis). At the same time, this representsa powerful feature of this study; because our sampleswere gathered across latitudes in this snapshot fash-ion, our results emphasize geographic differences inexpression, rather than the co-variation of factors dueto time and distance. An analysis of the transcriptomeover the course of an entire year will eventually revealthe ecological gradient experienced by these separatepopulations and highlight the interaction betweenphysiological plasticity and environmental variation
12
Place et al.: Gene expression profiling in Mytilus californianus
that establishes biogeographic patterning. A secondcaveat of this study is the lack of precise tidal heightmeasurements for the collection sites. Unfortunately,as stated in the ‘Materials and methods’ section, wewere unable to overcome the logistical barriers pre-sented by simultaneously obtaining these precise mea-surements at remote sites. Since vertical limits of mus-sel beds are often set by both abiotic (e.g. wave splashin the upper limits) and biotic factors (e.g. predation inthe lower limits), there can be considerable variationamong sites with respect to distribution (Harley & Hel-muth 2003). This could complicate the interpretation ofthese analyses as the differences could be com-pounded by a difference in the absolute tidal height ofthe collection. However, we would predict, based onbody temperatures across the vertical distribution atthese sites (Helmuth et al. 2006) that this occurrencewould only exaggerate the results, as opposed to areversal, and that the overall trends seen in this studywould remain the same. We are currently investigatingthis phenomenon by assessing the degree of inter-indi-vidual variation within the SH-OR population; how-ever, this analysis is well beyond the scope of the pre-sent study.
CONCLUSIONS
Overall, the majority of genes identified in this studydisplayed an expression profile that varied as a func-tion of collection site; however, this profile did not cor-relate linearly with the biogeographic distribution ofthis species, largely supporting the hypothesis of thisstudy (Figs. 3 to 5). While physiological response tothermal variation across latitudes appears to be con-tributing significantly to the variation in gene expres-sion, we currently cannot speculate on the importanceof contributions from secondary parameters such asdifferences in nutrient availability, hypoxia, salinity, orpredator abundance. Finally, our study on intertidalmussels exemplifies the usefulness of the new suite ofmolecular and genomic tools available to marine ecol-ogists and provides an initial glimpse at the acclimati-zation signature for distinct populations of musselsunder natural variation. Microarrays now being devel-oped for non-model systems, such as Mytilus spp., willbe an important tool, providing insight into the inter-play between multiple cellular pathways and abioticfactors that ultimately result in a physiological pheno-type, thus providing a backdrop for investigations atboth cellular and organismal levels.
Acknowledgements. We thank all the members of the Hof-mann Laboratory group for assistance with sample collection.We gratefully acknowledge A. Y. Gracey (University of South-
ern California) for the construction of the mussel cDNAlibrary used in this study while a PISCO-Postdoctoral Fellowin the laboratory of G. N. Somero (Hopkins Marine Station ofStanford University). In addition, S.P.P. was supported by aU.S. National Institutes of Health NIH-NRSA PostdoctoralFellowship. The authors acknowledge the U.S. National Sci-ence Foundation for financial support during the course ofthis writing project (NSF Grant OCE-0425107 to G.E.H.). Thisis Contribution no. 276 from PISCO, the Partnership for Inter-disciplinary Studies of Coastal Oceans funded primarily bythe Gordon and Betty Moore Foundation and David andLucile Packard Foundation.
LITERATURE CITED
Baud V, Karin M (2001) Signal transduction by tumor necrosisfactor and its relatives. Trends Cell Biol 11:372–377
Baumeister W, Walz J, Zuhl F, Seemuller E (1998) The protea-some: paradigm of a self-compartmentalizing protease.Cell 92:367–380
Behrens Yamada SB, Peters EE (1988) Harvest managementand the growth and condition of submarket-size sea mus-sels, Mytilus californianus. Aquaculture 74:293–299
Bertness MD, Leonard GH, Levine JM, Bruno JF (1999) Cli-mate-driven interactions among rocky intertidal organ-isms caught between a rock and a hot place. Oecologia120:446–450
Blanchette CA, Helmuth B, Gaines SD (2007) Spatial patterns ofgrowth in the mussel, Mytilus californianus, across a majoroceanographic and biogeographic boundary at Point Con-ception, California, USA. J Exp Mar Biol Ecol 340:126–148
Bucciantini M, Giannoni E, Chiti F, Baroni F and others (2002)Inherent toxicity of aggregates implies a common mecha-nism for protein misfolding diseases. Nature 416:507–511
Buckley BA, Owen ME, Hofmann GE (2001) Adjusting the ther-mostat: the threshold induction temperature for the heat-shock response in intertidal mussels (genus Mytilus) changesas a function of thermal history. J Exp Biol 204:3571–3579
Buckley BA, Gracey AY, Somero GN (2006) The cellularresponse to heat stress in the goby Gillichthys mirabilis: acDNA microarray and protein-level analysis. J Exp Biol209:2660–2677
Byers JE (2005) Quantifying geographic variation in physio-logical performance to address the absence of invadingspecies. Ecoscience 12:358–365
Bystriansky JS, Frick NT, Richards JG, Schulte PM, Ballan-tyne JS (2007) Wild arctic char (Salvelinus alpinus) upreg-ulate gill Na+,K+-ATPase during freshwater migration.Physiol Biochem Zool 80:270–282
Cunningham C, Hikima J, Jenny MJ, Chapman RW and oth-ers (2006) New resources for marine genomics: bacterialartificial chromosome libraries for the eastern and Pacificoysters (Crassostrea virginica and C. gigas). Mar Biotech-nol 8:521–533
Dhar AK, Dettori A, Roux MM, Klimpel KR, Read B (2003)Identification of differentially expressed genes in shrimp(Penaeus stylirostris) infected with white spot syndromevirus by cDNA microarrays. Arch Virol 148:2381–2396
Dupont S, Wilson K, Obst M, Skold H, Nakano H, ThorndykeMC (2007) Marine ecological genomics: when genomicsmeets marine ecology. Mar Ecol Prog Ser 332:257–273
Fink AL (1999) Chaperone-mediated protein folding. PhysiolRev 79:425–449
Gracey AY, Troll JV, Somero GN (2001) Hypoxia-inducedgene expression profiling in the euryoxic fish Gillichthysmirabilis. Proc Natl Acad Sci USA 98:1993–1998
13
Mar Ecol Prog Ser 356: 1–14, 2008
Harley CDG, Helmuth BST (2003) Local- and regional-scaleeffects of wave exposure, thermal stress, and absolute ver-sus effective shore level on patterns of intertidal zonation.Limnol Oceanogr 48:1498–1508
Helmuth B, Harley CDG, Halpin PM, O’Donnell M, HofmannGE, Blanchette CA (2002) Climate change and latitudinalpatterns of intertidal thermal stress. Science 298:1015–1017
Helmuth B, Kingsolver JG, Carrington E (2005) Biophysics,physiological ecology, and climate change: Does mecha-nism matter? Annu Rev Physiol 67:177–201
Helmuth B, Broitman BR, Blanchette CA, Gilman S and others(2006) Mosaic patterns of thermal stress in the rocky inter-tidal zone: implications for climate change. Ecol Monogr76:461–479
Hochstrasser M (1995) Ubiquitin, proteasomes, and the regu-lation of intracellular protein-degradation. Curr Opin CellBiol 7:215–223
Hofmann GE, Place SP (2007) Genomics-enabled research inmarine ecology: challenges, risks and pay-offs. Mar EcolProg Ser 332:249–255
Hofmann GE, Burnaford JL, Fielman KT (2005) Genomics-fueled approaches to current challenges in marine eco-logy. Trends Ecol Evol 20:305–311
Hudson BP, Martinez-Yamout MA, Dyson HJ, Wright PE(2004) Recognition of the mRNA AU-rich element by thezinc finger domain of TIS11d. Nat Struct Mol Biol 11:257–264
Lester SE, Gaines SD, Kinlan BP (2007) Reproduction on theedge: large-scale patterns of individual performance in amarine invertebrate. Ecology 88:2229–2239
Levinton JS, Monahan RK (1983) The latitudinal compensationhypothesis—growth data and a model of latitudinal growth-differentiation based upon energy budgets. 2. Intraspecificcomparisons between subspecies of Ophryotrocha puerilis(Polychaeta, Dorvilleidae). Biol Bull 165:699–707
Lewis JR (1986) Latitudinal trends in reproduction, recruit-ment and population characteristics of some rocky littoralmollusks and cirripedes. Hydrobiologia 142:1–13
Lindquist S (1986) The heat-shock response. Annu RevBiochem 55:1151–1191
Lovett DL, Verzi MP, Burgents JE, Tanner CA, Glomski K, LeeJJ, Towle DW (2006) Expression profiles of Na+,K+-ATPaseduring acute and chronic hypo-osmotic stress in the bluecrab Callinectes sapidus. Biol Bull 211:58–65
Menge BA, Branch GM (2001) Rocky intertidal communities.In: Bertness MD, Gaines SD, Hay M (eds) Marine com-munity ecology. Sinauer Association, Sunderland, MA,p 221–251
Morris RH, Abbott DP, Haderlie EC (1980) Intertidal inverte-brates of California. Stanford University Press, Palo Alto,CA
Morrison RN, Cooper GA, Koop BF, Rise ML, Bridle AR,Adams MB, Nowak BF (2006) Transcriptome profilingthe gills of amoebic gill disease (AGD)-affected Atlanticsalmon (Salmo salar L.): A role for tumor suppressor p53 inAGD pathogenesis? Physiol Genomics 26:15–34
Newell CR (1979) Biology of intertidal animals. MarineEcological Surveys, Faversham
Osovitz CJ, Hofmann GE (2005) Thermal history-dependentexpression of the hsp70 gene in purple sea urchins: bio-geographic patterns and the effect of temperature accli-mation. J Exp Mar Biol Ecol 327:134–143
Parmesan C, Yohe G (2003) A globally coherent fingerprint ofclimate change impacts across natural systems. Nature 421:37–42
Parsell DA, Lindquist S (1993) The function of heat-shock
proteins in stress tolerance: degradation and reactivationof damaged proteins. Annu Rev Genet 27:437–496
Parsell DA, Kowal AS, Singer MA, Lindquist S (1994) Proteindisaggregation mediated by heat-shock protein Hsp104.Nature 372:475–478
Pawlowicz R, Beardsley B, Lentz S (2002) Classical tidal har-monic analysis including error estimates in MATLABusing T_TIDE. Comput Geosci 28:929–937
Place SP, Zippay ML, Hofmann GE (2004) Constitutive roles forinducible genes: evidence for the alteration in expression ofthe inducible hsp70 gene in Antarctic notothenioid fishes.Am J Physiol Regul Integr Comp Physiol 287:R429–R436
Podrabsky JE, Somero GN (2004) Changes in gene expres-sion associated with acclimation to constant temperaturesand fluctuating daily temperatures in an annual killifishAustrofundulus limnaeus. J Exp Biol 207:2237–2254
Rodriguez-Lanetty M, Phillips WS, Weis VM (2006) Transcrip-tome analysis of a cnidarian–dinoflagellate mutualism re-veals complex modulation of host gene expression. BMCGenomics 7:23
Sagarin RD, Gaines SD (2002) Geographical abundance dis-tributions of coastal invertebrates: using one-dimensionalranges to test biogeographic hypotheses. J Biogeogr 29:985–997
Sagarin RD, Somero GN (2006) Complex patterns of expres-sion of heat-shock protein 70 across the southern biogeo-graphical ranges of the intertidal mussel Mytilus californi-anus and snail Nucella ostrina. J Biogeogr 33:622–630
Seed R, Suchanek T (1992) Population and community eco-logy of Mytilus. In: The mussel Mytilus: ecology, physio-logy, genetics and culture. Elsevier, Amsterdam, p 87–169
Somero GN (2002) Thermal physiology and vertical zonationof intertidal animals: optima, limits, and costs of living.Integr Comp Biol 42:780–789
Somero GN (2005) Linking biogeography to physiology: evo-lutionary and acclimatory adjustments of thermal limits.Front Zool 2:1
Spicer JI, Gaston KJ (1999) Physiological diversity and its eco-logical implications. Blackwell Science, Oxford
Teranishi KS, Stillman JH (2007) A cDNA microarray analysisof the response to heat stress in hepatopancreas tissue ofthe porcelain crab Petrolisthes cinctipes. Comp BiochemPhysiol D 2:53–62
Todgham AE, Iwama GK, Schulte PM (2006) Effects of thenatural tidal cycle and artificial temperature cycling onHsp levels in the tidepool sculpin Oligocottus maculosus.Physiol Biochem Zool 79:1033–1045
Tourtellotte WG, Nagarajan R, Auyeung A, Mueller C, Mil-brandt J (1999) Infertility associated with incomplete sper-matogenic arrest and oligozoospermia in Egr4-deficientmice. Development 126:5061–5071
van der Meer DL, van den Thillart GE, Witte F, de Bakker MAand others (2005) Gene expression profiling of the long-term adaptive response to hypoxia in the gills of adultzebrafish. Am J Physiol Regul Integr Comp Physiol289:R1512–R1519
Verna J, Lodder A, Lee K, Vagts A, Ballester R (1997) A fam-ily of genes required for maintenance of cell wall integrityand for the stress response in Saccharomyces cerevisiae.Proc Natl Acad Sci USA 94:13804–13809
Wilson K, Thorndyke M, Nilsen F, Rogers A, Martinez P(2005) Marine systems: moving into the genomics era.PSZN I: Mar Ecol 26:3–16
Yamahira K, Conover DO (2002) Intra- vs. interspecific latitu-dinal variation in growth: Adaptation to temperature orseasonality? Ecology 83:1252–1262
14
Initial editorial responsibility: Howard Browman,Storebø,Norway (until November 5, 2007); Final editorial responsibility:Matthias Seaman, Oldendorf/Luhe, Germany
Submitted: September 13, 2007; Accepted: November 22, 2007Proofs received from author(s): January 28, 2008