Gene Expression Data Clustering using a Fuzzy Link … clustering for detecting intersecting and...
10
International Journal of Computer Information Systems and Industrial Management Applications. ISSN 2150-7988 Volume 5 (2013) pp. 532-541 © MIR Labs, www.mirlabs.net/ijcisim/index.html MIR Labs, USA Gene Expression Data Clustering using a Fuzzy Link based Approach Rosy Sarmah Dept. of CS & Engg., Tezpur University, Tezpur, Assam, India [email protected] Abstract: There are many clustering algorithms for gene expression data in the literature that are robust against noise and outliers. The limitation with many of these algorithms is that they cannot identify the overlapping and intersecting clusters. This paper presents an algorithm for clustering gene expression data using the concepts of common neighbors and fuzzy clustering for detecting intersecting and overlapping clusters. On comparison of the algorithm to the existing popular approaches it was found that our algorithm gives good results in terms of z-score measure of cluster validity and p-value and Q-value measures. Keywords: Gene expression data, nearest neighbor, common nearest neighbor, Pearson correlation coefficient, coexpression network I. Introduction For the past few years, microarrays has emerged as a widely used technology for the monitoring of the expression levels of thousands of genes during various biological processes and functions. Extracting the hidden information in this huge volume of gene expression data is quite difficult, and, therefore the need for computationally efficient methods to mine this data is a thrust area for the research community. According to [1], “the large number of genes and the complexity of biological networks greatly increase the challenges of comprehending and interpreting the resulting mass of data, which often consists of millions of measurements”. Several data mining techniques have been used to address this challenge and clustering techniques is one of the most popular tools found capable towards attaining this goal. Clustering techniques identify the inherent natural structures and the interesting patterns in the dataset. Clustering techniques cluster genes with similar expression patterns (co-expressed genes) into the same cluster and helps in understanding gene function, gene regulation, cellular processes, and sub types of cells. Therefore a cluster consists of subsets of genes that behave similarly. Over the last few decades, a very rich literature on Cluster Analysis of Gene Expression Data has evolved [1]. Three approaches can be found in gene data clustering: (i) Gene based clustering, (ii) Sample based clustering and (iii) Subspace clustering. Gene-based clustering considers the genes as data objects and the samples as features. Sample-based clustering considers the samples as data objects to be clustered, while the genes are considered as features. In subspace clustering either genes or samples can be regarded as objects or features. All the three categories namely: gene-based, sample-based, and subspace clustering have different challenges, and different computational strategies are adopted for each of them. In this paper we investigate the problems of identification of coherent patterns by clustering technique using gene based approach. The proposed method, is based on the concept of common nearest neighbor clustering approach as in [2] and uses a fuzzy membership function as in [3] to identify the overlapping clusters as well. The organization of the paper is as follows. In Section II, we review some of the important existing clustering methods in the context of clustering gene expression data. In Section III, the background of our work is given and in section IV, we discuss our algorithm, FLBC-I. A previous version of the algorithm was presented in [3]. In FLBC-I, the cluster expansion process is improved. In Section V, we report the experimental results and finally the conclusions and future works are presented in Section VI. II. Related Work Clustering methods for gene expression data should be capable of revealing the inherent structure of the data, extracting useful features from even noisy data, identifying the highly connected and embedded patterns in the data [4] and finding the relationships between the clusters and their sub-clusters. k-means [5] is a pioneering partition-based clustering algorithm that partitions the dataset into some pre-defined number of clusters by optimizing a predefined criterion. However, specification of the number of clusters, noise sensitivity, unsuitability in detecting arbitrary shaped clusters and inconsistency in yielding the same result on different runs of the algorithm are considered as its major demerits. In [4], the authors propose the Density-based Hierarchical Clustering method (DHC) that uses a density-based approach to identify co-expressed gene groups from gene expression data. DHC is suitable for detecting highly connected clusters but is computationally expensive and is dependent on two global parameters. Jarvis and Patrick
-
Upload
nguyencong -
Category
Documents
-
view
221 -
download
0
Transcript of Gene Expression Data Clustering using a Fuzzy Link … clustering for detecting intersecting and...
International Journal of Computer Information Systems and Industrial Management Applications. ISSN 2150-7988 Volume 5 (2013) pp. 532-541 © MIR Labs, www.mirlabs.net/ijcisim/index.html
MIR Labs, USA
Gene Expression Data Clustering using a Fuzzy Link based Approach
Rosy Sarmah
Dept. of CS & Engg., Tezpur University, Tezpur, Assam, India
Abstract: There are many clustering algorithms for gene expression data in the literature that are robust against noise and outliers. The limitation with many of these algorithms is that they cannot identify the overlapping and intersecting clusters. This paper presents an algorithm for clustering gene expression data using the concepts of common neighbors and fuzzy clustering for detecting intersecting and overlapping clusters. On comparison of the algorithm to the existing popular approaches it was found that our algorithm gives good results in terms of z-score measure of cluster validity and p-value and Q-value measures.
Keywords: Gene expression data, nearest neighbor, common nearest neighbor, Pearson correlation coefficient, coexpression network
I. Introduction For the past few years, microarrays has emerged as a widely used technology for the monitoring of the expression levels of thousands of genes during various biological processes and functions. Extracting the hidden information in this huge volume of gene expression data is quite difficult, and, therefore the need for computationally efficient methods to mine this data is a thrust area for the research community. According to [1], “the large number of genes and the complexity of biological networks greatly increase the challenges of comprehending and interpreting the resulting mass of data, which often consists of millions of measurements”. Several data mining techniques have been used to address this challenge and clustering techniques is one of the most popular tools found capable towards attaining this goal. Clustering techniques identify the inherent natural structures and the interesting patterns in the dataset.
Clustering techniques cluster genes with similar expression patterns (co-expressed genes) into the same cluster and helps in understanding gene function, gene regulation, cellular processes, and sub types of cells. Therefore a cluster consists of subsets of genes that behave similarly. Over the last few decades, a very rich literature on Cluster Analysis of Gene Expression Data has evolved [1]. Three approaches can be found in gene data clustering: (i) Gene based clustering, (ii) Sample based clustering and (iii) Subspace clustering. Gene-based clustering considers the genes as data objects and the samples as features. Sample-based clustering considers
the samples as data objects to be clustered, while the genes are considered as features. In subspace clustering either genes or samples can be regarded as objects or features. All the three categories namely: gene-based, sample-based, and subspace clustering have different challenges, and different computational strategies are adopted for each of them.
In this paper we investigate the problems of identification of coherent patterns by clustering technique using gene based approach. The proposed method, is based on the concept of common nearest neighbor clustering approach as in [2] and uses a fuzzy membership function as in [3] to identify the overlapping clusters as well.
The organization of the paper is as follows. In Section II, we review some of the important existing clustering methods in the context of clustering gene expression data. In Section III, the background of our work is given and in section IV, we discuss our algorithm, FLBC-I. A previous version of the algorithm was presented in [3]. In FLBC-I, the cluster expansion process is improved. In Section V, we report the experimental results and finally the conclusions and future works are presented in Section VI.
II. Related Work Clustering methods for gene expression data should be
capable of revealing the inherent structure of the data, extracting useful features from even noisy data, identifying the highly connected and embedded patterns in the data [4] and finding the relationships between the clusters and their sub-clusters. k-means [5] is a pioneering partition-based clustering algorithm that partitions the dataset into some pre-defined number of clusters by optimizing a predefined criterion. However, specification of the number of clusters, noise sensitivity, unsuitability in detecting arbitrary shaped clusters and inconsistency in yielding the same result on different runs of the algorithm are considered as its major demerits. In [4], the authors propose the Density-based Hierarchical Clustering method (DHC) that uses a density-based approach to identify co-expressed gene groups from gene expression data. DHC is suitable for detecting highly connected clusters but is computationally expensive and is dependent on two global parameters. Jarvis and Patrick

533
[6] first introduced the idea of defining the similarity of points in terms of their shared nearest neighbors. In [7], a k-nearest neighbor based density estimation technique has been exploited. Another density based algorithm proposed by [7] works in three phases: density estimation for each gene, rough clustering using core genes and cluster refinement using border genes. In [8], the authors present a density and shared nearest neighbor based clustering method. The similarity measure used is that of Pearson’s correlation and the density of a gene is given by the sum of its similarities with its neighbors. The use of shared nearest neighbor measure is justified by the fact that the presence of shared neighbors between two dense genes means that the density around the dense genes is similar and hence should be included in the same cluster along with their neighbors. In [2], a common nearest neighbor-based clustering technique (CNNC) for finding clusters over gene expression data is reported. CNNC attempts to find all the clusters over gene expression data qualitatively using a nearest neighbour-based approach and uses a regulation-based module for finding the sub clusters. A subspace clustering algorithm, CLIC, is proposed in [9]. CLIC first clusters the genes in individual dimensions and the ordinal labels of clusters in each dimension are then used for further full dimension-wide clustering. CLIC also finds the sub-clusters of the clusters detected in the first round of clustering which helps in finding more homogeneous groups in the data. Fuzzy clustering approaches have received considerable focus recently because of their capability to assign one gene to more than one cluster (fuzzy assignment), which may allow capturing genes involved in multiple transcriptional programs and biological processes. Fuzzy C-means (FCM), is an extension of K-means clustering and bases the fuzzy assignment of an object to a cluster on the relative distance between the object and all cluster centroids [10]. Many variants of FCM have been proposed in the past years, including a fuzzy clustering approach, FLAME [10], which detects dataset-specific structures by defining neighborhood relations and then neighborhood approximation of fuzzy memberships are used so that non-globular and nonlinear clusters are also captured. In [3], a fuzzy link based clustering (FLBC) is presented which uses the common nearest neighbor concept and uses the fuzzy membership function to cluster genes. The advantage of FLBC is that it is capable of detecting overlapping and interesting clusters. In [11], the authors discuss a gene analysis method called the LEAveone- out Forward selection method (LEAF) for discovering informative genes embedded in expression data. LEAF is an iterative forward selection method incorporating the concept of leave-one-out cross validation (LOOCV) and can identify genes that correspond to known biomarkers.
A. Discussion From our selected survey, we observe that most of the algorithms are dependent on several input parameters which are difficult to estimate. Gene expression data are usually high dimensional whereas, most of the existing algorithms are found to be costly with the increase in dimension. There is
also interconnection between genes and hence a shared nearest neighbor approach as in [2] would greatly help in identifying such interconnected genes. Gene expression data also contains intersecting and overlapping clusters, the identification of which is very important. This aspect has been explored in FLBC [3], and in this paper we are going to incorporate a cluster expansion step during clustering.
Figure. 1: (a) The Neighbor Graph (b) Link Graph (i and j
have a link between them)
III. Background of the Work Our algorithm is based on the concept of links. Our link based clustering deals with clustering among genes which are intensely associated to each other through common neighbor genes. The clustering is done on the genes on the basis of links (defined later in this section) existing between them. Following are some of the key concepts based on [2] which have been used in our approach.
Definition III.1 Neighbor: A gene gi is a neighbor of another gene gj if the similarity between them i.e., Sim(gi, gj) ≥δ where Sim(gi, gj) refers to the Pearson’s correlation coefficient [1] and δ a user defined threshold.
Definition III.2 Common Neighbor: A gene gi is said to be a common neighbor of another gene gj if both gi and gj have at least one shared or common neighbor between them i.e., gi has at least one neighbor which is also a neighbor of gj.
},...,,{),( 21 kji gggggCN where
),(,.....,),(,),( 21 kiii ggSimggSimggSim and
),(,.....,),(,),( 21 kjjj ggSimggSimggSim
Here, |CN(gi,gj)|≥1. In other words CN value is the number of shared or common nearest neighbors shared by two genes gi, gj.
Definition III.3 Link: Two genes gi, gj have a link between them if link(gi, gj) = {|CN(gi, gj)|≥α}, where α is a user defined parameter. An example scenario is shown in Fig. 1. Here in the neighbor graph each of the nodes represent genes and the edges in Fig. 1 (a) represent the neighbor connections i.e., two nodes will have an edge between them if they are
Rosy Sarmah

534
neighbors. The edge in Fig. 1 (b) represents the link connection i.e, two genes will have an edge between them in the link graph if the number of common neighbors is at least α. In this example, α = 3.
Definition III.4 Interconnected genes: Interconnected genes are a set consisting of ordered pairs of genes such that there is a link between every gene in the ordered pairs and there is a chain of links between the ordered pairs. For example, let us consider the genes i and j. Let there be a link between i and j. Let the set of interconnected genes be {(i, j), (i1, i2), (i3, g4), …, (j1, j2), (j3, j4), …}, where genes i, j has a link between them; i1 has a link with i, i2 has a link with i1 and so on. Similarly, j1 has a link with j, j2 has a link with j1 and so on. The scenario is depicted in Fig. 2. The set of all interconnected genes form an interconnection network.
Figure. 2: The interconnection network
Definition III.5 Initial Cluster: An initial cluster ICi is defined as a set of interconnected genes . Definition III.6 Core genes: The gene with the highest number of links in a cluster is known as a core gene. Definition III.7 Reachability: A gene gi is said to be reachable from a core gene gj, if gi belongs to the set of interconnected genes of gj. Definition III.8 Fuzzy Reachability: A gene gi is said to be fuzzy-reachable from a core gene gj, if maxui,j ≥ β, where, j = 1, 2,… , k and k is the total number of initial clusters. Definition III.9 Cluster: A cluster Ci is the set of all the reachable and fuzzy reachable genes. Definition III.10 Noise: Those genes which do not belong to any cluster are called noise genes. Link based clustering adopts a recursive approach for efficient clustering. The aim of the clustering is to expand the neighbors of a gene to check if a link exists. As soon as a gene finds a link, its cluster_id is assigned and termed as classified. Classified genes are not further taken into consideration for expansion.
IV. FLBC-I Our Fuzzy Link Based Clustering (FLBC-I) identifies the initial clusters by using a common nearest neighbor based approach (Step 1) and then finds the overlapped and intersecting clusters by a fuzzy based approach to obtain the
final clustering of the data (Step 2). Step 1 of FLBC-I proceeds by first finding the neighbors for each gene based on definition III.1. For finding the neighbors we use the Pearson’s Correlation measure as the similarity metric. Next, the common neighbors are found by using Definition III.2. Cluster expansion starts with a pair of genes gi, gj that have a link between them. In FLBC [3], all the common neighbors of that pair of genes are also classified with the same cluster id as gi, gj and cluster expansion proceeds by finding the link of each of the common neighbors in a depth first manner.
FLBC-I on the other hand sets a higher bar for inclusion of common neighbors into the cluster. Here, instead of assigning the same cluster_id to the common neighbors of gi, gj, the common neighbors are recursively checked if they in turn fulfil the link property w.r.t. gi, gj. The working of FLBC-I is discussed next.
A. Procedure of FLBC-I
FLBC-I starts with an unclassified gene gi and searches for another unclassified gene gj with which it has a link (as defined in Definition III.3). Both gi, gj are assigned to cluster, say Ccurrent. Then each of the unclassified common neighbors of genes gi, gj is checked to ascertain if they may be assigned to Ccurrent. Let {ga, gb, gc, gd} be the common neighbors of gi, gj. For inclusion of ga into Ccurrent, ga should have a link to any of the genes in cluster Ccurrent. An example scenario is shown in Fig. 3. Let the link threshold be α = 4. Then according to the neighbor list of gi, gj, there are at least four common neighbors to both and hence they are inserted into cluster Ccurrent. Next, the first common neighbor (ga) to both gi, gj is chosen for finding if it can be inserted into the cluster. The neighbor list of ga is checked to see if it forms a link with any of the genes in cluster Ccurrent. It can be seen from the figure that ga has a link to gi as well as gj i.e., the number of common neighbors it shares with any of the genes already included in the cluster ≥ α. Therefore, ga is inserted into the Ccurrent. The same rule applies for rest of the common neighbors. The whole process is repeated till no more unclassified gene can be inserted into this cluster, Ccurrent. Cluster expansion then starts forming the next cluster with the next pair of unclassified genes with a link between them.
This process is iterated till no more genes can be classified or no more links are found. The step-wise representation of step 1 of FLBC-I is given next:
Let Gu be the set of all genes, Ccurrent be the current cluster under consideration and Gc be the set of classified genes.
Initially all genes are unclassified.
1. Consider an arbitrary unclassified gene gi from Gu. 2. Consider another unclassified gene gj from {Gu−Gc}. 3. Check if gi and gj satisfies the link property, then classify gi and gj into cluster Ccurrent. 4. Check if any of the genes gk, from the set of common neighbors of the genes in Ccurrent, satisfies the link property with any of the genes in Ccurrent, then classify gk into Ccurrent. 5. Repeat steps 2 to 4 till no more genes can be included into Ccurrent. 6. Repeat steps 1 to 5 till no more genes may be assigned to any cluster.
Gene Expression Data Clustering using a FuzzyLink based Approach

Figure. 3: An example of the expansion of common neighbors The Step 1 of FLBC-I algorithm uses the concept of link to support crisp and clear decision on the membership of a gene in a cluster. For two genes to be linked there has to be α number of common neighbors, which depicts that the two genes must have an intense similarity to many common neighbors. It is efficient even in presence of noise. But Step 1 of FLBC-I suffers from the disadvantage that it is not effective in detecting overlapping and intersecting clusters. With higher value of CN threshold, α, the algorithm gives clusters which are highly interconnected with a high degree of similarity i.e. highly coherent gene clusters. In step 2, a fuzzy approach is used to detect the intersecting and embedded clusters. The Step 2 of FLBC-I is based on the cluster result of Step 1 and also uses the concept of fuzzy membership to find the clusters. Fuzzy link based clustering applies the concepts of fuzzy clustering and link based clustering for deciding the coherency of genes. The algorithm for this approach makes use of Link based clustering to detect genes with higher degree of similarity. The Step 1 of FLBC-I is executed with a high value of α to obtain the highly coherent clusters. Here, a lot of genes which are in the bordering area of the clusters are not classified. These genes (also known as candidate genes) may be assigned to the clusters using a fuzzy approach to avoid this loss of useful information. From the clusters obtained by Step 1, the core genes of the clusters are computed. We use another parameter β, to incorporate these candidate genes into a cluster. We use the fuzzy membership function given in [12], to find the degree of membership of every candidate gene to each of the k clusters detected in Step 1. The membership function is given next.
k
l
m
jl
ji
gC
f
ji
gCdgCd
u
1
12,
),(),(
1 (1)
where gj is a candidate gene, k is the number of clusters detected in Step 1, u is the fuzzy membership matrix such that uij ϵ [0, 1] is the membership degree of gj to cluster Ci. C = {C1,C2, ... ,Ck} is the set of initial clusters and Ci is the current cluster for which the membership of gj is to be determined and Cl are the initial clusters present, d is a distance measure between the core gene of an initial cluster and a candidate gene. The factor mf is called fuzziness and is usually equal to 2 [12]. The membership for each of the candidate genes is computed and assigned to that cluster for which it has the highest value according to Definition III.8.
Figure. 4: Results of FLBC-I on Dataset 1
The cluster expansion in Step 2 checks if a gene is a candidate gene and finds if its highest membership value to a core gene is also greater than β, then it is assigned the same cluster_id of the core gene to which it is fuzzy reachable. For those candidate genes which have similar membership value to
535 Rosy Sarmah

more than one core gene are assigned to both the clusters and thus have more than one cluster_id. These are the genes which give the overlapping and intersecting clusters. This step is repeated until all candidate genes are assigned cluster_id or noise_id.
V. Performance Evaluation The performance of the proposed technique was evaluated in light of three real-life datasets. We used a Pentium IV machine of 2.4GHz speed with 2.00 GB RAM. The implementation was done in Java in windows platform. The datasets used and their characteristics are given in Table 1. The results of FLBC-I on Dataset 1 and Dataset 2 are given in Figures 4 and 5. The black lines in each of the cluster graphs show the result of FLBC-I step 1. After step 2 of FLBC-I some more genes are added to the clusters and those genes are shown in red dotted lines. It can be seen that FLBC-I gives clusters of coherent genes. The clusters obtained by FLBC-I on Dataset 3 are illustrated in Fig. 6.
Table 1: Datasets used for evaluating CNNC
Serial No.
Dataset No. of genes
No of conditions
1 Subset of Yeast Cell Cycle [13] 384 17
2 Rat CNS [14] 112 9
3 Yeast Diauxic Shift [15] 6089 7
Figure. 5: Results of FLBC-I on Dataset 2
A. Cluster Quality For validating our clustering result, we employ the homogeneity, separation measures as given in [1] and z-score measure of [16]. The Homogeneity and separation values for FLBC-I for different datasets as given in Table 2 show that the clusters obtained are quite homogeneous. 1) Z-score Z-score is calculated by taking into account the relationship between the clustering result and the functional annotation of
the genes in that cluster. The Gibbons ClusterJudge [16] tool has been used here to calculate the z-score. A higher z-score indicates the clustering result is more biologically relevant. To test the performance of the clustering algorithm, we compare the clusters identified by FLBC-I with the results from k-means [5], FCM [12] and CNNC [2]. In this paper, the reported z-score is averaged over 50 repeated experiments. The result of applying the z-score on Dataset 1 is shown in Table 3, which clearly shows that FLBC-I outperforms k-means, and FCM w.r.t. the cluster quality. However, the performance of FLBC-I is less than CNNC for both Dataset 1 and Dataset 3 (Table 4). This is due to the fact that CNNC gives disjoint clusters but there are also overlapping clusters in FLBC-I. 2) P-value To evaluate the statistical significance of the genes in a cluster, we compute the p-value for each GO category. P-value represents the probability of observing the number of genes from a specific GO functional category within each cluster. A low p-value indicates the genes belonging to the enriched functional categories are biologically significant in the corresponding clusters. We have obtained p-value using the software FuncAssociate [17], which is a web-based tool that accepts as input a list of genes, and returns a list of GO attributes that are over- (or under-) represented among the genes in the input list. The enriched functional categories for some of the clusters obtained by FLBC-I on Dataset 3 are listed in Table 6. To restrict the size of the paper, we have reported only a part of the results and p-values less than e-07. The functional enrichment of each GO category in each of the clusters is calculated by its p-value. 3) Q-value The Q value for a particular gene is the proportion of false positives among all genes that are as or more extremely differentially expressed. Q-value is also defined as the minimal False Discovery Rate (FDR) at which this gene appears significant. The GO categories and Q-values from a FDR corrected hyper geometric test for enrichment are reported in GeneMANIA. The estimation of Q-values is done using the Benjamini Hochberg procedure [18]. We have used GeneMANIA [19] which is a web interface for generating hypotheses about gene function, analyzing gene lists and prioritizing genes for functional assays. GeneMANIA extends the list of query genes with functionally similar genes that it identifies using available genomics and proteomics data. GeneMANIA displays results as an interactive network, illustrating the functional relatedness of the query and retrieved genes. The different networks supported by GeneMania are co-expression, physical interaction, genetic interaction and co-localization. On the query set of genes, GeneMANIA assigns a percentage weight to each of these networks.
The genes in each of the clusters obtained by FLBC-I were given as the list of query genes to GeneMania and the different GO categories of the clusters along with their Q-values are displayed for some of the clusters of Dataset 1 are listed in Table 7. The corresponding networks for cluster 11 and 20 for Dataset 1 are shown in Fig. 7 and 8. The percentages of the different networks are also given in figures. The values are obtained by choosing the default network weighting option, i.e., automatically selected weighting
536Gene Expression Data Clustering using a FuzzyLink based Approach

method. The networks for cluster 4 and 18 of Dataset 3 are given in Fig. 9 and 10. We can conclude from the tables and figures that FLBC-I generates clusters of highly enriched GO categories.
Figure. 6: Results of FLBC-I on Dataset 3
Table 2: Homogeneity and Separation values for FLBC-I Datasets No. of Clusters Homogeneity Separation Dataset 1 18 0.94 0.09 Dataset 2 06 0.90 0.15 Dataset 3 14 0.95 -0.08
Table 3: z-scores for FLBC-I and its counterparts for Dataset 1 Method Applied No. of Clusters z-score k-means 18 2.48 FCM 18 2.49 CNNC 15 3.04 FLBC-I 18 2.59
Table 4: z-scores for FLBC-I and its counterparts for Dataset 3 Method Applied No. of Clusters z-score k-means 14 16.08 FCM 14 13.98 CNNC 14 14.24 FLBC-I 14 13.77
Our Fuzzy link based clustering approach combines the classical as well as the fuzzy set theory approach to clustering genes. It provides a better precise solution for handling the imprecise data i.e. any gene that might belong to different clusters with different degree of membership. A gene is assigned to a cluster with which it has the highest membership value. Similar membership values for genes w.r.t. different clusters helps in the detection of overlapped clusters. Even after fuzzy clustering for genes, it is still good enough for detecting noise genes which could not obtain a membership in any cluster because of the threshold β used for deciding membership in a cluster.
The FLBC-I clustering provides good results for clustering in two steps. In the first step it finds highly coherent genes. In the second step it applies a fuzzy clustering on the genes which have not been classified in the first step. For assigning the membership of such genes we have used another parameter β, which serves as the threshold for a gene to be qualified as a member of a cluster. A comparatively higher value of β, ensures that the algorithm is still successful in detecting the noise genes.
Performance of fuzzy link based clustering is almost comparable to CNNC [2]. Nevertheless, this approach of clustering decreases the quality of the clusters because the incorporation of some of the candidate genes might decrease the coherency of the cluster. The algorithm gives clusters which are dense with higher value of CN, with a good degree of similarity. These genes represent a very fine level of clustering or it gives the set of highly coherent patterns. We note here that some of the algorithms require an input parameter to be specified i.e. number of clusters as in k-means and FCM, and this input parameter severely affects the clustering as revealed by the variation in cluster validity measures with change of values for these parameters. On the other hand the proposed method FLBC-I do not require the number of clusters apriori and has been found to yield quite comparable results.
537 Rosy Sarmah
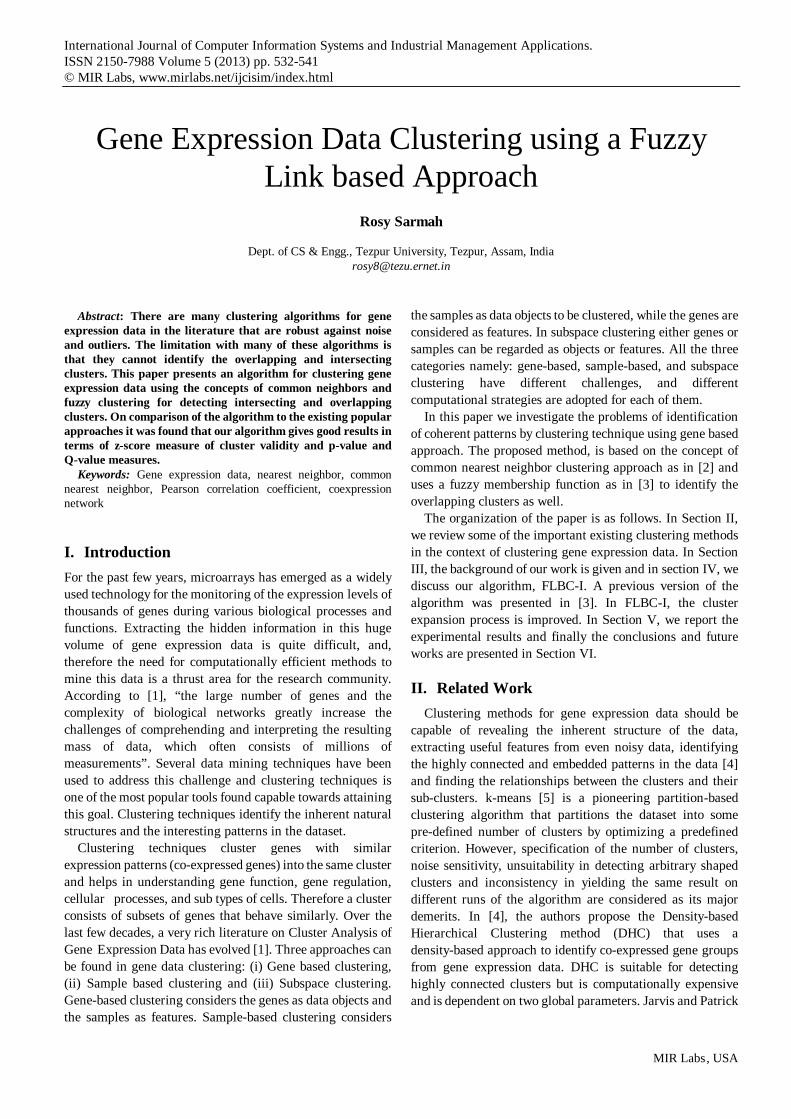
VI. Conclusion
This paper discusses an effective technique for clustering gene expression data using a common neighbor and fuzzy based approach. The values of the tuning parameters, δ and α, play a key role in the improvement of the performance of the proposed technique. An appropriate value for the tuning parameter δ may be selected by cross validation. Based on our experiments, it has been observed that the value of δ within 0.8–0.95 gives excellent results for the tested datasets. It should be noted that higher the value of δ, better is the coherence. However, work is going on to develop a heuristic method for adaptive selection of the tuning parameter α and β. Performance evaluation over real data show that the proposed method significantly improves the performance over some of the traditional methods such as FCM and kmeans even in presence of outliers. Also significantly good z-, p- and q- values establish the effectiveness of the proposed FLBC-I while comparing with its other counterparts. FLBC-I may be modified to make it parameter independent and to detect intrinsic and embedded cluster.
Figure. 7: The network for cluster 11 of Dataset 1. We used the default query, using all default parameters. The weights of each of the networks are also given.
Table 5: P-values of Dataset 1
538Gene Expression Data Clustering using a FuzzyLink based Approach

Table 6: P-values of Dataset 3
Acknowledgments
This work is a partial outcome of a research project funded by DST in collaboration of MIU, ISI, Kolkata, India.
Table 7: Q-values of Dataset 1 obtained for some clusters
References
[1] Jiang, D., Tang, C., and Zhang, A. “Cluster analysis for gene expression data: A survey”, Available: www.cse.buffalo.edu/DBGROUP/bioinformatics/papers/survey.pdf, 2003. [2] Goswami, M., Sarmah, R. and Bhattacharyya, D. K. “CNNC: a common nearest neighbour clustering approach for gene expression data”, International Journal of Computational Vision and Robotics 2011, 2(2), pp. 115 - 126, 2011. [3] Bora, G. M. and Sarmah, R. “FLBC: A Fuzzy Link based Clustering approach for gene expression data”. In Proceedings of the World Congress on Information and Communication Technologies (WICT), pp. 892 - 897, 2011. [4] Jiang, D., Pei, J. and Zhang A. “DHC: a density-based hierarchical clustering method for time series gene expression data’. In Proceedings of the 3rd IEEE
539 Rosy Sarmah
International Symposium on Bioinformatics and Bioengineerin, pp. 393, Bethesda, Maryland, USA, 2003. [5] McQueen, J.B. “Some methods for classification and analysis of multivariate observations”. In Proceedings of the Fifth Berkeley Symposium on Mathematical Statistics and Probability, Vol. 1, pp. 281-297, University of California Press, 1967. [6] Jarvis, R.A. and Patrick, E.A. “Clustering using a similarity measure based on Shared Nearest Neighbors”, IEEE Transactions on Computers, 22(11), pp. 1025-1034, 1973. [7] Chung, S., Jun, J. andMcLeod, D. “Mining gene expression datasets using density based clustering”, Technical Report, USC/IMSC, University of Southern California, No. IMSC-04-002, 2004. [8] Syamala, R., Abidin, T. and Perrizo, W. “Clustering Microarray Data based on Density and Shared Nearest Neighbor Measure”. In Proceedings of the 21st ISCA International Conference on Computers and Their Applications (CATA-2006), pp. 23-25, 2006. [9] Yun, T., Hwang, T., Cha, K. and Yi, GS. “CLIC: clustering analysis of large microarray datasets with individual dimension-based clustering”, Nucleic Acids Research, Vol. 38, pp. W246-W253, 2010. [10] Fu, L. and Medico, E. “FLAME: a novel fuzzy clustering method for the analysis of DNA microarray data”, BMC Bioinformatics, 8(3), 2007. [11] Fukuta1, K., Nagashima, T., Uozumi, T. and Okada, Y. “A Novel Gene Analysis Method for Biomarker Mining in DNA Microarray Data”, International Journal of Computer Information Systems and Industrial Management Applications, Vol. 3, pp. 256-263, 2011. [12] Bezdek, J. C. Pattern Recognition with Fuzzy Objective Function Algorithms, Plenum, New York, USA, 1981. [13] Cho, R. J., Campbell, M., Winzeler, E., Steinmetz, L., Conway, A., Wodicka, L., Wolfsberg, T., Gabrielian, A., Landsman, D. and Lockart, D. “A genome-wide transcriptional analysis of the mitotic cell cycle”, Molecular Cell, 2(1), pp. 65-73, 1998.
[14] Wen, X., Fuhrman, S., Michaels, G.S., Carr, D.B., Smith, S., Barker, J.L. and Somogyi, R. “Large-scale temporal gene expression mapping of central nervous system development”, PNAS, 95(1), pp. 334-339, 1998. [15] DeRisi, J.L., Iyer, V.R.and Brown, P.O. “Exploring the Metabolic andGenetic Control of Gene Expression on a Genomic Scale”, Science, Vol. 278, pp. 680-686, 1997. [16] Gibbons, F. and Roth, F. “Judging the quality of gene expression based clustering methods using gene annotation”, Genome Research, Vol. 12, pp. 1574-1581, 2002. [17] Berriz, F. G. et. al. “Characterizing gene sets with Funcassociate”, Bioinformatics, Vol. 19, pp. 2502-2504, 2003. [18] Benjamini, Y. and Hochberg, Y. “Controlling the false discovery rate: A practical and powerful approach to multiple testing”, Journal of the Royal Statistical Society. Series B (Methodological), Vol. 57, pp. 289 - 300, 1995. [19] Warde-Farley, D., Donaldson, S. L., Comes, O., Zuberi, K., Badrawi, R., Chao, P., Franz, M., Grouios, C., Kazi, F., Lopes, A.Maitland, C. T.,Mostafavi, S.,Montojo, J. Shao, Q., Wright, G., Bader, G. D. and Morris, Q. “The GeneMANIA prediction server: biological network integration for gene prioritization and predicting gene function”, Nucleic Acids Research, Vol. 38, pp. W214-W220, 2010.
Author Biographies
Dr. Rosy Sarmah is an Assistant Professor in the Dept. of Computer Science and Engineering, Tezpur University, Tezpur, India. She received her Ph.D. (Computer Science) from Tezpur University in the year 2012. Her research interests include Image Processing, Clustering and Bioinformatics. Till 2010, she held the surname of Das and her published papers were under the name of Rosy Das. She has a total of seven international journal papers, two book chapters, nine international and three national conference papers. She has recently co-authored a book titled “Clustering Techniques in Spatial Data Analysis” published by Verlag DM AG & Co, KG, Germany.
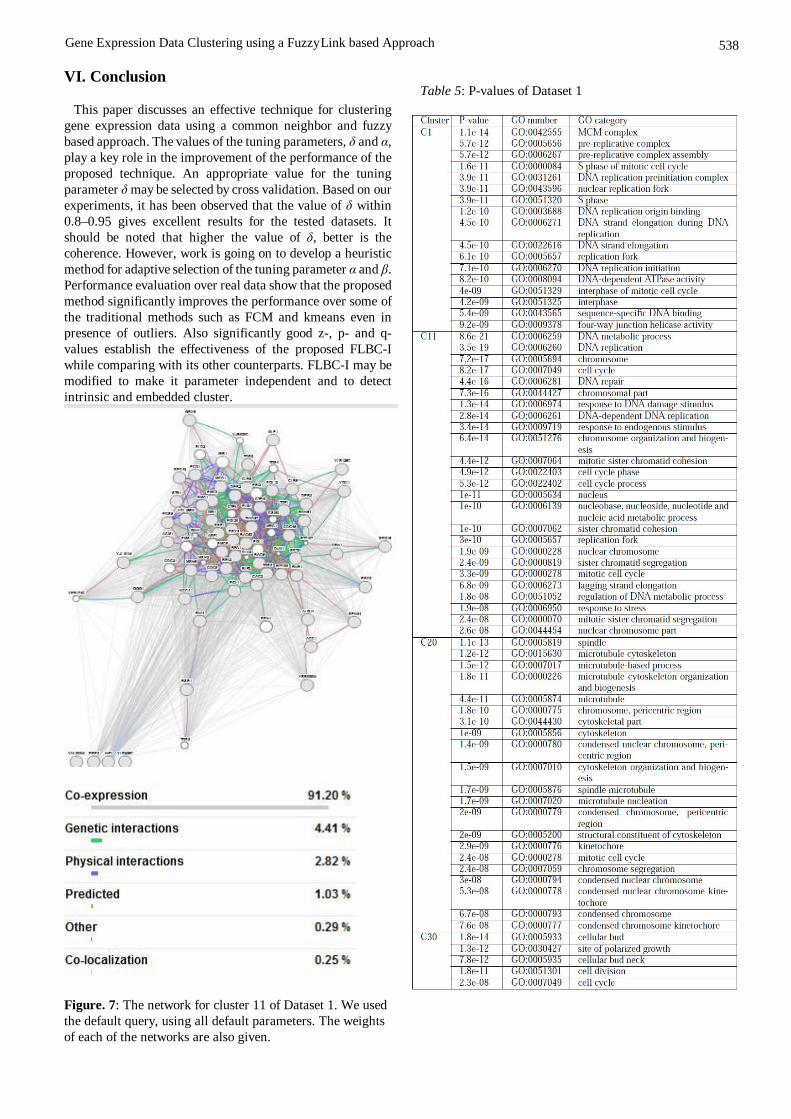
Figure. 8: The network for cluster 20 of Dataset 1. We used the default query, using all default parameters. The weights of each of the networks are also given.
540Gene Expression Data Clustering using a FuzzyLink based Approach

Figure. 9: The network for cluster 4 of Dataset 3.
Figure. 10: The network for cluster 18 of Dataset 3.
541 Rosy Sarmah

![Relative clustering validity criteria: A comparative overviewhcao/paper/icredits/2010...Clustering techniques can be broadly divided into three main types [7]: overlapping, partitional,](https://static.fdocuments.in/doc/165x107/5f100dbc7e708231d4473706/relative-clustering-validity-criteria-a-comparative-overview-hcaopapericredits2010.jpg)