
Gene conversion disparity in yeast:its extent, multiple origins, and effects onallele frequencies
15
Heredity 80 (1998) 538–552 Received 19 September 1996 Gene conversion disparity in yeast: its extent, multiple origins, and effects on allele frequencies BERNARD C. LAMB* Biology Department, Imperial College of Science, Technology and Medicine, London SW7 2BB, U.K. The extent of disparity in gene conversion direction in yeast (Saccharomyces cerevisiae) is important for recombination mechanisms and for effects of conversion on allele frequencies in populations. An analysis of published and unpublished data demonstrates that yeast frequently shows significant and extensive conversion disparity, contrary to many published statements. All types of mutation – base-substitutions, frameshifts and longer deletions and additions – can show significant 6:2/2:6 and/or 5:3/3:5 disparity. There was little correlation between the occurrence of 6:2/2:6 and 5:3/3:5 disparities; when both were significant, they were more often in opposite directions than in the same direction. Surprisingly, there was little correlation between a mutation’s molecular nature and its disparity properties, which generally seem unpredictable. Disparity in yeast has multiple origins. From the equations discussed, all dispar- ity types can be explained by one or more of: correction direction disparity, chromatid invasion disparity (including cases caused by different frequencies of double-strand breaks or gaps in nonsister homologous chromatids), strand invasion disparity, and different correction frequen- cies for the two types of mispair for a heterozygous mutation. Levels of overall disparity and of conversion frequency mean that conversion must often change allele frequencies in sexually reproducing yeast populations. Keywords: allele frequencies, disparity, gene conversion, recombination, Saccharomyces cere- visiae, yeast. Introduction The extent to which yeast shows disparity in conver- sion direction for alleles at a locus is important for mechanisms of conversion and crossing-over, and for population genetics and evolution. Parity in conver- sion direction for yeast was a major line of evidence offered for the original double-strand break-repair (DSBR) model (Szostak et al., 1983; Orr-Weaver & Szostak, 1985). Frequent disparity would be good evidence for the modified DSBR model (Sun et al., 1991), where most conversions come from hybrid DNA, not from double-strand break-repair. The extent of disparity for various types of mutation is crucial for assessing the influence of gene conversion on allele frequencies in populations (Lamb & Helmi, 1982; Lamb, 1985, 1986). There are now sufficient yeast data to study the origins and influ- encing factors of different types of disparity, such as 6:2/2:6 and 5:3/3:5 disparity, which can be in oppo- site directions, say with preferential conversion to wild-type in 5:3 and 3:5 segregations and preferen- tial conversion to mutant in 6:2 and 2:6s. Firm statements that yeast shows parity in direc- tion of conversion, not disparity, have been made, even in recent reviews (Fogel & Mortimer, 1969; Fogel et al., 1971; Orr-Weaver & Szostak, 1985; Nicolas & Petes, 1994; Petes & Pukkila, 1995). Szostak et al. (1983) stated that in yeast all classes of mutations and all mutations show parity. Evidence (Lamb, 1986) that disparity was common in yeast has received insufficient attention. The extent of disparity in yeast has here been re-examined as there are now excellent data with large sample sizes, including mutations of known molecular nature (see references in Tables 1–6). The recent data were obtained for other purposes, not for disparity. The aims here were: (i) to study the extent, direc- tion and origins of disparity for different molecular *E-mail: [email protected] ©1998 The Genetical Society of Great Britain. 538
Transcript of Gene conversion disparity in yeast:its extent, multiple origins, and effects onallele frequencies

Heredity 80 (1998) 538–552 Received 19 September 1996
Gene conversion disparity in yeast:its extent, multiple origins, and effects on
allele frequencies
BERNARD C. LAMB*Biology Department, Imperial College of Science, Technology and Medicine, London SW7 2BB, U.K.
The extent of disparity in gene conversion direction in yeast (Saccharomyces cerevisiae) isimportant for recombination mechanisms and for effects of conversion on allele frequencies inpopulations. An analysis of published and unpublished data demonstrates that yeast frequentlyshows significant and extensive conversion disparity, contrary to many published statements.All types of mutation – base-substitutions, frameshifts and longer deletions and additions – canshow significant 6:2/2:6 and/or 5:3/3:5 disparity. There was little correlation between theoccurrence of 6:2/2:6 and 5:3/3:5 disparities; when both were significant, they were more oftenin opposite directions than in the same direction. Surprisingly, there was little correlationbetween a mutation’s molecular nature and its disparity properties, which generally seemunpredictable. Disparity in yeast has multiple origins. From the equations discussed, all dispar-ity types can be explained by one or more of: correction direction disparity, chromatid invasiondisparity (including cases caused by different frequencies of double-strand breaks or gaps innonsister homologous chromatids), strand invasion disparity, and different correction frequen-cies for the two types of mispair for a heterozygous mutation. Levels of overall disparity andof conversion frequency mean that conversion must often change allele frequencies in sexuallyreproducing yeast populations.
Keywords: allele frequencies, disparity, gene conversion, recombination, Saccharomyces cere-visiae, yeast.
Introduction
The extent to which yeast shows disparity in conver-sion direction for alleles at a locus is important formechanisms of conversion and crossing-over, and forpopulation genetics and evolution. Parity in conver-sion direction for yeast was a major line of evidenceoffered for the original double-strand break-repair(DSBR) model (Szostak et al., 1983; Orr-Weaver &Szostak, 1985). Frequent disparity would be goodevidence for the modified DSBR model (Sun et al.,1991), where most conversions come from hybridDNA, not from double-strand break-repair. Theextent of disparity for various types of mutation iscrucial for assessing the influence of gene conversionon allele frequencies in populations (Lamb &Helmi, 1982; Lamb, 1985, 1986). There are nowsufficient yeast data to study the origins and influ-encing factors of different types of disparity, such as
6:2/2:6 and 5:3/3:5 disparity, which can be in oppo-site directions, say with preferential conversion towild-type in 5:3 and 3:5 segregations and preferen-tial conversion to mutant in 6:2 and 2:6s.
Firm statements that yeast shows parity in direc-tion of conversion, not disparity, have been made,even in recent reviews (Fogel & Mortimer, 1969;Fogel et al., 1971; Orr-Weaver & Szostak, 1985;Nicolas & Petes, 1994; Petes & Pukkila, 1995).Szostak et al. (1983) stated that in yeast all classes ofmutations and all mutations show parity. Evidence(Lamb, 1986) that disparity was common in yeasthas received insufficient attention.
The extent of disparity in yeast has here beenre-examined as there are now excellent data withlarge sample sizes, including mutations of knownmolecular nature (see references in Tables 1–6).The recent data were obtained for other purposes,not for disparity.
The aims here were: (i) to study the extent, direc-tion and origins of disparity for different molecular*E-mail: [email protected]
©1998 The Genetical Society of Great Britain.538
types of mutation; (ii) to see whether equations forrecombination (Lamb, 1996a,b) can account fordisparity phenomena, including opposite-directiondisparity in 5:3/3:5 and 6:2/2:6 octads; and (iii) toassess the extent to which gene conversion canchange allele frequencies. The data of Detloff et al.(1991), on nine different base-substitutions in asingle his-4 codon, enable one to study effects ofdifferent types of mispair.
Although yeast has unordered meiotic tetrads, notoctads, the ability to detect postmeiotic segregationfrom sectored colonies means that conversion ratioscan be given as corresponding octad ratios, e.g.aberrant 4:4 and 5:3. To help understand the causesof disparity, the parameters of conversion are givenin Table 1, where a, b, g1, g2 and d relate to hybrid-DNA (hDNA) formation, g relates to double-strandgap frequency, and p, q, r and s relate to correctionin heterozygotes of mispairs (base-substitutions) ornonpairs (frame-shifts or longer additions ordeletions). Allele ratios are given as + (wild-type):m (mutant). Hybrid DNA could arise as a result ofinitiation by double-strand breaks or gaps, or by
other means, as in the Meselson & Radding (1975)model. Although double-strand gap-repair can causeconversion in yeast, conversion will usually bediscussed as arising from hDNA, because resultsfrom yeast and filamentous fungi fitted expectationsof conversion from hDNA, not from double-strandgaps (Lamb, 1987; Detloff et al., 1991), althoughdouble-strand breaks probably initiate the hDNA.On the modified DSBR model (Sun et al., 1991),most conversions arise from hDNA, not fromdouble-strand gap-repair.
The type of hDNA, symmetric or asymmetric,affects disparity. From symmetric hDNA, 6:2 and 2:6asci need two corrections in the same direction(both to + or both to m), 5:3s and 3:5s need onecorrection and one noncorrection, and aberrant 4:4shave no corrections. From asymmetric hDNA, 6:2sand 2:6s need one correction and 5:3s and 3:5s haveno correction. From symmetric hDNA, preferentialcorrection of mispairs to + produces more 6:2s than2:6s and more 5:3s than 3:5s, with greater disparityamongst 6:2s and 2:6s than amongst 5:3s and 3:5s(Rossignol et al., 1979). From symmetric DNA, the
Table 1 Symbols and definitions for the parameters for gene conversion between two alleles at one locus
The parameters are for meiotic hybrid DNA formation at a given site, using a +/m heterozygote as an example; at thesingle point of mutation, the + chromatids have base pair AB and the mutant chromatids have base pair XY. That is for abase-substitution mutant; for a frame-shift, there would be two nonpairs, rather than mispairs. For an Aa heterozygote, Atakes the place of + and a takes the place of m. Except for g1 and g2, the terminology is based on that of Kalogeropoulos& Thuriaux (1982).
(i) Hybrid DNA formationg1 The probability of hDNA forming between any two homologous nonsister chromatids at the given site, if no hDNA hasalready formed in any chromatid at that site in the bivalent.g2 The probability of hDNA being formed at that site in the remaining pair of homologous nonsister chromatids, if hDNAis already formed, or being formed, at that site between the other two nonsister homologues.a The probability that hDNA formed at that site is asymmetric; 1µa is the probability that it is symmetric.b The probability that the invading chromatid for that site in asymmetric hDNA carries the + allele; 1µb is theprobability that it carries the m allele.d The probability that the invading single strand in asymmetric hDNA has a given polarity, say 3p5p; 1µd is the probabilitythat it has 5p3p polarity.
In symmetric hDNA, AY mispairs occur in previously + chromatids by d events, and in previously m chromatids by (1µd)events; XB mispairs occur in previously m chromatids by d events, and in previously + chromatids by (1µd) events. Inasymmetric hDNA, AY mispairs occur in previously m chromatids by b(1µd) events, and in previously + chromatids by(1µb)d events; XB mispairs occur in previously m chromatids by bd events, and in previously + chromatids by(1µb)(1µd) events.
(ii) Hybrid DNA mispair (or nonpair) correctionp The probability of mispair AY being repaired; 1µp are not repaired.q The probability of mispair XB being repaired; 1µq are not repaired.r The probability of AY being repaired to+, given that it is repaired; 1µr are repaired to m, when repaired.s The probability of XB being repaired to+, given that it is repaired; 1µs are repaired to m, when repaired.
If conversions occur by double-strand gap-repair (Orr-Weaver & Szostak, 1985), an additional parameter is needed, g, forthe chance of the heterozygous site being involved in double-strand gap formation and repair. See Lamb (1996a,b) forequations.
GENE CONVERSION DISPARITY IN YEAST 539
© The Genetical Society of Great Britain, Heredity, 80, 538–552.
direction but not the extent of disparity shouldgenerally be the same in 6:2/2:6 asci as in 5:3/3:5 asciwhen disparity arises by correction direction biases.From asymmetric hDNA, 6:2/2:6 disparity could beproduced by correction direction disparity (r80.5,and/or s80.5), but 5:3/3:5 disparity could not resultfrom correction direction disparity. 5:3/3:5 disparityfrom asymmetric hDNA could arise if there weredifferent frequencies with which + and m chromat-ids invaded the nonsister chromatids (ba0.5 ors0.5; Table 1), which would also affect 6:2/2:6disparity in the same direction. 5:3/3:5 and 6:2/2:6disparity could also arise, usually in opposite direc-tions, from asymmetric hDNA when the strand inva-sion frequency is biased (d80.5) and the two typesof mispair, AY and XB, correct with differentfrequencies, p8q. Orr-Weaver & Szostak (1985)reviewed evidence that there is little symmetrichDNA in yeast meiotic recombination.
Materials and methods
Details were given in the original papers. Disparityanalyses are by the present author using the follow-ing formulae.
6:2/2:6 disparity as a percentage =[(6:2µ2:6)Å100]
(6:2+2:6),
where 6:2, etc. stand for the numbers of that type ofoctad.
5:3/3:5 disparity as a percentage =[(5:3µ3:5)Å100]
(5:3+3:5).
Overall disparity =[(6:2+5:3)µ(2:6+3:5)]Å100
6:2+5:3+2:6+3:5.
Disparity favouring wild-type gives positive dispar-ity values, disparity favouring mutant gives negativevalues and parity gives zero values. Significancetesting was by x2, using Yates’ correction if anyclass’s expected numbers were five or fewer.Formulae for the effects of conversion on allelefrequencies were given by Lamb & Helmi (1982)and Lamb (1986): c is conversion frequency as afraction; d is bµ0.5, where b is the overall fractionof wild-type alleles in asci with aberrant segregationratios:
(8:0Å8)+(7:1Å7)+(6:2Å6)+(5:3Å5)
b =+(3:5Å3)+(2:6Å2)+(1:7Å1)
8Åno. of asci with aberrant segregation ratios.
The force of gene conversion on allele frequencies,y, is cd; d and y have positive values if disparityfavours the wild-type allele, negative values if themutant allele is favoured, and are zero if there is nodisparity.
Results
Disparity significance in relation to sample sizes
Finding significant disparity depends on having suffi-ciently large samples. For 6:2/2:6 disparity inTables 2 and 3, all eight data sets with fewer than 106:2s plus 2:6s had no significant disparity. Of 11 setswith 10–19 6:2s plus 2:6s, only one (9%) had dispar-ity significant at PR0.05. Of 18 sets with 50–99 6:2splus 2:6s, eight (44%) had no significant disparity,five (28%) had disparity significant at PR0.05 andfive (28%) had disparity significant at PR0.01; ofeight sets with more than 400 6:2s plus 2:6s, two(25%) had no significant disparity, two (25%) haddisparity significant at PR0.05 and four (50%) haddisparity significant at PR0.01. Many cases of nosignificant disparity in yeast might therefore havehad significant disparity had the samples of conver-sion asci been larger.
Disparity of base-substitutions
Table 2 shows 48 data sets on heterozygous singlebase-substitutions. Twenty-two (46%) had significant6:2/2:6 disparity, 14 with disparity to wild-type andeight to mutant. Nine (19%) had significant 5:3/3:5disparity, three to + and six to m. Eighteen (38%)had significant overall disparity, 10 to + and eightto m. Twenty-six (54%) out of 48 sets showed one ormore of these three types of disparity significant atPR0.05 or 0.01. The statements that yeast showsparity in conversion direction are thus incompatiblewith the evidence.
Where sample sizes of convertant octads werelarge, even 7% disparity was significant, e.g. thr1. In35 out of 48 data sets, there were fewer than 30segregations in 5:3s plus 3:5s, when only extremedisparity would be significant. For samples of 30 ormore relevant conversion asci, significant 5:3/3:5disparity occurred in seven out of 13 data sets(54%), significant 6:2/2:6 disparity occurred in 22out of 43 data sets (51%) and significant overalldisparity occurred in 15 out of 43 data sets (35%).Because there were usually many more 6:2s and 2:6sthan 5:3s and 3:5s, the different sample sizes make itdifficult to determine whether 5:3/3:5 disparity israrer than 6:2/2:6 disparity: these figures show themto be about equally frequent.
540 B. C. LAMB
© The Genetical Society of Great Britain, Heredity, 80, 538–552.
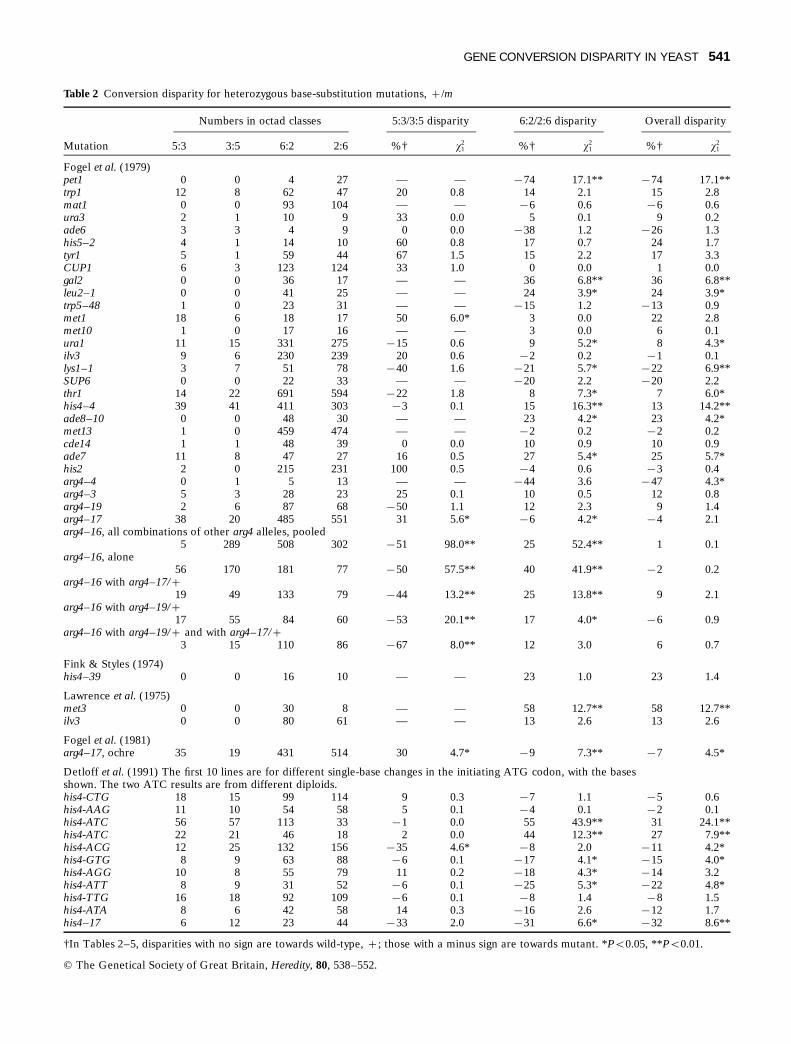
Table 2 Conversion disparity for heterozygous base-substitution mutations, +/m
Numbers in octad classes 5:3/3:5 disparity 6:2/2:6 disparity Overall disparity
Mutation 5:3 3:5 6:2 2:6 %† x21 %† x2
1 %† x21
Fogel et al. (1979)pet1 0 0 4 27 — — µ74 17.1** µ74 17.1**trp1 12 8 62 47 20 0.8 14 2.1 15 2.8mat1 0 0 93 104 — — µ6 0.6 µ6 0.6ura3 2 1 10 9 33 0.0 5 0.1 9 0.2ade6 3 3 4 9 0 0.0 µ38 1.2 µ26 1.3his5–2 4 1 14 10 60 0.8 17 0.7 24 1.7tyr1 5 1 59 44 67 1.5 15 2.2 17 3.3CUP1 6 3 123 124 33 1.0 0 0.0 1 0.0gal2 0 0 36 17 — — 36 6.8** 36 6.8**leu2–1 0 0 41 25 — — 24 3.9* 24 3.9*trp5–48 1 0 23 31 — — µ15 1.2 µ13 0.9met1 18 6 18 17 50 6.0* 3 0.0 22 2.8met10 1 0 17 16 — — 3 0.0 6 0.1ura1 11 15 331 275 µ15 0.6 9 5.2* 8 4.3*ilv3 9 6 230 239 20 0.6 µ2 0.2 µ1 0.1lys1–1 3 7 51 78 µ40 1.6 µ21 5.7* µ22 6.9**SUP6 0 0 22 33 — — µ20 2.2 µ20 2.2thr1 14 22 691 594 µ22 1.8 8 7.3* 7 6.0*his4–4 39 41 411 303 µ3 0.1 15 16.3** 13 14.2**ade8–10 0 0 48 30 — — 23 4.2* 23 4.2*met13 1 0 459 474 — — µ2 0.2 µ2 0.2cde14 1 1 48 39 0 0.0 10 0.9 10 0.9ade7 11 8 47 27 16 0.5 27 5.4* 25 5.7*his2 2 0 215 231 100 0.5 µ4 0.6 µ3 0.4arg4–4 0 1 5 13 — — µ44 3.6 µ47 4.3*arg4–3 5 3 28 23 25 0.1 10 0.5 12 0.8arg4–19 2 6 87 68 µ50 1.1 12 2.3 9 1.4arg4–17 38 20 485 551 31 5.6* µ6 4.2* µ4 2.1arg4–16, all combinations of other arg4 alleles, pooled
5 289 508 302 µ51 98.0** 25 52.4** 1 0.1arg4–16, alone
56 170 181 77 µ50 57.5** 40 41.9** µ2 0.2arg4–16 with arg4–17/+
19 49 133 79 µ44 13.2** 25 13.8** 9 2.1arg4–16 with arg4–19/+
17 55 84 60 µ53 20.1** 17 4.0* µ6 0.9arg4–16 with arg4–19/+ and with arg4–17/+
3 15 110 86 µ67 8.0** 12 3.0 6 0.7
Fink & Styles (1974)his4–39 0 0 16 10 — — 23 1.0 23 1.4
Lawrence et al. (1975)met3 0 0 30 8 — — 58 12.7** 58 12.7**ilv3 0 0 80 61 — — 13 2.6 13 2.6
Fogel et al. (1981)arg4–17, ochre 35 19 431 514 30 4.7* µ9 7.3** µ7 4.5*
Detloff et al. (1991) The first 10 lines are for different single-base changes in the initiating ATG codon, with the basesshown. The two ATC results are from different diploids.his4-CTG 18 15 99 114 9 0.3 µ7 1.1 µ5 0.6his4-AAG 11 10 54 58 5 0.1 µ4 0.1 µ2 0.1his4-ATC 56 57 113 33 µ1 0.0 55 43.9** 31 24.1**his4-ATC 22 21 46 18 2 0.0 44 12.3** 27 7.9**his4-ACG 12 25 132 156 µ35 4.6* µ8 2.0 µ11 4.2*his4-GTG 8 9 63 88 µ6 0.1 µ17 4.1* µ15 4.0*his4-AGG 10 8 55 79 11 0.2 µ18 4.3* µ14 3.2his4-ATT 8 9 31 52 µ6 0.1 µ25 5.3* µ22 4.8*his4-TTG 16 18 92 109 µ6 0.1 µ8 1.4 µ8 1.5his4-ATA 8 6 42 58 14 0.3 µ16 2.6 µ12 1.7his4–17 6 12 23 44 µ33 2.0 µ31 6.6* µ32 8.6**
†In Tables 2–5, disparities with no sign are towards wild-type, +; those with a minus sign are towards mutant. *Ps0.05, **Ps0.01.
GENE CONVERSION DISPARITY IN YEAST 541
© The Genetical Society of Great Britain, Heredity, 80, 538–552.
The two results for arg4–17 and the five forarg4–16 clearly showed opposite directions ofdisparity: for arg4–17, 5:3/3:5 disparity was signifi-cant and positive, to + (about +30%), whereas6:2/2:6 disparity was significant and negative, to m(about µ7%). For arg4–16 these directions werereversed, with 5:3/3:5 disparity to m (µ44 toµ67%) and 6:2/2:6 disparity to + (+12 to +40%).Opposite-direction disparities reduce overall dispar-ity: in the first four arg4–16 results, significantdisparities in opposite directions for 5:3/3:5 and6:2/2:6 almost cancelled each other out, with nosignificant overall disparity.
Disparity in relation to the molecular natureof mispairs
In the his4 data of Detloff et al. (1991) in Table 2,the first 10 lines show the effect of all nine possibleheterozygous base-substitutions in the same initiat-ing ATG codon, with ATC from two differentdiploids giving similar results. Of those transversionsgiving identical base mispairs when heterozygouswith wild-type, AAG and TTG (both giving A/A andT/T mispairs) gave no significant disparity; ATC(giving C/C and G/G mispairs) gave highly signifi-cant (PR0.01) 6:2/2:6 and overall disparity fromboth diploids, but no 5:3/3:5 disparity. Of thosetransversions giving same-type mispairs, purine/purine, A/G, and pyrimidine/pyrimidine, T/C, CTGgave no significant disparity, AGG gave significant6:2/2:6 disparity only, and ATT gave significant6:2/2:6 and overall disparity. Of those transitionsgiving different-type purine/pyrimidine mispairs, G/Tand A/C, ATA gave no significant disparity, ACGgave significant 5:3/3:5 and overall disparity, whereasGTG gave significant 6:2/2:6 and overall disparity.There was no correlation between disparity and theposition of the mispair within the codon.
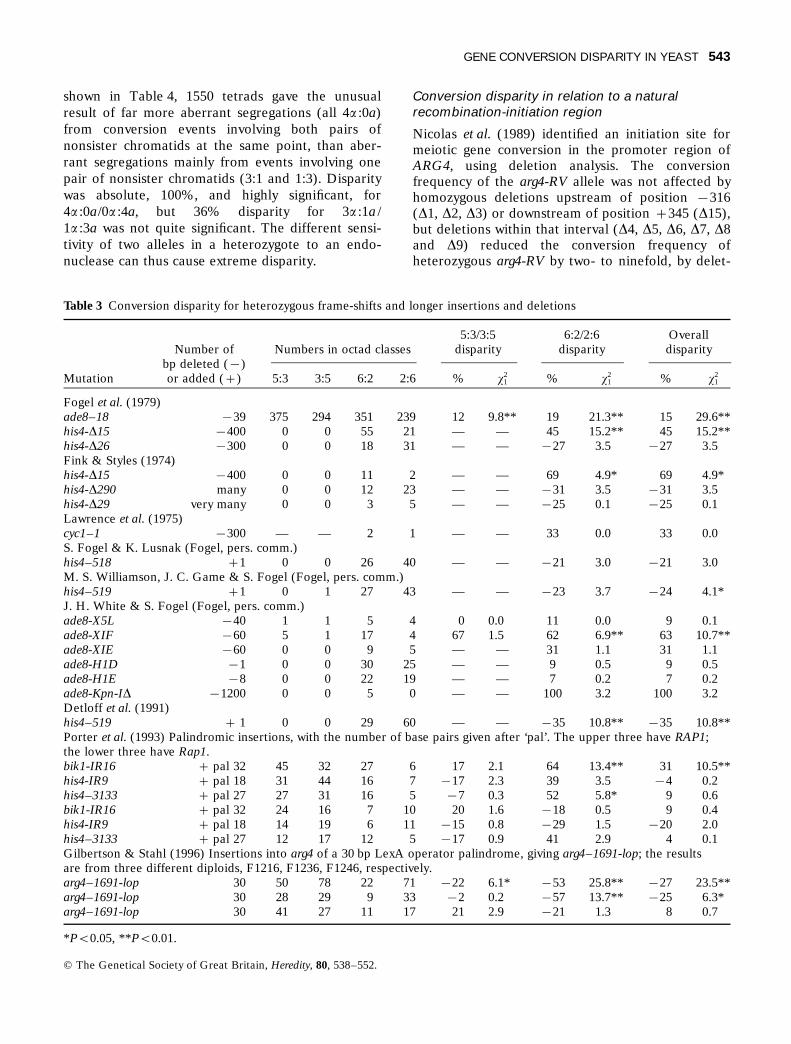
Conversion disparity for single-base additionsand deletions
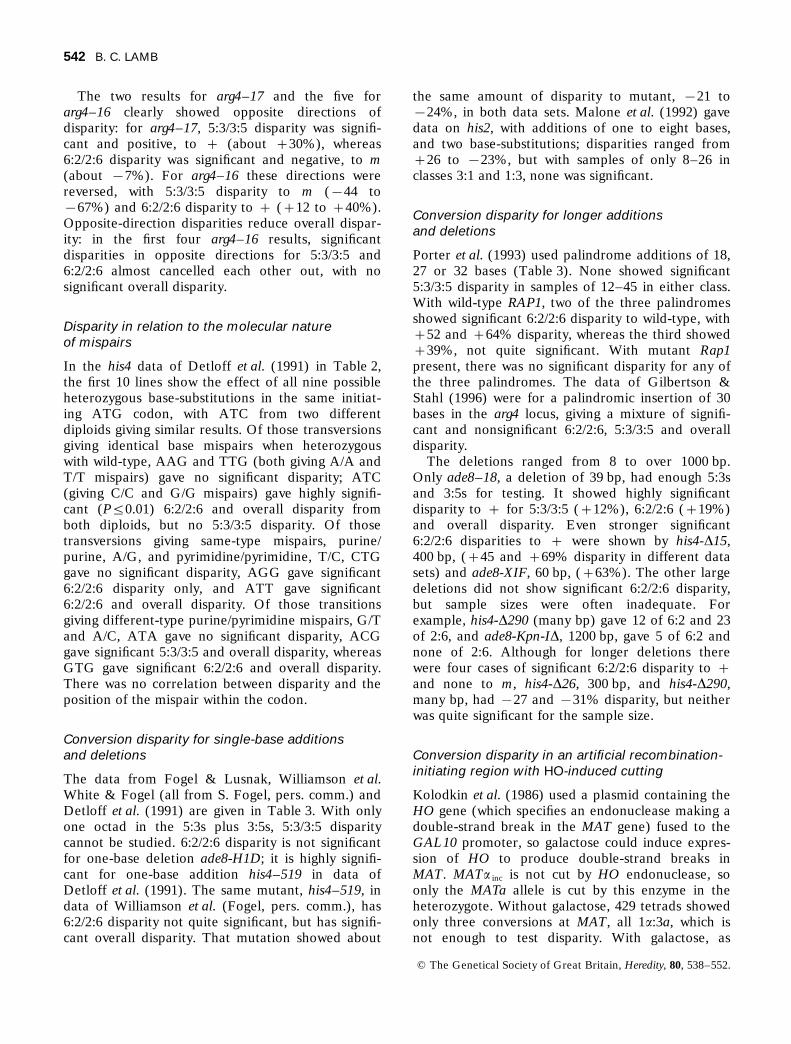
The data from Fogel & Lusnak, Williamson et al.White & Fogel (all from S. Fogel, pers. comm.) andDetloff et al. (1991) are given in Table 3. With onlyone octad in the 5:3s plus 3:5s, 5:3/3:5 disparitycannot be studied. 6:2/2:6 disparity is not significantfor one-base deletion ade8-H1D; it is highly signifi-cant for one-base addition his4–519 in data ofDetloff et al. (1991). The same mutant, his4–519, indata of Williamson et al. (Fogel, pers. comm.), has6:2/2:6 disparity not quite significant, but has signifi-cant overall disparity. That mutation showed about
the same amount of disparity to mutant, µ21 toµ24%, in both data sets. Malone et al. (1992) gavedata on his2, with additions of one to eight bases,and two base-substitutions; disparities ranged from+26 to µ23%, but with samples of only 8–26 inclasses 3:1 and 1:3, none was significant.
Conversion disparity for longer additionsand deletions
Porter et al. (1993) used palindrome additions of 18,27 or 32 bases (Table 3). None showed significant5:3/3:5 disparity in samples of 12–45 in either class.With wild-type RAP1, two of the three palindromesshowed significant 6:2/2:6 disparity to wild-type, with+52 and +64% disparity, whereas the third showed+39%, not quite significant. With mutant Rap1present, there was no significant disparity for any ofthe three palindromes. The data of Gilbertson &Stahl (1996) were for a palindromic insertion of 30bases in the arg4 locus, giving a mixture of signifi-cant and nonsignificant 6:2/2:6, 5:3/3:5 and overalldisparity.
The deletions ranged from 8 to over 1000 bp.Only ade8–18, a deletion of 39 bp, had enough 5:3sand 3:5s for testing. It showed highly significantdisparity to + for 5:3/3:5 (+12%), 6:2/2:6 (+19%)and overall disparity. Even stronger significant6:2/2:6 disparities to + were shown by his4-D15,400 bp, (+45 and +69% disparity in different datasets) and ade8-XIF, 60 bp, (+63%). The other largedeletions did not show significant 6:2/2:6 disparity,but sample sizes were often inadequate. Forexample, his4-D290 (many bp) gave 12 of 6:2 and 23of 2:6, and ade8-Kpn-ID, 1200 bp, gave 5 of 6:2 andnone of 2:6. Although for longer deletions therewere four cases of significant 6:2/2:6 disparity to +and none to m, his4-D26, 300 bp, and his4-D290,many bp, had µ27 and µ31% disparity, but neitherwas quite significant for the sample size.
Conversion disparity in an artificial recombination-initiating region with HO-induced cutting
Kolodkin et al. (1986) used a plasmid containing theHO gene (which specifies an endonuclease making adouble-strand break in the MAT gene) fused to theGAL10 promoter, so galactose could induce expres-sion of HO to produce double-strand breaks inMAT. MATa inc is not cut by HO endonuclease, soonly the MATa allele is cut by this enzyme in theheterozygote. Without galactose, 429 tetrads showedonly three conversions at MAT, all 1a:3a, which isnot enough to test disparity. With galactose, as
542 B. C. LAMB
© The Genetical Society of Great Britain, Heredity, 80, 538–552.
shown in Table 4, 1550 tetrads gave the unusualresult of far more aberrant segregations (all 4a :0a)from conversion events involving both pairs ofnonsister chromatids at the same point, than aber-rant segregations mainly from events involving onepair of nonsister chromatids (3:1 and 1:3). Disparitywas absolute, 100%, and highly significant, for4a :0a/0a :4a, but 36% disparity for 3a :1a /1a :3a was not quite significant. The different sensi-tivity of two alleles in a heterozygote to an endo-nuclease can thus cause extreme disparity.
Conversion disparity in relation to a naturalrecombination-initiation region
Nicolas et al. (1989) identified an initiation site formeiotic gene conversion in the promoter region ofARG4, using deletion analysis. The conversionfrequency of the arg4-RV allele was not affected byhomozygous deletions upstream of position µ316(D1, D2, D3) or downstream of position +345 (D15),but deletions within that interval (D4, D5, D6, D7, D8and D9) reduced the conversion frequency ofheterozygous arg4-RV by two- to ninefold, by delet-
Table 3 Conversion disparity for heterozygous frame-shifts and longer insertions and deletions
5:3/3:5 6:2/2:6 OverallNumber of Numbers in octad classes disparity disparity disparity
bp deleted (µ)Mutation or added (+) 5:3 3:5 6:2 2:6 % x2
1 % x21 % x2
1
Fogel et al. (1979)ade8–18 µ39 375 294 351 239 12 9.8** 19 21.3** 15 29.6**his4-D15 µ400 0 0 55 21 — — 45 15.2** 45 15.2**his4-D26 µ300 0 0 18 31 — — µ27 3.5 µ27 3.5Fink & Styles (1974)his4-D15 µ400 0 0 11 2 — — 69 4.9* 69 4.9*his4-D290 many 0 0 12 23 — — µ31 3.5 µ31 3.5his4-D29 very many 0 0 3 5 — — µ25 0.1 µ25 0.1Lawrence et al. (1975)cyc1–1 µ300 — — 2 1 — — 33 0.0 33 0.0S. Fogel & K. Lusnak (Fogel, pers. comm.)his4–518 +1 0 0 26 40 — — µ21 3.0 µ21 3.0M. S. Williamson, J. C. Game & S. Fogel (Fogel, pers. comm.)his4–519 +1 0 1 27 43 — — µ23 3.7 µ24 4.1*J. H. White & S. Fogel (Fogel, pers. comm.)ade8-X5L µ40 1 1 5 4 0 0.0 11 0.0 9 0.1ade8-XIF µ60 5 1 17 4 67 1.5 62 6.9** 63 10.7**ade8-XIE µ60 0 0 9 5 — — 31 1.1 31 1.1ade8-H1D µ1 0 0 30 25 — — 9 0.5 9 0.5ade8-H1E µ8 0 0 22 19 — — 7 0.2 7 0.2ade8-Kpn-ID µ1200 0 0 5 0 — — 100 3.2 100 3.2Detloff et al. (1991)his4–519 + 1 0 0 29 60 — — µ35 10.8** µ35 10.8**Porter et al. (1993) Palindromic insertions, with the number of base pairs given after ‘pal’. The upper three have RAP1;the lower three have Rap1.bik1-IR16 + pal 32 45 32 27 6 17 2.1 64 13.4** 31 10.5**his4-IR9 + pal 18 31 44 16 7 µ17 2.3 39 3.5 µ4 0.2his4–3133 + pal 27 27 31 16 5 µ7 0.3 52 5.8* 9 0.6bik1-IR16 + pal 32 24 16 7 10 20 1.6 µ18 0.5 9 0.4his4-IR9 + pal 18 14 19 6 11 µ15 0.8 µ29 1.5 µ20 2.0his4–3133 + pal 27 12 17 12 5 µ17 0.9 41 2.9 4 0.1Gilbertson & Stahl (1996) Insertions into arg4 of a 30 bp LexA operator palindrome, giving arg4–1691-lop; the resultsare from three different diploids, F1216, F1236, F1246, respectively.arg4–1691-lop 30 50 78 22 71 µ22 6.1* µ53 25.8** µ27 23.5**arg4–1691-lop 30 28 29 9 33 µ2 0.2 µ57 13.7** µ25 6.3*arg4–1691-lop 30 41 27 11 17 21 2.9 µ21 1.3 8 0.7
*Ps0.05, **Ps0.01.
GENE CONVERSION DISPARITY IN YEAST 543
© The Genetical Society of Great Britain, Heredity, 80, 538–552.

ing some or all of the initiation site for conversion inthe promoter region. The arg4-RV site and itsmispairs in hDNA are not changed by these homo-zygous deletions, offering an opportunity to study itsdisparity in different locations within the locus.Table 5(a) shows that the same heterozygous muta-tion can have quite different disparities in differentpositions, though with no systematic changes withposition. Thus with D2 there is significant disparity
to m, µ44%, but D5 disparity is to +, +31%. Thedifference between D2 and D5 is significant(x 2
1 = 7.9, Ps0.01).Nicolas et al. (1989) also studied the effects of
heterozygous deletions inside and outside theconversion-initiation region: the deletion of an initi-ation site from one homologue should lead todisparity, as only the wild-type homologue couldinitiate conversion. Table 5 (b) shows D9HET having
Table 4 Conversion disparity for heterozygous markers with and without HO-induced cutting only in the MATa allele
Numbers in each octad class4a:0a/0a:4a
disparity3a:1a/1a:3a
disparity
Mutation 4a:0a 0a:4a 3a:1a 1a:3a Condition % x21 % x2
1
Kolodkin et al. (1986)MAT 0 0 0 3 No galactose µ µ µ100 1.3MAT 215 0 19 9 Galactose 100 213.0** 36 3.6
**Ps0.01.
Table 5 Conversion disparity for heterozygous markers with mutations inside or outside a recombination initiation regionin ARG4 (Nicolas et al., 1989)(a) Effect of homozygous deletions in different parts of the locus on disparity for the same heterozygous RV site
3+:1RV/1+:3RVdisparity Location of the
Deletion deletion relativeMutant length (bp) 3+:1RV 1+:3RV % x2
1 to RV
D1 6000 13 11 8 0.2 UpstreamD2 800 7 18 µ44 4.8* UpstreamD3 1500 21 25 µ9 0.3 UpstreamD4 204 2 7 µ56 1.8 UpstreamD5 177 21 11 31 3.1 UpstreamD6 261 11 7 22 0.9 UpstreamD7 1500 5 1 67 1.5 UpstreamD8 815 2 2 0 0.0 UpstreamD9 142 6 5 9 0.1 UpstreamD10 319 32 33 µ2 0.2 UpstreamD15 1200 24 17 17 1.2 Downstream
(b) Disparity of heterozygous deletions inside or outside the recombination initiation region
3+:1D/1+:3Ddisparity Location of the
Deletion deletion relativeMutant length (bp) 3+:1D 1+:3D % x2
1 to initiation region
D9HET 142 7 28 µ60 12.6** InsideD5/D6 84 1 22 µ91 17.4** InsideMGD386 84 14 29 µ35 5.2* OutsideMGD366, SUP3a insert 137 6 9 µ25 0.6 Outside
*Ps0.05, **Ps0.01.
544 B. C. LAMB
© The Genetical Society of Great Britain, Heredity, 80, 538–552.
highly significant disparity (µ60%) to m asexpected; the seven conversions to + were perhapsinitiated from another region. An even strongerdisparity (µ91%), highly significant, arose in aheterozygote for deletions 5 and 6, with an 84 bpheterozygosity. The homologue retaining thesequences from µ140 to µ56 was the preferredrecipient in conversion. As controls, they had twoheterozygous deletions outside the initiation region:MGD368 had significant disparity to m (µ35%), butthe small sample for MGD366 SUP3a had no signifi-cant disparity.
Conversion as a force changing allele frequencies
This force, y, is the product of the conversionfrequency as a fraction, c, and disparity measure d(see Materials and methods). The earlier yeast datawere analysed for c, d and y by Lamb (1984, 1985,1986), so only newer data are covered in Table 6,using only cases with 20 or more conversion asci.Conversion frequencies were high, with c of0.156–0.548, for bik1 and the nearby his4, and forMAT, but lower for ARG4 RV with different homo-zygous deletions, 0.036–0.091. Disparity, d, has thehighest value for any organism at +0.4527 for MATwith the galactose-stimulated HO-cutting. The alsounnatural situation of a heterozygous deletion in arecombination-initiating region in ARG4, for D9HETand D5/D6, gave very high disparity, +0.1501 and+0.2283. In more normal situations, d varied fromµ0.0851 to +0.1052 for base-substitutions at his4, dwas µ0.0806 for a single-base-addition frameshift,and ranged from µ0.0375 to +0.0694 for palin-dromic insertions in bik1 and his4. Conversion forcevalues, y, were most extreme for MAT, +0.0711, andhis4 base-substitutions, µ0.0354 to +0.0463.Although ARG4 had some strong disparities, thelower c-values reduced the extremeness of ycompared to other loci. Disparity and conversionforce values could be positive or negative, varyingfrom strong to none for different mutants or evenfor the same heterozygous mutation in differentconditions.
Discussion
Disparity extent
It is clear from Tables 2–5 that significant disparityoften occurs in yeast for all types of mutation. Anincreasing proportion of sites had significant dispar-ity as sample sizes increased. The mean absolutevalue of disparity parameter d for yeast was 0.06, a
little lower than those of 0.10–0.13 for Ascobolusand Sordaria brevicollis (Lamb, 1985). The neweryeast data (Table 6) gave a mean absolute d-value of0.07 from 31 samples, showing slightly less disparitythan those filamentous fungi.
Mechanisms of recombination
The frequent disparity shown in yeast favours themodified DSBR model of Sun et al. (1991) ratherthan the original DSBR model of Szostak et al.(1983). In the modified model, compared to theoriginal model, lengths of double-strand gap-repair,which probably do not give disparity, are absent ormuch shorter in relation to lengths of hDNA, whichcan easily give disparity.
Types of disparity
In the present yeast data, there are significant casesof 5:3/3:5 disparity with no 6:2/2:6 disparity, e.g.met1; of 6:2/2:6 disparity with no 5:3/3:5 disparity,e.g. his4-ATC; of disparity in the same direction for6:2/2:6 and 5:3/3:5s (ade8–18 was the only example);and of opposite directions for 6:2/2:6 and 5:3/3:5disparity, e.g. arg4–16 and arg4–17. For arg4–16 in amonohybrid cross, the 5:3/3:5 disparity was stronglyto m (µ50%, PR0.01) but 6:2/2:6 disparity wasstrongly to + (+40%, PR0.01).
These disparity patterns in yeast resemble thosefound in Ascobolus immersus by Lamb & Ghikas(1979), except that in Ascobolus 6:2/2:6 disparity wasusually, but not always, in the same direction as5:3/3:5 disparity; sometimes 6:2/2:6 disparity wasstronger than 5:3/3:5 disparity, sometimes weakerand sometimes equal. In the Ascobolus data ofLamb & Zwolinski (1992) for w1, hDNA wasroughly one-third symmetric, and two-thirds asym-metric, in contrast to nearly all asymmetric hDNA inyeast. This partly accounts for disparity usually beingin the same direction for 5:3/3:5 and 6:2/2:6 in Asco-bolus, as symmetric hDNA with biased correctiondirection affects both types of disparity in the samedirection.
Monohybrid or dihybrid (heteroallelic) crosses,coupling or repulsion
Some yeast data were from heteroallelic crosses,where co-conversion could affect disparity at bothheterozygous sites. Suppose two heteroallelic muta-tions, m1 and m2, preferentially convert in the samedirection in monohybrid crosses, say to +, but with
GENE CONVERSION DISPARITY IN YEAST 545
© The Genetical Society of Great Britain, Heredity, 80, 538–552.

m1 having more disparity than m2. In coupling,+,+/m1, m2, co-conversions will retain the direc-tion of disparity, but with m2 having more disparitythan m1. In repulsion, +,m2/m1,+, co-conversions
will reverse the direction of disparity for eachmutant. Mixing data from repulsion and couplingcrosses could therefore reduce the amount of dispar-ity found, and disparities from monohybrid and
Table 6 Values of c, d and y, for the force of conversion on allele frequencies
Numbers of Conversion Overall disparity Force ofconversion frequency, measure, gene conversion,
Mutation† asci c d y
Porter et al. (1993). Palindromic insertions, with the number of base pairs given after ‘pal’. The upper three have RAP1;the lower three have Rap1.bik1-IR16, +pal 32 119 0.391 0.0694 0.0272his4-IR9, +pal 18 126 0.384 0.0063 0.0024his4–3133, +pal 27 88 0.285 0.0278 0.0079bik1-IR16, +pal 32 58 0.197 0.0044 0.0009his4-IR9, +pal 18 50 0.169 µ0.0375 µ0.0064his4–3133, +pal 27 46 0.156 0.0245 0.0038
Gilbertson & Stahl (1996). Three diploids with arg4–1691-lop, see Table 3.(i)+pal 30 221 0.105 µ0.0712 µ0.0075(ii)+pal 30 99 0.111 µ0.0619 µ0.0069(iii)+pal 30 98 0.083 0.0026 0.0002
Detloff et al. (1991). The first 10 lines are for different single-base substitutions in the initiating ATG codon, with thebases shown. The two ATC results are from different diploids.his4-CTG 313 0.489 µ0.0307 µ0.0149his4-AAG 173 0.548 µ0.0363 µ0.0199his4-ATC 302 0.439 0.1052 0.0463his4-ATC 134 0.523 0.0857 0.0449his4-ACG 371 0.473 µ0.0391 µ0.0185his4-GTG 189 0.467 µ0.0575 µ0.0269his4-AGG 179 0.527 µ0.0403 µ0.0212his4-ATT 124 0.416 µ0.0851 µ0.0354his4-TTG 279 0.466 µ0.0114 µ0.0053his4-ATA 137 0.441 µ0.0182 µ0.0081his4–17 90 0.331 µ0.0562 µ0.0186
Detloff et al. (1991). Single base-addition frameshift.his4–519 90 0.289 µ0.0806 µ0.0233
Kolodkin et al. (1986). Conversion for a heterozygous marker with HO-induced cutting only in the MATa allele.MAT 243 0.157 0.4527 0.0711
Nicolas et al. (1989). Deletions in ARG4.(i) Effects of homozygous deletions in different parts of the locus on disparity for the RV site.D1 24 0.071 0.0208 0.0015D2 25 0.091 µ0.1101 µ0.0098D3 46 0.081 µ0.0217 µ0.0018D5 32 0.036 0.0781 0.0028D10 65 0.087 µ0.0038 µ0.0003D15 41 0.078 0.0427 0.0033
(ii) Disparity of heterozygous deletions inside or outside the recombination initiation region.D9HET 35 0.032 0.1501 0.0048D5/D6 23 0.031 0.2283 0.0071MGD368 43 0.053 0.0872 0.0047
†Mutations with fewer than 20 conversion asci have been omitted, as have those included in previous surveys.
546 B. C. LAMB
© The Genetical Society of Great Britain, Heredity, 80, 538–552.
dihybrid crosses could differ. Fogel et al. (1979) usedpooled repulsion (e.g. arg4 16,+/+,17) and coupling(16,17/+,+) heteroallelic crosses. If the two muta-tions had opposite disparity directions, say m1converting mainly to + and m2 converting mainly tom, then in coupling, co-conversions would changethe direction of disparity of both sites, whereas inrepulsion they would not change the direction butcould change the strength of disparity at each site.In a heteroallelic cross, conversions at any site areusually a mixture of conversions involving only thatsite, with its own conversion properties, and ofco-conversions in which correction could be trig-gered by the other nearby heterozygous site, possiblyreducing overall disparity for that site: in Table 2,arg4–16 in a monohybrid cross had +40% 6:2/2:6disparity, but this was reduced in heteroalleliccrosses with either or both arg4–17 and arg4–19 to+12, +17 or +25%. Data from filamentous fungiwere nearly all from monohybrid crosses (Lamb,1984).
Base-substitutions
Table 2 shows that base-substitutions with largesamples often have significant 6:2/2:6 disparity, suchas pet1, his4–4 and arg4–16, but some show no signi-ficant disparity, such as CUP1, met13 and his2.
Is disparity controlled by a mutation’s molecularnature?
One might expect that heterozygous transversionsgiving mispairs with identical bases (e.g. C/C) wouldnot give disparity unless neighbouring bases differedand affected which strand was excision-repaired; thattransversions giving unlike purine/purine (e.g. A/G)and unlike pyrimidine/pyrimidine (e.g. C/T) mispairswould have disparity if excision repair had prefer-ences among purines and/or among pyrimidines; andthat transitions giving purine/pyrimidine mispairswould have disparity for each mispair, in oppositedirections for the two mispairs, if excision repair hadpreferences for cutting out purines or pyrimidines.For example, in an A/T (+) to GC (m) transitiongiving A/C and G/T mispairs, a tendency to excisepreferentially the purine would give disparity tomutant for A/C but disparity to wild-type for G/T.Disparity could occur if the degree of preferentialexcision differed between the two mispairs, or if themispairs were formed with different frequencies.
The results of Detloff et al. (1991) in Table 2 donot follow any of those predictions. Two mutantsgiving A/A and T/T mispairs had no 6:2/2:6 disparity
but the one giving C/C and G/G had highly signifi-cant disparity. Of the mutants giving purine/pyrimidine mispairs, G/T and A/C, one had nodisparity, one had 5:3/3:5 disparity and one had6:2/2:6 disparity. Of the mutants giving purine/purine, A/G, and pyrimidine/pyrimidine mispairs,T/C, one gave no disparity and two gave 6:2/2:6disparity. The neighbouring base sequences shouldhave been identical for all these mutations, so differ-ences in nearby bases would not explain theseresults. For 6:2/2:6 disparity, four of the base-substi-tutions had significant disparity to m, µ17 toµ31%; two repeats of one (giving G/G and C/C)had highly significant disparity to +, +44 and+55%; and five had no significant disparity fromsamples of 100–288 of 6:2s plus 2:6s. Only one gavesignificant 5:3/3:5 disparity, µ35%, but it gave insig-nificant 6:2/2:6 disparity, µ8%.
From European strains of Ascobolus immersus,Leblon (1972a,b) reported that conversion proper-ties were closely related to a mutation’s molecularnature, with frame-shift deletions giving lowfrequencies of asci with postmeiotic segregation(p.m.s.) and conversion strongly to +; frame-shiftadditions also gave low frequencies of p.m.s. asci butdisparity was strongly to m; base-substitutions gave ahigh proportion of p.m.s. asci, and disparityfavoured either + or m. Later results showed a lessgood correlation, e.g. frameshift A4 usually had over90% of p.m.s., with no conversion disparity(Rossignol & Haedens, 1980). Yu-Sun et al. (1977)found a less good correlation between a mutation’smolecular type and its gene conversion spectrum inSordaria brevicollis. In Pasadena strains of A. immer-sus, Lamb & Ghikas (1979) found only a weakcorrelation between a mutation’s molecular natureand its conversion properties for frequency of p.m.s.asci and amount and direction of disparity. Whenthey crossed the same mutation to a number ofstrains with the same wild-type allele but differing inalleles for certain linked or unlinked conversioncontrol factors, the conversion properties sometimesdiffered remarkably in p.m.s. frequency and/or indisparity amount or even in disparity direction,although the mispairs were the same in each cross.
The yeast results of Detloff et al. (1991) confirmthe lack of any consistent disparity pattern in rela-tion to the molecular nature of the mispairs. Such alack of pattern was also shown in the results ofNicolas et al. (1989) in Table 5 for arg4-RV. Themispairs and their neighbouring bases remainedconstant, but were moved in relation to surroundinggenetic regions by homozygous deletions. In somepositions, the RV mutation had no disparity; in one
GENE CONVERSION DISPARITY IN YEAST 547
© The Genetical Society of Great Britain, Heredity, 80, 538–552.
position it had significant disparity to m, and inanother position it had nonsignificant disparityfavouring +, +31%, a highly significant differencefrom the µ44% result for the same heterozygousmutation.
Lamb (1975) pointed out that unknown hetero-zygous cryptic mutations near to the known muta-tions could affect a correlation between a mutation’smolecular nature and its conversion properties.Co-conversions triggered by the cryptic mutation’smispairs could alter the perceived properties ofconversion, including disparity, of the knownmutations.
Additions and deletions
In Table 3, the two single-base-addition frameshiftsshowed some disparity towards m, with µ21, µ23,and µ35% in the three data sets; only the last valueis significant. The longer additions were all palin-dromes, of 18, 27 or 32 bases, giving 6:2/2:6 disparityto +, with +64, +39 and +52% in a RAP1 strain,where two of the biases were significant. With thesame palindromes in a Rap1 strain, lacking a trans-cription-activating factor, the disparities were notsignificant, µ18, µ29 and +41%, from fairly smallsample sizes. It is not clear why the binding of aprotein to a site near the 5p end of HIS4 and the 3pend of BIK1 should affect disparity in the two genes,nor why the longer palindromic addition shouldhave the opposite direction of disparity to the single-base-addition.
The two single-base deletions, ade8-H1D andade8-H1E, had no significant disparity. Of 10 longerdeletions, five had only three to 13 conversion asci,but one of these had +69% disparity, which wassignificant. The other five included three with highlysignificant disparity to wild-type, whereas the othertwo had disparity to m, but neither was significant.Although the Ascobolus and Sordaria resultsreferred to above usually had strong conversiondisparity to + for single-base deletions, that is,preferential cutting of the shorter, unlooped strand,the two yeast single-base deletions had no strongdisparity, and longer deletions varied in disparityamount and direction. Yeast deletions converted to+ and to m, so both the looped or unlooped strandscould be cut in mismatch repair. Fogel et al. (1981)concluded that in yeast, ‘deletions convert at near-normal frequency and with approximate parity, butdo not display p.m.s.’, but the data in Table 3 showstrong disparity for a high proportion of deletionswith large samples, and some deletions had a highproportion of p.m.s. segregations. In A. immersus,
Girard & Rossignol (1974) and Paquette &Rossignol (1978) studied two deletions of much ofthe b2 gene. Both had highly significant disparity tomutant, with 11–14% p.m.s., but in crosses hetero-zygous for a conversion control factor, p.m.s. were67–75%, with much less disparity.
Causes of disparity
Parameter definitions are in Table 1 and equationsfor gene conversion were given by Lamb (1996a,b).Hybrid DNA in yeast is generally accepted as occur-ring very largely from asymmetric hDNA, in which6:2/2:6 disparity can arise from correction directiondisparity (r and/or s80.5) but 5:3/3:5 disparitycannot be caused by correction direction disparity,as no correction occurs in their production fromasymmetric hDNA. 5:3/3:5 disparity having a sepa-rate cause from 6:2/2:6 disparity would explain whythe two types of disparity have little correlation andcan be in opposite directions. If nearly all hDNA isasymmetric, then one way 5:3/3:5 disparity can ariseis from one chromatid invading the nonsister chro-matid with a higher frequency than it is itselfinvaded by the nonsister chromatid, at the point ofheterozygosity. If 5:3/3:5 disparity in a heterozygotefavours +, say, then the chromatids carrying the +allele could invade the m-bearing chromatids moreoften than the m-bearing chromatids invade the +chromatids, so ba0.5. Chromatid invasion disparitycannot be the usual sole cause of 5:3/3:5 and/or6:2/2:6 disparity, because it would then cause bothkinds of disparity together, in the same direction,which rarely occurred in the present yeast data.Thus preferential invasion by the + chromatid inasymmetric hDNA formation should cause 6:2a2:6and 5:3a3:5, unless correction direction disparityfavoured m, when the 5:3a3:5 relation is unaltered,but the 6:2a2:6 relation could be reduced orreversed. A second possible cause of 5:3/3:5 dispar-ity, and a third cause of 6:2/2:6 disparity, is if strandinvasion frequency is biased (d80.5) and the twotypes of mispair, AY and XB, correct with differentfrequencies, p8q.
The frequent occurrence of 6:2/2:6 disparitywithout 5:3/3:5 disparity in yeast is easily explainedby disparity in correction direction in asymmetrichDNA, that is, correction parameters r and s havevalues departing from 0.5, with values for one orboth of them being a0.5 for disparity to + or s0.5for disparity to m. As many heterozygous mutantshad a low proportion of asci with p.m.s, p and qmust often be close to 1.0. Some mutants did haveappreciable frequencies of p.m.s. asci, e.g. met1,
548 B. C. LAMB
© The Genetical Society of Great Britain, Heredity, 80, 538–552.
arg4–16, arg4–17, ade8-D18, his4-ATC, ade8-XIF,bik1–1R16, etc. (Tables 2 and 3).
In Tables 2 and 3, cases of significant 5:3/3:5disparity generally occurred for mutants havinghigher frequencies of p.m.s., but usually onlymutants with high p.m.s. frequencies had enough 5:3and 3:5 segregations for significant differences.Significant or highly significant 5:3/3:5 disparityfavoured + (met1, arg4–17, ade8-D18) or m(arg4–16, his4-ACG) about equally. It occurred forbase-substitutions and a deletion of 39 bp. The dataof Detloff et al. (1991) on different base-substitu-tions within the same codon show that 5:3/3:5disparity is allele-specific, shown by his4-ACG butnot by the other eight base-substitutions, even oneswith adequate numbers of p.m.s. asci.
From the equations of Lamb (1996a,b), if oneignores less frequent events involving more than onepair of nonsister chromatids in a single meiosis (g2
events), then from asymmetric hDNA the ratio of6:2/2:6 asci is b[dqs+(1µd)pr]/(1µb)[dp(1µr)+(1µd)q (1µs)]. 6:2/2:6 disparity thus increases withany of the following: increasing difference between band (1µb) (chromatid invasion preference); increas-ing difference between r and (1µr) and between sand (1µs), giving correction direction differences. Ifr differs from (1µr) in the opposite direction fromwhich s differs from (1µs), that reduces totalcorrection direction disparity.
From asymmetric hDNA, the ratio of 5:3/3:5 asciis b [d(1µq)+(1µd) (1µp)]/(1µb)[d(1µp)+(1µd)(1µq)]. This disparity increases as b differs from(1µb). Unless strand invasion parameter d = 0.5,this disparity increases as correction frequency pdiffers from q; unless p = q, this disparity increasesas d departs from (1µd). The evidence from Asco-bolus (Lamb & Zwolinski, 1992) for w1 is forextreme strand invasion disparity, with d = 0.0 or1.0. If d = (1µd) and/or p = q, 5:3/3:5 disparity fromasymmetric hDNA will depend solely on b(1µb).The Ascobolus data all showed a bias in chromatidinvasion frequency (b80.5), some differences incorrection frequency between the two types ofmispair (p for AY, q for XB) at a site, and very largedifferences in direction of repair (r for AY, s forXB). Unlike 6:2/2:6 disparity, 5:3/3:5 disparity doesnot depend at all on correction direction parametersr and s, unless there is a significant amount ofsymmetric hDNA.
One way to get 5:3/3:5 disparity without chromatidinvasion preference would be if the strand invasionparameter d had an extreme value, say 0.0 as inAscobolus (Lamb & Zwolinski, 1992), and the twomispairs corrected with different frequencies, say
paq. In asymmetric hDNA, AY mispairs arise informerly m chromatids from b(1µd) events andhave correction frequency p and correction directionr. XB mispairs arise in formerly + chromatids from(1µb) (1µd) events and have correction frequencyq and correction direction s. With no chromatidinvasion preference and complete strand invasionpreference, d = 0.0, there would be equal numbersof +,+, AY, m, (type 1) and +,XB,m,m, (type 2)tetrads before any correction. Type 1 gives 5:3 if notcorrected, and if corrected (frequency p) gives 6:2 orcorrection 4:4, depending on r. Type 2 gives 3:5 ifnot corrected, and if corrected (frequency q) gives2:6 or correction 4:4, depending on s. If p is high,type 1 gives few 5:3s and mainly 6:2s and correction4:4s; if q is low, type 2 gives mainly 3:5s and asmaller number of 2:6s and correction 4:4s. The 3:5swould greatly exceed 5:3s, giving strong 5:3/3:5disparity to m. The 6:2s would probably greatlyexceed the 2:6s, giving strong 6:2/2:6 disparity in theopposite direction, to +, but the proportions of 6:2sto 2:6s (but not of 5:3s to 3:5s) would depend on rand s, which determine the proportions of AY andXB going to 6:2, 2:6 and correction 4:4s. One cantherefore understand how opposite directions of6:2/2:6 and 5:3/3:5 disparity can occur from asym-metric hDNA. The statement of Lamb (1996a), that5:3/3:5 disparity without 6:2/2:6 disparity is notexpected on any recombination model, is wrong andis withdrawn.
With symmetric hDNA (Lamb, 1988), 5:3/3:5 =[p(1µq)r+(1µp)qs]/[p(1µq) (1µr)+(1µp)q(1µs)],so this kind of disparity depends only on correctionparameters p, q, r and s, not on any of the hDNAformation parameters such as b or d, and6:2/2:6 = rs/(1µr) (1µs). The common dependenceof both types of disparity on correction directionparameters r and s suggests that both types ofdisparity will usually occur together, in the samedirection, from symmetric DNA.
In yeast, restoration corrections (to the originalallele) and substitution corrections (replacement ofthe original allele by the the invading allele) havebeen found to be unequal — see Lamb (1996a,p. 1044) for findings and references. Whether such abias affects overall disparity depends on the relativefrequencies of the two types of invasion in asym-metric hDNA (by DNA carrying the + or the mallele) and on the degrees of preference for one typeof correction, which might differ for the two types ofmispair. Parameters p, q, r and s might havedifferent values for restitutions and for substitutions,but without affecting how disparity can arise.
GENE CONVERSION DISPARITY IN YEAST 549
© The Genetical Society of Great Britain, Heredity, 80, 538–552.

The double-strand break-repair (DSBR) model
On this model (Szostak et al., 1983; Orr-Weaver &Szostak, 1985; Sun et al., 1991), g is the chance ofthe heterozygous site being in a region of double-strand gap and repair. In the original model it wasassumed that the two types of nonsister chromatidwere gapped with equal frequency, to explain thesupposed parity in yeast. If different chromatidswere gapped or broken at different frequencies, itwould cause 6:2/2:6 disparity, but the usual expecta-tion is for the two strands to be affected at equalfrequencies. The HO-induced cutting at the MATlocus (Kolodkin et al., 1986) was so efficient that4a:0a tetrads were produced rather than 3a:1a. It isstrange, however, that there was complete 4:0/0:4disparity, but incomplete and nonsignificant 3:1/1:3disparity, which had a much smaller sample size.
If there is gapping of the two types of chromatid(bearing + and m) with unequal frequencies, andthe gap is repaired, then as gap repair results inasymmetric hDNA formation, this gives b80.5. Ifthe endonuclease results in a break but no gap, andleads to hDNA formation on the DSBR model, b isaffected. The data of Kolodkin et al. (1986) show anextreme value of b, because of the extreme disparitybetween conversion to a and to a, and a high valueof g2 as conversions were nearly all 4:0, not 3:1.
In complicated variations on the DSBR models, asin Gilbertson & Stahl (1996), the quantitative treat-ment of disparity given here does not accommodateall their details, and attempts to do so would proveunwieldy. The present treatment is to show the mainprinciples of how disparity can arise, but it is notexhaustive.
Effects of disparity on allele frequencies inpopulations
The force of conversion on allele frequencies, y, isthe product of c and d. Petes & Pukkila (1995)stated that meiotic conversion occurs at all loci withfrequencies from 1 to 50%, but some c-values inyeast are lower than 0.01 (Lamb, 1984) and Detloffet al. (1991) recorded conversion frequencies up to55% (c = 0.55) in yeast. Overall disparity is whatmatters for allele frequencies, not separate 6:2/2:6and 5:3/3:5 disparities.
In yeast data previously analysed, for deletionsand frameshifts, c ranged from 0.029 to 0.131, dfrom µ0.079 to +0.139, and y from µ0.0049to+0.0063 (Lamb, 1986). For 62 observationsmainly from base-substitutions, c ranged from 0.0016to 0.181, mean 0.043, SD 0.038; d varied from µ0.25
to +0.17, with a mean absolute value of 0.06, SD0.08; y varied from µ0.005 to +0.020, meanabsolute value 0.002, SD 0.003 (Lamb, 1984, 1985).For the newer data (Table 6), excluding smallsamples, conversion frequencies were generallyhigher than in the previous data, with c from 0.031to 0.548. Disparity was very high in the newer datain special situations, such as HO-cutting or hetero-zygous deletions in a recombination-initiatingregion, +0.1501 to +0.4527, and ranged from noneto high in more normal situations. For newer data,y-values were most extreme for MAT, +0.0711, andvaried from µ0.0354 to +0.0463 for base-substitu-tions, a frameshift and palindromic additions. Themean absolute value of y in the newer data (Table 6)was 0.012, compared with 0.002 in the earlier yeastdata, 0.004 in S. brevicollis, 0.004 in Pasadena strainsof A. immersus, and 0.011 in European strains of A.immersus. The high average value in the newer datais partly because some loci used had unusually highconversion frequencies.
In a population polymorphic for alleles A(frequency p) and a (frequency q), with randommating and no selection, the change in p in onegeneration because of gene conversion disparity isDp = 2pqy (Lamb & Helmi, 1982). The present andprevious y-values for yeast will thus often makeconversion an important factor in allele frequencies,capable of driving populations to fixation for which-ever allele is favoured by conversion disparity. Ifthere is selection and mutation, conversion can stillbe important, given these yeast values for y: seenumerical examples in Lamb & Helmi (1982) andLamb (1985), including how y can affect allelefrequencies for different dominance conditions,mutation frequencies and selection levels.
Meiotic gene conversion disparity could thus oftenaffect allele frequencies in sexually reproducingyeast colonies. The typically large numbers of indi-viduals in such colonies would increase the impor-tance of conversion relative to genetic drift. Dispar-ity in direction of mitotic gene conversion in hetero-zygous diploids could also affect allele frequencies.
Conclusions
Gene conversion disparity is widespread for all kindsof mutation in yeast: base-substitutions, frameshifts,longer additions and deletions, and palindromeadditions, when sample sizes are adequate for itsdetection. The occurrence of frequent disparitysupports recombination models in which conversioncomes largely from hDNA, not largely from double-
550 B. C. LAMB
© The Genetical Society of Great Britain, Heredity, 80, 538–552.
strand gap-repair. Disparity can be for 5:3/3:5 and/orfor 6:2/2:6 classes; there is little correlation in yeastbetween these two types of disparity, which weremore often in opposite directions than in the samedirection.
There was little correlation between a mutation’smolecular nature (or that of the mispairs in theheterozygote) and the amount or direction of dispar-ity. Disparity sometimes depended on a mutation’sposition within a locus, but not systematically. It canalso depend on mutations at other loci, such asRAP1. It is not usually possible to predict whendisparity will occur, nor its direction or extent.Disparity results from heteroallelic crosses can bemisleading because of co-conversion effects.
Conversion disparity has a number of differentorigins. The most frequent cause of 6:2/2:6 disparityfrom asymmetric hDNA is correction directiondisparity, as that does not cause simultaneous 5:3/3:5disparity. 6:2/2:6 disparity could also be caused byunequal invasion frequencies of the two types ofnonsister chromatid in asymmetric hDNA, eitherdirectly or as a consequence of different frequenciesin double-strand gaps or breaks in the two types ofchromatid.
5:3/3:5 disparity has two possible origins. One isfrom unequal invasion frequencies of the two typesof nonsister chromatids in asymmetric hDNA, butthat is unlikely to be the major origin in these yeastdata as it should tend to give 6:2/2:6 disparity in thesame direction as 5:3/3:5 disparity, which onlyhappened once in these data. A more likely origin isbias in strand invasion frequency (d80.5) and adifference in correction frequency of the twomispairs, AY and XB, (p8q). That will usually giveopposite directions for the two kinds of disparity,unless affected by correction direction bias for the6:2/2:6 disparity. Correction direction disparity doesnot affect 5:3/3:5 disparity from asymmetric hDNA,but would from symmetric hDNA.
The high conversion frequencies and largeamounts of disparity frequently shown here in yeastmean that gene conversion could often be a power-ful force in changing allele frequencies, especially inlarge microbial populations when genetic drift isrelatively less important. Sometimes the wild-typeallele is favoured, sometimes the mutant allele.
Acknowledgements
I thank the late Professor Seymour Fogel forpermission to quote unpublished data.
References
DETLOFF, P., SIEBER, J. AND PETES, T. D. 1991. Repair ofspecific base pair mismatches formed during meioticrecombination in the yeast Saccharomyces cerevisiae.Mol. Cell Biol., 11, 737–745.
FINK, G. R. AND STYLES, C. 1974. Gene conversion ofdeletions in the his4 region of yeast. Genetics, 77,231–244.
FOGEL, S. AND MORTIMER, R. K. 1969. Informational trans-fer in meiotic gene conversion. Proc. Natl. Acad. Sci.U.S.A., 62, 96–103.
FOGEL, S., HURST, D. D. AND MORTIMER, R. K. 1971. Geneconversion in unselected tetrads from multipointcrosses. Stadler Genetics Symposia 1, 2, 89–110.
FOGEL, S., MORTIMER, R. K., LUSNAK, K. AND TAVARES, F.1979. Meiotic gene conversion: a signal of the basicrecombination event in yeast. Cold Spring Harb. Symp.Quant. Biol., 43, 1325–1341.
FOGEL, S., MORTIMER, R. K. AND LUSNAK, K. 1981. Mechan-isms of meiotic gene conversion, or ‘wanderings on aforeign strand’. In: Strathern, J. N., Jones, E. W. andBroach, J. R. (eds) The Molecular Biology of the YeastSaccharomyces: Life Cycle and Inheritance, pp. 289–339.Cold Spring Harbor Laboratory, New York.
GILBERTSON, L. A. AND STAHL, F. W. 1996. A test of thedouble-strand break repair model for meiotic recombi-nation in Saccharomyces cerevisiae. Genetics, 144,27–41.
GIRARD, J. AND ROSSIGNOL, J.-L. 1974. The suppression ofgene conversion and intragenic crossing over in Ascobo-lus immersus: evidence for modifiers acting in theheterozygous state. Genetics, 76, 231–243.
KALOGEROPOULOS, A. AND THURIAUX, P. 1982. Parametersin gene conversion. Genet. Res., 40, 1–18.
KOLODKIN, A. R., KLAR, A. J. S. AND STAHL, F. W. 1986.Double-strand breaks can initiate meiotic recombina-tion in S. cerevisiae. Cell, 46, 733–740.
LAMB, B. C. 1975. Cryptic mutations: their predictedbiochemical basis, frequencies and effects on geneconversion. Mol. Gen. Genet., 137, 305–314.
LAMB, B. C. 1984. The properties of gene conversionimportant in its effects on evolution. Heredity, 53,113–138.
LAMB, B. C. 1985. The relative importance of meiotic geneconversion, selection and mutation pressure, in popula-tion genetics and evolution. Genetica, 67, 39–49.
LAMB, B. C. 1986. Gene conversion disparity: factors influ-encing its direction and extent, with tests of assump-tions and predictions in its evolutionary effects.Genetics, 114, 611–632.
LAMB, B. C. 1987. Tests of double-strand gap repair as amajor source of meiotic gene conversion in fungi.Heredity, 59, 63–71.
LAMB, B. C. 1988. The molecular origins of gene conver-sion disparity, and parameter interactions controlling itsextent. Genet. (Life Sci. Adv.), 7, 109–114.
LAMB, B. C. 1996a. Ascomycete genetics: the part playedby ascus segregation phenomena in our understanding
GENE CONVERSION DISPARITY IN YEAST 551
© The Genetical Society of Great Britain, Heredity, 80, 538–552.
of the mechanisms of recombination. Mycol. Res., 100,1025–1059.
LAMB, B. C. 1996b. The nine-parameter gene conversionmodel: simpler equations, validity tests, and multiplefits. Genetica, 98, 65–73.
LAMB, B. C. AND GHIKAS, A. 1979. The intergradation,genetic interchangeability and interpretation of geneconversion spectrum types. Genetics, 92, 49–65.
LAMB, B. C. AND HELMI, S. 1982. The extent to which geneconversion can change allele frequencies in popula-tions. Genet. Res., 39, 199–217.
LAMB, B. C. AND ZWOLINSKI, S. A. 1992. New equations anda method for finding nine parameter values for twoalleles at one locus to study gene conversion, usingAscobolus immersus. Genome, 35, 421–427.
LAWRENCE, C. W., SHERMAN, F., JACKSON, M. AND GILMORE,R. A. 1975. Mapping and gene conversion studies withthe structural gene for iso-1-cytochrome c in yeast.Genetics, 81, 615–629.
LEBLON, G. 1972a. Mechanism of gene conversion in Asco-bolus immersus. I. Existence of a correlation betweenthe origin of mutants induced by different mutagensand their gene conversion spectrum. Mol. Gen. Genet.,115, 36–48.
LEBLON, G. 1972b. Mechanism of gene conversion in Asco-bolus immersus. II. The relationships between thegenetic alterations in b1 or b2 mutants and their conver-sion spectrum. Mol. Gen. Genet., 116, 322–335.
MALONE, R. E., BULLARD, S., LUNDQUIST, S., KIM, S. AND
TARTOWSKI, T. 1992. A meiotic gene conversion gradientopposite to the direction of transcription. Nature, 359,154–155.
MESELSON, M. S. AND RADDING, C. M. 1975. A generalmodel for genetic recombination. Proc. Natl. Acad. Sci.U.S.A., 72, 358–361.
NICOLAS, A. AND PETES, T. D. 1994. Polarity of meiotic gene
conversion in fungi: contrasting views. Experientia, 50,242–252.
NICOLAS, A., TRECO, D., SCHULTES, N. P. AND SZOSTAK, J. W.1989. An initiation site for meiotic gene conversion inthe yeast Saccharomyces cerevisiae. Nature, 338, 35–39.
ORR-WEAVER, T. L. AND SZOSTAK, J. W. 1985. Fungalrecombination. Microbiol. Rev., 49, 33–58.
PAQUETTE, N. AND ROSSIGNOL., J.-L. 1978. Gene conversionspectrum of 15 mutants giving post-meiotic segregationin the b2 locus of Ascobolus immersus. Mol. Gen.Genet., 163, 313–326.
PETES, T. D. AND PUKKILA, P. J. 1995. Meiotic sister chro-matid recombination. Adv. Genet., 33, 41–62.
PORTER, S. E., WHITE, M. AND PETES, T. D. 1993. Geneticevidence that the meiotic recombination hotspot at theHIS4 locus of Saccharomyces cerevisiae does not repre-sent a site for a symmetrically processed double-strandbreak. Proc. Natl. Acad. Sci. U.S.A., 74, 4168–4172.
ROSSIGNOL., J.-L. AND HAEDENS, V. 1980. Relationshipbetween asymmetrical and symmetrical hybrid DNAformation during meiotic recombination. Curr. Genet.,1, 185–191.
ROSSIGNOL., J.-L., PAQUETTE, N. AND NICOLAS, A. 1979.Aberrant 4:4 asci, disparity in the direction of conver-sion, and frequencies of conversion in Ascobolus immer-sus. Cold Spring Harb. Symp. Quant. Biol., 43,1343–1352.
SUN, H., TRECO, D. AND SZOSTAK, J. W. 1991. Extensive3p-overhanging, single-stranded DNA associated withthe meiosis-specific double-strand breaks at the ARG4recombination initiation site. Cell, 64, 1155–1161.
SZOSTAK, J. W., ORR-WEAVER, T. L., ROTHSTEIN, R. J. AND
STAHL, F. W. 1983. The double-strand-break repairmodel for recombination. Cell, 33, 25–35.
YU-SUN, C. C., WICKRAMARATNE, M. R. T. AND WHITEHOUSE,H. L. K. 1977. Mutagen specificity in conversion patternin Sordaria brevicollis. Genet. Res., 29, 65–81.
552 B. C. LAMB
© The Genetical Society of Great Britain, Heredity, 80, 538–552.


