Gene and Metabolite Regulatory Network Analysis of … · development and metabolism, which are...
24
Gene and Metabolite Regulatory Network Analysis of Early Developing Fruit Tissues Highlights New Candidate Genes for the Control of Tomato Fruit Composition and Development 1[C][W][OA] Fabien Mounet, Annick Moing, Virginie Garcia, Johann Petit, Michael Maucourt, Catherine Deborde, Ste ´phane Bernillon, Gwe ´nae ¨lle Le Gall, Ian Colquhoun, Marianne Defernez, Jean-Luc Giraudel, Dominique Rolin, Christophe Rothan, and Martine Lemaire-Chamley* INRA-UMR 619 Biologie du Fruit, Centre de Bordeaux, F–33140 Villenave d’Ornon, France (F.M., A.M., V.G., J.P., M.M., C.D., S.B., D.R., C.R., M.L.-C.); Universite ´ de Bordeaux, UMR 619 Biologie du Fruit, F–33140 Villenave d’Ornon, France (F.M., A.M., V.G., J.P., M.M., C.D., S.B., D.R., C.R., M.L.-C.); Po ˆle Me ´tabolome- Fluxome, IFR 103, INRA de Bordeaux, F–33140 Villenave d’Ornon, France (M.M., C.D., S.B.); Institute of Food Research, Norwich Research Park, Colney, Norwich NR4 7UA, United Kingdom (G.L.G., I.C., M.D.); and EPCA, ISM, UMR 5255, CNRS-Universite ´ Bordeaux 1, F–24000 Perigueux, France (J.-L.G.) Variations in early fruit development and composition may have major impacts on the taste and the overall quality of ripe tomato (Solanum lycopersicum) fruit. To get insights into the networks involved in these coordinated processes and to identify key regulatory genes, we explored the transcriptional and metabolic changes in expanding tomato fruit tissues using multivariate analysis and gene-metabolite correlation networks. To this end, we demonstrated and took advantage of the existence of clear structural and compositional differences between expanding mesocarp and locular tissue during fruit development (12–35 d postanthesis). Transcriptome and metabolome analyses were carried out with tomato microarrays and analytical methods including proton nuclear magnetic resonanceand liquid chromatography-mass spectrometry, respectively. Pairwise comparisons of metabolite contents and gene expression profiles detected up to 37 direct gene-metabolite correlations involving regulatory genes (e.g. the correlations between glutamine, bZIP, and MYB transcription factors). Correlation network analyses revealed the existence of major hub genes correlated with 10 or more regulatory transcripts and embedded in a large regulatory network. This approach proved to be a valuable strategy for identifying specific subsets of genes implicated in key processes of fruit development and metabolism, which are therefore potential targets for genetic improvement of tomato fruit quality. Fleshy fruit development leads to the formation of a juicy, expanded, and generally sweet and colored fruit (Coombe, 1976). Because they are rich in fibers, vita- mins, and minerals, fleshy fruits may have a consider- able effect on human health (Ness and Powles, 1997, 1999; World Health Organization, 2003). As a conse- quence, recommendations have recently reached five daily portions of fruit or vegetable. In addition to nutritional quality, the sensorial quality of fruit (e.g. visual aspect, firmness, and taste) is of utmost impor- tance for fruit consumption. Sensorial quality depends on numerous factors, including fruit color, texture, aroma, and composition in primary metabolites (sug- ars, organic acids, and amino acids). Both the nutri- tional and the sensorial attributes are built throughout the successive phases of fruit development, namely cell division, cell expansion, and ripening. While the fruit- ripening process is obviously important (Giovannoni, 2001), there is also a growing body of evidence that supports the key role of early fruit development for the acquisition of several fruit quality traits, including the accumulation of sugars and organic acids (Guillet et al., 2002; Lemaire-Chamley et al., 2005; Carrari et al., 2006; Petreikov et al., 2006), the determination of cell wall and texture characteristics (Chaı ¨b et al., 2007), and the cuticle biosynthesis (Mintz-Oron et al., 2008). In the growing fruit, these processes mainly take place during the cell expansion phase, which sustains fruit growth by allowing a large increase in fruit cell volume linked with membrane and cell wall/synthesis and the con- 1 This work was supported by Re ´gion Aquitaine (project no. 20051303006ABC and a Ph.D. grant to F.M.) and under the auspices of the EUSOL Integrated Project (grant no. FOOD–CT–2006–016214), the European Union STREP project META-PHOR (grant no. FOOD– CT–2006–036220), and the PAI Alliance (grant no. 12155UC). * Corresponding author; e-mail [email protected]. The author responsible for distribution of materials integral to the findings presented in this article in accordance with the policy described in the Instructions for Authors (www.plantphysiol.org) is: Martine Lemaire-Chamley ([email protected]). [C] Some figures in this article are displayed in color online but in black and white in the print edition. [W] The online version of this article contains Web-only data. [OA] Open Access articles can be viewed online without a sub- scription. www.plantphysiol.org/cgi/doi/10.1104/pp.108.133967 Plant Physiology, March 2009, Vol. 149, pp. 1505–1528, www.plantphysiol.org Ó 2009 American Society of Plant Biologists 1505 www.plantphysiol.org on August 31, 2018 - Published by Downloaded from Copyright © 2009 American Society of Plant Biologists. All rights reserved.
-
Upload
truongtruc -
Category
Documents
-
view
214 -
download
0
Transcript of Gene and Metabolite Regulatory Network Analysis of … · development and metabolism, which are...

Gene and Metabolite Regulatory Network Analysis ofEarly Developing Fruit Tissues Highlights NewCandidate Genes for the Control of Tomato FruitComposition and Development1[C][W][OA]
Fabien Mounet, Annick Moing, Virginie Garcia, Johann Petit, Michael Maucourt, Catherine Deborde,Stephane Bernillon, Gwenaelle Le Gall, Ian Colquhoun, Marianne Defernez, Jean-Luc Giraudel,Dominique Rolin, Christophe Rothan, and Martine Lemaire-Chamley*
INRA-UMR 619 Biologie du Fruit, Centre de Bordeaux, F–33140 Villenave d’Ornon, France (F.M., A.M., V.G.,J.P., M.M., C.D., S.B., D.R., C.R., M.L.-C.); Universite de Bordeaux, UMR 619 Biologie du Fruit, F–33140Villenave d’Ornon, France (F.M., A.M., V.G., J.P., M.M., C.D., S.B., D.R., C.R., M.L.-C.); Pole Metabolome-Fluxome, IFR 103, INRA de Bordeaux, F–33140 Villenave d’Ornon, France (M.M., C.D., S.B.); Institute of FoodResearch, Norwich Research Park, Colney, Norwich NR4 7UA, United Kingdom (G.L.G., I.C., M.D.); andEPCA, ISM, UMR 5255, CNRS-Universite Bordeaux 1, F–24000 Perigueux, France (J.-L.G.)
Variations in early fruit development and compositionmay havemajor impacts on the taste and the overall quality of ripe tomato(Solanum lycopersicum) fruit. To get insights into the networks involved in these coordinated processes and to identify keyregulatory genes, we explored the transcriptional and metabolic changes in expanding tomato fruit tissues using multivariateanalysis and gene-metabolite correlation networks. To this end, we demonstrated and took advantage of the existence of clearstructural and compositional differences between expanding mesocarp and locular tissue during fruit development (12–35 dpostanthesis). Transcriptome and metabolome analyses were carried out with tomato microarrays and analytical methodsincludingprotonnuclearmagnetic resonance and liquid chromatography-mass spectrometry, respectively. Pairwise comparisonsof metabolite contents and gene expression profiles detected up to 37 direct gene-metabolite correlations involving regulatorygenes (e.g. the correlations between glutamine, bZIP, andMYB transcription factors). Correlation network analyses revealed theexistence of major hub genes correlatedwith 10 or more regulatory transcripts and embedded in a large regulatory network. Thisapproach proved to be a valuable strategy for identifying specific subsets of genes implicated in key processes of fruitdevelopment and metabolism, which are therefore potential targets for genetic improvement of tomato fruit quality.
Fleshy fruit development leads to the formation of ajuicy, expanded, and generally sweet and colored fruit(Coombe, 1976). Because they are rich in fibers, vita-mins, and minerals, fleshy fruits may have a consider-able effect on human health (Ness and Powles, 1997,1999; World Health Organization, 2003). As a conse-quence, recommendations have recently reached five
daily portions of fruit or vegetable. In addition tonutritional quality, the sensorial quality of fruit (e.g.visual aspect, firmness, and taste) is of utmost impor-tance for fruit consumption. Sensorial quality dependson numerous factors, including fruit color, texture,aroma, and composition in primary metabolites (sug-ars, organic acids, and amino acids). Both the nutri-tional and the sensorial attributes are built throughoutthe successive phases of fruit development, namely celldivision, cell expansion, and ripening. While the fruit-ripening process is obviously important (Giovannoni,2001), there is also a growing body of evidence thatsupports the key role of early fruit development for theacquisition of several fruit quality traits, including theaccumulation of sugars and organic acids (Guillet et al.,2002; Lemaire-Chamley et al., 2005; Carrari et al., 2006;Petreikov et al., 2006), thedetermination of cellwall andtexture characteristics (Chaıb et al., 2007), and thecuticle biosynthesis (Mintz-Oron et al., 2008). In thegrowing fruit, these processesmainly take place duringthe cell expansion phase, which sustains fruit growthby allowing a large increase in fruit cell volume linkedwith membrane and cell wall/synthesis and the con-
1 This work was supported by Region Aquitaine (project no.20051303006ABC and a Ph.D. grant to F.M.) and under the auspicesof the EUSOL Integrated Project (grant no. FOOD–CT–2006–016214),the European Union STREP project META-PHOR (grant no. FOOD–CT–2006–036220), and the PAI Alliance (grant no. 12155UC).
* Corresponding author; e-mail [email protected] author responsible for distribution of materials integral to the
findings presented in this article in accordance with the policydescribed in the Instructions for Authors (www.plantphysiol.org) is:Martine Lemaire-Chamley ([email protected]).
[C] Some figures in this article are displayed in color online but inblack and white in the print edition.
[W] The online version of this article contains Web-only data.[OA] Open Access articles can be viewed online without a sub-
scription.www.plantphysiol.org/cgi/doi/10.1104/pp.108.133967
Plant Physiology, March 2009, Vol. 149, pp. 1505–1528, www.plantphysiol.org � 2009 American Society of Plant Biologists 1505 www.plantphysiol.orgon August 31, 2018 - Published by Downloaded from
Copyright © 2009 American Society of Plant Biologists. All rights reserved.
comitant accumulation of water, mineral ions, andmetabolites in the vacuoles, thereby conferring itsfleshy characteristics to the fruit. Increasing evidencelinks the enlargement of fruit cells with an increase innuclear ploidy level (Gonzalez et al., 2007), but the wayin which fruit growth and associated metabolicchanges are regulated and coordinated largely remainsan open question.
In most cases, fruit development and metabolismare clearly interconnected (Carrari et al., 2004) andundergo major shifts that coincide with transitionsbetween successive phases of fruit development(Lemaire-Chamley et al., 2005; Carrari and Fernie,2006; Carrari et al., 2007). Reverse genetic approacheshave demonstrated that alterations in fruit metabo-lism/composition may affect fruit development andvice-versa. As an example, increasing fruit Suc contentby down-regulating invertase or vacuolar ATPasegenes affects fruit growth and fruit size (Klann et al.,1996; Amemiya et al., 2006). Conversely, altering theethylene-dependent signal transduction networks hasa considerable effect on fruit ripening and associatedchanges, including fruit color, aroma, sugar, and or-ganicacids (Wilkinsonet al., 1995;BarryandGiovannoni,2006; Carrari and Fernie, 2006; Giovannoni, 2007). Forearly stages of fruit development, auxin and brassino-steroids are believed to act as major regulatory signals(Balbi and Lomax, 2003; Montoya et al., 2005). Theauxin-dependent signal transductionnetworkhas beenthe most studied because of its role in fruit set and cellexpansionphases (Gillaspy et al., 1993;Catalaetal., 2000;Balbi andLomax, 2003; Lemaire-Chamley et al., 2005). Inaddition, cross talk between auxin and ethylene hasbeen suggested for regulating early fruit development(Balbi and Lomax, 2003) and the onset of ripening(Jones et al., 2002).
Besides signaling pathways linked to plant hor-mones, elements of regulatory networks controllingfruit development and composition have been discov-ered in recent years by map-based cloning strategies,using well-characterized pleiotropic mutants with al-tered fruit ripening or color (rin, Cnr, hp1, and hp2mutants; Manning et al., 2006; Giovannoni, 2007;Seymour et al., 2008). Until now, with the exception oftheNrmutant encoding anethylene receptor (Wilkinsonet al., 1995) and the hp3 mutation affecting an abscisicacid biosynthetic gene (Galpaz et al., 2008), the ripeningmutations with known biochemical functions thathave been identified affect signal transduction pro-teins, being either transcription factors (the MADS boxand SBP box transcription factors) or proteins with apossible role in light signaling (DET1 and DDB1; Liuet al., 2004; Giovannoni, 2007; Wang et al., 2008). Thesestudies further demonstrated that the alteration of asingle regulatory gene may affect processes rangingfrom independent biosynthetic pathways controllingseveral phytonutrients (Davuluri et al., 2005; Wanget al., 2008) to whole developmental processes such asripening. So far, we have very little insight into themolecular networks regulating the complex and con-
certed modifications occurring in the early developingfruit, before the onset of fruit ripening. In addition, littleis also known about the regulation of biochemicalpathways controlling the accumulation of metabolitesat these stages and their connection with fruit devel-opment. Although several mutants affected in theregulation of early fruit development and compositionhave been identified (C. Rothan, unpublished data), theisolation of the corresponding alleles through forwardgenetics approaches, as has been done for the tomato(Solanum lycopersicum) ripening mutants, remains along-term objective. The acquisition and integrationof “omic” data (transcriptome, proteome, and metab-olome), coupled with functional analysis of the candi-date regulatory genes identified by such approaches,may constitute an alternative and complementarystrategy to identify target genes regulating either singlebiochemical pathways or more complex developmen-tal programs in the growing fruit.
Systems biology approaches have recently emergedas highly powerful tools for discovering links betweencoregulated genes and pathways and, ultimately, forpredicting gene function and identifying regulatorygenes in plants (Saito et al., 2007). Coexpression anal-yses allowed the identification of genes regulatingtissue and cell development (Persson et al., 2005;Gifford et al., 2008), environmental responses (Wanget al., 2006), and plant metabolism (Hirai et al., 2007;Gutierrez et al., 2008) and were further validated byreverse genetics strategies.With the current availabilityof large-scale gene expression and metabolite profilingtechniques in many plants, including tomato (Albaet al., 2004, 2005; Lemaire-Chamley et al., 2005; Mocoet al., 2006; Mounet et al., 2007; Saito et al., 2007;Mintz-Oron et al., 2008; Schauer et al., 2008), largegene expression and metabolite data sets can be com-bined through correlation and clustering analyses(Urbanczyk-Wochniak et al., 2003) and further repre-sented as a network of relationships between genes andmetabolites (Aoki et al., 2007; Saito et al., 2007; Hoefgenand Nikiforova, 2008). These approaches have beensuccessfully applied to the discovery of regulatory andbiosynthetic genes involved in the control ofmetaboliteproduction, such as the glucosinolate metabolism(Hirai et al., 2004, 2007). In tomato, the combination ofmetabolome and transcriptome data obtained duringfruit development recently led to the identification ofnovel associations (Carrari et al., 2006), opening theway for the manipulation of fruit compositional traitsusing transgenic approaches or natural and artificiallyinduced genetic variability (Rothan and Causse, 2007).
In this study,we explored the cell expansion phase oftomato fruit development at the level of the transcrip-tome and metabolome to identify regulatory genesinvolved in the control of developmental andmetabolicprocesses that may affect fruit quality. Attention wasfocused on the two major expanding tissues in tomatofruit, mesocarp and locular tissue. We took advantageof both the similarity and variability existing at themorphological, cellular, transcript, and composition
Mounet et al.
1506 Plant Physiol. Vol. 149, 2009 www.plantphysiol.orgon August 31, 2018 - Published by Downloaded from
Copyright © 2009 American Society of Plant Biologists. All rights reserved.

levels between these two tissues during early fruitdevelopment to undertake a combined analysis oftranscript and metabolite data under a range of tissueconditions. Data integration achieved through correla-tion analyses revealednumerous correlations, commonto both tissues, between metabolites and transcriptsinvolved in regulatory processes, embedded in a largenetwork. Many correlations were novel and unpredict-able and highlighted candidate genes that should be ofgreat potential for modifying tomato fruit compositionby genetic means.
RESULTS
Cell Expansion during Fruit Development Proceeds
Differently in Mesocarp and Locular Tissue
Mesocarp and locular tissue (Fig. 1) bothundergocellexpansion in developing tomato fruit. Mesocarp (Fig.1B) develops from the carpelwall after fertilization andis the most abundant tissue in tomato fruit, represent-ing approximately 50% (w/w) of the fruit fresh weight(data not shown). Its quantitative importance remainsstable throughout fruit development. The differentia-tion of the locular tissue during fruit development isparticularly impressive: in the cultivar studied here, itstarts to develop from columella at around 4 d postan-thesis (DPA; Lemaire-Chamley et al., 2005; data notshown) and fills the locular cavity as early as 20 DPA(Fig. 1C). At 35 DPA, locular tissue is the second mostabundant tissue in tomato fruit, representing 23%(w/w) of the fruit fresh weight. The proportions of exo-carp, columella, and seed in the fruit slowly decreaseduring earlydevelopment and remainbetween10%and17% (w/w) of the fruit fresh weight.In order to characterize precisely mesocarp and
locular tissue during fruit development, detailed cyto-logical analyses were performed from anthesis to the
ripe fruit stage (45 DPA for cv Ailsa Craig plants underour culture conditions). As described for other tomatocultivars (Cheniclet et al., 2005), cell division occurredvery transiently after fruit set and resulted in an in-crease of pericarp cell layers from11.36 0.8 to 20.66 0.5between 2 and 6 DPA. After 6 DPA, the number of celllayers remained stable in the pericarp, but its thicknessincreased dramatically due to cell expansion. Indeed,themeanmesocarp cell size doubled between 12 and 20DPA (early expansion) and tripled between 20 and 35DPA (late expansion; Fig. 1B). In locular tissue, themean cell size doubled during early expansion but wasmultiplied only by 1.5 during late expansion (Fig. 1C).Locular tissue cells were smaller than mesocarp cellsduring the entire cell expansion period, and their sizewere more homogeneous when compared with meso-carp cells, which contained both small and large cells at35 DPA (Fig. 1B). In addition, the cytological analysissuggested a different cell wall structure between thetwo tissues, locular tissue cell walls appearing undu-lated in comparison with mesocarp cell walls (Fig. 1, Band C) in our conditions of analysis.
Mesocarp and Locular Tissue Differ in TheirMetabolic Composition
Since cytological analyses indicated obvious differ-ences at the cellular level between the expanding me-socarp and locular tissue, we investigated whethermetabolic composition also differed between these twotissues. For this, we characterized the metabolite com-positionof tomatomesocarp and locular tissue from thesame fruits during cell expansion as follows: (1) pri-mary metabolites were measured by 1H-NMR (quanti-fication of 20 identified and five unknownmetabolites)and enzymatic reactions (starch); (2) secondary metab-olites were determined byHPLC-diode array detection(DAD; quantification of eight metabolites) and by liq-
Figure 1. Structure of mesocarp and locu-lar tissues of Ailsa Craig tomato fruitsduring the expansion phase. A, Schematicrepresentation of a fruit section. B, Peri-carp section at 12, 20, and 35 DPA. C,Locular tissue section at 12, 20, and 35DPA. Bars = 500 mm. For each tissue anddevelopmental stage, the mean cell size(1023 mm2) is indicated in a white frame(mean of nine replicates). Col, Columella;E, exocarp; En, endocarp; L, locular tissue;M, mesocarp; P, pericarp; S, seed; Sep,septum; V, vascular bundles. [See onlinearticle for color version of this figure.]
Gene-Metabolite Regulations in Tomato Fruit
Plant Physiol. Vol. 149, 2009 1507 www.plantphysiol.orgon August 31, 2018 - Published by Downloaded from
Copyright © 2009 American Society of Plant Biologists. All rights reserved.

uid chromatography-mass spectrometry (LC-MS; rela-tive quantification of eight metabolites). The data wereanalyzed using two unsupervised statistical methods(principal component analysis [PCA] on all 42 metab-olites and Kohonen’s self-organizing maps [SOM] onthe 34 metabolites with absolute quantification) inorder to compare both tissues and the global modifica-tion of their metabolic composition throughout fruitdevelopment. The PCA scores revealed that the meta-bolic compositions of the mesocarp and the loculartissue are different at each stage of development (Fig.2A). Indeed, the first principal component (PC1), ex-plaining 41% of the total variability, clearly separatedthe locular tissue samples on the positive side from themesocarp samples on the negative side. The examina-tion of PC1 loadings (Fig. 2B) allowed the identificationof metabolites involved in these differences and re-vealed discriminatory metabolites, as detailed below.The SOM analysis allowed us to map the 18 tissuesamples (two tissues 3 three development stages 3three replicates) according to their metabolic composi-tion (Fig. 3). The construction of different maps withincreasing unit numbers (four to 15 units) allowed us toincrease the map resolution and test its robustness. Asobserved for the PCA analysis, a clear separationbetween mesocarp and locular tissue samples wasvisible in the four maps (Fig. 3, A–D), pointing out thedifferences in metabolic composition of both tissues.This result was particularly obvious in the four-unitmap (Fig. 3A), since (1) for each tissue, the threedevelopmental stages (12, 20, and 35DPA)were groupedtogether and (2) the two tissues were mapped to dif-ferent units. The six-unitmap (Fig. 3B) revealed a closerproximity of metabolic composition in both tissues atthe earlier stages, since 12- and 20-DPA samples re-mained in the same unit but 35-DPA samples weregrouped in a neighboring unit. The nine-unit and 16-unit maps allowed a full discrimination of all sampletypes with a perfect clustering of the biological repli-cates (Fig. 3, C and D). The nine-unit map, whichshowed a clear separation of both tissues and develop-mental stages, was used for the component planerepresentation of each of the 29 identified and quanti-fied metabolites (Fig. 3E) in order to highlight discrim-inant metabolites, as detailed in the next paragraph.
For the PCA analysis, examination of PC1 loadings(Fig. 2B) suggested that the differences between thelocular tissue and mesocarp samples involved Suc,citrate, malate, amino acids (Asp, g-aminobutyrate[GABA], and Glu), caffeoylquinates (chlorogenateand another caffeoylquinate isomer [CQ1]), choline,and unknown compounds (unkD6.2 and unkS8.5) onthe positive side and Glc, Fru, starch, trigonelline,amino acids (Gln, Ile, Leu, Thr, and Val), and twounknown compounds (unkSD5.1 and unkS5.4) on thenegative side. The SOM component plane representa-tion of each of the 29 identified and quantified metab-olites (Fig. 3E) and the individualmetabolite changes inboth tissues during fruit development (Fig. 4) con-firmed these tendencies. In agreement with the PCA
results, major differences between mesocarp and locu-lar tissue were observed for sugar and organic acidcomposition. Indeed, Fru, Glc, Man, starch, and un-known sugar D5.1 were more abundant in mesocarp
Figure 2. PCA of absolute values of 34 metabolites measured by1H-NMR, LC-DAD, or enzymatic analyses, and relative levels of eightions measured by LC-MS from mesocarp and locular tissue extracts ofAilsa Craig tomato fruits at three stages of development. A, PCA scoresplot. B, PCA loadings plot. For eachPC, the loadings are indexedwith thecorresponding metabolite name. aChloro, Chlorogenic acid; Astr,astragalin; CQ1, caffeoylquinate1; CQ2, caffeoylquinate2; Car, caro-tene; Chloa, chlorophyll a; Chlob, chlorophyll b; Chol, choline; Cit,citrate; Fum, fumaric acid; Lut, lutein; Mal, malate; Rut, rutine; Tol,tomatidenol; Tom, tomatidine; TG1, tomatidine glycoside1; TG2,tomatidine glycoside2; Trig, trigonelline; UDPG, UDP-Glc; UnkD6.2,unknown sugar D6.2; UnkS5.4, unknown sugar S5.4; UnkS5.5, un-known sugar S5.5; UnkS8.5, unknown sugar S8.5; UnkSD5.1, unknownsugar SD5.1; Xant, xanthophylls.
Mounet et al.
1508 Plant Physiol. Vol. 149, 2009 www.plantphysiol.orgon August 31, 2018 - Published by Downloaded from
Copyright © 2009 American Society of Plant Biologists. All rights reserved.

Figure 3. Distribution of mesocarp and locular tissue samples at three developmental stages on a four-unit (A), six-unit (B), nine-unit (C), and 15-unit (D) SOM for absolute levels of 34 metabolites measured by 1H-NMR, LC-DAD, or enzymatic analyses. Thesamples are coded with the number of DPA, M for mesocarp and L for locular tissue, and the last letter of the code refers to thereplicate. E shows a component plane representation of some discriminant metabolites also identified by PCA.
Plant Physiol. Vol. 149, 2009 1509 www.plantphysiol.orgon August 31, 2018 - Published by Downloaded from
Copyright © 2009 American Society of Plant Biologists. All rights reserved.

Figure 4. Changes during fruit development for 42 identified metabolites or ions. A, Soluble sugars (Fru, Glc, Man, starch, Suc,UDP-Glc, unknown sugar D5.1). B, Amino acids (Ala, Asn, Asp, GABA, Glu, Gln, Ile, Leu, Phe, Thr, Tyr, and Val). C, Organicacids (citric, malic, and fumaric). D, Secondary metabolites (astragalin, caffeoylquinate derivative1, caffeoylquinate derivative2,chlorogenate, tomatidenol, tomatidine, tomatidine glycoside derivative1, tomatidine glycoside derivative2, rutin, choline,trigonelline, chlorophyll a, chlorophyll b, carotene, lutein, and xanthophylls). E, Unknown metabolites. For each developmental
Mounet et al.
1510 Plant Physiol. Vol. 149, 2009 www.plantphysiol.orgon August 31, 2018 - Published by Downloaded from
Copyright © 2009 American Society of Plant Biologists. All rights reserved.

than in locular tissue, whereas Suc and UDP-Glc weremore abundant in locular tissue. The organic acids(citrate, malate, and fumarate) were more abundant inlocular tissue than in mesocarp. Some differences inamino acids and secondary metabolites were also vis-ible. In particular, Asp, GABA, and Glu were moreabundant in locular tissue, whereas Gln, Ile, Leu, Thr,and Val were more abundant in mesocarp. Some sec-ondary metabolites were more abundant in loculartissue: chlorogenate, caffeoylquinate CQ1, choline, andtomatidenol/tomatidine.
Mesocarp and Locular Tissue Follow Parallel MetaboliteTrajectories during Fruit Development
Althoughmesocarp and locular tissuewere differentwith respect to their global metabolite composition,they followedparallel trajectories duringdevelopment,as highlighted by the PCA analysis inwhich the secondprincipal component (PC2), explaining 29% of the totalvariability, separated late (on the positive side) fromearly (on the negative side) stages of mesocarp andlocular tissue development. Examination of PC2 load-ings (Fig. 2B) suggested that these parallel changesinvolved Fru, Man, Tyr, and Phe on the positive sideand UDP-Glc, GABA, fumarate, isoprenoids (chloro-phyll a and b, lutein, and carotene), three caffeoylqui-
nates (chlorogenate and two other caffeoylquinateisomers), rutin, and three alkaloids (tomatidine, onetomatidine glycoside [TG2], and tomadidenol) on thenegative side. Indeed, examination of individual me-tabolite concentrations of virtual tissue samples in aSOM component plane representation (Fig. 3E) and ofthe samples (Fig. 4) shows that some metabolites in-creased in both tissues during fruit development (Fru,Man, Tyr, Asp, and Phe), whereas others decreased(UDP-Glc, GABA, fumarate, isoprenoids [chlorophyll aand b, lutein, carotene], three caffeoylquinates [chlo-rogenate and two other caffeoylquinate isomers], rutin,and three alkaloids [tomatidine, a tomatidine glycoside{TG2} and tomatidenol]).
Common behavior in metabolic networks in bothtissues was revealed by the calculation of pairwisecorrelation coefficients between metabolites. Of the861 possible metabolite pairs, 400 pairs resulted insignificant correlations (P , 0.05; Fig. 5), and amongthese, 276 correlations were highly significant (P ,0.01). All known metabolites showed highly signifi-cant correlations to compounds outside of their com-pound class except Asn and astragalin. The individualmetabolites that gave a number of correlations supe-rior or equal to 20 were unknown sugar D5.1, Ile, Asp,and unknown sugar S5.4. Starch was correlated to 14other metabolites. Sugars exhibited positive and neg-
Figure 4. (Continued.)
stage, asterisks indicate significant differences between mesocarp and locular tissues according to Student’s t test (P , 0.05).DW, Dry weight.
Plant Physiol. Vol. 149, 2009 1511
Gene-Metabolite Regulations in Tomato Fruit
www.plantphysiol.orgon August 31, 2018 - Published by Downloaded from Copyright © 2009 American Society of Plant Biologists. All rights reserved.

ative correlations with a given class of compoundexcept for pigments, in which only positive correla-tions were observed. Soluble sugars gave eight nega-tive and two positive correlations with organic acids,11 negative and 14 positive correlations with aminoacids, six negative and five positive correlations with
phenolics, and two negative and five positive correla-tions with alkaloids. Pigments (except xanthophylls)were correlated positively with Glc. Phe and Tyr werenegatively correlated with several pigments, pheno-lics, and alkaloids, but they showed no positive cor-relations.
Figure 5. Heat map of metabolite 3 metabolite correlations for both mesocarp and locular tissue during the cell expansionphase of Ailsa Craig tomato fruits. Metabolites were grouped by compound classes when known. Pearson correlation coefficients(r) were calculated. Each cell indicates a given r value in a false color scale for a significance of P, 0.05. Positive correlations areindicated by blue cells above the matrix diagonal. Negative correlations are indicated by red cells below the matrix diagonal.[See online article for color version of this figure.]
Mounet et al.
1512 Plant Physiol. Vol. 149, 2009 www.plantphysiol.orgon August 31, 2018 - Published by Downloaded from
Copyright © 2009 American Society of Plant Biologists. All rights reserved.

Few Genes Are Differentially Expressed during Early
Cell Expansion (12–20 DPA) in Mesocarp andLocular Tissue
To investigate gene expression changes during fruitdevelopment in mesocarp and locular tissue, we mon-itored the transcriptome of these tissues during theexpansion phase in tomato (Fig. 6A) using TOM1cDNA microarray slides (Van der Hoeven et al., 2002;Alba et al., 2004). MA-ANOVA analysis followed byelimination of low-quality data on the basis of back-ground threshold and flags (see “Materials andMethods”) allowed the selection of 1,139 spots with asignificant variation of expression (P , 0.01 and falsediscovery rate [FDR] , 0.05). Among them, 322 corre-sponded to genes of unknown function (SupplementalTable S1).Our experimental design (Fig. 6A) allowedusto compare gene expression between 12 and 35 DPA inmesocarp (expression ratios M12/M20 andM20/M35)and in locular tissue (expression ratios L12/L20 andL20/L35) and to compare gene expression in the twotissues at 12, 20, and 35 DPA (expression ratios L12/M12, L20/M20, and L35/M35). Among the 1,139 tran-scripts, 582 showed at least a 2-fold variation duringeither mesocarp or locular tissue development (ratio12:20 and/or 20:35.2 or,0.5) or in the comparison of
both tissues (ratio L12/M12, L20/M20, and/or L35/M35.2 or,0.5). More transcripts showed variation inlocular tissue than in mesocarp tissue during early(ratio 12:20) and late (ratio 20:35) expansion (Fig. 6B).This suggests that the locular tissue transcriptomechangedmore than that of themesocarp. Alternatively,this difference may result from the higher homoge-neity of locular tissue cells compared with mesocarpcells. Indeed, the mesocarp samples were composed ofheterogeneous-sized cells (Fig. 1). The gene expressionchanges detected by the microarray experiment in thistissue reflect the mean of the expression changes indifferent-sized cells and therefore may be lower thanwould be measured for the most expanding cells. Incontrast, locular tissue was composed of more homo-geneous cells, with a possible better synchronization ofgene expression changes.
A low number of genes were differentially detectedin both tissues between 12 and 20 DPA (Fig. 6B; Sup-plemental Table S1). Indeed only 4.7% (53 of 1,139) and9.4% (107 of 1,139) of the transcripts varied inmesocarpand locular tissues between 12 and 20 DPA (ratio 12:20.2 or ,0.5). Several, not necessarily mutually exclu-sive, hypotheses can explain this result: (1) the genesinvolved in early expansion are absent from the micro-array slide used in this study; (2) the variation of geneexpression during the early cell expansion phase is toolow to be detected due tomicroarray sensitivity; and (3)early cell expansion involves posttranscriptional mod-ifications of enzyme activities rather than transcrip-tional regulations. Most of the differences in geneexpression were observed between 20 and 35 DPA(ratio 20:35.2 or,0.5) in mesocarp and locular tissue(Fig. 6B; Supplemental Table S1), as described by otherauthors for pericarp (Alba et al., 2005; Carrari et al.,2006). Indeed 15.3% (174 of 1,139) and 35.1% (400 of1,139) of the transcripts showed expression variationsbetween 20 and 35DPA inmesocarp and locular tissue,respectively. A number of genes showing a decreasedexpression during this late expansion phase in loculartissue and mesocarp were related to photosyntheticactivity. This down-regulation paralleled the decreaseof chloroplastic pigments in these tissues (Figs. 3E and4D) and is consistent with the onset of modification ofchloroplasts into chromoplasts.
Transcriptional Changes of Metabolite Biosynthesis
Genes Account for Changes of Several Metabolites
As described above, the main metabolites accumu-lating in expanding cells ofmesocarp and locular tissuewere soluble sugars, organic acids (malate and citrate),and some amino acids. Among the 27 genes related tosugar and organic acid metabolism that were signifi-cantly expressed, 12 showed a differential expressionduring cell expansion in mesocarp and locular tissue(ratio 12:20 and/or 20:35 .2 or ,0.5; Table I; Supple-mental Table S1), and 13 were differentially expressedbetween the two tissues (ratio L12/M12, L20/M20,and/or L35/M35 .2 or ,0.5; Table II; Supplemental
Figure 6. Microarray analysis of gene expression in mesocarp andlocular tissue during the cell expansion phase of Ailsa Craig tomatofruits. A, Microarray experimental design for the comparison of meso-carp and locular tissues and three stages of development (12, 20, and35 DPA). Each arrow represents a hybridized microarray slide. B, Venndiagrams representing genes expressed in mesocarp and locular tissue.d and nd correspond to the number of genes differentially andnondifferentially expressed in these experiments, respectively.
Gene-Metabolite Regulations in Tomato Fruit
Plant Physiol. Vol. 149, 2009 1513 www.plantphysiol.orgon August 31, 2018 - Published by Downloaded from
Copyright © 2009 American Society of Plant Biologists. All rights reserved.

Table S1). In particular, an ADP-Glc pyrophosphory-lase (spot identifier [ID] 5.3.10.13) involved in starchsynthesis was down-regulated in both mesocarpand locular tissues between 20 and 35 DPA, and ana-amylase (spot ID 1.4.10.1) implicated in starch deg-radation was up-regulated between the same stages.These results are consistent with the decrease in starchlevels in both tissues between these stages (Fig. 4). Inaddition, this ADP-Glc pyrophosphorylase gene (spotID 5.3.10.13) was preferentially expressed in mesocarptissue at 35 DPA, and the a-amylase gene (spot ID1.4.10.1) was preferentially expressed in locular tissueat 20 DPA, in agreement with the higher amount ofstarch in the mesocarp. Metabolic characterization ofboth tissues showed that organic acid concentrationsincreased during fruit development, especially be-tween 20 and 35 DPA in locular tissue, and to a lesserextent in themesocarp. This increasewas accompaniedby an increased expression of a cytosolic aconitase gene
(spot ID 4.4.3.16), consistent with the involvement ofthis enzyme in the tricarboxylic acid (TCA) cycle.
Twelve amino acidswere quantified in this work andshowedvariations in both tissues during cell expansion(Fig. 4). In parallel, changes in the expression of genesinvolved in amino acid synthesis or degradation wereobserved in both tissues. Among the 25 genes related toamino acid metabolism that were significantly ex-pressed in our experiment, 10 showed a differentialexpression during cell expansion in mesocarp andlocular tissue (ratio 12:20 and/or 20:35 .2 or ,0.5;Table I; Supplemental Table S1) and 10 were differen-tially expressed between the two tissues (ratio L12/M12, L20/M20, and/or L35/M35 .2 or ,0.5; Table II;Supplemental Table S1). The decrease inGABA contentin locular tissue, between 12 and 20 DPA (Fig. 4), wasassociated with the decrease of transcripts of a Gludecarboxylase (spot ID 2.2.20.11). In addition, the levelof these transcripts decreased between 20 and 35 DPA
Table I. Functional classification of the genes differentially expressed during cell expansion in mesocarp (206 genes) and locular tissue (435 genes)
Function
Mesocarp Locular Tissue
Early Expansion Late Expansion Early Expansion Late Expansion
2a +b 2c +d 2a +b 2c +d
MetabolismPhotosynthesis (BIN 1) 3 4 27 3 13 2 38 3Central metabolisme 0 0 2 2 3 1 7 5Lipid metabolism (BIN 11) 1 1 1 3 3 1 7 4Amino acid metabolism (BIN 13) 1 1 5 1 3 0 1 6Secondary metabolism (BIN 16) 2 1 0 1 0 4 3 6Transport (BIN 34) 2 2 3 5 3 2 7 11Cell wall (BIN 10) 1 2 3 2 2 1 7 5Other metabolismf 2 2 2 13 2 6 11 15Total metabolism 12 13 43 30 29 17 81 55
RegulationHormones (BIN 17) 0 0 3 4 1 3 5 12Polyamine metabolism (BIN 22) 0 0 1 0 0 0 2 1Redox (BIN 21) 0 0 1 0 0 1 5 3Regulation of transcription (BIN 27.3) 1 1 9 6 4 3 12 16Chromatin structure (BIN 28.1) 0 0 0 0 0 0 0 2Regulation of protein activityg 1 2 7 5 4 0 14 23Signaling (BIN 30) 0 0 0 2 0 0 0 2Total regulation 2 3 21 17 9 7 38 59
OtherRNA processing/transcription (BIN 27.1–27.2) 0 0 0 2 2 0 0 2DNA synthesis/repair (BIN 28.1–28.2) 0 0 1 0 0 0 4 1Protein synthesis/folding (BIN 29.1–29.2) 0 1 5 1 5 1 7 5Stress (BIN 20) 3 2 8 2 9 0 12 12Development (BIN 33) 5 0 4 4 1 3 5 5Cell (BIN 31) 1 1 2 0 0 0 4 2
Not assigned (BIN 35) 3 7 17 17 9 15 52 56Total 26 27 101 73 64 43 203 197
aGene with an expression decreasing between 12 and 20 DPA (expression ratio [12:20]. 2). bGene with an expression increasing between 12and 20 DPA (expression ratio [12:20], 0.5). cGene with an expression decreasing between 20 and 35 DPA (expression ratio [20:35]. 2). dGenewith an expression increasing between 20 and 35 DPA (expression ratio [20:35] , 0.5). Genes were classified in BINs according to MapManclassification (Thimm et al., 2004). eCentral metabolism-related BINs: major carbohydrates (BIN 2), minor carbohydrates (BIN 3), glycolysis (BIN4), fermentation (BIN 5), gluconeogenesis/glyoxylate cycle (BIN 6), OPP cycle (BIN 7), TCA/organic acid transformations (BIN 8), mitochondrialelectron transport/ATP synthesis (BIN 9). fOther metabolism-related BINs: nitrogen assimilation (BIN 12), metal handling (BIN 15), cofactor/vitamin synthesis (BIN 18), tetrapyrole synthesis (BIN 19), nucleotide metabolism (BIN 23), miscellaneous (BIN 26). gRegulation of proteinactivity-related BINs: protein targeting (BIN 29.3), protein posttranslational modification (BIN 29.4), protein degradation (BIN 29.5).
Mounet et al.
1514 Plant Physiol. Vol. 149, 2009 www.plantphysiol.orgon August 31, 2018 - Published by Downloaded from
Copyright © 2009 American Society of Plant Biologists. All rights reserved.

in the mesocarp, in agreement with the decrease ofGABA levels in this tissue. ThisGludecarboxylase genewas expressed more in locular tissue at 12 DPA and inthe mesocarp at 20 DPA and not differentially ex-pressed between the two tissues at 35 DPA. Two addi-tional genes coding for a Glu decarboxylase showed adifferential expression between both tissues. The firstadditional Glu decarboxylase (spot ID 7.3.13.19) waspreferentially expressed in the mesocarp at 20 and 35DPA, while the second one (spot ID 6.1.5.21) was moreexpressed in locular tissue at 20 DPA. The increase inacetolactate synthase (an enzyme involved in Leu, Val,and Ile synthesis) transcripts (spot ID 7.1.18.7) duringthe late expansion stage in locular tissuewas consistentwith the observed increase in Leu content but not withthe decreases in Ile and Val contents. This suggestedsome form of regulation upstream in the pathway.Finally, the increase in the transcript coding for ahomo-Cys-S-methyl transferase (spot ID 6.1.18.17), ob-served between 20 and 35 DPA in both tissues, and its
preferential expression in locular tissue at 20 and 35DPAwere consistent with the implication of the corre-sponding protein in the metabolism of Met that isconnected to ethylene biosynthesis.
Choline is a secondary metabolite that accumulatedin both tissues during cell expansion, especially inlocular tissue (Fig. 4). The transcriptome analysis re-vealed that a phospholipase D gene (spot ID 1.2.19.17),involved in choline biosynthesis, was up-regulated inthe locular tissue between 20 and 35 DPA, consistentwith the observed increase of choline. In addition, thesetranscripts were preferentially detected in the loculartissue at 20 and 35 DPA, when the increase in cholinecontent in locular tissue was highest.
In addition, the modified expression of genes in-volved in metabolite synthesis was accompanied byan important transcriptional regulation of other genesparticipating in the growth process, such as thoseencoding proteins involved in ion (chloride, nitrate,and potassium) and water (membrane intrinsic pro-
Table II. Functional classification of the 412 genes differentially expressed between mesocarp (M) and locular tissue (L)
Function12 DPA 20 DPA 35 DPA
La Mb La Mb La Mb
MetabolismPhotosynthesis (BIN 1) 7 1 3 2 1 17Central metabolismc 0 2 1 3 3 6Lipid metabolism (BIN 11) 3 3 3 3 6 6Amino acid metabolism (BIN 13) 2 1 3 5 3 3Secondary metabolism (BIN 16) 3 1 3 1 4 0Transport (BIN 34) 2 0 3 8 10 9Cell wall (BIN 10) 1 6 2 10 5 6Other metabolismd 5 4 5 4 12 9Total metabolism 23 18 23 36 44 56
RegulationHormones (BIN 17) 2 2 8 3 11 4Polyamine metabolism (BIN 22) 0 0 0 1 1 1Redox (BIN 21) 2 0 2 0 2 1Regulation of transcription (BIN 27.3) 3 3 10 2 13 5Chromatin structure (BIN 28.1) 0 0 0 1 1 2Regulation of protein activitye 9 5 9 6 19 7Signaling (BIN 30) 0 0 0 0 1 1Total regulation 16 10 29 13 48 21
OtherRNA processing/transcription (BIN 27.1–27.2) 0 0 0 1 2 0DNA synthesis/repair (BIN 28.1–28.2) 2 2 1 2 2 3Protein synthesis/folding (BIN 29.1–29.2) 1 1 2 3 3 1Stress (BIN 20) 8 3 2 6 10 8Development (BIN 33) 1 4 4 2 4 2Cell (BIN 31) 1 2 1 2 4 2
Not assigned (BIN 35) 15 16 16 15 46 31Total 67 56 78 80 163 124
aGenes with a preferential expression in locular tissue (ratio [L/M]. 2). bGenes with a preferential expression in mesocarp (ratio [L/M] , 0.5).Genes were classified in BINs according to MapMan classification (Thimm et al., 2004). cCentral metabolism-related BINs: major carbohydrates(BIN 2), minor carbohydrates (BIN 3), glycolysis (BIN 4), fermentation (BIN 5), gluconeogenesis/glyoxylate cycle (BIN 6), OPP cycle (BIN 7), TCA/organic acid transformations (BIN 8), mitochondrial electron transport/ATP synthesis (BIN 9). dOther metabolism-related BINs: nitrogenassimilation (BIN 12), metal handling (BIN 15), cofactor/vitamin synthesis (BIN 18), tetrapyrole synthesis (BIN 19), nucleotide metabolism (BIN 23),miscellaneous (BIN 26). eRegulation of protein activity-related BINs: protein targeting (BIN 29.3), protein posttranslational modification (BIN29.4), protein degradation (BIN 29.5).
Gene-Metabolite Regulations in Tomato Fruit
Plant Physiol. Vol. 149, 2009 1515 www.plantphysiol.orgon August 31, 2018 - Published by Downloaded from
Copyright © 2009 American Society of Plant Biologists. All rights reserved.

Figure 7. (Legend appears on following page.)
Mounet et al.
1516 Plant Physiol. Vol. 149, 2009 www.plantphysiol.orgon August 31, 2018 - Published by Downloaded from
Copyright © 2009 American Society of Plant Biologists. All rights reserved.

teins) transport and electrogenic proton-translocatingpumps (ATPases and inorganic pyrophosphorylases).Indeed, 22 of these genes (among the 49 genes signifi-cantlyexpressed inourexperiment) showedadifferentialexpressionduringcell expansion inmesocarpand loculartissue (Table I; Supplemental Table S1) and 23 weredifferentially expressed between tissue types (Table II).
Changes in a Range of Metabolites Are Correlated toTranscriptional Changes of Regulatory Genes
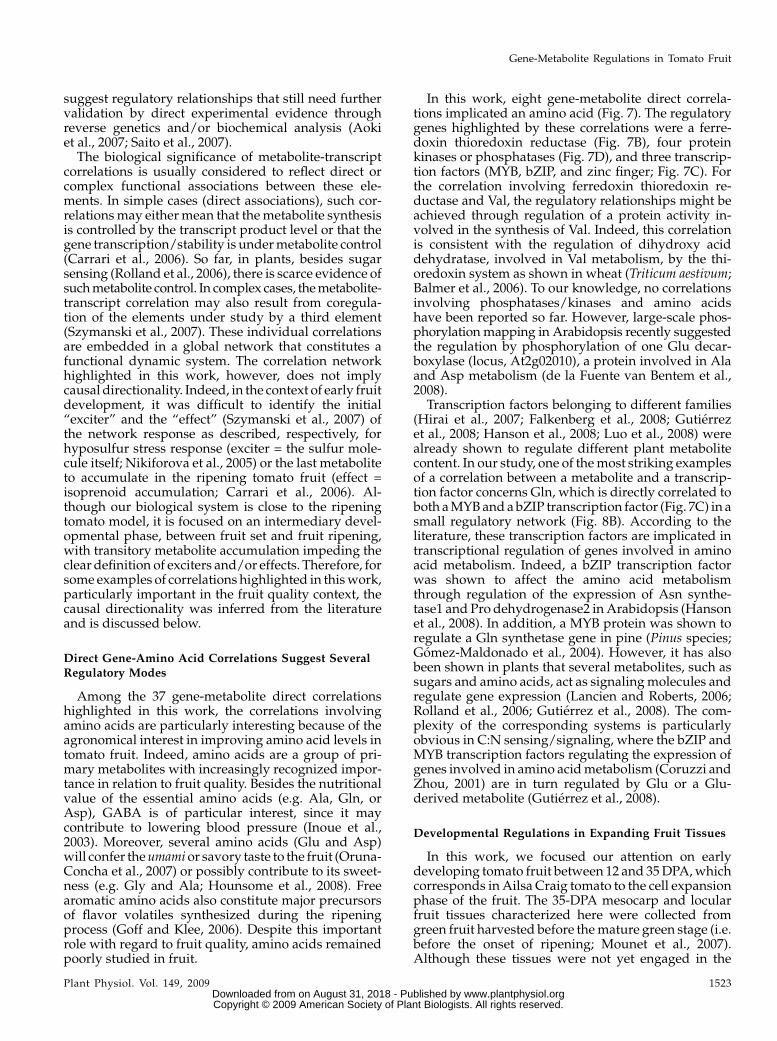
Tohave access to the regulatory processes controllingthe accumulation of metabolites implicated in fruitquality traits, we searched for correlations betweenmetabolite and transcript levels with special attention to“regulatory genes” (i.e. genes coding for proteins in-volved in regulatory processes such as hormone me-tabolismand response, transcription factors, epigeneticprocesses, redox regulation, and posttranscriptionalregulation of protein activity by phosphorylation/dephosphorylation and degradation). With a stringentcorrelation coefficient (P , 0.001), 37 correlations in-volving 20 different metabolites and 32 different genesrelated to regulatory processes were found (Fig. 7).Twenty-four correlations were positive and 13 werenegative. Eight correlations concerned genes involvedin hormone-polyamine biosynthesis/response (Fig.7A), six correlations implicated genes involved in re-dox regulation (Fig. 7B), seven correlations implicatedgenes coding for transcription factors (Fig. 7C), and 16correlations involved genes implicated in the regula-tion of protein activity (Fig. 7D). Among these correla-tions, four involved sugars, three involved an organicacid, eight involved amino acids, eight involved iso-prenoids, and13 involvedother secondarymetabolites.Cholinewas implicated in eight correlationswith genesissued from different functional categories.
Hormone Metabolism and Response
Correlation between metabolites and genes relatedto hormone metabolism and response implicatedgenes coding for proteins involved in ethylene synthe-sis (spot ID 1.2.9.5, 1-aminocyclopropane-1-carboxylate[ACC] oxidase 2; spot ID 1.1.10.9, lipoxygenase), poly-amine synthesis (spot ID 2.4.14.16, spermidine syn-thase 1), auxin signaling (spot ID 1.3.6.8, axi1-relatedprotein; spot ID 5.3.3.5, auxin-responsive proteinIAA27), and gibberellin synthesis and response (spotID 5.3.8.8, gibberellin 20-oxidase; spot ID 2.1.5.15,chitin-inducible gibberellin-responsive protein 1 PAT1;Fig. 7A). Two of these genes did not show significantvariation of expression in plant tissues (spot ID 2.1.5.15and 1.3.6.8; Supplemental Table S1), whereas the fiveothers were differentially expressed during mesocarpand locular tissue development (spot ID 1.1.10.9,1.2.9.5, 2.4.14.16, 5.3.3.5, and 5.3.8.8). In particular,the genes coding for the auxin-responsive proteinIAA27 (spot ID 5.3.3.5), the gibberellin 20-oxidase(spot ID 5.3.8.8), and the lipoxygenase (spot ID1.1.10.9) were preferentially expressed in the loculartissue, where they were up-regulated between 20 and35 DPA. In contrast, the gene encoding ACC oxidase 2(spot ID 1.2.9.5) was down-regulated during mesocarpand locular tissue development and was not differen-tially expressed between both tissues (SupplementalTable S1).
Transcription Factors
The five genes coding for transcription factors cor-related with metabolite levels belonged to differenttranscription factor families (Riechmann and Ratcliffe,2000; Guo et al., 2005): a zinc finger protein (spot ID7.1.14.21), a MYB (spot ID 6.4.19.18), a bZIP (spot ID2.3.8.15), an ERF (spot ID 8.3.12.16), and a NAC (spot
Figure 7. Scatterplots representing the significant correlation pairs between metabolite and transcript levels at three stagesduring the cell expansion phase of Ailsa Craig tomato fruits. A, Correlation with hormone and polyamine-related transcripts (BIN17 and BIN 22). B, Correlation with redox-related transcripts (BIN 21). C, Correlation with regulation of transcription-relatedtranscripts (BIN 27.3). D, Correlation with regulation of protein activity-related transcripts (BIN 29.3, BIN 29.4, and BIN 29.5).The value on the plot corresponds to the Pearson correlation coefficient (P , 0.001). White circles correspond to locular tissue,and black squares correspond to the mesocarp. Metabolite level (x axis) is expressed in mg g21 dry weight. Transcript level (yaxis) is expressed in arbitrary units as explained in “Materials and Methods.” Summarized annotations are as follows: for A, spotID 2.4.14.16, spermidine synthase 1; spot ID 5.3.8.8, gibberellin 20-oxidase; spot ID 5.3.3.5, auxin-responsive protein IAA27;spot ID 1.3.6.8, axi1-related protein; spot ID 1.2.9.5, ACC oxidase 2; spot ID 2.1.5.15, chitin-inducible gibberellin-responsiveprotein 1 PAT1; spot ID 1.1.10.9, lipoxygenase; for B, spot ID 7.3.4.5, ferredoxin-thioredoxin reductase catalytic chain; spot ID1.1.10.5, L-ascorbate peroxidase 2; spot ID 6.1.4.6, glutathione peroxidase 2; spot ID 4.1.8.12, glutathione S-transferase; spot ID8.4.15.15, superoxide dismutase [Cu-Zn]; for C, spot ID 7.1.14.21, zinc finger protein (CCCH); spot ID 8.3.12.16, ABR1 (ABArepressor1), member of the ERF; spot ID 6.4.19.18, Suc-responsive element-binding factor, ATMYB44; spot ID 2.3.8.15, bZIPtranscription factor TGA2; spot ID 3.2.13.13, NAC transcription factor; for D, spot ID 3.4.14.11, calreticulin-3 precursor,endoplasmic reticulum Ca2+ binding chaperone; spot ID 6.3.13.9, 26S proteasome AAA-ATPase subunit RPT1a; spot ID7.1.2.12, protein kinase; spot ID 4.3.14.7, Ser/Thr protein phosphatase TOPP4; spot ID 4.1.12.20; Kelch repeat-containing Ser/Thr phosphoesterase; spot ID 5.1.14.8, Leu-rich repeat transmembrane protein kinase; spot ID 2.2.10.18, SLT1 chaperoneprotein; spot ID 3.4.20.16, L-isoaspartyl methyltransferase; spot ID 3.1.20.18, Ser carboxypeptidase 19; spot ID 5.3.19.8 Sercarboxypeptidase; spot ID 6.2.8.6, Ser/Thr protein kinase; spot ID 5.2.17.3, Ser/Thr protein kinase CRK10; spot ID 3.2.10.1, Serprotease; spot ID 1.3.15.4, COP9 signalosome complex subunit 3; spot ID 4.2.8.3, ATP-dependent Clp protease. Completeannotation of the transcripts is available in Supplemental Table S1.
Gene-Metabolite Regulations in Tomato Fruit
Plant Physiol. Vol. 149, 2009 1517 www.plantphysiol.orgon August 31, 2018 - Published by Downloaded from
Copyright © 2009 American Society of Plant Biologists. All rights reserved.

ID 3.2.13.13). Among these transcripts, only the zincfinger (spot ID 7.1.14.21) and the NAC (spot ID3.2.13.13) transcripts were differentially expressed inthe experiment, with a preferential expression in loc-ular tissue at 20 DPA for the zinc finger and a prefer-ential expression at 35 DPA in mesocarp and loculartissue for the NAC (Supplemental Table S1).
Regulation of Protein Activity
The expression levels of different types of genes,coding for proteins implicated in the modification ofenzyme activity, were correlated to metabolite levels.They encoded protein kinases or phosphatases (spot ID4.1.12.20, 4.3.14.7, 5.1.14.8, 5.2.17.3, 6.2.8.6, and7.1.2.12),proteases (spot ID 3.1.20.18, 3.2.10.1, 4.2.8.3, and5.3.19.8), proteins involved in degradation pathways(26S proteasome AAA-ATPase subunit RPT1a, spot ID6.3.13.9; COP9 signalosome complex subunit, spot ID1.3.15.4), chaperones (spot ID 2.2.10.18 and 3.4.14.11),methyl transferase (spot ID 3.4.20.16), and a proteininvolved in the redox regulation of protein activity(ferredoxin-thioredoxin reductase catalytic chain, spotID 7.3.4.5; Fig. 7, B and D). Among these genes, eightdid not show any significant variation of expressionduring the development ofmesocarp and locular tissueor a differential expression between tissues (COP9signalosome complex subunit, spot ID 1.3.15.4; 26Sproteasome AAA-ATPase subunit RPT1a, spot ID6.3.13.9; protein kinase, spot ID 7.1.2.12; ferredoxin-thioredoxin reductase catalytic chain, spot ID 7.3.4.5;two chaperones, spot ID 2.2.10.18 and 3.4.14.11; ATP-dependent Clp protease, spot ID 4.2.8.3; L-isoaspartylmethyltransferase, spot ID 3.4.20.16; Supplemental Ta-ble S1). Five genes were preferentially expressed inlocular tissue (Ser carboxypeptidases, spot ID 3.1.20.18and 5.3.19.8; Ser protease, spot ID 3.2.10.1; Ser/Thrprotein kinases, spot ID 5.2.17.3 and 6.2.8.6), and threeothers were preferentially expressed inmesocarp (Ser/Thrphosphoesterase, spot ID4.1.12.20; Ser/Thrproteinphosphatase, spot ID 4.3.14.7; protein kinase, spot ID5.1.14.8). In addition, five of these genes were up-regulated during the early expansion either in meso-carp (Ser/Thr protein phosphatase, spot ID 4.3.14.7) orlocular tissue (Ser/Thr phosphoesterase, spot ID4.1.12.20; Ser carboxypeptidase, spot ID 5.3.19.8) or inboth tissues (Ser protease, spot ID 3.2.10.1, Ser/Thr-protein kinase, spot ID 6.2.8.6).
Network of Correlations between Metabolite Levels and
Transcript Levels of Regulatory Genes
Most of the direct correlations between a metaboliteand a regulatory gene, presented in the previous par-agraphs (Fig. 7), were organized in a complex networksince regulatory genes correlated to metabolite levelswere also correlated to other regulatory genes (Fig. 8;Supplemental Tables S2 and S3). However, in somecases, the metabolite/regulatory gene correlated pairswere not correlated to other regulatory genes. This was
the case for the three pairs involving UDP-Glc, Asp,and trigonelline and for Gln, whichwas implicated in asmall network involving two genes coding for tran-scription factors (Fig. 8B) already identified in thedirectcorrelation analysis (Fig. 7C). Other metabolites werepart of small regulatorynetworks involving threegeneseach for the three glycoalkaloids (tomatidenol, toma-tidine, and tomatidine glycoside), the unknown sugarS5.4 (Fig. 8C), and eight genes for Ala. In the sameway,Ile and unknown sugar D5.1 were part of a regulatorynetwork involving 12 genes. The 10 other metabolites(starch, Val, citrate, malate, chlorophylls A and B,xanthophylls, carotene, choline, and unknown metab-olite S5.5) were included in a complex regulatorynetwork involving 145 genes. The different functionalcategories were not grouped into clusters but rathermixed with other functional categories. A number ofgenes belonging to the whole range of regulatorycategories, aswell as choline,were found tobe involvedin more than 10 correlations. Thus, they connecteddifferent parts of the regulatory network (Fig. 8A; TableIII) and were identified as being regulatory hubs.
An analysis by K-means suggested that the regula-tory hubs had expression profiles belonging to fivedifferent patterns (Fig. 9A; Table III). This analysis alsorevealed that only two hub genes (group 1) have astronger expression at early stages of fruit develop-ment: spot ID 1.2.8.13, Dwarf1/Diminuto; and spot ID1.1.2.18, homeobox-Leu zipper protein HAT22. Thefour other expression groups correspond to geneswith increased expression between 12 and 35 DPA.These groups are characterized by different levels ofexpression variations and/or by differences betweenthe two tissues (e.g. a strong increase in both tissues ingroup 2, in which log2 [X/M12] shifts from 0 to 5.4 inlocular tissue and from0 to 3.4 inmesocarp, and a lowerincrease in group 3, inwhich log2 [X/M12] shifts from 0to 3.1 in locular tissue and from 0 to 1.4 in mesocarp).These groups contain a few genes already implicatedin tomato fruit development, like NAC-NOR (spot ID8.2.9.17; group 2), RIN (spot ID 8.2.16.2; group 3), andthe ACC synthase 2 (spot ID 6.2.3.14; group 5). Real-time reverse transcription (RT)-PCR experiments al-lowed the validation of the expression data obtainedby microarrays (Fig. 9B). Indeed, in most cases,the expression profiles obtained by microarrays andby real-time RT-PCRwere very similar. However, somediscrepancies were observed for some genes, for ex-ample, for the WAK kinase (spot ID 1.4.18.1), probablydue to cross-hybridizations on the TOM1 cDNAmicro-array slides.
Hormone Metabolism and Response
Eight genes coding for proteins involved in hormonemetabolism were found to be hubs in the regulatorynetwork (Table III). They are related to brassinosteroidsignaling (Dwarf1/Diminuto, spot ID 1.2.8.13), auxinsignaling (auxin-responsive protein, spot ID 1.2.20.12;iaa6, spot ID 5.3.3.5), and ethylene synthesis and re-
Mounet et al.
1518 Plant Physiol. Vol. 149, 2009 www.plantphysiol.orgon August 31, 2018 - Published by Downloaded from
Copyright © 2009 American Society of Plant Biologists. All rights reserved.

sponse (two 2-oxoglutarate-dependent dioxygenases,spot ID 8.4.11.13 and 6.1.16.20; ACC synthase 2, spot ID6.2.3.14; ERF, spot ID 1.2.19.20; lipoxygenase 1, spot ID1.1.10.9). Except for Dwarf1/Diminuto transcript (spotID 1.2.8.13), all other regulatory hubs involved inhormone metabolism and response were up-regulatedduring locular tissue and mesocarp development (Fig.9; Supplemental Table S1).
Transcription Factors
Six genes coding for transcription factors could beconsidered as hubs in the regulatory network of devel-oping tomato fruit (Table III). They belong to thehomeobox-Leu zipper (HAT22, spot ID 1.1.2.18), MADSbox (RIN, spot ID 8.2.16.2), NAC (Fig. 8A; spot ID
3.2.13.13 and 8.2.9.17), bZIP (npr1, spot ID 4.1.14.17),and AP2 domain-containing (spot ID 6.2.16.4) familiesof transcription factors. Except HAT22 transcript (spotID 1.1.2.18), all other regulatory hubs coding for tran-scription factors were up-regulated during locular tis-sue and mesocarp development (Fig. 9; SupplementalTable S1).
Regulation of Protein Activity
The controlled regulation of protein activity is im-portant to achieve cell, organ, and plant development.This can involvemodifications in protein folding, in thecleavage of specific addressing peptides, in the cova-lent modification of the protein (e.g. by phosphoryla-tion/dephosphorylation), or in protein degradation.
Figure 8. Regulatory gene and metabolite network implicated in the control of cell expansion in tomato fruit tissues visualizedwith the Pajek software package. A, Complete network. B, Magnification of framed area B. C, Magnification of framed area C.The distance between two vertices is based on 1 – the absolute value of the Pearson correlation coefficient. Metabolite verticesare in red. Hormones and polyamine-related transcripts (BIN 17 and BIN 22) are in green. Redox-related transcripts (BIN 21) arein turquoise. Transcription-related transcripts (BIN 27.3) are in yellow. Transcripts related to the regulation of protein activity (BIN29.3, BIN 29.4, and BIN 29.5) are in violet. Epigenetic-related transcripts (BIN 28.1) are in pink. Signaling-related transcripts(BIN 30) are in brown. Themetabolites are indexedwith the following abbreviations. Car, Carotene; Chloa, chlorophyll a; Chlob,chlorophyll b; Chol, choline; Cit, citrate; Mal, malate; Tol, tomatidenol; Tom, tomatidine; TG2, tomatidine glycoside2; Trig,trigonelline; UDPG, UDP-Glc; UnkS5.4, unknown sugar S5.4; Xant, xanthophylls. Plus and minus signs indicate the sign of thecorrelation coefficient. The values of the correlation coefficients are available in Supplemental Table S3.
Gene-Metabolite Regulations in Tomato Fruit
Plant Physiol. Vol. 149, 2009 1519 www.plantphysiol.orgon August 31, 2018 - Published by Downloaded from
Copyright © 2009 American Society of Plant Biologists. All rights reserved.

Table III. Hub metabolites and genes involved in the regulatory network controlling metabolite levels in tomato fruit tissues
AGI, Arabidopsis Genome Initiative number; TAIR, The Arabidopsis Information Resource.
Spot IDTomato
Unigene
BLASTX TAIR
Best Hit
No. of Correlationsa with
Each Functional Category
K-Meansf/
Group
No.Annotation AGI P
Metabolite
(Met) or
BIN:
Met 17 21 22 27b 28c 29d 30 Total
Total No.e: 42 31 15 4 89 6 137 14 338
Hormone synthesis response (BIN 17)1.2.20.12 SGN-U327450 Auxin-responsive family
proteinAt2g46690 4E-29 0 1 1 1 4 1 10 1 19 5
5.3.3.5 SGN-U320280 IAA27, phytochrome-associated protein 2
At4g29080 3E-70 1 1 0 0 2 1 5 0 10 5
8.4.11.13 SGN-U314505 2-Oxoglutarate-dependentdioxygenase
At1g06620 1E-106 0 4 1 0 3 1 4 0 13 2
6.1.16.20 SGN-U314506 2-Oxoglutarate-dependentdioxygenase
At1g06620 8E-51 0 4 1 0 3 0 5 0 13 2
6.2.3.14 SGN-U316692 ACC synthase 2 At1g01480 0.0 0 1 2 1 2 1 15 1 23 51.2.19.20 SGN-U313853 ERF3 At1g50640 2E-30 0 2 0 0 6 0 5 1 14 41.1.10.9 SGN-U314559 Lipoxygenase 1 (LOX1) At1g55020 0.0 1 0 4 0 5 1 5 0 16 31.2.8.13 SGN-U313563 DWARF1/DIMINUTO At3g19820 0.0 0 3 1 0 5 0 3 0 12 1
Redox (BIN 21)1.3.14.20 SGN-U317819 Protein disulfide isomerase At3g16110 1E-177 0 2 2 0 4 0 10 0 18 41.1.10.5 SGN-U315704 Ascorbate peroxidase 2,
cytosolicAt3g09640 1E-109 2 3 0 0 3 0 5 0 13 4
4.1.8.12 SGN-U312635 Glutathione transferase At1g78380 8E-86 1 3 1 1 4 1 12 1 24 4Polyamines (BIN 22)2.3.3.9 SGN-U319156 Polyamine oxidase 1 At5g13700 1E-136 0 2 1 0 3 1 11 1 19 5
Transcription factors (BIN 27.3)1.1.2.18 SGN-U321056 Homeobox-Leu zipper
protein HAT22At4g37790 1E-81 0 1 1 1 2 0 4 1 10 1
8.2.16.2 SGN-U314473 SEPALLATA1 (SEP1) RIN At5g15800 6E-71 0 5 0 0 3 1 5 0 14 38.2.9.17 SGN-U317381 NAC domain-containing
protein (NAC2)At3g15510 7E-90 0 6 1 0 3 1 4 0 15 2
3.2.13.13 SGN-U313171 NAC domain-containingprotein (NAP)
At1g69490 1E-84 1 3 2 1 2 1 14 1 25 3
4.1.14.17 SGN-U316694 bZIP transcription factor(TAG2)
At5g06950 1E-119 0 5 1 0 2 1 5 0 14 4
6.2.16.4 SGN-U325786 AP2 domain-containingtranscription factor
At5g67190 2E-38 0 3 3 0 1 1 11 0 19 3
DNA methylation (BIN 28.1)2.2.4.1 SGN-U323958 DNA (cytosine-5)-
methyltransferaseAt4g13610 0.0 0 4 1 1 3 0 14 1 24 5
2.3.13.15 SGN-U319104 Histone deacetylasecomplex ubunit Sin3
At1g24190 1E-106 0 2 1 0 5 0 4 0 12 4
Regulation of protein activity (BINs 29.3, 29.4, 29.5)2.4.13.5 SGN-U314101 Molecular chaperone At5g15450 0.0 0 5 1 0 4 0 4 0 14 42.3.3.5 SGN-U313747 Vacuolar processing
enzyme g
At4g32940 0.0 0 2 1 0 2 0 10 1 16 4
3.4.20.16 SGN-U317938 Protein-L-isoaspartateO-methyltransferase
At5g50240 2E-97 1 4 1 0 4 0 4 0 14 4
4.1.18.5 SGN-U315846 CBL-interacting Ser/Thrprotein kinase
At3g17510 1E-169 0 2 2 1 3 1 13 1 23 3
2.2.6.17 SGN-U326261 Leu-rich repeattransmembrane proteinkinase
At3g03770 1E-62 0 2 1 1 3 1 13 1 22 2
4.2.18.5 SGN-U318361 Mitogen-activated proteinkinase 9
At3g18040 0.0 0 2 0 1 2 1 8 2 16 5
7.1.18.4 SGN-U313783 Protein kinase At5g14640 0.0 0 3 0 0 2 1 8 1 15 46.2.8.6 SGN-U324081 Protein kinase At1g16670 3E-94 1 3 3 1 3 2 12 1 26 37.1.19.16 SGN-U337694 Protein kinase At2g17220 1E-50 0 2 2 1 3 1 14 1 24 51.1.18.14 SGN-U316649 Protein kinase At5g24010 8E-85 0 3 0 1 2 1 6 1 14 5
(Table continues on following page.)
Mounet et al.
1520 Plant Physiol. Vol. 149, 2009 www.plantphysiol.orgon August 31, 2018 - Published by Downloaded from
Copyright © 2009 American Society of Plant Biologists. All rights reserved.

Nineteen genes coding for such proteins were consid-ered as hubs in the regulatory network of developingtomato fruit (Table III). All but three were significantlyup-regulatedduring tomato fruit development (spot ID2.2.10.18,HSP20-like chaperone; spot ID 2.3.8.1, proteinkinase; spot ID 6.4.13.2, aspartyl protease protein; Sup-plemental Table S1). These 19 transcripts belongmostlyto groups 4 and 5 (Fig. 9A) that showed low variationduring development of locular tissue and mesocarp.
DISCUSSION
Early fruit development largely contributes to theacquisition of fruit quality traits by allowing the accu-mulation of metabolites, some of them directly linkedto fruit taste, and the modification in tissue character-istics (e.g. cell volume, shape, and adhesion; Fig. 1)that affect visual aspect and major texture attributes ofthe fruit (Rose and Bennett, 1999; Cheniclet et al., 2005;Chaıb et al., 2007; Guillon et al., 2008). To get an insightinto the regulation of the developmental and meta-bolic processes taking place in expanding fruit tissues,we analyzed at cytological, transcriptomic, and meta-bolic levels two major tomato fruit tissues, the meso-carp and the locular tissue, from the end of the celldivision period to the end of the cell expansion periodand combined these data.For each tissue, most metabolites showed changes
during early development (Figs. 2–4). In addition, for a
given developmental stage of the fruit, the distributionof most metabolites in mesocarp and locular tissueappeared clearly distinct (Figs. 2–4), in accordancewiththe different cell size and shape in these tissues (Fig. 1)and with published results (Moco et al., 2007). Organicacids (malate, citrate, and fumarate) as well as GABA,acidic amino acids (Glu and Asp), and some solublesugars (Suc and UDP-Glc) were more abundant inlocular tissue at the end of the cell expansion period. Incontrast, the mesocarp was characterized by higherlevels of hexoses (Fru andGlc), starch, and some aminoacids (Gln, Ile, Leu, Thr, and Val). The distribution ofmajor sugars, organic acids, and amino acids in thedifferent fruit tissues, as well as the relative proportionofmesocarp and locular tissues in the fruit at the end ofthe cell expansion stage, influence the flavor of the ripefruit, although large metabolic changes may still occurduring ripening (Carrari et al., 2006). We took advan-tage of these compositional differences between stagesandbetweenmesocarp and locular tissue andexploitedthis variability to study regulatory networks in ex-panding fruit using correlation analyses.
Metabolite and Regulatory Gene Networks Reveal
Regulatory Hubs Implicated in Fruit TissueDevelopment and Metabolism
We searched for correlations between metaboliteand gene expression profiles that could point to reg-ulatory processes crucial for fruit development and
Table III. (Continued from previous page.)
Spot IDTomato
Unigene
BLASTX TAIR
Best Hit
No. of Correlationsa with
Each Functional Category
K-Meansf/
Group
No.Annotation AGI P
Metabolite
(Met) or
BIN:
Met 17 21 22 27b 28c 29d 30 Total
Total No.e: 42 31 15 4 89 6 137 14 338
1.4.18.1 SGN-U316516 Wall-associated kinase 3 At1g21240 1E-57 1 3 2 1 2 2 12 1 24 33.2.6.6 SGN-U317284 Protein phosphatase 2C
PPH1At4g27800 1E-133 0 2 2 1 2 1 9 2 19 4
6.4.18.3 SGN-U316275 Protein kinase At2g35050 0.0 0 2 2 1 2 1 12 1 21 32.3.8.1 SGN-U321058 ABC1 family protein,
kinaseAt4g31390 1E-154 0 3 3 0 2 1 8 0 17 4
3.1.20.18 SGN-U313737 Ser carboxypeptidase At5g09640 1E-101 1 4 2 1 2 1 14 1 26 45.3.19.8 SGN-U331984 Ser carboxypeptidase At5g42240 9E-82 1 2 1 0 5 0 8 1 18 45.2.6.10 SGN-U316193 20S proteasome a
subunit C1At3g22110 1E-115 0 2 1 0 1 2 10 1 17 3
6.4.13.2 SGN-U316057 Aspartyl protease protein At1g11910 0.0 0 2 0 0 7 0 6 1 16 32.2.10.18 SGN-U316933 HSP20-like chaperone At2g37570 0.0 1 4 1 0 7 0 4 0 17 4
Signaling (BIN 30)7.2.18.4 SGN-U317690 Inositol-1,4,5-trisP
5-phosphataseAt1g47510 1E-108 0 2 1 1 2 1 15 0 22 2
MetaboliteCholine 2 1 2 0 2 0 3 0 10 3
aMetabolite and regulatory gene correlations were calculated using Pearson correlation coefficients (P , 0.001). Genes were classified in BINsaccording to MapMan classification (Thimm et al., 2004). bTranscription factors (BIN 27.3). cDNA methylation (BIN 28.1). dRegulation ofprotein activity (BINs 29.3, 29.4, 29.5). eNumber of metabolites or genes significantly detected in each gene BIN. fHub metabolites andgenes were classified in five groups by K-means analysis according to Figure 9.
Gene-Metabolite Regulations in Tomato Fruit
Plant Physiol. Vol. 149, 2009 1521 www.plantphysiol.orgon August 31, 2018 - Published by Downloaded from
Copyright © 2009 American Society of Plant Biologists. All rights reserved.

quality. In the expanding tissues from tomato fruit, 37direct correlations between the level of a metaboliteand a regulatory gene transcript were highlighted (Fig.7). Main correlations were observed with genes codingfor proteins related to regulatory processes (Fig. 7), abroad category including (1) proteins involved inhormone biosynthesis and signaling, (2) proteins in-volved in redox regulation, (3) transcription factors ofseveral families, (4) proteins involved in posttransla-tional modification of protein by folding or proteoly-sis, and (5) the huge group of protein kinases that havediverse functional roles (Wang et al., 2003; Krupa et al.,2006; Morillo and Tax, 2006). Most of these correlationscan be placed within a general regulatory network(Fig. 8; Table III; Supplemental Table S2) connectingmetabolites and regulatory genes. In this work, 40genes and one metabolite represented network hubsthat were correlated with more than 10 other regula-tory transcripts or metabolites, such as the ACC syn-thase 2, two NAC transcription factors, and a range ofprotein kinases (Table III), suggesting a central role for
these genes in the regulation of early fruit develop-ment and metabolism.
This kind of gene-metabolite response network hasalready been described in Arabidopsis (Arabidopsisthaliana), where it allowed the deciphering of informa-tional fluxes of sulfur stress (Nikiforova et al., 2005) andnitrogen responses (Gutierrez et al., 2008) and theidentification of transcription factors regulating gluco-sinolate biosynthesis (Hirai et al., 2007). The detectionof a correlation between a metabolite and a gene doesnot absolutely prove a regulatory relationship betweenthese elements. In this work, precautions were taken toselect correlationsdisplaying stringent coefficients (P,0.001). However, it cannot be totally excluded thatcorrelations observed for certain metabolites display-ing large variations during fruit development in onetissue (e.g. citrate, choline, and tomatine-related me-tabolites; Figs. 4 and 7) are in fact primarily linked to thesimilarity of patterns of changes in the differentiatingfruit cells rather than to gene-metabolite functionalrelationships. The correlation highlighted here may
Figure 9. Expression profiles of the regulatory hubs highlighted in Figure 8. A, Classification of the 41 regulatory hubs in fiveexpression groups. The x axis represents locular tissue (LT) at 12, 20, and 35 DPA and mesocarp tissue (M) at 12, 20, and 35 DPA.The y axis represents log2(xmeanvalue/M12meanvalue),where themeanvalue is themeanmetabolite concentrationor themeannormalized transcript expression. The expression curve is plotted in gray for each individual hub. Mean 6 SD of the expressiongroup is plotted in black. The regulatory hubs (40 transcripts and choline)were grouped into five clusters byK-means analysis usingMultiExperiment Viewer version 4.0. B, Validation of microarray data by real-time RT-PCR experiments for some regulatory hubs.The x axis represents locular tissue (LT) at 12, 20, and 35DPA andmesocarp tissue (M) at 12, 20, and 35DPA. The y axis representslog2(x Q value/M12 Q value), where the Q value is the normalized expression of the corresponding gene normalized with theexpression of actin and b-tubulin. The expression profile obtained by microarray is plotted in black, and the expression profileobtained by real-time RT-PCR is plotted in gray. The Q values of each sample are presented in Supplemental Figure S1.
Mounet et al.
1522 Plant Physiol. Vol. 149, 2009 www.plantphysiol.orgon August 31, 2018 - Published by Downloaded from
Copyright © 2009 American Society of Plant Biologists. All rights reserved.
suggest regulatory relationships that still need furthervalidation by direct experimental evidence throughreverse genetics and/or biochemical analysis (Aokiet al., 2007; Saito et al., 2007).The biological significance of metabolite-transcript
correlations is usually considered to reflect direct orcomplex functional associations between these ele-ments. In simple cases (direct associations), such cor-relationsmay eithermean that themetabolite synthesisis controlled by the transcript product level or that thegene transcription/stability is undermetabolite control(Carrari et al., 2006). So far, in plants, besides sugarsensing (Rolland et al., 2006), there is scarce evidence ofsuchmetabolite control. In complex cases, themetabolite-transcript correlation may also result from coregula-tion of the elements under study by a third element(Szymanski et al., 2007). These individual correlationsare embedded in a global network that constitutes afunctional dynamic system. The correlation networkhighlighted in this work, however, does not implycausal directionality. Indeed, in the context of early fruitdevelopment, it was difficult to identify the initial“exciter” and the “effect” (Szymanski et al., 2007) ofthe network response as described, respectively, forhyposulfur stress response (exciter = the sulfur mole-cule itself; Nikiforova et al., 2005) or the last metaboliteto accumulate in the ripening tomato fruit (effect =isoprenoid accumulation; Carrari et al., 2006). Al-though our biological system is close to the ripeningtomato model, it is focused on an intermediary devel-opmental phase, between fruit set and fruit ripening,with transitory metabolite accumulation impeding theclear definition of exciters and/or effects. Therefore, forsome examples of correlations highlighted in thiswork,particularly important in the fruit quality context, thecausal directionality was inferred from the literatureand is discussed below.
Direct Gene-Amino Acid Correlations Suggest SeveralRegulatory Modes
Among the 37 gene-metabolite direct correlationshighlighted in this work, the correlations involvingamino acids are particularly interesting because of theagronomical interest in improving amino acid levels intomato fruit. Indeed, amino acids are a group of pri-mary metabolites with increasingly recognized impor-tance in relation to fruit quality. Besides the nutritionalvalue of the essential amino acids (e.g. Ala, Gln, orAsp), GABA is of particular interest, since it maycontribute to lowering blood pressure (Inoue et al.,2003). Moreover, several amino acids (Glu and Asp)will confer theumami or savory taste to the fruit (Oruna-Concha et al., 2007) or possibly contribute to its sweet-ness (e.g. Gly and Ala; Hounsome et al., 2008). Freearomatic amino acids also constitute major precursorsof flavor volatiles synthesized during the ripeningprocess (Goff and Klee, 2006). Despite this importantrole with regard to fruit quality, amino acids remainedpoorly studied in fruit.
In this work, eight gene-metabolite direct correla-tions implicated an amino acid (Fig. 7). The regulatorygenes highlighted by these correlations were a ferre-doxin thioredoxin reductase (Fig. 7B), four proteinkinases or phosphatases (Fig. 7D), and three transcrip-tion factors (MYB, bZIP, and zinc finger; Fig. 7C). Forthe correlation involving ferredoxin thioredoxin re-ductase and Val, the regulatory relationships might beachieved through regulation of a protein activity in-volved in the synthesis of Val. Indeed, this correlationis consistent with the regulation of dihydroxy aciddehydratase, involved in Val metabolism, by the thi-oredoxin system as shown in wheat (Triticum aestivum;Balmer et al., 2006). To our knowledge, no correlationsinvolving phosphatases/kinases and amino acidshave been reported so far. However, large-scale phos-phorylationmapping in Arabidopsis recently suggestedthe regulation by phosphorylation of one Glu decar-boxylase (locus, At2g02010), a protein involved in Alaand Asp metabolism (de la Fuente van Bentem et al.,2008).
Transcription factors belonging to different families(Hirai et al., 2007; Falkenberg et al., 2008; Gutierrezet al., 2008; Hanson et al., 2008; Luo et al., 2008) werealready shown to regulate different plant metabolitecontent. In our study, one of themost striking examplesof a correlation between a metabolite and a transcrip-tion factor concerns Gln, which is directly correlated toboth aMYBandabZIP transcription factor (Fig. 7C) in asmall regulatory network (Fig. 8B). According to theliterature, these transcription factors are implicated intranscriptional regulation of genes involved in aminoacid metabolism. Indeed, a bZIP transcription factorwas shown to affect the amino acid metabolismthrough regulation of the expression of Asn synthe-tase1 and Pro dehydrogenase2 inArabidopsis (Hansonet al., 2008). In addition, a MYB protein was shown toregulate a Gln synthetase gene in pine (Pinus species;Gomez-Maldonado et al., 2004). However, it has alsobeen shown in plants that several metabolites, such assugars and amino acids, act as signalingmolecules andregulate gene expression (Lancien and Roberts, 2006;Rolland et al., 2006; Gutierrez et al., 2008). The com-plexity of the corresponding systems is particularlyobvious in C:N sensing/signaling, where the bZIP andMYB transcription factors regulating the expression ofgenes involved in amino acidmetabolism (Coruzzi andZhou, 2001) are in turn regulated by Glu or a Glu-derived metabolite (Gutierrez et al., 2008).
Developmental Regulations in Expanding Fruit Tissues
In this work, we focused our attention on earlydeveloping tomato fruit between 12 and 35DPA,whichcorresponds inAilsa Craig tomato to the cell expansionphase of the fruit. The 35-DPA mesocarp and locularfruit tissues characterized here were collected fromgreen fruit harvested before themature green stage (i.e.before the onset of ripening; Mounet et al., 2007).Although these tissues were not yet engaged in the
Gene-Metabolite Regulations in Tomato Fruit
Plant Physiol. Vol. 149, 2009 1523 www.plantphysiol.orgon August 31, 2018 - Published by Downloaded from
Copyright © 2009 American Society of Plant Biologists. All rights reserved.

ripening process, they displayed major metabolic andtranscriptomic changes, especially between 20 and 35DPA (Figs. 3, 4, 6B, and 9), therefore reflecting both therapid growth period (12–20 DPA) and the transition toripening.
Among the 40 genes highlighted as hubs of themetabolite-regulatory gene network (Fig. 8; Table III),only twodisplayed adecrease in expressionbetween 12and 35 DPA (Fig. 9; group 1): Dwarf1/Diminuto (spotID 1.2.8.13) and the homeobox-Leu zipper proteinHAT22 (spot ID 1.1.2.18). According to their expressionprofiles and to the literature, these two genes areinteresting candidates for key regulations in tomatofruit early development. Indeed, Dwarf1/Diminuto isa protein involved in the brassinosteroid biosyntheticpathway (Klahre et al., 1998). These hormones wereshown to play a fundamental role in cell elongation(Mockaitis and Estelle, 2004) and were proposed topartially regulate early fruit development (Montoyaet al., 2005). The homeobox-Leu zipper protein HAT22has been highlighted in Arabidopsis by systems anal-ysis of light/carbon sensing and/or signaling path-ways as a regulatory hub connecting a metabolicnetwork of genes involved in amino acid metabolism,C-compound/carbohydrate metabolism, and glycoly-sis/gluconeogenesis (Thum et al., 2008). In tomato fruittissues, HAT22 transcription factor might thus be im-plicated in the complex regulation of themetabolic shiftoccurring between fruit early development and rip-ening.
All other regulatory hubs corresponded to genes up-regulated between 12 and 35 DPA, some of them beingrelated to auxin signaling (spot ID 1.2.20.12 and 5.3.3.5),in agreement with earlier findings suggesting the im-plication of this hormone in early fruit development(Gillaspy et al., 1993; Balbi and Lomax, 2003; Lemaire-Chamley et al., 2005). Surprisingly, other hub geneswererelated to ethylene synthesis/signaling (Giovannoni,2001), such as ACC synthase 2 (spot ID 6.2.3.14) andRIN transcription factor (spot ID 8.2.16.2). Since thebiological material used in this work corresponded togreen growing fruit (Mounet et al., 2007), the up-regulation of these genes as soon as 20 DPA (Fig. 9)could correspond to early preparation of the ripeningphase. Alternatively, the early up-regulation of thesegenes could reflect the implication of ethylene in theregulation of cell expansion processes linked to fruitgrowth, in the same way as it is implicated in cotton(Gossypium hirsutum) fiber cell elongation (Shi et al.,2006) and in Arabidopsis hypocotyl elongation in thelight (Pierik et al., 2006).
In addition to these hormonal regulatory aspects ofearly fruit development, a large number of genes codingfor proteins involved in the regulation of protein activityand “hormone-independent” transcription factors weredefined as hubs of the gene-metabolite regulatory net-work (Table III). One of the most remarkable results ofthis study is the high number of proteins related toprotein phosphorylation (10 protein kinases and oneprotein phosphatase) that were pointed out (Table III).
Since these belong to huge protein families with a widerange of functions (Kerk et al., 2002; Wang et al., 2003;Krupa et al., 2006; Morillo and Tax, 2006), they mightcontrol many aspects of expanding fruit growth andmetabolism, ranging from signaling (e.g. receptor-likekinases; Morillo and Tax, 2006) to cell wall modifica-tions (e.g. WAK kinase; Verica and He, 2002). Becauseof their function as transcriptional activators or repres-sors of target genes, the transcription factors identifiedcan be key regulators of various processes, from theregulation of metabolic activity (e.g. HAT22; Thumet al., 2008) to the hormonal control of fruit develop-ment (Chen et al., 2008) and the developmental controlof ripening (e.g. RIN; Giovannoni, 2007). Coexpressedprotein kinases, phosphatases, transcription factors,and proteins involved in protein modification may beimplicated in common regulatory networks connectingdifferent signaling pathways for the regulation ofvarious aspects of early fruit development and com-positional changes (Schutze et al., 2008). Therefore,these hub genes appear as likely candidates for theregulation of fruit development/metabolism, togetherwith genes related to hormonal regulation and signaltransduction in early-developing fruits.
CONCLUSION
This study explored the tightly regulated and inter-connected processes taking place during the cell ex-pansion stage in tomato fruit tissues by focusing on thetranscriptional and metabolic changes occurring in theexpanding mesocarp and locular tissue at three stagesof fruit development. Correlation and network analy-ses highlighted regulatory genes closely associatedwith single metabolites or with much larger networksof genes and metabolites, thereby suggesting that astrategy based on the combined analysis of differentdeveloping fruit tissues can be very helpful to pinpointcandidate regulatory genes linked to compositionalchanges and fruit development in tomato. This ap-proach was shown to be valuable for narrowing theexpressional candidate genes to specific subsets ofgenes that can be further used for genetic/biotechno-logical applications aimed at increasing the sensorialand nutritional values of tomatoes.
MATERIALS AND METHODS
Plant Material
Fifteen tomato (Solanum lycopersicum ‘Ailsa Craig’) plants were grown in a
growth chamber with a 15-h-day (25�C)/9-h-night (20�C) cycle, an irradiance
of 400 mmol m–2 s–1, and 75% to 80% humidity. Individual flowers were tagged
on the day of anthesis (flower opening). The fruit number per truss was
limited to six, and fruits were further selected according to size, color, and
position on the truss (elimination of the first and last fruit of the truss). For
cytology, fruits were collected at anthesis (0 DPA), during the division phase
(2, 4, 6, and 8 DPA), at the transition between division and expansion phases
(12 DPA), during the expansion phase (20 and 27 DPA), and at mature green,
orange, and red ripe stages (35, 40, and 45 DPA, respectively). For metabolic
1524 Plant Physiol. Vol. 149, 2009
Mounet et al.
www.plantphysiol.orgon August 31, 2018 - Published by Downloaded from Copyright © 2009 American Society of Plant Biologists. All rights reserved.

studies, three pools (biological replicates) of six (20 and 35 DPA) or 12 (12
DPA) fruits were harvested during the expansion phase. Fruit without seeds
and separated tissue samples were collected as follows. One-quarter of each
fruit was taken, and seeds were rapidly removed from the locular tissue that
was added to the rest of the fruit to constitute the “fruit without seed” sample.
The rest of each fruit (three-quarters) was separated into exocarp, mesocarp,
columella + placenta, locular tissue, and seeds. Each tissue sample issued
from one fruit pool was rapidly frozen, ground in liquid nitrogen, and stored
at280�C until use. For transcriptomic profiling, two of these three pools were
used (compare with “Microarray Analysis” below). For real-time RT-PCR, one
pool of mesocarp and locular tissue was collected at 12, 20, and 35 DPA in an
independent culture, prepared, and stored in the same way as described
above. Fresh and dry matter contents of each sample were measured as
described by Mounet et al. (2007).
Cytological Study
Three ovaries or fruit were collected at each stage, cut (half ovaries or
approximately 0.3- to 0.6-mm-thick fruit pieces), and rapidly fixed for 2 h in
ethanol-acetic acid (3:1, v/v) at room temperature. The samples were rinsed
three times in 70% ethanol, dehydrated by an ethanol series, and embedded in
Technovit 7100 (Kulzer). Sections (3 mm) obtained with glass knives were
stained with 0.04% (w/v) toluidine blue and photographed using a Zeiss
Axiophot microscope coupled to a Spot digital camera (Diagnostic Instru-
ments). Cell length and area were measured using the ImageProPlus software
(Media Cybernetics) at three different positions for each ovary or fruit.
Metabolome Analysis
Metabolome analysis was carried out using a combination of analytical
techniques: 1H-NMR for major polar metabolites (including soluble sugars,
organic and amino acids, and quaternary amines), enzymatic analysis for
starch, LC-DAD for isoprenoids, and LC-MS for other secondary metabolites.
For NMR analysis, polar metabolites were extracted with a series of hot
ethanol/water and quantified by 1H-NMR at 500.162 MHz on a Bruker
Avance spectrometer using a 5-mm inverse probe as described previously
(Mounet et al., 2007). For the extract preparation and NMR acquisition
parameters, special care was taken to allow absolute quantification of indi-
vidual metabolites through the addition of EDTA sodium salt solution to
improve the resolution and quantification of organic acids such as malate and
citrate, adequate choice of the NMR acquisition parameters, and use of an
electronic reference for quantification. Four unknown compounds, named
using the mid value of the chemical shift and the multiplicity of the
corresponding resonance group (e.g. unknown sugar S5.4 for a singlet at
5.40 ppm), were quantified in arbitrary units. Two technological replicates
were extracted and analyzed for each biological replicate.
Starch remaining in the pellet after the extraction of polar compounds was
converted into Glc using amyloglucosidase and analyzed enzymatically as
described by Mounet et al. (2007). Isoprenoids were extracted with methanol/
Tris buffer/chloroform and analyzed by LC-DAD as described by Mounet
et al. (2007). “Carotene” corresponds to b-carotene and “xanthophylls” refers
to the sum of zeaxanthin and violaxanthin.
For LC-MS analysis, samples (50 mg dry weight each) were extracted with
1 mL of methanol-water (7:3, v/v) containing 137 mM methylvanillate as an
internal standard during 30 min in an ultrasonic bath cooled with ice. After
centrifugation and filtration on 0.2-mm filters, 5 mL of extract was injected in
triplicate. Data were obtained using the following LC-MS system: JASCO-1585
ternary system, equipped with a JASCO-1559 cooled autoinjector, a JASCO-
1575 programmable UV light detector, and a JASCO-1560 column heater/
cooler connected to a Micromass Quattro II (Micromass) mass spectrometer
operated with an electrospray source in the positive ionization mode. Typical
tuning parameters were as follows: capillary voltage, 3.5 kV; cone voltage, 20
V; source block temperature, 120�C; desolvation temperature, 350�C. Themass
range scanned was 50 to 1,500 D at a 2 s scan21 rate. Data were preprocessed
using XCMS (Smith et al., 2006). Areas were normalized by internal standard
area and by weight. Mass-supported metabolite characterization was based
on pseudomolecular ions, collision-induced dissociation fragments, and
accurate masses. Accurate masses were obtained by LC-MS with an electro-
spray ionization-time of flight system (Bruker). Mass calibration was done for
each LC run with sodium formiate clusters. Compound names were given
according to the literature (Moco et al., 2006). The 36 1H-NMR spectra
converted into JCAMP-DX format and the 54 LC-MS chromatograms into Net
CDF format have been deposited, with associated metadata, into the Metab-
olomics Repository Bordeaux (http://www.cbib.u-bordeaux2.fr/MERYB/
public/PublicREF.php?REF=T06003).
Microarray Analysis
Microarray Experimental Design
The microarray experimental design consisted of two biological replicates,
and for one biological replicate the dyes were reversed (dye swap), for a total
of three slides per direct comparison (Fig. 6).
Hybridization and Data Acquisition
The TOM1 cDNA microarrays (Center for Gene Expression at the Boyce
Thompson Institute, Cornell University; http://bti.cornell.edu/CGEP/CGEP.
html) contain 13,400 printed elements corresponding to approximately 8,700
unigenes (Alba et al., 2004).
Onemicrogram of DNA-free total RNA (Lemaire-Chamley et al., 2005) was
used in one cycle of linear amplification with the MessageAmp aRNA Kit
(Ambion/Applied Biosystems), according to the manufacturer’s instructions.
The amplified RNA quality was checked using Agilent Microchips (Agilent
Bionalyzer 2100). One microgram of amplified RNA was labeled using the
CyScibe Post-Labeling Kit (catalog no. RPN5660X; GE Healthcare) according
to the manufacturer’s recommendations, and the Cy-labeled cDNAs were
quantified by spectrophotometry. The Cy3- and Cy5-labeled cDNAs were
pooled, concentrated to 5 mL on Microcon YM-30 columns (catalog no. 42410;
Amicon Bioseparations), and mixed with 95 mL of hybridization solution
containing 1:1 (v/v) formamide/53 SSC, 0.25% SDS, 53 Denhardt’s solution,
and 0.2 mg mL21 denatured salmon sperm DNA. Slides were hybridized in an
HS 4800 automatic hybridization station (Tecan Trading). After a washing
prerun in 13 SSC and 0.1% SDS at 42�C for 1 min, the probe solution was
boiled for 1 min and injected into the hybridization chamber. Slides were
incubated at 42�C for 16 h, under medium agitation, and washed sequentially
three times at 30�C in 13 SSC and 0.1% SDS for 1 min; three times at 30�C in
0.13 SSC and 0.1% SDS for 1 min; and at 30�C in 0.13 SSC for 30 s. Slides were
dried in the hybridization station for 3 min with 2.7 bars of nitrogen gas.
Microarray slides were scanned with a Genepix 4000 B fluorescence reader
(Axon Instruments) using the Genepix 4.0 Pro image acquisition software. The
photomultiplier tube voltage was adjusted to 530 V for Cy3 and to 650 V for
Cy5. Spot flagging was done by Genepix (missing spots) and by visual
inspection of the images in order to exclude saturated and heterogeneous spots.
Statistical Analysis and Transcriptome DataNormalization
Raw data (intensity median with no background subtraction) were sub-
mitted to R/MAANOVA version 1.2.1 (Cui et al., 2003) software (R package
for the analysis of microarray) for data visualization, regional Lowess nor-
malization, and statistical analysis, including multiple test adjustments (FDR)
as described by Lemaire-Chamley et al. (2005). We used F statistics computed
on the James-Stein shrinkage estimates of the error variance (Wu et al., 2003)
and selected genes with P , 0.01 and FDR , 0.05 as significantly expressed.
Low-quality data were further eliminated through two additional steps. (1)
For each sample, spots with an intensity higher than background mean + 2
background SD, for more than 55% of the slides, were considered as detected.
Spots that were not detected in all samples were excluded from further
analysis. (2) For each sample, spots flagged on more than 44% of the slides
were excluded from further analysis. Finally, spots corresponding to 1,139
different SGN-Unigenes (Tomato 200607; July 27, 2006) were considered
significantly expressed in this experiment.
In order to normalize the transcriptomic data in the same way as the
metabolomic data, regional Lowess normalized data were extracted fromMA-
ANOVA and further normalized in two steps. The first step corresponded to a
between-slide normalization: for each slide and fluorochrome, the value of a
given spot was divided by the mean of the 13,440 spots of the slide/
fluorochrome. The second step corresponded to the calculation of the mean
expression value of one spot for a given tissue: the mean of between-slide
normalized values obtained for a given spot on the different slides hybridized
with this tissue was calculated from three values (M12, M35, L12, and L35) or
nine values (M20 and L20).
Plant Physiol. Vol. 149, 2009 1525
Gene-Metabolite Regulations in Tomato Fruit
www.plantphysiol.orgon August 31, 2018 - Published by Downloaded from Copyright © 2009 American Society of Plant Biologists. All rights reserved.

Real-Time RT-PCR Analyses
Expression profiles were measured on mesocarp and locular tissue of
tomato (Ailsa Craig) fruit collected at 12, 20, and 35 DPA. Total RNA was
isolated using Tri-Reagent (Sigma) according to the manufacturer’s instruc-
tions. RNA was eluted in 50 mL of diethyl pyrocarbonate-treated water, and
DNA was eliminated by a DNase I treatment using the Turbo DNA-free kit
(Ambion/Applied Biosystems). One microgram of DNase-treated total RNA
was reverse transcribed as described previously (Lemaire-Chamley et al.,
2005). The RT product was diluted 10-fold in water, and aliquots of 2 mL were
used in real-time PCR (25 mL final volume) in the presence of 0.2 mM clone-
specific primers using the iQ SYBR Green Supermix (Bio-Rad) according to the
manufacturer’s instructions. Real-time PCR was performed on an iCycler iQ
(Bio-Rad). Data acquisition and analysis were done using the iCycler iQ
software (version 3.0a; Bio-Rad). b-Tubulin (DQ205342; bTubQPCR_S1,
5#-AACCTCTCGTGGATCACAGC-3#; bTubQPCR_AS1, 5#-GGCAGAAGCT-
GTCAGGTAACG-3#) and actin 2/7 (ActinQPCR_S2, 5#-GGACTCTGGT-
GATGGTGTTAG-3#; ActinQPCR_AS2, 5#-CCGTTCAGCAGTAGTGGTG-3#;based on SGN-U213132; de Jong et al., 2009) were used as housekeeping genes
to calculate transcript relative expression using the Genex (Gene Expression
Analysis for iCycler iQ real-time PCR detection system) Excel applet from Bio-
Rad. The following primers, specific for the candidate genes, were used:
1.1.10.5_S (5#-TGGTTCTTCCAATTTTTCATTTG-3#), 1.1.10.5_AS (5#-CAAA-
CATAAAGACACAAAAGTTGC-3#), 4.1.14.17_S (5#-TGACATGCATTGCGA-
TATTC-3#), 4.1.14.17_AS (5#-TTCTGCACTTCCACAAGCAC-3#), 2.2.10.18_S(5#-GGTGTTGTTGGTAGGTTTTGC-3#), 2.2.10.18_AS (5#-GACAGACCGAAA-
CTAGCATTGA-3#), 4.1.18.5_S (5#-TCGCCTTATAAGTTAGTACATTCAAG-3#),4.1.18.5_AS (5#-CCAAAGAAAATATTTGCCTAGAGAC-3#), 1.1.18.14_S
(5#-GCACAAAGTCAGTTGTCTTGTACT-3#), 1.1.18.14_AS (5#-TCAAAAAT-
CAATTCAGTTAGAGAAGC-3#), 1.4.18.1_S (5#-TCCGCGGTGATCTAAAG-
AAG-3#), 1.4.18.1_AS (5#-TTCTGTCAACCAAAATCCAAAG-3#), 1.2.8.13_S
(5#-GCAGGAAGCTGAGCAAGAGA-3#), 1.2.8.13_AS (5#-GGGGAAAATTC-
ATACTAGAAACCAA-3#), 1.1.2.18_S (5#-TTTTTGGTTAAAAGGCTTGTA-
TGA-3#), and 1.1.2.18_AS (5#-TGGACCATAATAAAGAAACAAATTAAA-3#).
Data Analysis
For growth parameters, cytology data, and individual metabolites, mean6SD were calculated from n replicates. For all biochemical analyses, two
extractions (technological replicates) were prepared per biological replicate,
then the mean of three biological replicates was calculated. Mean comparison
between tissues for each stage of development was done using a Student’s t
test with SAS software version 8.01 (SAS Institute, 1990).
To explore the metabolite multidimensional data set, we used two unsu-
pervised analytical methods: PCA (Lindon et al., 2001) and the SOM algorithm
(Kohonen, 2001), which is an application of Artificial Neural Networks. PCA
was performed, on mean-centered data scaled to unit variance, using SAS
software version 8.01 (SAS Institute, 1990). To apply the SOM algorithm, the
Matlab software, version 1.6.1, was used as described by Mounet et al. (2007).
A SOM package for Matlab is available at http://www.cis.hut.fi/projects/
somtoolbox/. All of the calculations were performed using a computer
equipped with an Intel Pentium III-2GHz processor. The parameters were
chosen according to Kohonen (2001) as follows: flat rectangular maps were
selected; the neighborhood kernel was written in terms of a Gaussian function;
the number of iterations was 500 times the number of the map units, with
2,000 iterations for the ordering phase of the learning. Maps of different size
were constructed to modulate their resolution strength. Then, each map was
read considering the relative positions of the samples and their comparison.
Moreover, the chemical composition of each virtual tomato sample was used
to display the distribution of each metabolite on the organized map on which
real samples were plotted. This two-dimensional representation can be
considered as a “component-sliced” version of the SOM. A gray shade
gradient was used to represent metabolite levels. Pearson correlation coeffi-
cients between metabolites were calculated. Significance levels for correlation
coefficients (r) were determined following the number of metabolite pairs (n)
using the equation t = r 3 (n 2 2)0.5/(1 2r2)0.5. For correlations with a
significance of P, 0.05, correlation matrices were visualized using heat maps
generated with MultiExperiment Viewer software version 4.0 (Saeed et al.,
2003). For metabolome and transcriptome data integration, Pearson correla-
tion coefficients were calculated for the two tissues and three developmental
stages together (M12, M20, M35, L12, L20, and L35). The coefficients were
calculated from the mean of all biological replicates for metabolome data and
the mean expression value of selected transcripts as calculated above using
MatLab software version 7.4.0 (MathWorks). Correlations corresponding to a
coefficient with P , 0.001 were examined using scatterplots. In addition,
metabolome and transcriptome relationships (P , 0.001) were visualized
using Networks cartography and Pajek software version 1.22 (Batagelj and
Mrvar, 2003; http://vlado.fmf.uni-lj.si/pub/networks/pajek/). The distance
used to rebuild the network was 1 – the absolute value of the correlation
coefficient with the Fruchtermann-Reingold three-dimensional algorithm.
Supplemental Data
The following materials are available in the online version of this article.
Supplemental Figure S1. Real-time RT-PCR results.
Supplemental Table S1. List of the 1,139 genes differentially expressed in
the microarray expression analysis.
Supplemental Table S2. List of the 22 hub genes involved in the regulatory
network with their correlated metabolites/regulatory genes.
Supplemental Table S3. Correlation matrix of metabolite and gene ex-
pression levels.
ACKNOWLEDGMENTS
We thank Dr. Christian Chevalier for valuable comments, Dr. Michael
Hodges and Julia Bradley-Giraud for English editing of the manuscript,
Patricia Ballias and Aurelie Honore for taking care of the plants, Catherine
Cheniclet and the Plateau Technique Imagerie Cytologie of Functional
Genomic Platform Bordeaux for access to the cytology facilities and for
advice, and the Plateforme Transcriptome of Functional Genomic Platform
Bordeaux for access to the transcriptomic facilities.
Received December 10, 2008; accepted January 10, 2009; published January 14,
2009.
LITERATURE CITED
Alba R, Fei Z, Payton P, Liu Y, Moore SL, Debbie P, Cohn J, D’Ascenzo M,
Gordon JS, Rose JK, et al (2004) ESTs, cDNA microarrays, and gene
expression profiling: tools for dissecting plant physiology and devel-
opment. Plant J 39: 697–714
Alba R, Payton P, Fei ZJ, McQuinn R, Debbie P, Martin GB, Tanksley SD,
Giovannoni JJ (2005) Transcriptome and selected metabolite analyses
reveal multiple points of ethylene control during tomato fruit develop-
ment. Plant Cell 17: 2954–2965
Amemiya T, Kanayama Y, Yamaki S, Yamada K, Shiratake K (2006) Fruit-
specific V-ATPase suppression in antisense-transgenic tomato reduces
fruit growth and seed formation. Planta 223: 1272–1280
Aoki K, Ogata Y, Shibata D (2007) Approaches for extracting practical
information from gene co-expression networks in plant biology. Plant
Cell Physiol 48: 381–390
Balbi V, Lomax TL (2003) Regulation of early tomato fruit development by
the Diageotropica gene. Plant Physiol 131: 186–197
Balmer Y, Vensel WH, Cai N, Manieri W, Schurmann P, Hurkman WJ,
Buchanan BB (2006) A complete ferredoxin/thioredoxin system regu-
lates fundamental processes in amyloplasts. Proc Natl Acad Sci USA
103: 2988–2993
Barry CS, Giovannoni JJ (2006) Ripening in the tomato green-ripe mutant
is inhibited by ectopic expression of a protein that disrupts ethylene
signaling. Proc Natl Acad Sci USA 103: 7923–7928
Batagelj V, Mrvar A (2003) Pajek: analysis and visualization of large
networks. In M Junger, P Mutzel, eds, Graph Drawing Software.
Springer (Mathematics and Visualization series), Berlin, pp 77–103
Carrari F, Asis R, Fernie AR (2007) The metabolic shifts underlying tomato
fruit development. Plant Biotechnol 24: 45–55
Carrari F, Baxter CJ, Usadel B, Urbanczyk-Wochniak E, Zanor MI, Nunes-
Nesi A, Nikiforova V, Centero D, Ratzka A, Pauly M, et al (2006)
Integrated analysis of metabolites and transcript levels reveals the
metabolic shifts that underlie tomato fruit development and highlight
regulatory aspects of metabolic network behavior. Plant Physiol 142:
1380–1396
1526 Plant Physiol. Vol. 149, 2009
Mounet et al.
www.plantphysiol.orgon August 31, 2018 - Published by Downloaded from Copyright © 2009 American Society of Plant Biologists. All rights reserved.

Carrari F, Fernie AR (2006) Metabolic regulation underlying tomato fruit
development. J Exp Bot 57: 1883–1897
Carrari F, Fernie AR, Iusem ND (2004) Heard it through the grapevine?
ABA and sugar cross-talk: the ASR story. Trends Plant Sci 9: 57–59
Catala C, Rose JKC, Bennett AB (2000) Auxin-regulated genes encoding
cell wall modifying proteins are expressed during early tomato fruit
growth. Plant Physiol 122: 527–534
Chaıb J, Devaux MF, Grotte MG, Robini K, Causse M, Lahaye M, Marty I
(2007) Physiological relationships among physical, sensory, and mor-
phological attributes of texture in tomato fruits. J Exp Bot 58: 1915–1925
Chen G, Hu Z, Grierson D (2008) Differential regulation of tomato
ethylene responsive factor LeERF3b, a putative repressor, and the
activator Pti4 in ripening mutants and in response to environmental
stresses. J Plant Physiol 165: 662–670
Cheniclet C, Rong WY, Causse M, Frangne N, Bolling L, Carde JP,
Renaudin JP (2005) Cell expansion and endoreduplication show a large
genetic variability in pericarp and contribute strongly to tomato fruit
growth. Plant Physiol 139: 1984–1994
Coombe BG (1976) The development of fleshy fruits. Annu Rev Plant
Physiol 27: 207–228
Coruzzi GM, Zhou L (2001) Carbon and nitrogen sensing and signaling in
plants: emerging ‘matrix effects’. Curr Opin Plant Biol 4: 247–253
Cui X, Kerr MK, Churchill BA (2003) Transformations for cDNA micro-
array data. Stat Appl Genet Mol Biol 2: 1–19
Davuluri GR, van Tuinen A, Fraser PD, Manfredonia A, Newman R,
Burgess D, Brummell DA, King SR, Palys J, Uhlig J, et al (2005) Fruit-
specific RNAi-mediated suppression of DET1 enhances carotenoid and
flavonoid content in tomatoes. Nat Biotechnol 23: 890–895
de Jong M, Wolters-Arts M, Feron R, Mariani C, Vriezen WH (2009) The
Solanum lycopersicum auxin response factor 7 (SlARF7) regulates auxin
signaling during tomato fruit set and development. Plant J 57: 160–170
de la Fuente van Bentem S, Mentzen WI, de la Fuente A, Hirt H (2008)
Towards functional phosphoproteomics by mapping differential phos-
phorylation events in signaling networks. Proteomics 8: 4453–4465
Falkenberg B, Witt I, Zanor MI, Steinhauser D, Mueller-Roeber B, Hesse
H, Hoefgen R (2008) Transcription factors relevant to auxin signalling
coordinate broad-spectrum metabolic shifts including sulphur metab-
olism. J Exp Bot 59: 2831–2846
Galpaz N, Wang Q, Menda N, Zamir D, Hirschberg J (2008) Abscisic acid
deficiency in the tomato mutant high-pigment 3 leading to increased
plastid number and higher fruit lycopene content. Plant J 53: 717–730
Gifford ML, Dean A, Gutierrez RA, Coruzzi GM, Birnbaum KD (2008)
Cell-specific nitrogen responses mediate developmental plasticity. Proc
Natl Acad Sci USA 105: 803–808
Gillaspy G, Ben-David H, Gruissem W (1993) Fruits: a developmental
perspective. Plant Cell 5: 1439–1451
Giovannoni JJ (2001) Molecular biology of fruit maturation and ripening.
Annu Rev Plant Physiol Plant Mol Biol 52: 725–749
Giovannoni JJ (2007) Fruit ripening mutants yield insights into ripening
control. Curr Opin Plant Biol 10: 283–289
Goff SA, Klee HJ (2006) Plant volatile compounds: sensory cues for health
and nutritional value? Science 311: 815–819
Gomez-Maldonado J, Avila C, Torre F, Canas R, Canovas FM, Campbell
MM (2004) Functional interactions between a glutamine synthetase
promoter and MYB proteins. Plant J 39: 513–526
Gonzalez N, Gevaudant F, Hernould M, Chevalier C, Mouras A (2007)
The cell cycle-associated protein kinase WEE1 regulates cell size in
relation to endoreduplication in developing tomato fruit. Plant J 51:
642–655
Guillet C, Just D, Benard N, Destrac-Irvine A, Baldet P, Hernould M,
Causse M, Raymond P, Rothan C (2002) A fruit-specific phospho
enolpyruvate carboxylase is related to rapid growth of tomato fruit.
Planta 214: 717–726
Guillon F, Philippe S, Bouchet B, Devaux MF, Frasse P, Jones B, Bouzayen
M, Lahaye M (2008) Down-regulation of an auxin response factor in the
tomato induces modification of fine pectin structure and tissue archi-
tecture. J Exp Bot 59: 273–288
Guo A, He K, Liu D, Bai S, Gu X, Wei L, Luo J (2005) DATF: a database of
Arabidopsis transcription factors. Bioinformatics 21: 2568–2569
Gutierrez RA, Stokes TL, Thum K, Xu X, Obertello M, Katari MS,
Tanurdzic M, Dean A, Nero DC, McClung CR, et al (2008) Systems
approach identifies an organic nitrogen-responsive gene network that is
regulated by the master clock control gene CCA1. Proc Natl Acad Sci
USA 105: 4939–4944
Hanson J, Hanssen M, Wiese A, Hendriks M, Smeekens S (2008) The
sucrose regulated transcription factor bZIP11 affects amino acid metab-
olism by regulating the expression of asparagine synthetase 1 and
proline dehydrogenase 2. Plant J 53: 935–949
Hirai MY, Sugiyama K, Sawada Y, Tohge T, Obayashi T, Suzuki A, Araki
R, Sakurai N, Suzuki H, Aoki K, et al (2007) Omics-based identification
of Arabidopsis Myb transcription factors regulating aliphatic glucosi-
nolate biosynthesis. Proc Natl Acad Sci USA 104: 6478–6483
Hirai MY, Yano M, Goodenowe DB, Kanaya S, Kimura T, Awazuhara M,
Arita M, Fujiwara T, Saito K (2004) Integration of transcriptomics and
metabolomics for understanding of global responses to nutritional
stresses in Arabidopsis thaliana. Proc Natl Acad Sci USA 101: 10205–10210
Hoefgen R, Nikiforova VJ (2008) Metabolomics integrated with tran-
scriptomics: assessing systems response to sulfur-deficiency stress.
Physiol Plant 132: 190–198
Hounsome N, Hounsome B, Tomos D, Edwards-Jones G (2008) Plant
metabolites and nutritional quality of vegetables. J Food Sci 73: 48–65
Inoue K, Shirai T, Ochiai H, Kasao M, Hayakawa K, Kimura M, Sansawa
H (2003) Blood-pressure-lowering effect of a novel fermented milk
containing gamma-aminobutyric acid (GABA) in mild hypertensives.
Eur J Clin Nutr 57: 490–495
Jones B, Frasse P, Olmos E, Zegzouti H, Li ZG, Latche A, Pech JC,
Bouzayen M (2002) Down-regulation of DR12, an auxin-response-factor
homolog, in the tomato results in a pleiotropic phenotype including
dark green and blotchy ripening fruit. Plant J 32: 603–613
Kerk D, Bulgrien J, Smith DW, Barsam B, Veretnik S, Gribskov M (2002)
The complement of protein phosphatase catalytic subunits encoded in
the genome of Arabidopsis. Plant Physiol 129: 908–925
Klahre U, Noguchi T, Fujioka S, Takatsuto S, Yokota T, Nomura T,
Yoshida S, Chua NH (1998) The Arabidopsis DIMINUTO/DWARF1 gene
encodes a protein involved in steroid synthesis. Plant Cell 10: 1677–1690
Klann EM, Hall B, Bennett AB (1996) Antisense acid invertase (TIV1) gene
alters soluble sugar composition and size in transgenic tomato fruit.
Plant Physiol 112: 1321–1330
Kohonen T (2001) Self Organizing Maps, Ed 3. Springer, Berlin
Krupa A, Anamika, Srinivasan N (2006) Genome-wide comparative anal-
yses of domain organisation of repertoires of protein kinases of
Arabidopsis thaliana and Oryza sativa. Gene 380: 1–13
Lancien M, Roberts MR (2006) Regulation of Arabidopsis thaliana 14-3-3
gene expression by gamma-aminobutyric acid. Plant Cell Environ 29:
1430–1436
Lemaire-Chamley M, Petit J, Garcia V, Just D, Baldet P, Germain V,
Fagard M, Mouassite M, Cheniclet C, Rothan C (2005) Changes in
transcriptional profiles are associated with early fruit tissue specializa-
tion in tomato. Plant Physiol 139: 750–769
Lindon JC, Holmes E, Nicholson JK (2001) Pattern recognition methods
and applications in biomedical magnetic resonance. Prog Nucl Magn
Reson Spectrosc 39: 1–40
Liu Y, Roof S, Ye Z, Barry C, van Tuinen A, Vrebalov J, Bowler C,
Giovannoni J (2004) Manipulation of light signal transduction as a
means of modifying fruit nutritional quality in tomato. Proc Natl Acad
Sci USA 101: 9897–9902
Luo J, Butelli E, Hill L, Parr A, Niggeweg R, Bailey P, Weisshaar B, Martin
C (2008) AtMYB12 regulates caffeoyl quinic acid and flavonol synthesis
in tomato: expression in fruit results in very high levels of both types of
polyphenol. Plant J 56: 316–326
Manning K, Tor M, Poole M, Hong Y, Thompson AJ, King GJ, Giovannoni
JJ, Seymour GB (2006) A naturally occurring epigenetic mutation in a gene
encoding an SBP-box transcription factor inhibits tomato fruit ripening.
Nat Genet 38: 948–952
Mintz-Oron S, Mandel T, Rogachev I, Feldberg L, Lotan O, Yativ M,Wang
Z, Jetter R, Venger I, Adato A, et al (2008) Gene expression and
metabolism in tomato fruit surface tissues. Plant Physiol 147: 823–851
Mockaitis K, Estelle M (2004) Integrating transcriptional controls for plant
cell expansion. Genome Biol 5: 245
Moco S, Bino RJ, Vorst O, Verhoeven HA, de Groot J, van Beek
TA, Vervoort J, de Vos RCH (2006) A liquid chromatography-mass
spectrometry-based metabolome database for tomato. Plant Physiol
141: 1205–1218
Moco S, Capanoglu E, Tikunov Y, Bino RJ, Boyacioglu D, Hall RD,
Vervoort J, De Vos RC (2007) Tissue specialization at the metabolite
Plant Physiol. Vol. 149, 2009 1527
Gene-Metabolite Regulations in Tomato Fruit
www.plantphysiol.orgon August 31, 2018 - Published by Downloaded from Copyright © 2009 American Society of Plant Biologists. All rights reserved.

level is perceived during the development of tomato fruit. J Exp Bot 58:
4131–4146
Montoya T, Nomura T, Yokota T, Farrar K, Harrison K, Jones JGD, Kaneta
T, Kamiya Y, Szekeres M, Bishop GJ (2005) Patterns of Dwarf expres-
sion and brassinosteroid accumulation in tomato reveal the importance
of brassinosteroid synthesis during fruit development. Plant J 42:
262–269
Morillo SA, Tax FE (2006) Functional analysis of receptor-like kinases in
monocots and dicots. Curr Opin Plant Biol 9: 460–469
Mounet F, Lemaire-Chamley M, Maucourt M, Cabasson C, Giraudel JL,
Deborde C, Lessire R, Gallusci P, Bertrand A, Gaudillere M, et al
(2007) Quantitative metabolic profiles of tomato flesh and seeds during
fruit development: complementary analysis with ANN and PCA.
Metabolomics 3: 273–288
Ness AR, Powles JW (1997) Fruit and vegetables, and cardiovascular
disease: a review. Int J Epidemiol 26: 1–13
Ness AR, Powles JW (1999) The role of diet, fruit and vegetables and
antioxidants in the aetiology of stroke. J Cardiovasc Risk 6: 229–234
Nikiforova VJ, Daub CO, Hesse H, Willmitzer L, Hoefgen R (2005)
Integrative gene-metabolite network with implemented causality deci-
phers informational fluxes of sulphur stress response. J Exp Bot 56:
1887–1896
Oruna-Concha MJ, Methven L, Blumenthal H, Young C, Mottram DS
(2007) Differences in glutamic acid and 5#-ribonucleotide contents
between flesh and pulp of tomatoes and the relationship with umami
taste. J Agric Food Chem 55: 5776–5780
Persson S, Wei H, Milne J, Page GP, Somerville CR (2005) Identification of
genes required for cellulose synthesis by regression analysis of public
microarray data sets. Proc Natl Acad Sci USA 102: 8633–8638
Petreikov M, Shen S, Yeselson Y, Levin I, Bar M, Schaffer AA (2006)
Temporally extended gene expression of the ADP-Glc pyrophosphor-
ylase large subunit (AgpL1) leads to increased enzyme activity in
developing tomato fruit. Planta 224: 1465–1479
Pierik R, Tholen D, Poorter H, Visser EJW, Voesenek LACJ (2006) The
Janus face of ethylene: growth inhibition and stimulation. Trends Plant
Sci 11: 176–183
Riechmann JL, Ratcliffe OJ (2000) A genomic perspective on plant tran-
scription factors. Curr Opin Plant Biol 3: 423–434
Rolland F, Gonzalez EB, Sheen J (2006) Sugar sensing and signaling in
plants: conserved and novel mechanisms. Annu Rev Plant Biol 57:
676–709
Rose JC, Bennett AB (1999) Cooperative disassembly of the cellulose-
xyloglucan network of plant cell walls: parallels between cell expansion
and fruit ripening. Trends Plant Sci 4: 176–183
Rothan C, Causse M (2007) Natural and artificially induced genetic
variability in crop and model plant species for plant systems biology.
EXS 97: 21–53
Saeed A, Sharov V, White J, Li J, Liang W, Bhagabati N, Braisted J, Klapa
M, Currier T, Thiagarajan M, et al (2003) TM4: a free, open-source
system for microarray data management and analysis. Biotechniques 34:
374–378
Saito K, Hirai MY, Yonekura-Sakakibara K (2007) Decoding genes with
coexpression networks and metabolomics: ‘majority report by precogs.’
Trends Plant Sci 13: 36–43
SAS Institute (1990) SAS/STAT User’s Guide, Version 6, Ed 4. SAS
Institute, Cary, NC
Schauer N, Semel Y, Balbo I, Steinfath M, Repsilber D, Selbig J, Pleban T,
Zamir D, Fernie AR (2008) Mode of inheritance of primary metabolic
traits in tomato. Plant Cell 20: 509–523
Schutze K, Harter K, Chaban C (2008) Post-translational regulation of
plant bZIP factors. Trends Plant Sci 13: 247–255
Seymour G, Poole M,Manning K, King GJ (2008) Genetics and epigenetics
of fruit development and ripening. Curr Opin Plant Biol 11: 58–63
Shi YH, Zhu SW, Mao XZ, Feng JX, Qin YM, Zhang L, Cheng J, Wei LP,
Wang ZY, Zhu YX (2006) Transcriptome profiling, molecular biological,
and physiological studies reveal a major role for ethylene in cotton fiber
cell elongation. Plant Cell 18: 651–664
Smith CA, Want EJ, O’Maille G, Abagyan R, Siuzdak G (2006) XCMS:
processing mass spectrometry data for metabolite profiling using non-
linear peak alignment, matching, and identification. Anal Chem 78:
779–787
Szymanski J, Bielecka M, Carrari F, Fernie AR, Hoefgen R, Nikiforova VJ
(2007) On the processing of metabolic information through metabolite-
gene communication networks: an approach for modelling causality.
Phytochemistry 68: 2163–2175
Thimm O, Blasing O, Gibon Y, Nagel A, Meyer S, Kruger P, Selbig J,
Muller LA, Rhee SY, Stitt M (2004) MAPMAN: a user-driven tool to
display genomics data sets onto diagrams of metabolic pathways and
other biological processes. Plant J 37: 914–939
Thum K, Shin M, Gutierrez R, Mukherjee I, Katari M, Nero D, Shasha D,
Coruzzi G (2008) An integrated genetic, genomic and systems approach
defines gene networks regulated by the interaction of light and carbon
signaling pathways in Arabidopsis. BMC Syst Biol 2: 31
Urbanczyk-Wochniak E, Luedemann A, Kopka J, Selbig J, Roessner-
Tunali U, Willmitzer L, Fernie AR (2003) Parallel analysis of transcript
and metabolic profiles: a new approach in systems biology. EMBO Rep
4: 989–993
Van der Hoeven R, Ronning C, Giovannoni J, Martin G, Tanksley S (2002)
Deductions about the number, organization, and evolution of genes in
the tomato genome based on analysis of a large expressed sequence tag
collection and selective sequencing. Plant Cell 14: 1441–1456
Verica JA, He ZH (2002) The cell wall-associated kinase (WAK) and WAK-
like kinase gene family. Plant Physiol 129: 455–459
Wang D, Amornsiripanitch N, Dong X (2006) A genomic approach to
identify regulatory nodes in the transcriptional network of systemic
acquired resistance in plants. PLoS Pathog 2: e123
Wang D, Harper JF, Gribskov M (2003) Systematic trans-genomic com-
parison of protein kinases between Arabidopsis and Saccharomyces
cerevisiae. Plant Physiol 132: 2152–2165
Wang S, Liu J, Feng Y, Niu X, Giovannoni J, Liu Y (2008) Altered plastid
levels and potential for improved fruit nutrient content by downregu-
lation of the tomato DDB1-interacting protein CUL4. Plant J 55: 89–103
World Health Organization (2003) Diet Nutrition and the Prevention of
Chronic Diseases: Report of a Joint WHO/FAO Expert Consultation.
WHO Technical Report Series 916. World Health Organization, Geneva
Wilkinson JQ, Lanahan MB, Yen HC, Giovannoni JJ, Klee HJ (1995) An
ethylene-inducible component of signal transduction encoded by never-
ripe. Science 270: 1807–1809
WuH, Kerr K, Cui X, Churchill GA (2003) MAANOVA: a software package
for the analysis of spotted cDNA microarray experiments. In G Parmi-
giani, ES Garett, RA Irizarry, SL Zeger, eds, The Analysis of Gene
Expression Data: Methods and Software. Springer-Verlag, New York, pp
313–341
1528 Plant Physiol. Vol. 149, 2009
Mounet et al.
www.plantphysiol.orgon August 31, 2018 - Published by Downloaded from Copyright © 2009 American Society of Plant Biologists. All rights reserved.