Gendered-impacts of smallholder land titling: a plot-level...
35
Gendered-impacts of smallholder land titling: a plot-level analysis in rural Zambia By Jordan Chamberlin *,** , Nicholas Sitko *,** and Munguzwe Hichaambwa ** * Michigan State University, ** Indaba Agricultural Policy Research Institute We explore the determinants of land titling by smallholder farmers in Zambia, and evaluate the impacts of titling on land productivity investments. We examine plot-level outcomes, and test for gendered differences in titling impacts. We find generally positive impacts of titling on investments, including strong gender-specific pathways of impact. Although female-headed households are less likely to make investments than male-headed households, female title holders are significantly more likely to make investments than male title holders (at least for labor intensive investments). We posit that these results are related to the systematically weaker rights of women in customary tenure systems, under which the security-enhancement of formal land title plays a relatively greater role in incentivizing long-term farm investments. Our results suggest the importance of facilitating access to titling mechanisms (and other tenure security mechanisms) by female farmers.
Transcript of Gendered-impacts of smallholder land titling: a plot-level...
Gendered-impacts of smallholder land titling: a plot-level analysis in rural
Zambia
By Jordan Chamberlin*,**, Nicholas Sitko*,** and Munguzwe Hichaambwa**
*Michigan State University, **Indaba Agricultural Policy Research Institute
We explore the determinants of land titling by smallholder farmers in Zambia, and
evaluate the impacts of titling on land productivity investments. We examine plot-level
outcomes, and test for gendered differences in titling impacts. We find generally
positive impacts of titling on investments, including strong gender-specific pathways
of impact. Although female-headed households are less likely to make investments
than male-headed households, female title holders are significantly more likely to
make investments than male title holders (at least for labor intensive investments). We
posit that these results are related to the systematically weaker rights of women in
customary tenure systems, under which the security-enhancement of formal land title
plays a relatively greater role in incentivizing long-term farm investments. Our results
suggest the importance of facilitating access to titling mechanisms (and other tenure
security mechanisms) by female farmers.
2
1. INTRODUCTION
Theoretically, acquisition of title should encourage investments in land productivity and enhance
incomes from farm enterprises. However, in Sub-Saharan Africa (SSA) empirical evidence of the
effects of land titling on land productivity and investment has been mixed (Deininger and
Binswanger 1999; Deininger and Feder 2009; Place & Otsuka, 2001; Smith 2004; Gavian &
Fafchamps, 1996). Recent studies in Zambia highlight the ambiguity of land titling affects in
smallholder production systems. In his 2004 study, Smith found that land titling yielded positive
results in in terms of fixed investments in land and the profitability of farm enterprises for
smallholders operating in a handful of “settlement schemes” in Southern Province. Yet the
geographic scope of this study was limited, making it difficult to make broader inferences at the
national level. Responding to this gap Sitko et al. (2014) used nationally representative
smallholder household survey data to estimate the determinants of land title acquisition and its
effects on investments in land improvements. They found that the policies and procedures for
awarding land titles appeared to systematically favor non-local investors, such as formal wage
earners and individuals with connections to the state, over local farmers. As a consequence of
this structural bias in institutional access, farm land title was very weakly associated with long-
term productive investments in land (ibid).
The analysis by Sitko et al. (2014) suggests the need for further investigation. By aggregating
their analysis to the smallholder household-level, important differences between households and
between fields controlled by different household members may be obscured. This paper,
therefore, seeks to extend Sitko et al.’s analysis in two important ways. First, we examine plot-
level, rather than household-level, outcomes. Our contention is that, even where most titled
farmers have title to all their plots (a fact which justified Sitko et al.’s household-level study),
plot-level analysis enables the inclusion of important controls that help clarify analytical results.
Secondly, we explicitly test for gendered differences in titling impacts, through the incorporation
of interaction terms in our econometric work. This approach is motivated by the fact that females
in customary systems in Zambia have land rights which are structurally more insecure and
3
limited than those of males (Sitko 2010; Moore and Vaughn 1994; Davision 1988; Shipton
1988).
We find that plot-level analysis substantially clarifies impacts, indicating generally positive
impacts of titling on investments, although such impacts are highly variable across investment
types. Furthermore, we find strong gender-specific pathways of impact. Although female-headed
households are less likely to make investments than male-headed households, and female title
holders are significantly more likely to make investments than male title holders (at least for
some kinds of investments). These results suggest that usurpation of formal titling institutions by
non-local elites is a gendered phenomenon.
The rest of this paper is structured as follows. Section 2 reviews the literature on land titling
effects on women’s land rights and investments. Sections 3 and 4 describe the data and methods
used in this study, respectively. Results are presented in Section 5 and conclusions are offered in
Section 6.
2. LAND TITLES AND WOMENS’ LAND RIGHTS
Analyses of the effects of land titling and other types of land tenure formalization in Africa have
tended to pursue two primary lines of inquiry. In the agricultural economics and development
economics the effect of land titling schemes have been explored through the use of household
level survey data. In general, these studies have sought to assess the effects of land titling
schemes against the theoretical arguments of their proponents. Proponents of land titling
schemes in Africa argue that the underdevelopment of formal property rights increases land
insecurity and thus hinders agricultural development by limiting farmers’ willingness to make
long-term investments in their land and undermining the capacity of land and credit markets to
develop in rural areas (de Soto 2000; Feder 1988).
When assessed in these terms, the effects of land titling on household-level outcomes have been
mixed. While some studies have found that land titling is associated with an increased likelihood
of farmers making long-term beneficial investments in land, such as tree planting and manuring,
the magnitude of these effects has often small and highly localized (Place & Otsuka, 2001; Smith
4
2004; Gavian and Fafchamps, 1996; Deininger et al. 2008). Indeed, a large literature on land
titling and other forms of land formalization in Africa suggests that in many cases these
programs have had little or no impact on smallholder productivity or fixed investment (See Place
2009 for a recent review of the literature. Also see Carter and Olinto 2003; Place and Migot-
Adholla 1998; Deininger and Feder 2009).
The second line of inquiry into the effects of land titling in Africa has approached the question
from a different angle. Rather than approach the questions about the effects of titling schemes
through the lens of household survey data, social scientist have examined the implications of
titling schemes on marginalized populations. These studies have tended to examines these effects
at both the community-level (Meinzen-Dick and Mwangi 2009) and at the intra-household level
(Carney and Watts 1991; Dei 1994; Fleuret 1988; Davision 1988; Shipton 1988). These studies
have emphasized the social and economic consequences of titling schemes, including the role of
information and power asymmetries in enabling a process of elite capture of land, often at the
expense of usufruct rights holders (World Bank 2003; Leuprecht 2004; Government of Kenya
2004; Jansen and Roquas 1998; Benjaminsen and Sjaastad 2002; Peters 2004).
It is within this second line of inquiry that the gender dimensions of land titling schemes are
most frequently examined. This literature has tended to examine the ways in which women’s
rights to land have changed, often negatively, as a result of land titling systems. The literature on
women’s right to land is large and diverse, reflecting both the complexity of African social
institutions and the importance of women to agriculture on the continent. Thus, to summarize
the literature on women’s land rights is fraught with challenges. Yet, in a stylized sense the
critique of land titling schemes on women’s rights to land revolves around “regularities” in the
gendered ways in which land is accessed and controlled.
A large body of literature suggests that, relative to men, women are limited in their capacity to be
“owners of land,” in the sense that their ability to exercise transfers rights to land are often
limited by the multiplicity of competing claims to the land under their control (Shipton and
Goheen 1992; Bruce and Migot-Adholla 1994; Berry 1988). Instead, women are often “owners
of crops,” in the sense that they exercise use right to land that are frequently accessed through
5
their ties to kin, mostly men, and husbands (Gray and Kevane 2008; Shipton and Goheen 1992;
Bruce and Migot-Adholla 1994). Through the process codifying land ownership, land titling or
registration schemes have frequently ended up codifying women’s rights land as subordinate to
the “owner” of the land, the male head of household (Shipton 1988; Plateau 1996; Toulmin and
Quan 2000). Davison (1988) summarizes this process in Kenya, stating that registration policies
gave “precedence to individual ownership invested in male heads of households and in turn
marginalized the usufruct rights of women formerly guaranteed under lineage tenure”(165).
While there are accounts of women using land titling and registration schemes to enhance their
control over land in the literature (Weiss 1993; Dei 1994), these are the minority.
In Zambia there are several channels by which land titles can be acquired. Like much of SSA,
land in Zambia is administered through a dual tenure system. On the one hand, leasehold titles
are awarded what are called state lands, which were originally designed during the colonial era
for allocation to European settlers. These areas tend to be clustered in proximity to major
transport routes and urban centers. These lands are subject to statutory law and can be bought
and sold. On the other hand, usufruct land rights are granted in customary land areas, which are
administered by traditional authorities, such as chiefs and headmen. Procedures for transferring
customary lands to leasehold titles are codified in the 1995 Land Act, which is the current
governing document on land in Zambia. Through the 1995 Land Act, and previously the 1947
Northern Rhodesia Order in Council for Native Trust Lands, individuals, corporations, and the
state are able to convert customary land (formerly native trust land) to leasehold title upon
consent from the local chief and the district council. Through this conversion process land is
removed from customary administration and becomes subject to statutory law. Smallholders can
access land titles on former customary land either as individuals or through state run settlement
schemes. The processes for converting customary land to leasehold or acquiring leasehold on a
settlement scheme are fraught with opaque negotiations between the land seeker and authorities
and may entail substantial costs. This contributes to a structure of land title acquisition that tends
to favor non-local individuals with access to wage employment, often from the public sector
(Sitko et al 2014). Despite barriers to entry for more marginalized segments of Zambian society,
women in Zambia can and do acquire title to their land. Nationally representative survey data
6
indicate that nearly one-fifth of titled smallholder households are headed by women (see table 3
below). This is equivalent to about 27,000 households nationwide, representing a non-trivial
component of the rural economy.
Summarizing the literature on women and land use suggests that by in large women attain far
lower yields than man and focus overwhelming on the production of food crops while men tend
to focus on commercial crops (Gladwin 2002; Dercon 2006; Urdy 1996). To what extent, then,
might titling affect this stylized characterization of female-headed farm households? We
hypothesize that, the systematic disadvantaged land rights and tenure security that women
generally have, that the impacts of titling may be correspondingly greater for females than for
males. If this is true, we would expect that the productivity-incentivizing effects of title would be
greater for female-headed households than for male-headed households.
3. DATA
This study uses nationally representative household survey data from the Rural Agricultural
Livelihoods Survey (RALS), carried out in 2012 by the Indaba Agricultural Policy Research
Institute (IAPRI) in collaboration with the Central Statistical Office (CSO) and the Ministry of
Agriculture and Livestock (MAL) in Zambia. A total of 8,839 households were surveyed in 442
Standard Enumeration Areas (SEAs) in all districts of the country. The sample was designed to
be representative of the rural farm households cultivating less than 20 ha of land for farming
and/or livestock production. The survey asked the respondent to recall events primarily for the
2010/2011 production and marketing seasons (May 2011 to April 2012).
4. METHODS
At the core of our conceptual model are two central assumptions. First, that title-possession
confers incentives for medium- and long-term investments in land productivity, primarily
through enhancing security of tenure rights (Feder 1988). Thus, ceteris paribus, we assume that
7
𝜕Pr(𝑖𝑛𝑣𝑒𝑠𝑡𝑚𝑒𝑛𝑡)
𝜕𝑡𝑖𝑡𝑙𝑒> 0. Second, we assume that these impacts are larger for those households with
systematically weaker rights under customary (non-titled) tenure. Thus, for female-headed
households, we expect that the impact of title on investment outcomes is larger than for male-
headed households, i.e. 𝜕Pr(𝑖𝑛𝑣𝑒𝑠𝑡𝑚𝑒𝑛𝑡)
𝜕𝑡𝑖𝑡𝑙𝑒∗𝑓𝑒𝑚𝑎𝑙𝑒>
𝜕Pr(𝑖𝑛𝑣𝑒𝑠𝑡𝑚𝑒𝑛𝑡)
𝜕𝑡𝑖𝑡𝑙𝑒∗𝑚𝑎𝑙𝑒, although we acknowledge a priori that
this may be particularly true of labor-intensive investments. In other words, we allow for the
possibility that capital-intensive investments may be less available to female-headed households,
which tend to have fewer capital assets available for such investments.
Since most of the investments we observe are measured as binary outcomes, we use a probit
modeling framework to estimate the impacts of title on investments, where title possession is
observed at the plot-level. To differentiate impacts across male and female-headed households
we interact the titling dummy with a female-head dummy. Furthermore, we evaluate the
robustness of this gendered approach by also evaluating an alternative specification which uses a
plot-level gender indicator of the principal decision maker, in place of the gender-of-head
indicator
A key estimation challenge lies in the possible endogeneity of title possession with investment
outcomes, whereby bias arises from unobserved factors which are correlated with both title
acquisition and investment outcomes (i.e. some kind of unobserved ability and/or human capital
endowments, or similar characteristics). We respond to this possibility by using proxy variables
to control for unobserved heterogeneity of this nature.1 We further evaluate the robustness of our
models by evaluating the sensitivity of coefficient estimates to the inclusion of progressively
larger sets of observed plot-, household- and village-level characteristics. The argument
underlying this approach is that the degree of sensitivity to conditioning on unobservables is
indicated by the degree of sensitivity to conditioning on observables (Acemoglu et al. 2001;
Altonji et al. 2005; Kilic et al. 2014). In other words, if coefficient estimates are stable across
model specifications which differ in the number of observable characteristics used as regressors,
1 To proxy for unobserved ability, human capital and non-local social capital we use several observed proxies, measured as binary outcomes: blood kinship with chief, status as local vs immigrant household, and wage income from civil service employment.
8
then they are likely also robust to (unimplementable) specifications that include unobserved
characteristics.
5. RESULTS
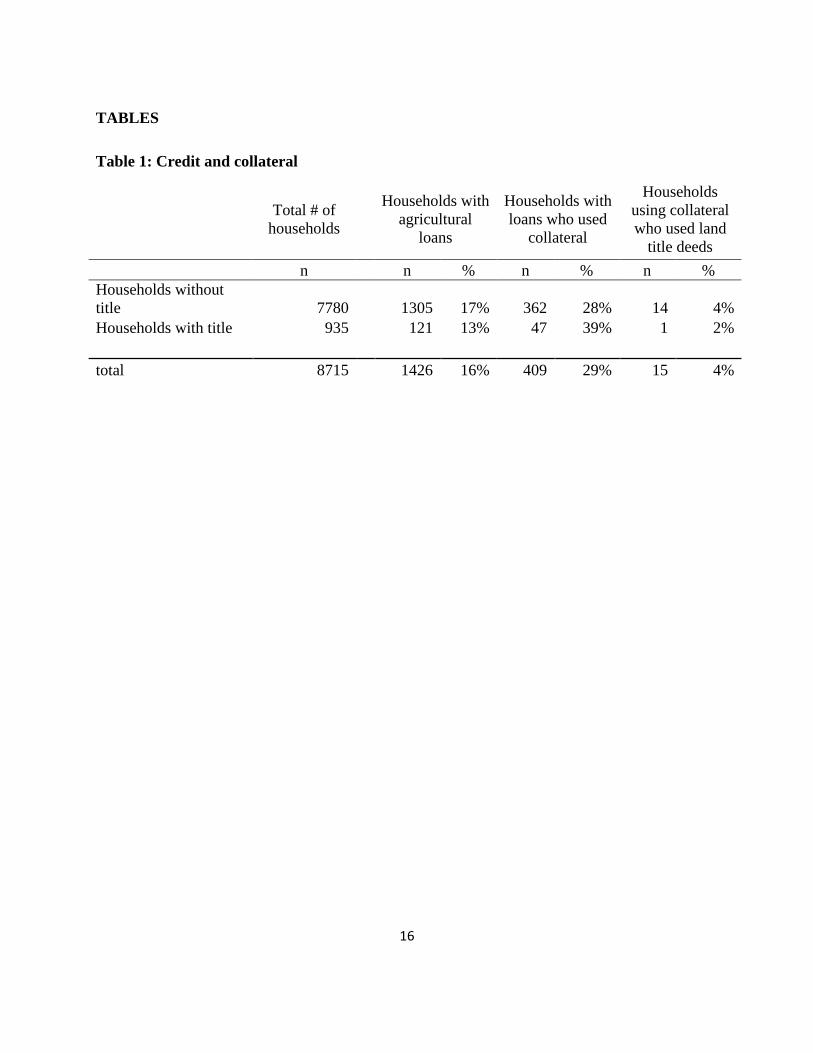
The two primary channels of investment incentives are title-as-collateral and title-as-security.
Table 1 shows that title to rural agricultural land does not seem to be used as collateral in any
formal sense. Only 16% of the sample obtained formal credit for agricultural purposes; of this
group, only 29% reported using collateral to secure these loans. Of those who did use collateral
as security, only 4% indicated that they used land title as collateral. Of this group of 15, only 1
household reported having titled agricultural plots, suggesting that the titled land used as
collateral was in another (probably urban) area.
[TABLE 1 ABOUT HERE]
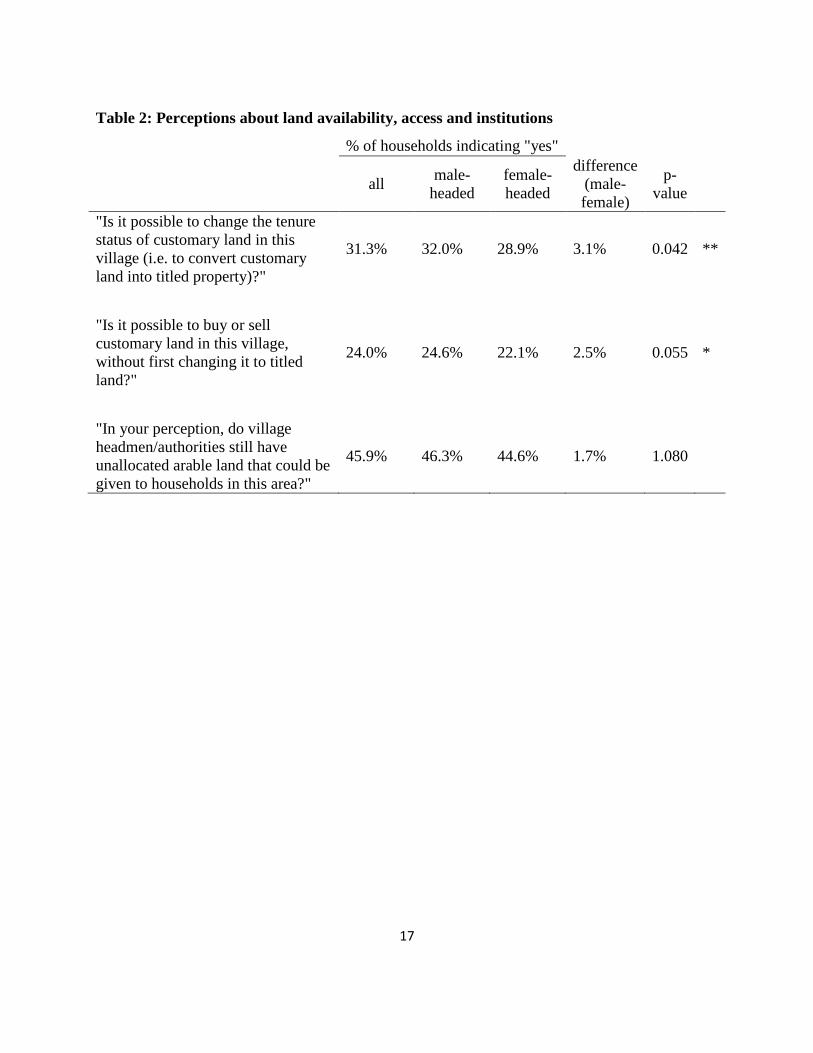
This leaves us with title-as-security as the primary focus. Our conceptual model posits that
women face systematically higher levels of insecurity in customary systems. Although
descriptive evidence to support this is widely available elsewhere, we contribute to this literature
by showing that at least some perceptions about land access are gender-differentiated. Table 2
shows responses, by sex of household head, to a number of perception questions. Female-headed
households are less likely to report that it is possible to convert tenure status from customary to
titled land. Female-headed households are also less likely to report that land can be bought and
sold without having tenure. Females are also more likely to report that there is no more
unallocated land available locally, but this difference is not statistically significant. These
responses support the notion that women have weaker rights to land in customary systems, and,
furthermore, that accessing leasehold systems (via titling) are more difficult for women not only
because of greater capital constraints, but also because of systematically different perceptions
about the availability of conversion mechanisms.
[TABLE 2 ABOUT HERE]
9
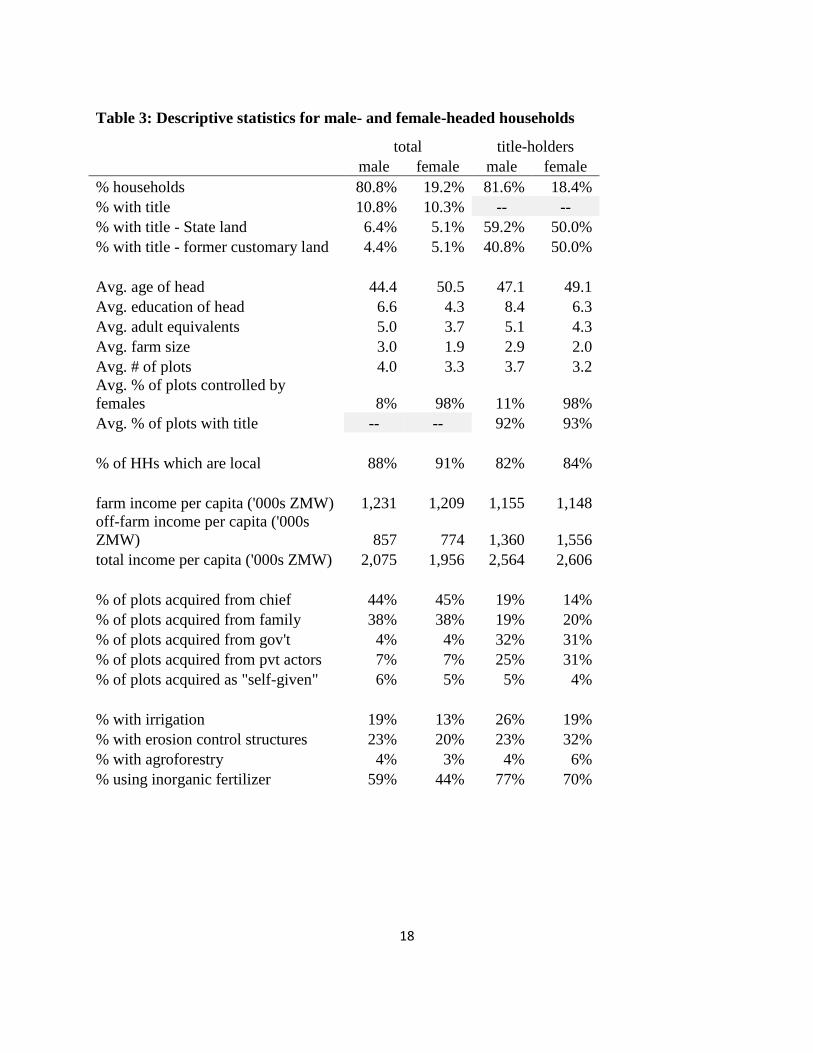
Table 3 shows descriptive statistics for the nationally representative survey households.
Although women2 are less likely than men to obtain title, this difference is very small: slightly
more than 10% of each household type are title-holders. Women are more likely, however, to
obtain title in areas of former customary tenure, rather than in State lands (in which most land is
under title). Presumably these are land titles that have been acquired through a direct conversion
process or through state sponsored settlement schemes.
Both the farm size and number of plots are smaller for title-holders than non-title-holders, and
also smaller for women than for men. About 10% of plots in male-headed households are
controlled by women, compared to nearly 100% in female-headed households. More than 90%
of the plots held by title-holders of either gender are titled.
Female-headed households are slightly more likely to be local, rather than immigrants from other
areas. Their income, in per-capita terms, are about on par with those of male households, given
their smaller average household size. For all households, about half of total income is from non-
farm sources, on average.
In terms of plot acquisition, titled land is much more likely to come from government or private
sellers than from chief or family, which are the dominant acquisition sources in customary areas.
(About 60% of titled land was acquired directly from government or private sellers, as compared
to about 10% in the full sample.) The channel of acquisition in the full sample does not vary
significantly between females and males. However, for title-holders, there is a gendered pattern:
female title-holders are less likely than males to have land obtained from the chief, and more
likely to have acquired their land from private actors. (The relative shares of land from family
and government are about the same.)
Titled households are more likely to report making land-productivity investments than the
sample average. However, the share of households making such investments varies widely by
investment type. Less than a quarter of households report investments in irrigation or erosion
2 For convenience of exposition, we will refer to female-headed households as “women” and male-headed households as “men.”
10
control structures (which include bunds, terracing, drainage ditches, grass barriers and contour
planting).
[TABLE 3 ABOUT HERE]
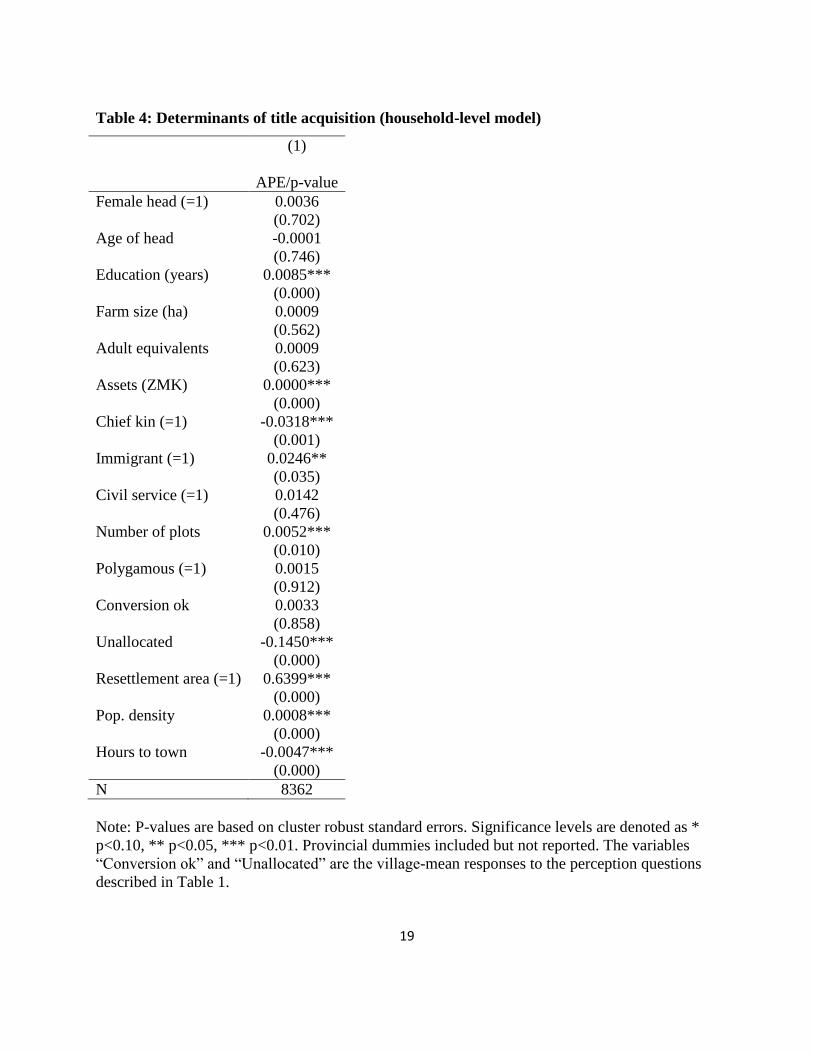
We examined the determinants of title acquisition with a probit model. Estimation results are
shown in Table 4. Title-holders are better educated and have more productive assets than non-
holders. Title-holders are less likely to have blood kinship with the chief and more likely to be
immigrants than non-holders.
In terms of place-specific controls, a number of things stand out. Surprisingly, the mean village
response to the question “is conversion allowed” is not a significant determinant of acquisition.
However, in areas where the mean village response to the question “is there unallocated land
remaining here?” is negative (indicating perceptions of land scarcity), the probability of titling is
greater. The probability of titling increases with population density and proximity to urban
centers, suggesting that demand for conversion is greater in areas with better access and,
possibly, as a response to relative land scarcity.3
[TABLE 4 ABOUT HERE]
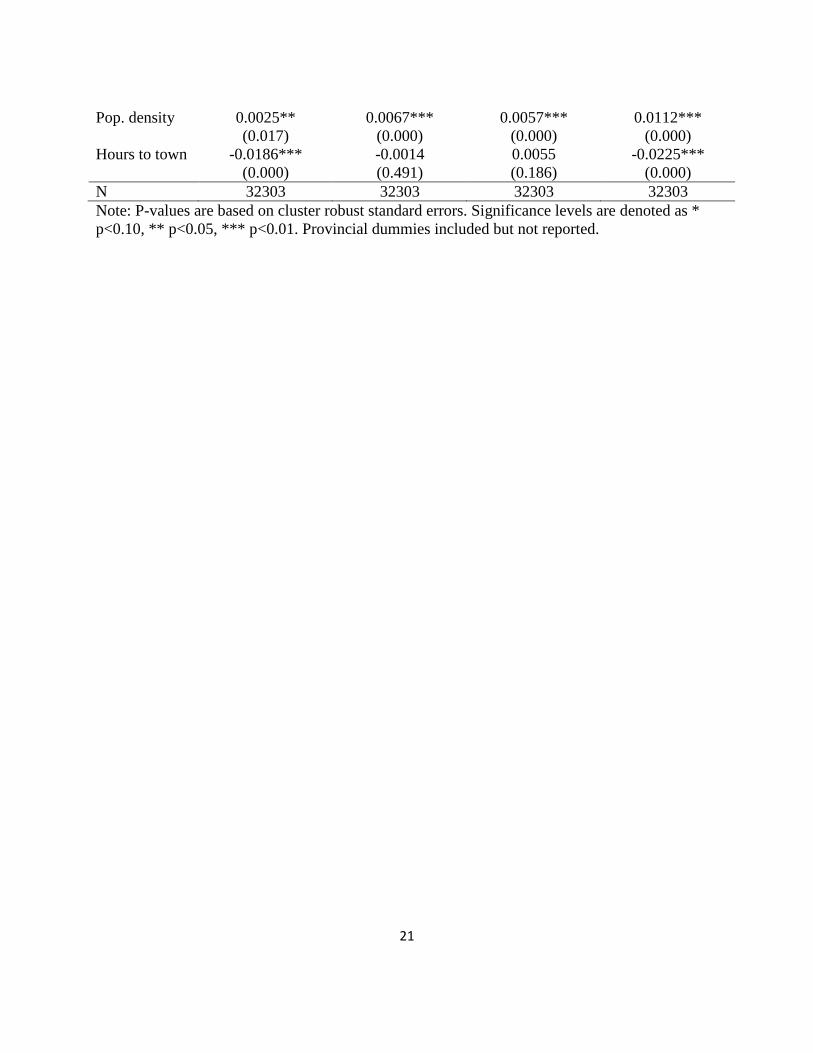
Probit estimates of the determinants of land productivity investment decisions are shown in table
5 (coefficient estimates). The probability of making irrigation investments is marginally lower
for females but significantly higher for title-holders. The interaction term (female * titled) is not
significant, indicating that there is no discernable gendered-component to the titling incentives
for irrigation. Possession of title has a significantly positive impact on the probability of making
erosion control investments. Furthermore, female-headed households with title are significantly
more likely to make such investments. The probability of making agroforestry investments is not
discernably impacted by titling or by gender. The probability of using inorganic fertilizer is
higher for title holders but lower for female heads.
3 In alternative specifications, we also included marital status indicators to see if female-heads were more likely to acquire title if they were divorced or widowed, which would suggest that they obtained title via their husbands rather than directly. The coefficient estimates for these indicators were not significant, indicating that this was not the primary channel of acquisition.
11
[TABLE 5 ABOUT HERE]
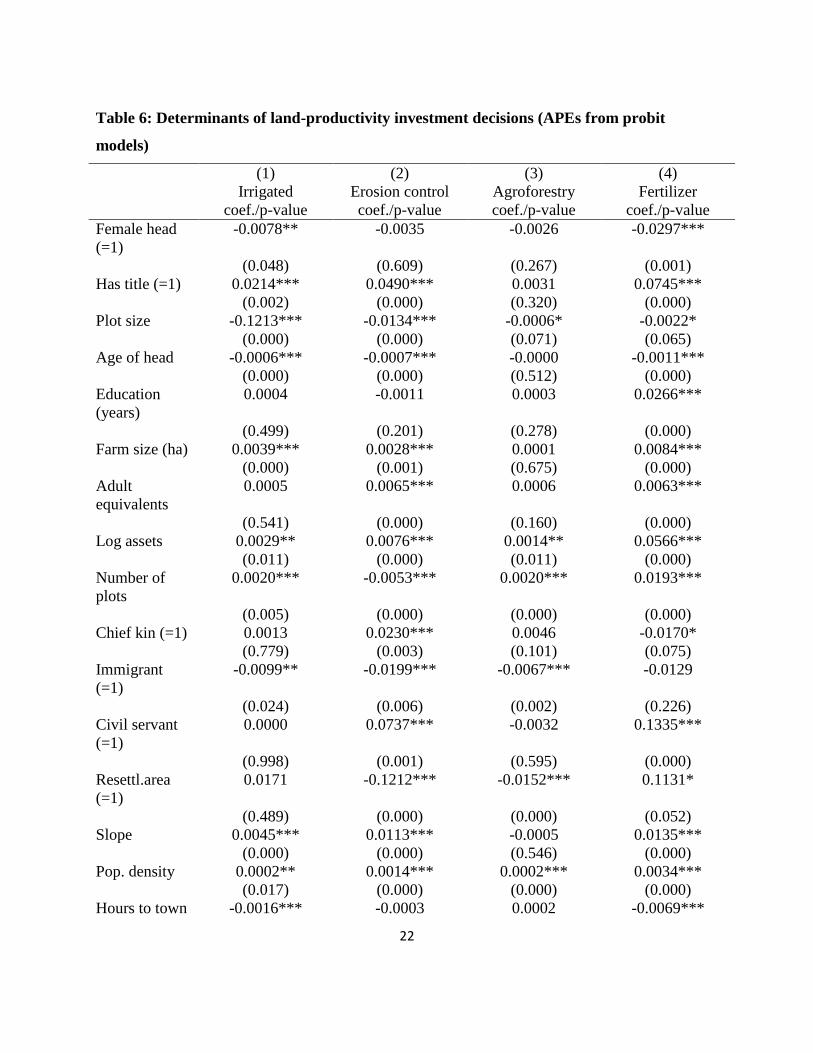
Tables 6 and 7 show Average Partial Effects (APEs) from these models. Table 6 shows the APEs
for changes in each of the model covariates. In the case of gender and title, the APEs account for
covariates entering the model separately as well as via the interaction term. In general, after
controlling for title possession, female-heads are less likely to make such investments than male-
heads (by 0.8% and 2.3% respectively for irrigation and fertilizer; insignificantly different from
zero for the other outcomes). Title possession, in turn, is positively associated with most
outcomes, with titled plots associated with 2.1%, 4.9% and 7.5% greater probability of
investments for irrigation, erosion control and fertilizer, respectively (and insignificant impacts
on agroforestry investments).
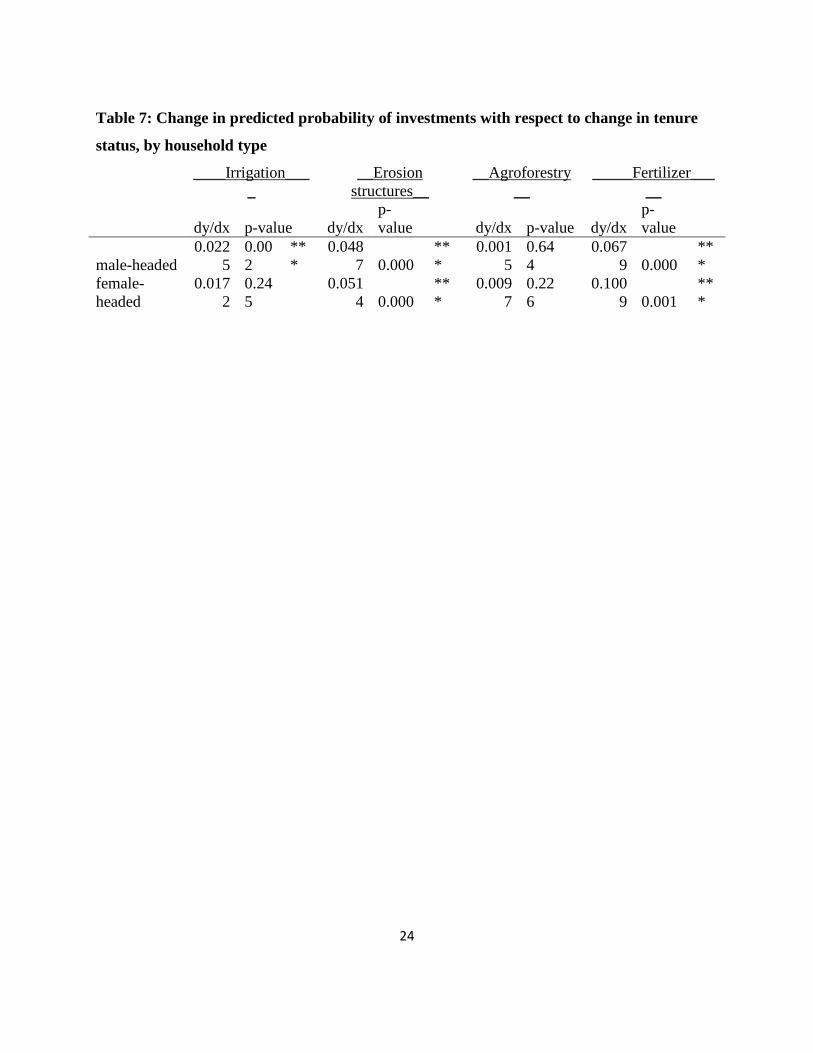
However to clarify the gendered impacts of titling, table 7 shows changes in the predicted
probabilities of investments with respect to changes in tenure status by female- and male-headed
households respectively. Here we observe gendered impacts for most investments. The impact of
titling for male-headed households is greater for irrigation investment probability. However,
titling has a much larger impact on erosion control and fertilizer investments for female-headed
households: the impact of title possession is associated with 5.1% greater likelihood of erosion
control investments on female-headed farms, compared with 4.9% on male-headed farms, and
with 10.1% greater likelihood of fertilizer investments on female-headed farms, compared with
6.8% on male-headed farms.
[TABLE 6 ABOUT HERE]
[TABLE 7 ABOUT HERE]
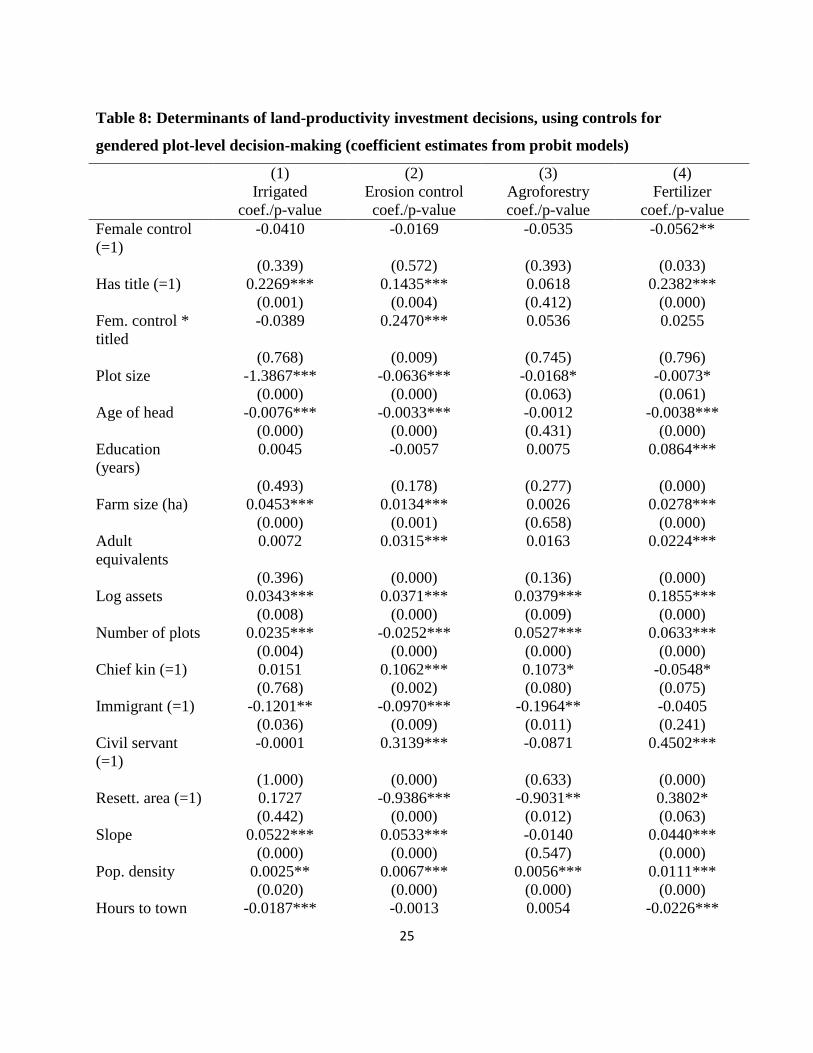
To test the robustness of these gendered results, we used a plot-level indicator of the gender of
the principal decision maker, in place of the gender of household head dummy. Results, shown in
table 8, are very consistent with those shown earlier in table 5. This lends support to our findings.
[TABLE 8 ABOUT HERE]
12
6. DISCUSSION AND CONCLUSIONS
To the extent that Zambia’s system for converting land from customary to formal tenure is meant
to encourage productive, rather than speculative land uses, the participation of female-headed
households appears to be important. Female-headed households currently constitute a minority of
title-holders, a proportion which is slightly smaller than their share in the agricultural population
as a whole. Finding ways to lower the transaction costs and bureaucratic complexity of
acquiring title to land, particularly by female-headed households, should be a policy objective.
The analysis presented in this paper has shown that the impacts of titling on investments, while
limited, are generally positive, although such impacts are highly variable across investment
types. The types of investments most affected are, in order: erosion control, inorganic fertilizer
application and irrigation.
Furthermore, we find strong evidence of gender-specific impacts of titling. Although female-
headed households are less likely to make investments than male-headed households, and female
title holders are significantly more likely to make investments than male title holders for erosion
control structures and fertilizer application. These results suggest that usurpation of formal titling
institutions by non-local elites is a gendered phenomenon.
Finally, our study has shown that plot-level analysis substantially clarifies the impacts of land
titling in smallholder systems. Our findings indicates that tenure security is a localized
phenomenon, which is best measured at plot-level -- despite the fact that most titled farmers have
title to all their plots (a fact which guided Sitko et al.’s 2014 analysis of titling impacts in
Zambia).
13
REFERENCES
Acemoglu, Daron, S. Johnson, and J. A. Robinson. 2001. “The colonial origins of comparative
development: An empirical investigation.” American Economic Review, 91 (5), 1369-
1401.
Altonji, J., T. Elder, and C. Taber. 2005. “Selection on observed and unobserved variables:
Assessing the effectiveness of Catholic schools.” Journal of Political Economy, 113, 151-
184.
Banda, C. T. A. (1982). Institutional, administrative, and management aspects of land tenure in
Zambia. Arntzen, JW, Ngcongco, and Turner, SD (eds.), Land policy and agriculture in
Eastern and Southern Africa. Tokyo: The United Nations University.
Benjaminsen, T. A., & Sjaastad, E. (2002). Race for the Prize: Land Transactions and Rent
Appropriation in the Malian Cotton Zone. The European Journal of Development
Research, 14(2), 129-152.
Brown, T. (2005). “Contestation, confusion, and corruption: Market-based land reform in
Zambia.” In Competing Jurisdiction: Settling land claims in Africa. S. Evers, M.
Spierenburg, and Wels, H. eds., London and Boston: Brill.
Bruce, J. W., & Dorner, P. (1982). Agricultural Land Tenure in Zambia: Perspectives, Problems,
and Opportunities. Land Tenure Center, University of Wisconsin-Madison.
Carter, M. R., & Olinto, P. (2003). Getting institutions “right” for whom? Credit constraints and
the impact of property rights on the quantity and composition of investment. American
Journal of Agricultural Economics, 85(1), 173-186.
Chenoweth, F., Knowles, J., & Ngenda, G. (1995).”Settlement Programs.” In M. Roth & S. G.
Smith (Eds.), Land tenure, land markets, and institutional transformation in Zambia (pp.
173–198). Madison: Land Tenure Center, [LTC Research paper 124].
Colson, E. (1971). The social consequences of resettlement: The impact of the Kariba
resettlement upon the Gwembe Tonga (Vol. 4). Manchester University Press.
de Soto, H. (2000). The mystery of capital: Why capitalism succeeds in the West and fails
everywhere else.
Deininger, K. (2011). Challenges posed by the new wave of farmland investment. The journal of
peasant studies, 38(2), 217-247.
Deininger, K., & Feder, G. (2009). Land registration, governance, and development: Evidence
and implications for policy. The World Bank Research Observer, 24(2), 233-266.
14
Deininger, K., Ali, D. A., Holden, S., & Zevenbergen, J. (2008). Rural land certification in
Ethiopia: Process, initial impact, and implications for other African countries. World
Development, 36(10), 1786-1812.
Deinlnger, K., & Binswanger, H. (1999). The evolution of the World Bank's land policy:
principles, experience, and future challenges. The World Bank Research Observer, 14(2),
247-276.
Feder, G. (1988). Land policies and farm productivity in Thailand. Johns Hopkins University
Press.
Gavian, S., & Fafchamps, M. (1996). Land tenure and allocative efficiency in Niger. American
Journal of Agricultural Economics, 78(2), 460-471.
German, L., Schoneveld, G., & Mwangi, E. (2011). Contemporary processes of large-scale land
acquisition by investors: Case studies from sub-Saharan Africa. CIFOR.
Government of Kenya. (2004). Report of the Commission of Inquiry into the Illegal/Irregular
Allocation of Public Land. Nairobi: Government Printer
Hobsbawm, Eric, and Terence Ranger, eds. The invention of tradition. Cambridge University
Press, 2012.
Holden, S. T., & Otsuka, K. (2008). Land Markets and Development in Africa. The Emergence
of Land
Jansen, K., & Roquas, E. (1998). Modernizing insecurity: the land titling project in Honduras.
Development and Change, 29(1), 81-106.
Kilic, Talip, Amparo Palacios-Lopez, and Markus Goldstein. 2013. “Caught in a Productivity
Trap: A Distributional Perspective on Gender Differences in Malawian Agriculture.”
Policy Research Working Paper 6381. The World Bank Development Research Group,
Poverty and Inequality Team, March 2013. World Bank: Washington DC.
Land Act of Zambia (1995). Avialable on line at:
http://www.zla.org.zm/media/land_policy_simplifiedl_1995.pdf
Government of the Republic of Zambia. 1987. Land Settlement Information Booklet (1987)
Government printers: Lusaka Zambia
Lavigne -Delville, P. (2002). When Farmers Use'Pieces of Paper'to Record Their Land
Transactions in Francophone Rural Africa: Insights into the Dynamics of Institutional
Innovation. The European Journal of Development Research, 14(2), 89-108.
Leuprecht, P. (2004). Land concessions for economic purposes in Cambodia-A human rights
perspective. Report by the Special Representative of the Secretary General for human
15
rights in Cambodia. Phnom Penh: United Nations, Cambodia Office of the High
Commissioner for Human Rights.
Markets in Africa: Assessing the Impacts on Poverty, Equity, and Efficiency, 1.
Meinzen-Dick, R., & Mwangi, E. (2009). Cutting the web of interests: Pitfalls of formalizing
property rights. Land Use Policy, 26(1), 36-43.
Otsuka, K., & Place, F. (2001). Land tenure and natural resource management: a comparative
study of agrarian communities in Asia and Africa. Johns Hopkins University Press.
Peters, P. E. (2004). Inequality and social conflict over land in Africa. Journal of Agrarian
Change, 4(3), 269-314.
Place, F. (2009). Land tenure and agricultural productivity in Africa: a comparative analysis of
the Economics literature and recent policy strategies and reforms. World Development,
37(8), 1326-1336.
Place, F., & Hazell, P. (1993). Productivity effects of indigenous land tenure systems in sub-
Saharan Africa. American journal of agricultural economics,75(1), 10-19.
Place, F., & Migot-Adholla, S. E. (1998). The economic effects of land registration on
smallholder farms in Kenya: evidence from Nyeri and Kakamega districts. Land
Economics, 74(3), 360-373.
Ray, D. J. (1977). Chifwile Settlement Scheme: Expanding the Frontier of Zambian Agriculture
(Doctoral dissertation, African studies association).
Roth, M., Khan, A. M., & Zulu, M. C. (1995). Legal framework and administration of land
policy in Zambia. .” In M. Roth & S. G. Smith (Eds.), Land tenure, land markets, and
institutional transformation in Zambia (pp. 1-46). Madison: Land Tenure Center, [LTC
Research paper 124].
Sitko, N. J., & Jayne, T. S. (2012). The Rising Class of Emergent Farmers: An Effective Model
for Achieving Agricultural Growth and Poverty Reduction in Africa? (No. 140907).
Michigan State University, Department of Agricultural, Food, and Resource Economics.
Smith, R. E. (2004). Land tenure, fixed investment, and farm productivity: Evidence from
Zambia’s Southern Province. World Development, 32(10), 1641-1661.
World Bank (2003). “Nicaragua Land Policy and Administration: Towards a More Secure
Property Rights Regime.” Report 26683-NI. World Bank, Washington, DC.
16
TABLES
Table 1: Credit and collateral
Total # of
households
Households with
agricultural
loans
Households with
loans who used
collateral
Households
using collateral
who used land
title deeds
n n % n % n %
Households without
title 7780
1305 17% 362 28% 14 4%
Households with title 935
121 13% 47 39% 1 2%
total 8715
1426 16% 409 29% 15 4%
17
Table 2: Perceptions about land availability, access and institutions
% of households indicating "yes"
all male-
headed
female-
headed
difference
(male-
female)
p-
value
"Is it possible to change the tenure
status of customary land in this
village (i.e. to convert customary
land into titled property)?"
31.3% 32.0% 28.9% 3.1% 0.042 **
"Is it possible to buy or sell
customary land in this village,
without first changing it to titled
land?"
24.0% 24.6% 22.1% 2.5% 0.055 *
"In your perception, do village
headmen/authorities still have
unallocated arable land that could be
given to households in this area?"
45.9% 46.3% 44.6% 1.7% 1.080
18
Table 3: Descriptive statistics for male- and female-headed households
total title-holders
male female male female
% households 80.8% 19.2% 81.6% 18.4%
% with title 10.8% 10.3% -- --
% with title - State land 6.4% 5.1% 59.2% 50.0%
% with title - former customary land 4.4% 5.1% 40.8% 50.0%
Avg. age of head 44.4 50.5 47.1 49.1
Avg. education of head 6.6 4.3 8.4 6.3
Avg. adult equivalents 5.0 3.7 5.1 4.3
Avg. farm size 3.0 1.9 2.9 2.0
Avg. # of plots 4.0 3.3 3.7 3.2
Avg. % of plots controlled by
females 8% 98% 11% 98%
Avg. % of plots with title -- -- 92% 93%
% of HHs which are local 88% 91% 82% 84%
farm income per capita ('000s ZMW) 1,231 1,209 1,155 1,148
off-farm income per capita ('000s
ZMW) 857 774 1,360 1,556
total income per capita ('000s ZMW) 2,075 1,956 2,564 2,606
% of plots acquired from chief 44% 45% 19% 14%
% of plots acquired from family 38% 38% 19% 20%
% of plots acquired from gov't 4% 4% 32% 31%
% of plots acquired from pvt actors 7% 7% 25% 31%
% of plots acquired as "self-given" 6% 5% 5% 4%
% with irrigation 19% 13% 26% 19%
% with erosion control structures 23% 20% 23% 32%
% with agroforestry 4% 3% 4% 6%
% using inorganic fertilizer 59% 44% 77% 70%
19
Table 4: Determinants of title acquisition (household-level model)
(1)
APE/p-value
Female head (=1) 0.0036
(0.702)
Age of head -0.0001
(0.746)
Education (years) 0.0085***
(0.000)
Farm size (ha) 0.0009
(0.562)
Adult equivalents 0.0009
(0.623)
Assets (ZMK) 0.0000***
(0.000)
Chief kin (=1) -0.0318***
(0.001)
Immigrant (=1) 0.0246**
(0.035)
Civil service (=1) 0.0142
(0.476)
Number of plots 0.0052***
(0.010)
Polygamous (=1) 0.0015
(0.912)
Conversion ok 0.0033
(0.858)
Unallocated -0.1450***
(0.000)
Resettlement area (=1) 0.6399***
(0.000)
Pop. density 0.0008***
(0.000)
Hours to town -0.0047***
(0.000)
N 8362
Note: P-values are based on cluster robust standard errors. Significance levels are denoted as *
p<0.10, ** p<0.05, *** p<0.01. Provincial dummies included but not reported. The variables
“Conversion ok” and “Unallocated” are the village-mean responses to the perception questions
described in Table 1.

20
Table 5: Determinants of land-productivity investment decisions (coefficient estimates from
probit models)
(1) (2) (3) (4)
Irrigated Erosion control Agroforestry Fertilizer
coef./p-value coef./p-value coef./p-value coef./p-value
Female head
(=1)
-0.0894* -0.0402 -0.0923 -0.1025***
(0.084) (0.237) (0.195) (0.001)
Has title (=1) 0.2207*** 0.1654*** 0.0347 0.2214***
(0.001) (0.001) (0.635) (0.000)
Female * titled -0.0270 0.2457** 0.2234 0.1133
(0.864) (0.024) (0.222) (0.319)
Plot size -1.3824*** -0.0637*** -0.0163* -0.0072*
(0.000) (0.000) (0.070) (0.065)
Age of head -0.0072*** -0.0031*** -0.0010 -0.0035***
(0.000) (0.000) (0.512) (0.000)
Education
(years)
0.0045 -0.0054 0.0075 0.0865***
(0.499) (0.201) (0.278) (0.000)
Farm size (ha) 0.0448*** 0.0131*** 0.0025 0.0274***
(0.000) (0.001) (0.676) (0.000)
Adult
equivalents
0.0052 0.0308*** 0.0157 0.0204***
(0.541) (0.000) (0.158) (0.000)
Log assets 0.0327** 0.0362*** 0.0367** 0.1837***
(0.012) (0.000) (0.012) (0.000)
Number of
plots
0.0229*** -0.0253*** 0.0524*** 0.0628***
(0.005) (0.000) (0.000) (0.000)
Chief kin (=1) 0.0144 0.1056*** 0.1083* -0.0550*
(0.778) (0.002) (0.077) (0.074)
Immigrant
(=1)
-0.1205** -0.0979*** -0.1995*** -0.0419
(0.035) (0.009) (0.009) (0.226)
Civil servant
(=1)
0.0002 0.3080*** -0.0889 0.4492***
(0.998) (0.000) (0.627) (0.000)
Resettl. area
(=1)
0.1735 -0.9438*** -0.9125** 0.3791*
(0.440) (0.000) (0.012) (0.063)
Slope 0.0516*** 0.0537*** -0.0140 0.0438***
(0.000) (0.000) (0.546) (0.000)
21
Pop. density 0.0025** 0.0067*** 0.0057*** 0.0112***
(0.017) (0.000) (0.000) (0.000)
Hours to town -0.0186*** -0.0014 0.0055 -0.0225***
(0.000) (0.491) (0.186) (0.000)
N 32303 32303 32303 32303
Note: P-values are based on cluster robust standard errors. Significance levels are denoted as *
p<0.10, ** p<0.05, *** p<0.01. Provincial dummies included but not reported.
22
Table 6: Determinants of land-productivity investment decisions (APEs from probit
models)
(1) (2) (3) (4)
Irrigated Erosion control Agroforestry Fertilizer
coef./p-value coef./p-value coef./p-value coef./p-value
Female head
(=1)
-0.0078** -0.0035 -0.0026 -0.0297***
(0.048) (0.609) (0.267) (0.001)
Has title (=1) 0.0214*** 0.0490*** 0.0031 0.0745***
(0.002) (0.000) (0.320) (0.000)
Plot size -0.1213*** -0.0134*** -0.0006* -0.0022*
(0.000) (0.000) (0.071) (0.065)
Age of head -0.0006*** -0.0007*** -0.0000 -0.0011***
(0.000) (0.000) (0.512) (0.000)
Education
(years)
0.0004 -0.0011 0.0003 0.0266***
(0.499) (0.201) (0.278) (0.000)
Farm size (ha) 0.0039*** 0.0028*** 0.0001 0.0084***
(0.000) (0.001) (0.675) (0.000)
Adult
equivalents
0.0005 0.0065*** 0.0006 0.0063***
(0.541) (0.000) (0.160) (0.000)
Log assets 0.0029** 0.0076*** 0.0014** 0.0566***
(0.011) (0.000) (0.011) (0.000)
Number of
plots
0.0020*** -0.0053*** 0.0020*** 0.0193***
(0.005) (0.000) (0.000) (0.000)
Chief kin (=1) 0.0013 0.0230*** 0.0046 -0.0170*
(0.779) (0.003) (0.101) (0.075)
Immigrant
(=1)
-0.0099** -0.0199*** -0.0067*** -0.0129
(0.024) (0.006) (0.002) (0.226)
Civil servant
(=1)
0.0000 0.0737*** -0.0032 0.1335***
(0.998) (0.001) (0.595) (0.000)
Resettl.area
(=1)
0.0171 -0.1212*** -0.0152*** 0.1131*
(0.489) (0.000) (0.000) (0.052)
Slope 0.0045*** 0.0113*** -0.0005 0.0135***
(0.000) (0.000) (0.546) (0.000)
Pop. density 0.0002** 0.0014*** 0.0002*** 0.0034***
(0.017) (0.000) (0.000) (0.000)
Hours to town -0.0016*** -0.0003 0.0002 -0.0069***

23
(0.000) (0.491) (0.187) (0.000)
N 32303 32303 32303 32303
Note: P-values are based on cluster robust standard errors. Significance levels are denoted as *
p<0.10, ** p<0.05, *** p<0.01. Provincial dummies included but not reported.
24
Table 7: Change in predicted probability of investments with respect to change in tenure
status, by household type
____Irrigation___
_
__Erosion
structures__
__Agroforestry
__
_____Fertilizer___
__
dy/dx p-value dy/dx
p-
value dy/dx p-value dy/dx
p-
value
male-headed
0.022
5
0.00
2
**
*
0.048
7 0.000
**
*
0.001
5
0.64
4
0.067
9 0.000
**
*
female-
headed
0.017
2
0.24
5
0.051
4 0.000
**
*
0.009
7
0.22
6
0.100
9 0.001
**
*
25
Table 8: Determinants of land-productivity investment decisions, using controls for
gendered plot-level decision-making (coefficient estimates from probit models)
(1) (2) (3) (4)
Irrigated Erosion control Agroforestry Fertilizer
coef./p-value coef./p-value coef./p-value coef./p-value
Female control
(=1)
-0.0410 -0.0169 -0.0535 -0.0562**
(0.339) (0.572) (0.393) (0.033)
Has title (=1) 0.2269*** 0.1435*** 0.0618 0.2382***
(0.001) (0.004) (0.412) (0.000)
Fem. control *
titled
-0.0389 0.2470*** 0.0536 0.0255
(0.768) (0.009) (0.745) (0.796)
Plot size -1.3867*** -0.0636*** -0.0168* -0.0073*
(0.000) (0.000) (0.063) (0.061)
Age of head -0.0076*** -0.0033*** -0.0012 -0.0038***
(0.000) (0.000) (0.431) (0.000)
Education
(years)
0.0045 -0.0057 0.0075 0.0864***
(0.493) (0.178) (0.277) (0.000)
Farm size (ha) 0.0453*** 0.0134*** 0.0026 0.0278***
(0.000) (0.001) (0.658) (0.000)
Adult
equivalents
0.0072 0.0315*** 0.0163 0.0224***
(0.396) (0.000) (0.136) (0.000)
Log assets 0.0343*** 0.0371*** 0.0379*** 0.1855***
(0.008) (0.000) (0.009) (0.000)
Number of plots 0.0235*** -0.0252*** 0.0527*** 0.0633***
(0.004) (0.000) (0.000) (0.000)
Chief kin (=1) 0.0151 0.1062*** 0.1073* -0.0548*
(0.768) (0.002) (0.080) (0.075)
Immigrant (=1) -0.1201** -0.0970*** -0.1964** -0.0405
(0.036) (0.009) (0.011) (0.241)
Civil servant
(=1)
-0.0001 0.3139*** -0.0871 0.4502***
(1.000) (0.000) (0.633) (0.000)
Resett. area (=1) 0.1727 -0.9386*** -0.9031** 0.3802*
(0.442) (0.000) (0.012) (0.063)
Slope 0.0522*** 0.0533*** -0.0140 0.0440***
(0.000) (0.000) (0.547) (0.000)
Pop. density 0.0025** 0.0067*** 0.0056*** 0.0111***
(0.020) (0.000) (0.000) (0.000)
Hours to town -0.0187*** -0.0013 0.0054 -0.0226***
26
(0.000) (0.504) (0.190) (0.000)
N 32303 32303 32303 32303
* p<0.10, ** p<0.05, *** p<0.01

27
APPENDICES
Note: for all Appendix tables, P-values are based on cluster robust standard errors. Significance
levels are denoted as * p<0.10, ** p<0.05, *** p<0.01. Provincial dummies included but not
reported.
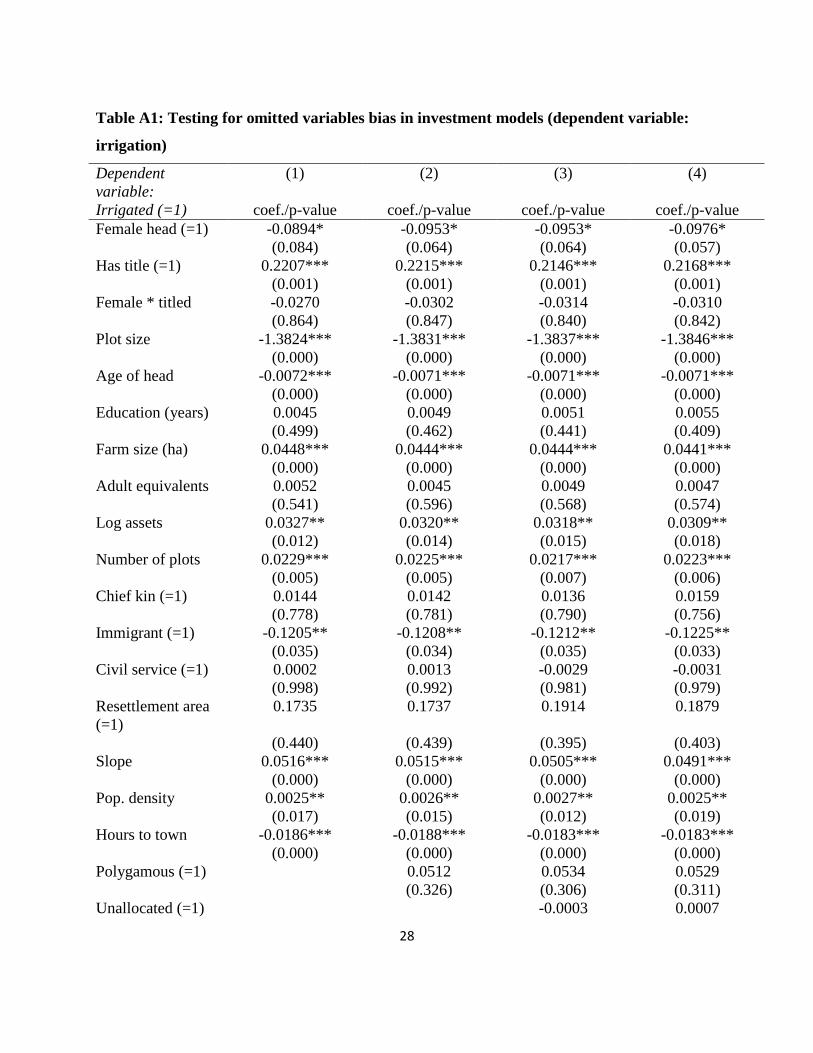
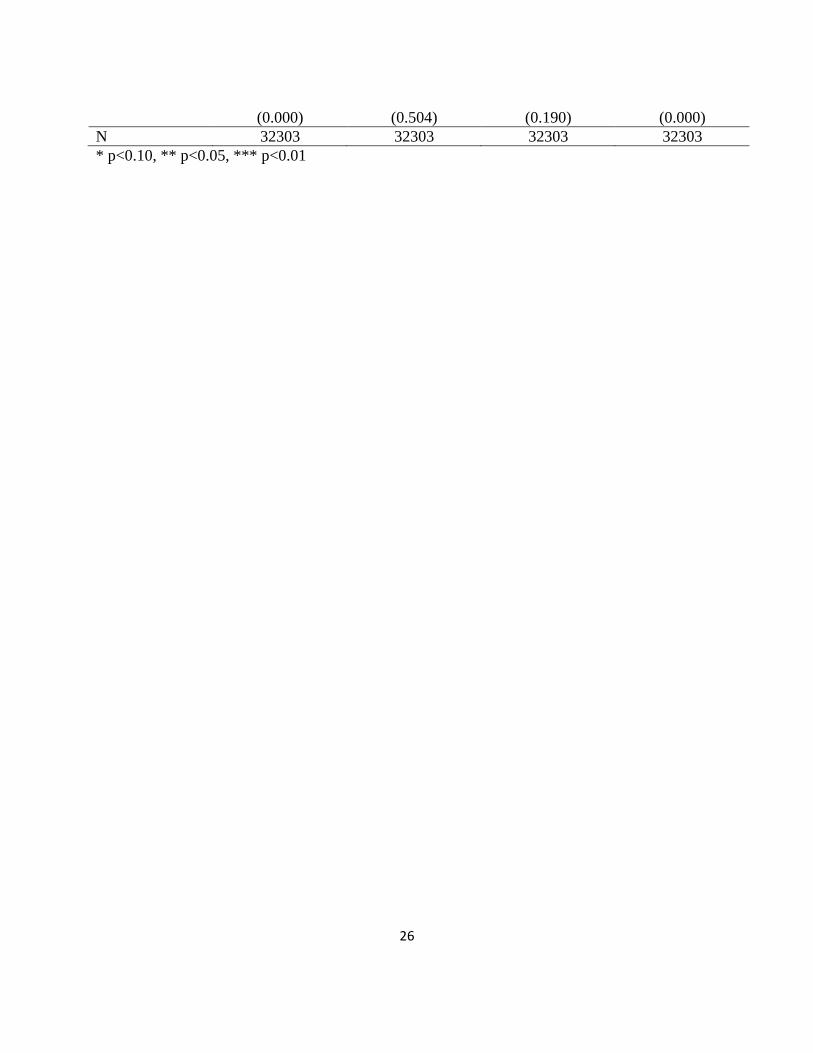
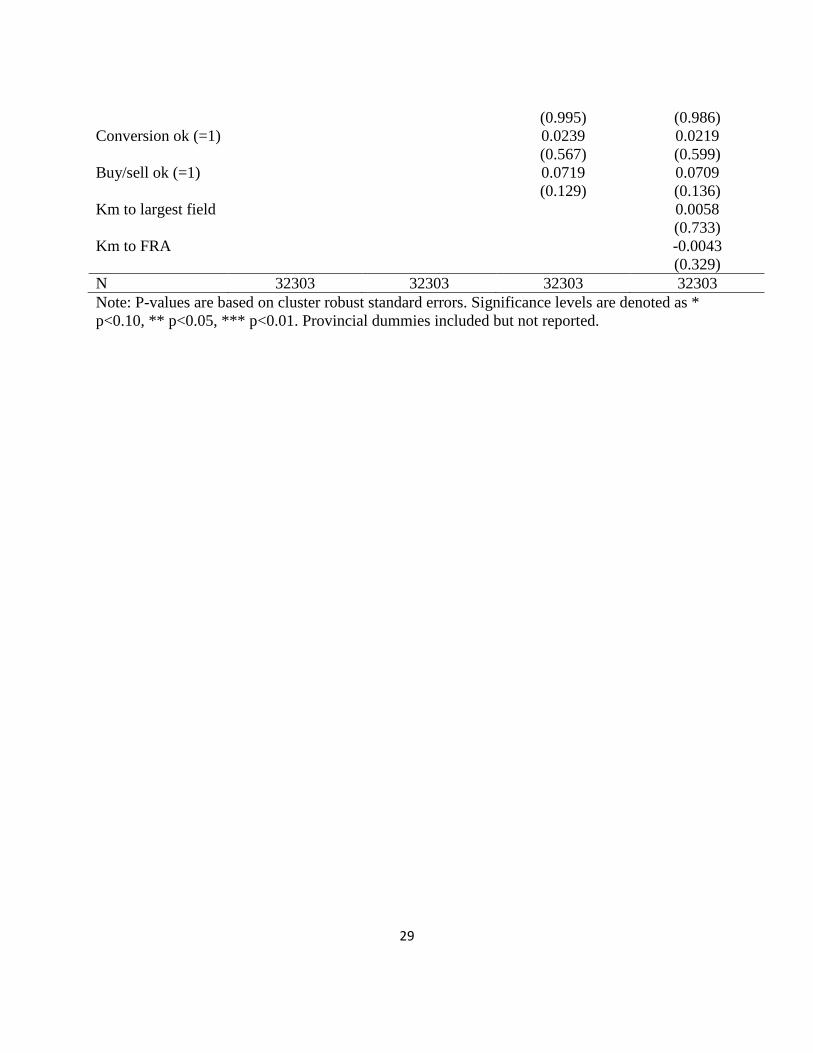
28
Table A1: Testing for omitted variables bias in investment models (dependent variable:
irrigation)
Dependent
variable:
(1) (2) (3) (4)
Irrigated (=1) coef./p-value coef./p-value coef./p-value coef./p-value
Female head (=1) -0.0894* -0.0953* -0.0953* -0.0976*
(0.084) (0.064) (0.064) (0.057)
Has title (=1) 0.2207*** 0.2215*** 0.2146*** 0.2168***
(0.001) (0.001) (0.001) (0.001)
Female * titled -0.0270 -0.0302 -0.0314 -0.0310
(0.864) (0.847) (0.840) (0.842)
Plot size -1.3824*** -1.3831*** -1.3837*** -1.3846***
(0.000) (0.000) (0.000) (0.000)
Age of head -0.0072*** -0.0071*** -0.0071*** -0.0071***
(0.000) (0.000) (0.000) (0.000)
Education (years) 0.0045 0.0049 0.0051 0.0055
(0.499) (0.462) (0.441) (0.409)
Farm size (ha) 0.0448*** 0.0444*** 0.0444*** 0.0441***
(0.000) (0.000) (0.000) (0.000)
Adult equivalents 0.0052 0.0045 0.0049 0.0047
(0.541) (0.596) (0.568) (0.574)
Log assets 0.0327** 0.0320** 0.0318** 0.0309**
(0.012) (0.014) (0.015) (0.018)
Number of plots 0.0229*** 0.0225*** 0.0217*** 0.0223***
(0.005) (0.005) (0.007) (0.006)
Chief kin (=1) 0.0144 0.0142 0.0136 0.0159
(0.778) (0.781) (0.790) (0.756)
Immigrant (=1) -0.1205** -0.1208** -0.1212** -0.1225**
(0.035) (0.034) (0.035) (0.033)
Civil service (=1) 0.0002 0.0013 -0.0029 -0.0031
(0.998) (0.992) (0.981) (0.979)
Resettlement area
(=1)
0.1735 0.1737 0.1914 0.1879
(0.440) (0.439) (0.395) (0.403)
Slope 0.0516*** 0.0515*** 0.0505*** 0.0491***
(0.000) (0.000) (0.000) (0.000)
Pop. density 0.0025** 0.0026** 0.0027** 0.0025**
(0.017) (0.015) (0.012) (0.019)
Hours to town -0.0186*** -0.0188*** -0.0183*** -0.0183***
(0.000) (0.000) (0.000) (0.000)
Polygamous (=1) 0.0512 0.0534 0.0529
(0.326) (0.306) (0.311)
Unallocated (=1) -0.0003 0.0007
29
(0.995) (0.986)
Conversion ok (=1) 0.0239 0.0219
(0.567) (0.599)
Buy/sell ok (=1) 0.0719 0.0709
(0.129) (0.136)
Km to largest field 0.0058
(0.733)
Km to FRA -0.0043
(0.329)
N 32303 32303 32303 32303
Note: P-values are based on cluster robust standard errors. Significance levels are denoted as *
p<0.10, ** p<0.05, *** p<0.01. Provincial dummies included but not reported.
30
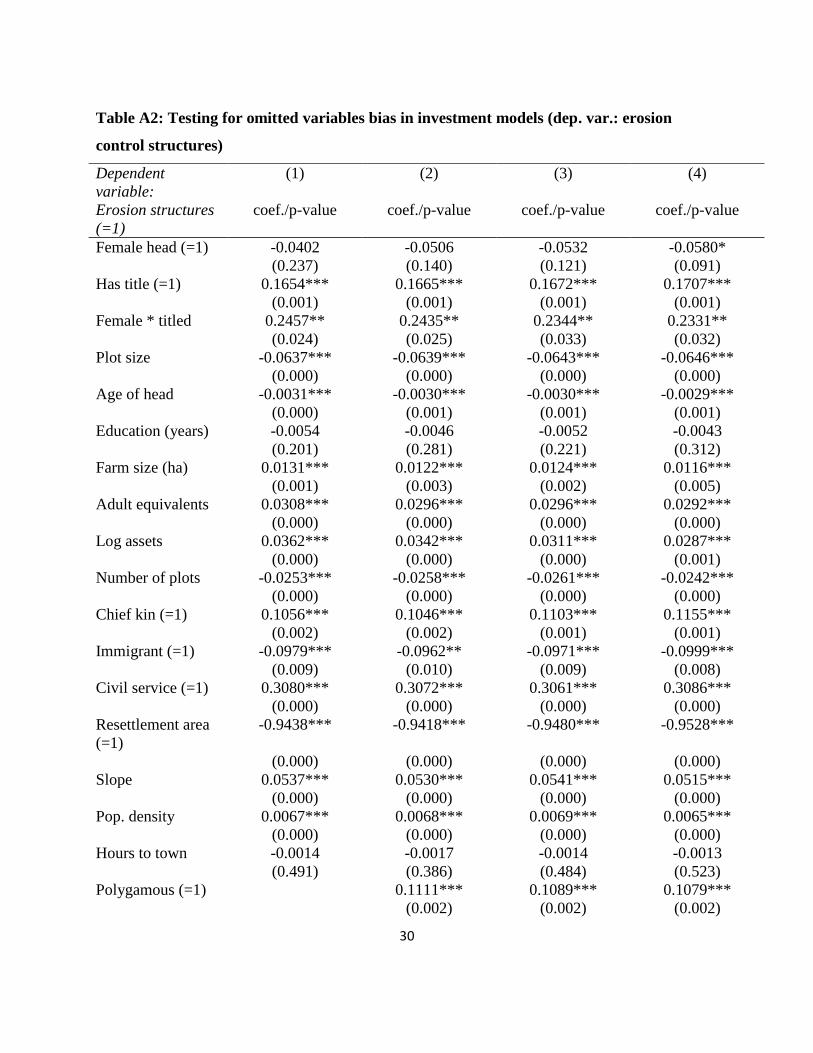
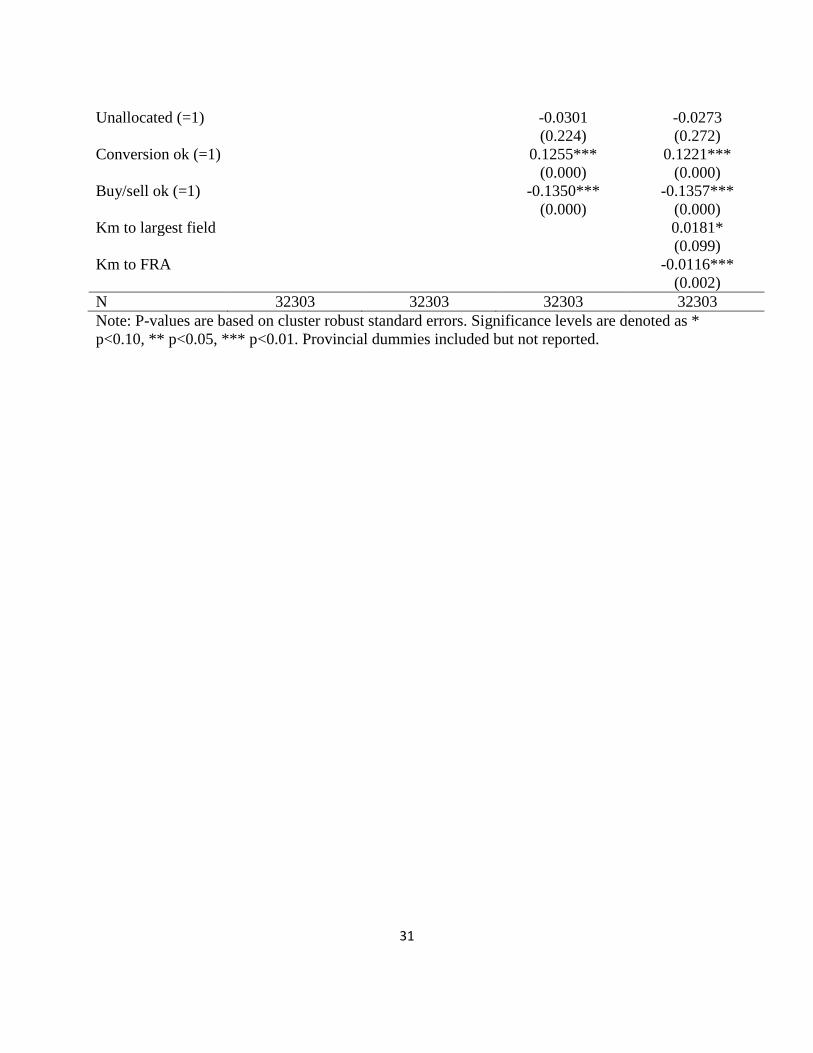
Table A2: Testing for omitted variables bias in investment models (dep. var.: erosion
control structures)
Dependent
variable:
(1) (2) (3) (4)
Erosion structures
(=1)
coef./p-value coef./p-value coef./p-value coef./p-value
Female head (=1) -0.0402 -0.0506 -0.0532 -0.0580*
(0.237) (0.140) (0.121) (0.091)
Has title (=1) 0.1654*** 0.1665*** 0.1672*** 0.1707***
(0.001) (0.001) (0.001) (0.001)
Female * titled 0.2457** 0.2435** 0.2344** 0.2331**
(0.024) (0.025) (0.033) (0.032)
Plot size -0.0637*** -0.0639*** -0.0643*** -0.0646***
(0.000) (0.000) (0.000) (0.000)
Age of head -0.0031*** -0.0030*** -0.0030*** -0.0029***
(0.000) (0.001) (0.001) (0.001)
Education (years) -0.0054 -0.0046 -0.0052 -0.0043
(0.201) (0.281) (0.221) (0.312)
Farm size (ha) 0.0131*** 0.0122*** 0.0124*** 0.0116***
(0.001) (0.003) (0.002) (0.005)
Adult equivalents 0.0308*** 0.0296*** 0.0296*** 0.0292***
(0.000) (0.000) (0.000) (0.000)
Log assets 0.0362*** 0.0342*** 0.0311*** 0.0287***
(0.000) (0.000) (0.000) (0.001)
Number of plots -0.0253*** -0.0258*** -0.0261*** -0.0242***
(0.000) (0.000) (0.000) (0.000)
Chief kin (=1) 0.1056*** 0.1046*** 0.1103*** 0.1155***
(0.002) (0.002) (0.001) (0.001)
Immigrant (=1) -0.0979*** -0.0962** -0.0971*** -0.0999***
(0.009) (0.010) (0.009) (0.008)
Civil service (=1) 0.3080*** 0.3072*** 0.3061*** 0.3086***
(0.000) (0.000) (0.000) (0.000)
Resettlement area
(=1)
-0.9438*** -0.9418*** -0.9480*** -0.9528***
(0.000) (0.000) (0.000) (0.000)
Slope 0.0537*** 0.0530*** 0.0541*** 0.0515***
(0.000) (0.000) (0.000) (0.000)
Pop. density 0.0067*** 0.0068*** 0.0069*** 0.0065***
(0.000) (0.000) (0.000) (0.000)
Hours to town -0.0014 -0.0017 -0.0014 -0.0013
(0.491) (0.386) (0.484) (0.523)
Polygamous (=1) 0.1111*** 0.1089*** 0.1079***
(0.002) (0.002) (0.002)
31
Unallocated (=1) -0.0301 -0.0273
(0.224) (0.272)
Conversion ok (=1) 0.1255*** 0.1221***
(0.000) (0.000)
Buy/sell ok (=1) -0.1350*** -0.1357***
(0.000) (0.000)
Km to largest field 0.0181*
(0.099)
Km to FRA -0.0116***
(0.002)
N 32303 32303 32303 32303
Note: P-values are based on cluster robust standard errors. Significance levels are denoted as *
p<0.10, ** p<0.05, *** p<0.01. Provincial dummies included but not reported.
32
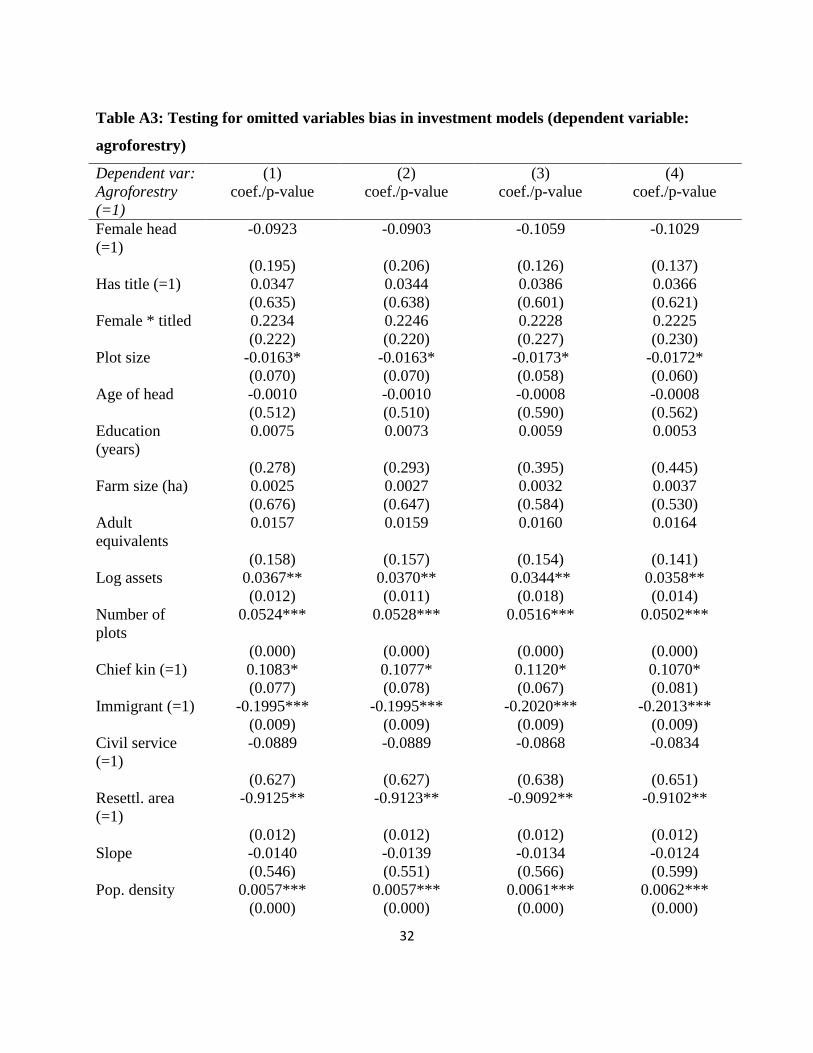
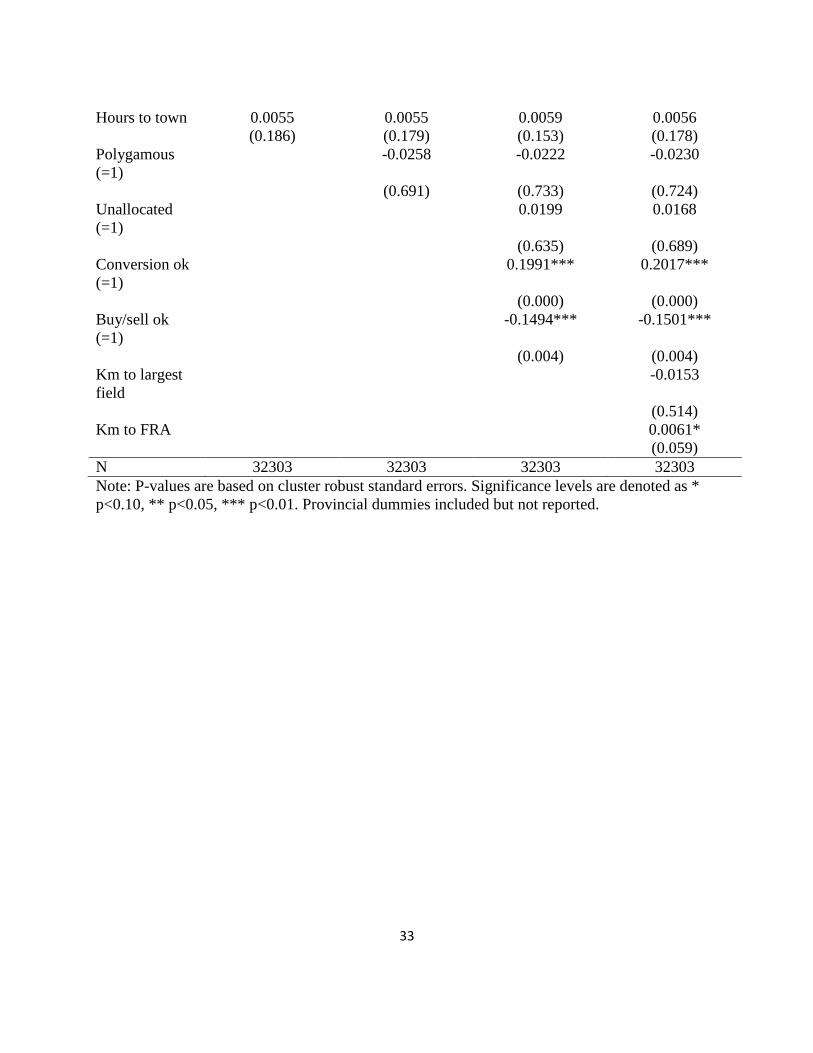
Table A3: Testing for omitted variables bias in investment models (dependent variable:
agroforestry)
Dependent var: (1) (2) (3) (4)
Agroforestry
(=1)
coef./p-value coef./p-value coef./p-value coef./p-value
Female head
(=1)
-0.0923 -0.0903 -0.1059 -0.1029
(0.195) (0.206) (0.126) (0.137)
Has title (=1) 0.0347 0.0344 0.0386 0.0366
(0.635) (0.638) (0.601) (0.621)
Female * titled 0.2234 0.2246 0.2228 0.2225
(0.222) (0.220) (0.227) (0.230)
Plot size -0.0163* -0.0163* -0.0173* -0.0172*
(0.070) (0.070) (0.058) (0.060)
Age of head -0.0010 -0.0010 -0.0008 -0.0008
(0.512) (0.510) (0.590) (0.562)
Education
(years)
0.0075 0.0073 0.0059 0.0053
(0.278) (0.293) (0.395) (0.445)
Farm size (ha) 0.0025 0.0027 0.0032 0.0037
(0.676) (0.647) (0.584) (0.530)
Adult
equivalents
0.0157 0.0159 0.0160 0.0164
(0.158) (0.157) (0.154) (0.141)
Log assets 0.0367** 0.0370** 0.0344** 0.0358**
(0.012) (0.011) (0.018) (0.014)
Number of
plots
0.0524*** 0.0528*** 0.0516*** 0.0502***
(0.000) (0.000) (0.000) (0.000)
Chief kin (=1) 0.1083* 0.1077* 0.1120* 0.1070*
(0.077) (0.078) (0.067) (0.081)
Immigrant (=1) -0.1995*** -0.1995*** -0.2020*** -0.2013***
(0.009) (0.009) (0.009) (0.009)
Civil service
(=1)
-0.0889 -0.0889 -0.0868 -0.0834
(0.627) (0.627) (0.638) (0.651)
Resettl. area
(=1)
-0.9125** -0.9123** -0.9092** -0.9102**
(0.012) (0.012) (0.012) (0.012)
Slope -0.0140 -0.0139 -0.0134 -0.0124
(0.546) (0.551) (0.566) (0.599)
Pop. density 0.0057*** 0.0057*** 0.0061*** 0.0062***
(0.000) (0.000) (0.000) (0.000)
33
Hours to town 0.0055 0.0055 0.0059 0.0056
(0.186) (0.179) (0.153) (0.178)
Polygamous
(=1)
-0.0258 -0.0222 -0.0230
(0.691) (0.733) (0.724)
Unallocated
(=1)
0.0199 0.0168
(0.635) (0.689)
Conversion ok
(=1)
0.1991*** 0.2017***
(0.000) (0.000)
Buy/sell ok
(=1)
-0.1494*** -0.1501***
(0.004) (0.004)
Km to largest
field
-0.0153
(0.514)
Km to FRA 0.0061*
(0.059)
N 32303 32303 32303 32303
Note: P-values are based on cluster robust standard errors. Significance levels are denoted as *
p<0.10, ** p<0.05, *** p<0.01. Provincial dummies included but not reported.
34
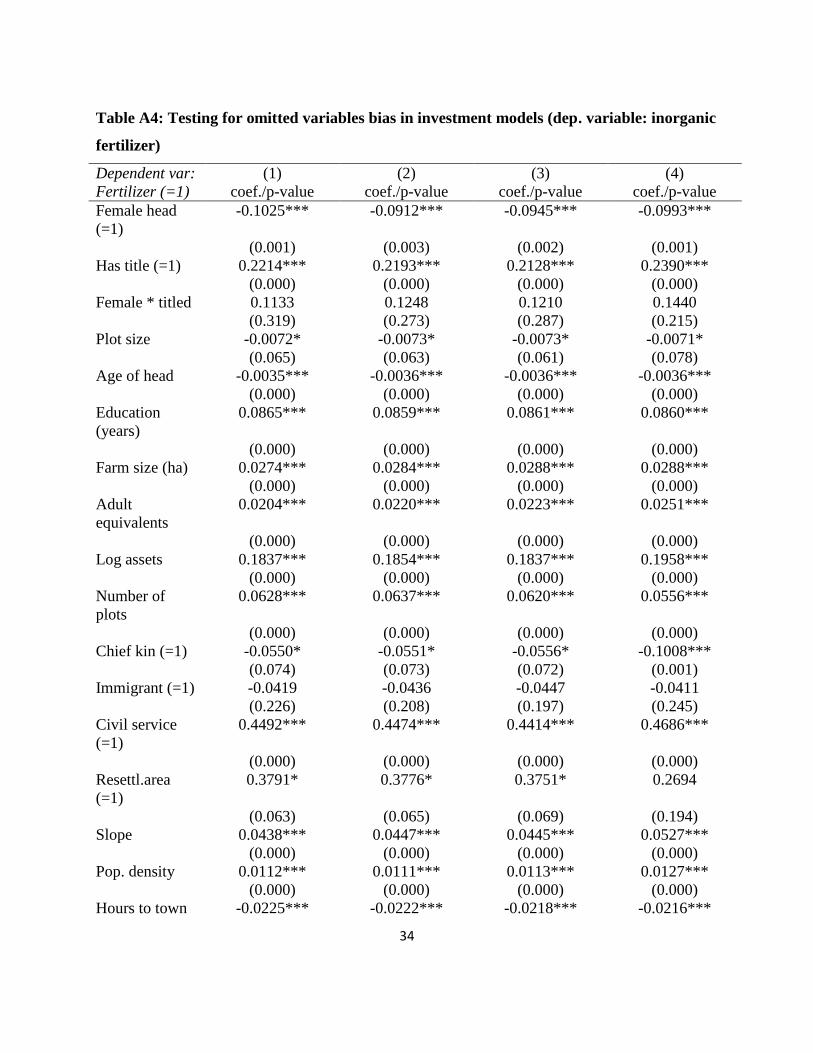
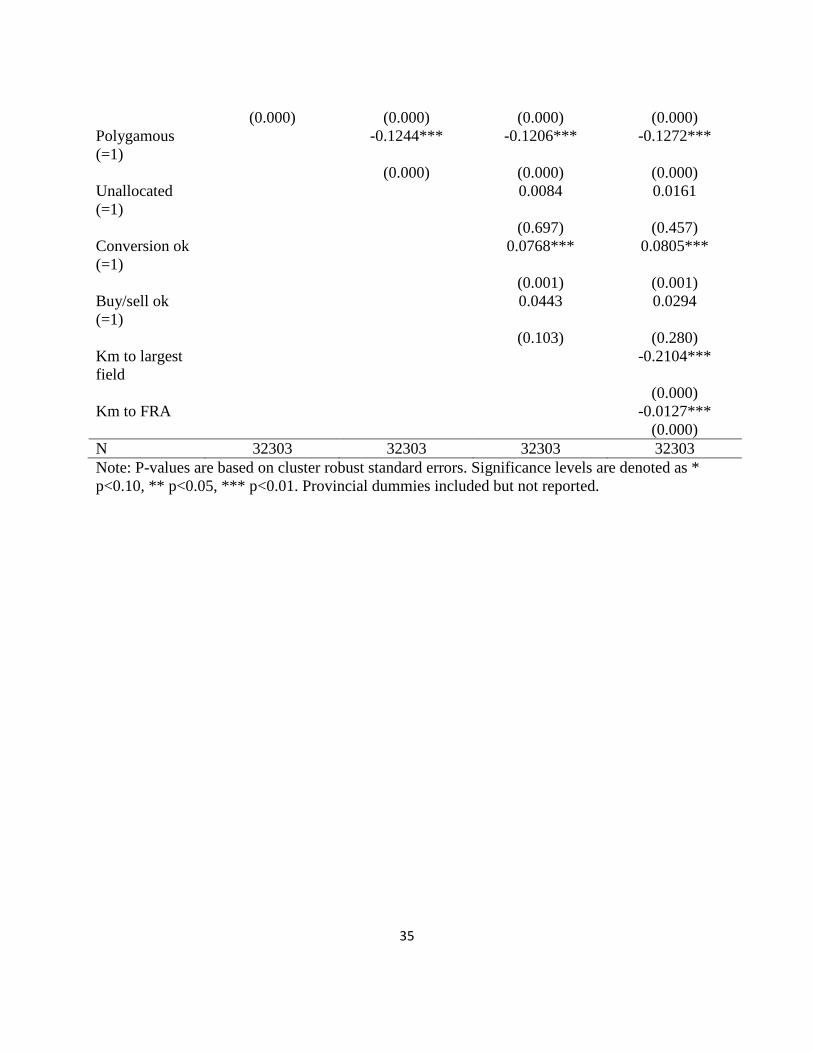
Table A4: Testing for omitted variables bias in investment models (dep. variable: inorganic
fertilizer)
Dependent var: (1) (2) (3) (4)
Fertilizer (=1) coef./p-value coef./p-value coef./p-value coef./p-value
Female head
(=1)
-0.1025*** -0.0912*** -0.0945*** -0.0993***
(0.001) (0.003) (0.002) (0.001)
Has title (=1) 0.2214*** 0.2193*** 0.2128*** 0.2390***
(0.000) (0.000) (0.000) (0.000)
Female * titled 0.1133 0.1248 0.1210 0.1440
(0.319) (0.273) (0.287) (0.215)
Plot size -0.0072* -0.0073* -0.0073* -0.0071*
(0.065) (0.063) (0.061) (0.078)
Age of head -0.0035*** -0.0036*** -0.0036*** -0.0036***
(0.000) (0.000) (0.000) (0.000)
Education
(years)
0.0865*** 0.0859*** 0.0861*** 0.0860***
(0.000) (0.000) (0.000) (0.000)
Farm size (ha) 0.0274*** 0.0284*** 0.0288*** 0.0288***
(0.000) (0.000) (0.000) (0.000)
Adult
equivalents
0.0204*** 0.0220*** 0.0223*** 0.0251***
(0.000) (0.000) (0.000) (0.000)
Log assets 0.1837*** 0.1854*** 0.1837*** 0.1958***
(0.000) (0.000) (0.000) (0.000)
Number of
plots
0.0628*** 0.0637*** 0.0620*** 0.0556***
(0.000) (0.000) (0.000) (0.000)
Chief kin (=1) -0.0550* -0.0551* -0.0556* -0.1008***
(0.074) (0.073) (0.072) (0.001)
Immigrant (=1) -0.0419 -0.0436 -0.0447 -0.0411
(0.226) (0.208) (0.197) (0.245)
Civil service
(=1)
0.4492*** 0.4474*** 0.4414*** 0.4686***
(0.000) (0.000) (0.000) (0.000)
Resettl.area
(=1)
0.3791* 0.3776* 0.3751* 0.2694
(0.063) (0.065) (0.069) (0.194)
Slope 0.0438*** 0.0447*** 0.0445*** 0.0527***
(0.000) (0.000) (0.000) (0.000)
Pop. density 0.0112*** 0.0111*** 0.0113*** 0.0127***
(0.000) (0.000) (0.000) (0.000)
Hours to town -0.0225*** -0.0222*** -0.0218*** -0.0216***
35
(0.000) (0.000) (0.000) (0.000)
Polygamous
(=1)
-0.1244*** -0.1206*** -0.1272***
(0.000) (0.000) (0.000)
Unallocated
(=1)
0.0084 0.0161
(0.697) (0.457)
Conversion ok
(=1)
0.0768*** 0.0805***
(0.001) (0.001)
Buy/sell ok
(=1)
0.0443 0.0294
(0.103) (0.280)
Km to largest
field
-0.2104***
(0.000)
Km to FRA -0.0127***
(0.000)
N 32303 32303 32303 32303
Note: P-values are based on cluster robust standard errors. Significance levels are denoted as *
p<0.10, ** p<0.05, *** p<0.01. Provincial dummies included but not reported.