Socially Inclusive and Gender Responsive Budgeting Survey ...
Gender Responsive Budgeting and Fiscal Decentralisation in India: A Preliminary
Appraisal
Lekha S. Chakraborty

3
Gender Responsive Budgeting and Fiscal Decentralisation in India: A Preliminary
Appraisal
Lekha S. Chakraborty ∗ Introduction
Theoretically fiscal decentralisation is good for efficiency and equity in the economy based on the rationale that local governments, which are closer to citizens, are more efficient in the provisioning of public services than the higher levels of government. This rationale holds good in terms of gender development as local governments have better information on gender differentials regarding needs and preferences. Despite the growing recognition of fiscal decentralisation in gender development in the policy realm, in particular, attempts on fiscally decentralised gender budgeting; there have been relatively few empirical analyses on the topic.1 This paper aims to take on this rare gamut of literature, focused on the nascent experiences on fiscal decentralisation and local level gender
∗ The author is Senior Economist at National Institute of Public Finance and Policy, New Delhi, India (email: [email protected]). This paper is a part of UNIFEM-European Commission study carried out for selected countries by the author with M Govinda Rao and Amaresh Bagchi at the National Institute of Public Finance and Policy. Special thanks are due to M Govinda Rao and Amaresh Bagchi for the valuable discussions at various stages of the paper. The author is also grateful to anonymous referee and Pinaki Chakraborty for their helpful comments. The author had benefited from the discussions with T M Thomas Isaac, Swapna Mukhopadhyay, Nirmala Banerjee, Devaki Jain, Firoza Mehrotra, Benita Sharma and other participants from India during the International Expert Group Meeting on ‘Local Level Gender Responsive Budgeting’ organised by NIPFP in association with UNIFEM, European Commission and IDRC in India International Centre, New Delhi, November 1-4, 2004. The author is also grateful to Darshy Sinha and Samik Chowdhury for diligent research assistance and Kavita Issar for formatting the draft. Special thanks are due to Rita Pandey for facilitating the review process of the paper and Rita Wadhwa for editing the paper. The usual disclaimer applies.
4
responsive budgeting in India. It is particularly relevant in the context that India is the first country to institutionalise gender budgeting within Ministry of Finance, adhering to the budgetary accounting framework, and analyse the possibilities of changes in the budgetary classification to integrate gender budgeting in the mainstream budgets.
In India, with the 73r d and 74 th Constitutional Amendments in 1992, the third tier of government comprising the Panchayati Raj Institutions PRIs and urban local bodies are given constitutional recognition as local self governments . While creating an enabling environment for the devolution of finance and functions to the third tier and reserving one third of the members of the local bodies for women, initiative for decentralised gender responsive public policy initiative has been gaining momentum in India.
In India, the new found policy space of feminisation of local governance coupled with fiscal devolution to the third tier may provide an impetus to adopt gender lens more effectively in formulating budgets; reasons are mainly twofold. Firstly, greater fiscal autonomy with effective participation of women in governance at lower levels can make variations in the public expenditure decisions corresponding more to the revealed preferences (‘voice’) of women. Secondly, it helps to identify spatial gender needs, ex-ante to budgeting; which is a step ahead from homogeneous ‘one-size-fits-all’ gender budgeting policies. This paper examines the local level gender budgeting experiences in India, confining to three states where fiscal decentralisation has been comparatively more effective, viz., Kerala, Karnataka, and West Bengal.
Among the three states, Kerala is relatively better in terms
of fiscal autonomy at the third tier. Theoretically the reversed sequence of fiscal decentralisation in Kerala—financial devolution preceded functional devolution—may reduce the issues related to unfunded mandates. It is also to be noted that among the three states, within government initiative to integrate gender in the process of fiscal decentralisation has been manifested only in Kerala.2 Before delving into local level experiences on gender budgeting in three states, an attempt to analyse the intergovernmental fiscal system in India through a gender lens is also undertaken in the paper, especially in a situation where local governments depend heavily on fiscal transfers.
The rest of the paper is organised as follows. Section 2
provides a briefing to the existing policy initiatives on gender
5
budgeting in India, assessing the plausible windows for fiscally decentralised gender budgeting. Section 3 critically reviews the process of fiscal decentralisation through a gender lens at the aggregate level. Sections 4, 5 and 6 respectively take up locallevel gender budgeting experiences in the three States, viz., Kerala, Karnataka and West Bengal. Section 7 concludes.
II. Initiatives on Gender Budgeting in India
The idea of introducing gender budgeting in India gathered momentum with the study done by Lahiri, Chakraborty and Bhattacharyya (2003) of National Institute of Public Finance and Policy (hereafter, referred as NIPFP study).3 To provide the analytical framework for gender budgeting, NIPFP study constructed an econometric model to link spending on public education and health to the Gender Development Index (GDI), showing the positive effect of such spending on this indicator of gender inequality. This approach does not refute the widely explored link between economic growth and the (gender sensitive) human development, rather to emphasise that it does substantially through higher public expenditure, particularly through health care and education (Chakraborty, 2005b).
Given the limited scope of trickledown effects of economic growth-promoting strategies, the role of fiscal policy stance in gender sensitive human development proceeds from market failures of one kind or another. Fiscal policy stance, is a key policy instrument to ensure human development and in particular gender development, which rest on the fact that the functioning of the market cannot, by itself, activate the signaling, response and mobility of economic agents to achieve efficiency in both static (allocative efficiency) and dynamic (shift in the production frontier) terms. This is all the more relevant at the subnational levels of fiscal policy stance, where as the provisioning of merit goods like education and health are vested with. The rubric of gender budgeting owes its roots to these analytics.
What manifests gender budgeting in India? It is important to recall in this context that gender budgeting is a step ahead from Women’s Component Plan, the strategy adopted by the National Development Council , one of the highest policy making bodies in the country, for achieving the specific objective of the Ninth Five Year Plan (1997-2002) the empowerment of women. “Women’s Component Plan” (WCP) is confined to only the plan expenditure of
6
the Government and is thus partial. However, WCP is designed to ensure that not less than 30 percent of funds and benefits flow to women from the developmental sectors.
Accepting that earmarking money for women through WCP is only a second best principle of gender budgeting , NIPFP study has attempted an analysis of whole budgetary process through a gender lens.4 WCP would have been more effective, had there been a differential targeting of expenditure emanating from the identification of appropriate programmes for women in various sectors. In other words, reprioritising the expenditure based on a generic list of appropriate programmes and policies for women might be more effective rather than adhoc targeting of 30 percent across sectors.
The major debate in India on gender budgeting in the initial phase went much beyond the mechanics of adopting homogenous 30 percent WCP to the very rationale of conducting gender budgeting itself. The gender diagnosis analysis carried out by NIPFP justified the need for conducting gender budgeting based on the empirical evidence that as women and men are at the asymmetric levels of socio-economic development in India, the existing gender neutrality of budgets can lead to many unintentional negative consequences, translating the gender neutrality of budgets into gender blindness. The study provides some selected indicators of the status of women in India, showing the degree of disadvantage especially in health, education and work participation. The study also evaluated the existing degree of gender inequality in India, presenting an interesting application of HDI, GDI and GEM5 (Stotsky, 2006).
The NIPFP study also expostulated that integrating gender perspective into budgetary policy has dual dimensions of equality and efficiency. From the efficiency consideration, what is important is the social rate of return of investment in women, and in cases, this can be greater than the corresponding rate for men. The study highlighted that gender inequality is inefficient and costly to development.6 Through these discussions, NIPFP study was rooting its rationale for gender budgeting in externalities, a notion which encompasses equity as well as efficiency considerations. Gender budgeting intrinsically recognises these dual dimensions; and assumes that fiscal policy stance can be used to internalise the externalities through various policy instruments including taxation, subsidies and public expenditure.
While discussing the externalities through a gender lens, an important point needs to be highlighted is the labour force exogeneity in the treatment of the care economy in the prevalent macroeconomic
7
policymaking, which is dubious. The intra-household gender asymmetries in the intensity and allocation of time and the choices regarding labour force participation in care economy have always been invisible in the macropolicies. Recognising that the dynamic interaction between the dual sets of economic activity – that is, the statistically invisible care economy and that of market economy – which marks the microfoundations of engendering macroeconomic policies, the NIPFP study applies global substitution criteria of price variables to the time use budgets to value the care economy across selected states in India [within the framework of extended production boundary of Systems of National Accounts (SNA) 1993] and in turn integrate in the macropolicies. Realising that the allocation and efficiency of time we spent in care economy might be more important to economic welfare than market economy through its positive externalities, the study has recommended to integrate the inferences from time-use budgets in gender budgeting. The point to be noted here is that the gender budgeting policies related to care economy would be more effective at the decentralised levels of government through social multiplier effects.
The methodology adopted by NIPFP for gender budgeting received wide attention due to its simplicity and practicability in conducting gender budgeting within the country and between countries.7 Stotsky (2006) noted that it represents an interesting effort at focusing on the gender-differentiated effects of budgetary spending and although the linkages of such spending to gender disparity measures and economic growth and welfare are only treated in brief, it provides a framework for such analyses to support sensible budget making. Within the analytical framework of gender budgeting, a few matrices have been developed by NIPFP to categorise the financial inputs from gender perspective. These analytical matrices for categorising public expenditure through a gender lens were as follows: (i) specifically targeted expenditure to women and girls, (ii) pro-women allocations; which are the composite expenditure schemes with a significant women’s component (that is, a scale of 30 <= E < 100; at least 30 percent targeted for women) and (iii) residual public expenditures that have gender -differential impacts (that is, a scale 0 <= E < 30). These three analytical matrices neatly fit into the existing programme budgeting framework in India. These matrices hold good even with the transition of existing accounting system to International Monetary Fund’s Government Finance Statistics, where government budgets are broken down into functional and economic categorisations. This is possible through organising the budgetary data either by examining gender-disaggregated public expenditure, Benefit Incidence Analysis (BIA),

8
or by segregation of gender specific allocations in the budget and accounts by introducing a new budget head of account for distinctly identifying the gender allocations at submajor head level in the budget documents for the second and third categories of public expenditure. Gender-disaggregated public expenditure BIA involves the measurement of unit cost of providing a particular service and the number of units utilised by gender. The paucity of gender-disaggregated data on services utilised constrains such benefit incidence analysis for a variety of public services. Furthermore, theoretically, all public goods and services cannot be gender-partitioned.
Critiquing NIPFP methodology of categorising public expenditure, Banerjee (2003) proposed yet another way of classifying expenditure; viz., (i) relief policies, targeted to specific groups of women in distress (e.g. widows); (ii) gender-reinforcing assistance, which provides for women’s ‘needs in accepted gender roles’ (e.g. programmes that address women’s reproductive functions); (iii) equality-promoting schemes, ‘which are meant specifically to remove some gender-based handicap of women’, including schemes such as crèches to allow women to work and extra toilets for girls in schools. Banerjee (2003) argued that this classification is helpful to categorise the short run and long run policy needs for women (that first two categories of programme help meet women’s immediate needs, but for long run, the third type of programme is essential). But the point to be noted here is that this classification does not fit into any formal budget accounting framework and hence it would be difficult to compare meaningfully different government budgets using this classification. Yet another limitation is that it confounds the reclassification of budget to a great extent due to the subjectivity involved in the treatment of what constitutes gender -reinforcing assistance and gender equality-promoting schemes in the budget. This classification therefore has not been used in India at the national and subnational levels for conducting gender budgeting.8
The policy series of ex-post gender budgeting analysis based on NIPFP methodology was revealing.9 Higher budgetary allocation for women per se does not translate itself into higher spending, as there has been significant deviation between budget estimates and actuals . It is important to note in this context that gender sensitive analysis of budgets begins with categorising expenditure, but it does not stop there. The NIPFP study recognises that the categorisation has to be followed by a number of exercises that examine what ‘use’ has been made of expenditures and what ‘impa ct’ this has had (that is, from the financial inputs to the gendered outputs and impacts).
9
Thus linking gender budgets to outcome budgets and performance budgeting are equally important. Expenditure tracking surveys are also required to analyse the implementation aspects of these programmes and also to analyse the leakages in the financial allocation, if any.
What budgetary reforms are therefore required for gender sensitive public policy? The policy solutions suggested by NIPFP study are mainly twofold. First, to ensure transparency in the allocation for women through adequate changes in budgetary classification to protect these provisions from reappropriation and thereby enhance accountability. Second, with the advent of fiscal decentralisation, strengthen the gender-sensitive budgeting at the sub-national government levels as provisioning of merit goods like, education and health, are primarily the responsibility of subnational governments.
The first policy solution is addressed by the Ministry of Finance (MoF), Government of India through the setting up of an expert group on "Classification of Government Transactions” in 2004,10 one of the TORs of which was institutionalising gender responsive budgeting process at the national level.
Based on the recommendations of the Expert Group, gender budgeting has been institutionalised in India through the Ministry of Finance since 2005-06. Against the backdrop of the recommendations by the Expert Group, the Finance Minister has introduced a statement on Gender Budgeting in Union Budget 2005-06, covering 10 demands for grants highlighting the gender sensitivities of budgetary allocations.11 In one year’s time, the Finance Minister has been able to enlarge the statement to include 24 demands for grants with an outl ay of Rs.28, 737 crore. Prima facie, Rs 28,737 crore appears as an Unpleasant Gender Arithmetic, as it constitutes only 5 percent of the total budget. But this aggregate figure reveals only a partial picture and the critical appraisal of this maiden attempt is beyond the scope of this paper.12
The second policy solution of strengthening gender budgeting at the decentralised levels threw mixed results. The NIPFP methodology for gender budgeting has been accepted by the Government of India to carry over this exercise to state-level. DWCD has co-ordinated these studies through NIPCCD and the analyses of these studies have been included as a separate chapter in the Annual Report of DWCD, since 2001. In addition to these exercises, several states announced introduction of gender budgeting in their
10
state budgets; which include Rajasthan and Madhya Pradesh. At the local level, only the Government of Kerala has taken the initiative to integrate gender budgeting, which will be taken up in this paper. Though within government initiatives are absent, the paper also analyses the existing civil society initiatives of local level gender budgeting in Karnataka and West Bengal. The local -level experiences of gender budgeting in these three states will be dealt with, after an overall discussion of intergovernmental fiscal system in a three-tier set up in India through a gender lens.
III. Fiscal Decentralisation in India Through a Gender Lens
India is the largest democratic federal polity in the world. Out of over a quarter million local governments, only around 3000 are in the urban areas. Structurally, decentralisation in India would seem to have been carried to the smallest unit of habitation viz . villages; but their resources and functions are limited. While substantial resources are raised or are devolved further to the second level, viz. the states, the third tier suffer acutely from inadequacy of resources.
3.1 Asymmetry in Revenue and Expenditure Assignment
Although the constitutional amendments provide an illustrative list of functions that are considered appropriate for local governments, they remain largely unfunded mandates. The amendments also made it mandatory to appoint State Finance Commission once in every five years to make recommendations regarding the fiscal transfers from the state to the local bodies. But progress in terms of functions and finance to local bodies has been tardy.
The degree of decentralisation in any country is difficult to
quantify. Fiscal decentralisation can broadly be captured by the share of sub-national expenditure in total expenditure and local government expenditure as percentage of GDP of the country. However, these indices do not capture the governance structure to understand the degree of power in terms of decision-making vested at the local government over expenditure functions.13 Lack of data on these components of governance structure limits the empirical analysis to a
11
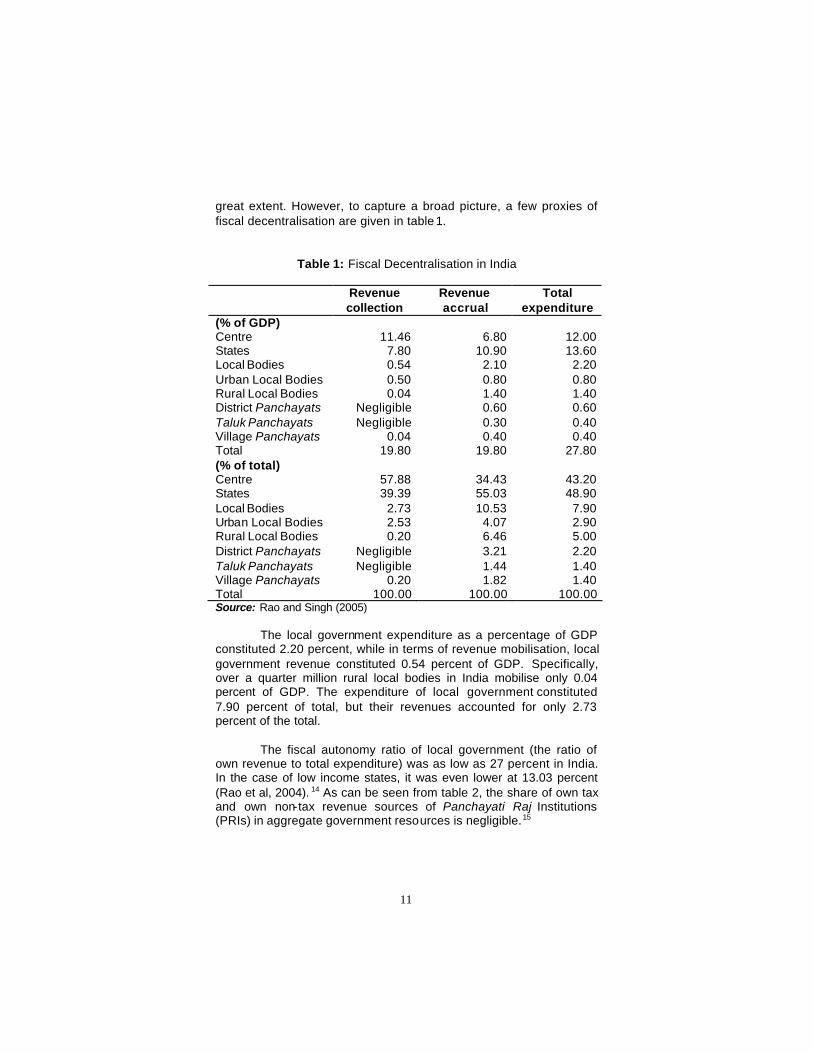
great extent. However, to capture a broad picture, a few proxies of fiscal decentralisation are given in table 1.
Table 1: Fiscal Decentralisation in India
Revenue collection
Revenue accrual
Total expenditure
(% of GDP) Centre 11.46 6.80 12.00 States 7.80 10.90 13.60 Local Bodies 0.54 2.10 2.20 Urban Local Bodies 0.50 0.80 0.80 Rural Local Bodies 0.04 1.40 1.40 District Panchayats Negligible 0.60 0.60 Taluk Panchayats Negligible 0.30 0.40 Village Panchayats 0.04 0.40 0.40 Total 19.80 19.80 27.80 (% of total) Centre 57.88 34.43 43.20 States 39.39 55.03 48.90 Local Bodies 2.73 10.53 7.90 Urban Local Bodies 2.53 4.07 2.90 Rural Local Bodies 0.20 6.46 5.00 District Panchayats Negligible 3.21 2.20 Taluk Panchayats Negligible 1.44 1.40 Village Panchayats 0.20 1.82 1.40 Total 100.00 100.00 100.00 Source: Rao and Singh (2005)
The local government expenditure as a percentage of GDP constituted 2.20 percent, while in terms of revenue mobilisation, local government revenue constituted 0.54 percent of GDP. Specifically, over a quarter million rural local bodies in India mobilise only 0.04 percent of GDP. The expenditure of local government constituted 7.90 percent of total, but their revenues accounted for only 2.73 percent of the total.
The fiscal autonomy ratio of local government (the ratio of own revenue to total expenditure) was as low as 27 percent in India. In the case of low income states, it was even lower at 13.03 percent (Rao et al, 2004). 14 As can be seen from table 2, the share of own tax and own non-tax revenue sources of Panchayati Raj Institutions (PRIs) in aggregate government resources is negligible.15
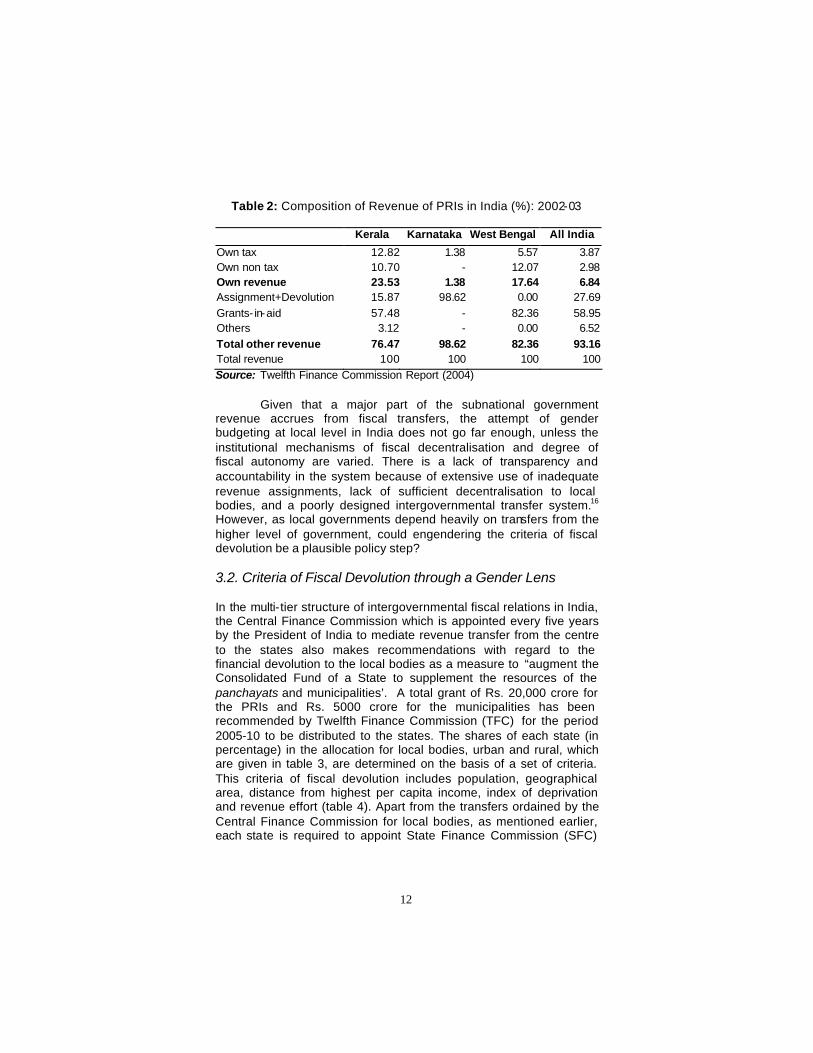
12
Table 2: Composition of Revenue of PRIs in India (%): 2002-03
Kerala Karnataka West Bengal All India
Own tax 12.82 1.38 5.57 3.87 Own non tax 10.70 - 12.07 2.98 Own revenue 23.53 1.38 17.64 6.84 Assignment+Devolution 15.87 98.62 0.00 27.69 Grants- in-aid 57.48 - 82.36 58.95 Others 3.12 - 0.00 6.52 Total other revenue 76.47 98.62 82.36 93.16 Total revenue 100 100 100 100 Source: Twelfth Finance Commission Report (2004)
Given that a major part of the subnational government revenue accrues from fiscal transfers, the attempt of gender budgeting at local level in India does not go far enough, unless the institutional mechanisms of fiscal decentralisation and degree of fiscal autonomy are varied. There is a lack of transparency and accountability in the system because of extensive use of inadequate revenue assignments, lack of sufficient decentralisation to local bodies, and a poorly designed intergovernmental transfer system.16 However, as local governments depend heavily on transfers from the higher level of government, could engendering the criteria of fiscal devolution be a plausible policy step? 3.2. Criteria of Fiscal Devolution through a Gender Lens In the multi-tier structure of intergovernmental fiscal relations in India, the Central Finance Commission which is appointed every five years by the President of India to mediate revenue transfer from the centre to the states also makes recommendations with regard to the financial devolution to the local bodies as a measure to “augment the Consolidated Fund of a State to supplement the resources of the panchayats and municipalities’. A total grant of Rs. 20,000 crore for the PRIs and Rs. 5000 crore for the municipalities has been recommended by Twelfth Finance Commission (TFC) for the period 2005-10 to be distributed to the states. The shares of each state (in percentage) in the allocation for local bodies, urban and rural, which are given in table 3, are determined on the basis of a set of criteria. This criteria of fiscal devolution includes population, geographical area, distance from highest per capita income, index of deprivation and revenue effort (table 4). Apart from the transfers ordained by the Central Finance Commission for local bodies, as mentioned earlier, each state is required to appoint State Finance Commission (SFC)
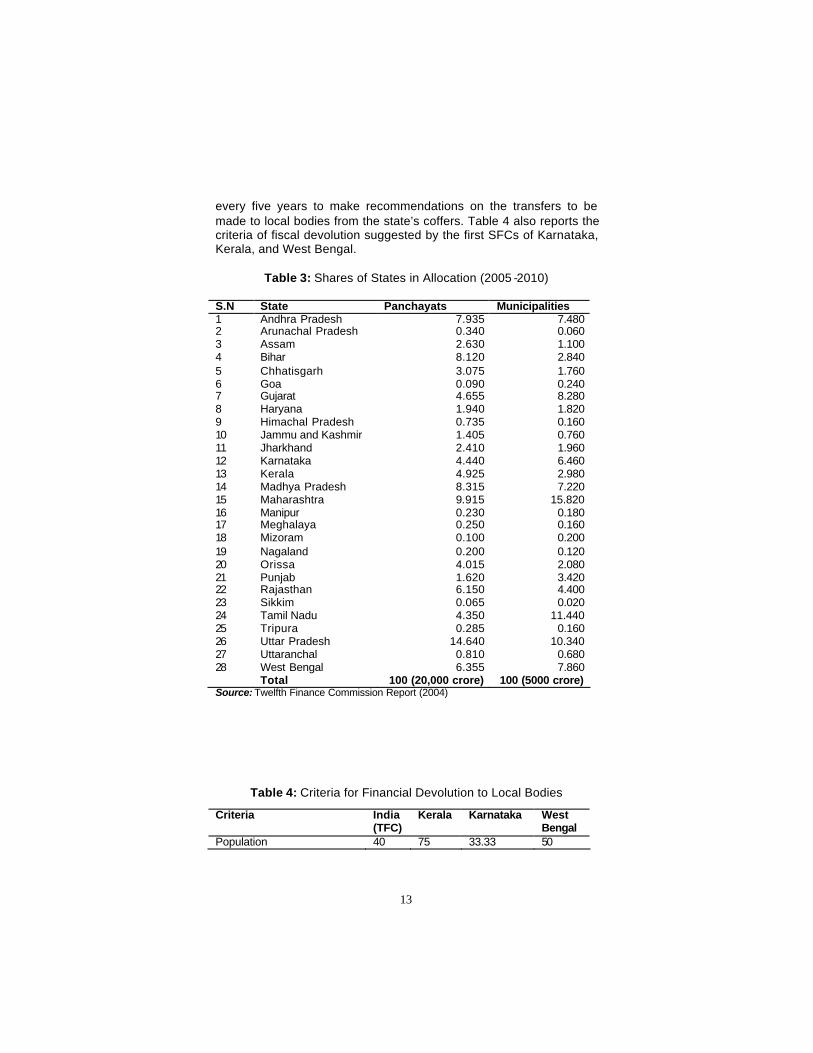
13
every five years to make recommendations on the transfers to be made to local bodies from the state’s coffers. Table 4 also reports the criteria of fiscal devolution suggested by the first SFCs of Karnataka, Kerala, and West Bengal.
Table 3: Shares of States in Allocation (2005 -2010)
S.N State Panchayats Municipalities 1 Andhra Pradesh 7.935 7.480 2 Arunachal Pradesh 0.340 0.060 3 Assam 2.630 1.100 4 Bihar 8.120 2.840 5 Chhatisgarh 3.075 1.760 6 Goa 0.090 0.240 7 Gujarat 4.655 8.280 8 Haryana 1.940 1.820 9 Himachal Pradesh 0.735 0.160 10 Jammu and Kashmir 1.405 0.760 11 Jharkhand 2.410 1.960 12 Karnataka 4.440 6.460 13 Kerala 4.925 2.980 14 Madhya Pradesh 8.315 7.220 15 Maharashtra 9.915 15.820 16 Manipur 0.230 0.180 17 Meghalaya 0.250 0.160 18 Mizoram 0.100 0.200 19 Nagaland 0.200 0.120 20 Orissa 4.015 2.080 21 Punjab 1.620 3.420 22 Rajasthan 6.150 4.400 23 Sikkim 0.065 0.020 24 Tamil Nadu 4.350 11.440 25 Tripura 0.285 0.160 26 Uttar Pradesh 14.640 10.340 27 Uttaranchal 0.810 0.680 28 West Bengal 6.355 7.860 Total 100 (20,000 crore) 100 (5000 crore) Source: Twelfth Finance Commission Report (2004)
Table 4: Criteria for Financial Devolution to Local Bodies
Criteria India (TFC)
Kerala Karnataka West Bengal
Population 40 75 33.33 50

14
Geographical area 10 33.33 10 Distance from highest per capita income
20
Index of deprivation 1 10 Population of backward Population or SC/ST
5
10
Rural population 10 Illiteracy rate 11.11 10 Persons per head in Government hospitals
11.11
Road length/sq. km 11.11 Inverse ratio of per capita bank deposit
10
Revenue effort, of which (a) With respect to own revenue of states (b) With respect to GSDP
20 10 10
Tax effort 5 Financial need 15 Total Weight 100 100 100 100 Note: 1 The index of deprivation (DI) has been designed as, DI = 0.5 X + 0.25 (Y+Z), where X= percentage of households fetching water from a distance Y= percentage of households without latrines Z= percentage of households without drainage Source: Twelfth Finance Commission Report (2004) and First SFC Reports of Kerala, Karnataka and West Bengal.
Among the criteria of fiscal devolution to the third tier, population turns out to be the predominant one. It is true that population criteria has an advantage of providing summary measure of the basic needs free from value judgement and arbitrariness, unlike other indicators. But heavy reliance on too broad a measure of need like population could be inconsistent with promoting fiscal equalisation or balanced development of regions within a state. Gulati (1987) pointed out that population as a basis of distribution ignores altogether the existence of income disparities among the states. As an alternative to that, he argued that distribution of resources on the basis of per capita income would be much more even and fiscally equalising.17 Significantly higher weightage to population by all the SFCs, instead of per capita income may increase the inter -panchayat disparities. Secondly, devolution on the basis of population may be regressive in the sense that it does not necessarily have the desired redistributive effects, since some relatively developed local bodies could be more populous. Karnata ka justifies relatively lower weightage to population on the grounds that in a situation of declining decadal growth of population in several
15
districts, higher weightage to it may reduce their share of plan funds. Instead of giving too much weightage to population, they have given equal weight to population and area, as large areas impose additional expenditure for providing the same level of public services.
Population criteria apart, all three SFCs have considered applying other indices of socio -economic backwardness for the horizontal distribution of resources. While selecting the criterion of backwardness, one has to be very careful so that it does not suffer from arbitrariness and excessive value judgement. The index of backwardness should reflect mor e expenditure need of a backward panchayat than that of a relatively developed panchayat. The indices used by three states, such as, the share of SC/ST population, illiteracy etc can certainly be considered to reflect the need for funds for social and economic upliftment but not necessarily of expenditure priorities of the local body, unless these priorities are built into financial allocation.
Yet another question arises is whether objective indicators of economic and social infrastructure could also be used for assessing the backwardness of a local body. TFC has incorporated indices of deprivation including percentage of households fetching water from a distance and percentage of households without sanitation. Public investment in infrastructure like water supply and sanitation can have positive social externalities in terms of educating the girl child and improving the health and nutritional aspects of the household. A World Bank study noted that easy accessibility to drinking water facilities might lead to an increase in school enrolment particularly girls; in Madagascar, 83 percent of the girls who did not go to school spent their time collecting water, while only 58 percent of the girls who attended school spent time collecting water.18 However, the major criticism against the use of social indicators as an index of backwardness is that it will be biased against the regions, which despite poor resource base, have achieved relatively high levels of attainment in these sectors.
Does fiscal equalisation transfers enhance gender equity? Though these transfers are not specifically targeted to the poor, the poor will benefit from the general capacity increase in the region, especially women. When unconditional transfers are made, equalisation transfers aim to neutralise deficiency in fiscal capacity but not that in revenue effort. Sometimes adjustments affecting cost and need factors may also be accommodated. In many ways, the Finance Commission formula-based fiscal transfers is not part of an equalisation grant system, but rather part of general or unconditional
16
funding, which might have equalisation grant features. Chakraborty, P. (2003) seeks to empirically investigate if the fiscal transfers in India follow the principles of fiscal equalisation. Econometric investigation using a panel data for 15 major states for the years 1990-91 to 1999-00 in a fixed effects model revealed a strikingly regressive element of transfers, with aggregate tax transfers per capita positively related to state per capita income. However, grants transfers negated this trend, showing clear progressivity though not sufficient to eliminate horizontal inequalities owing to smaller proportion of grants in the overall transfer in comparison to tax transfers. His results echo those of previ ous studies, reinforcing the oft-made observation that richer states are receiving more per capita fiscal transfers than poorer states.
Fiscal equalisation grants can correct for spatial inequalities in the provisioning of merit goods or quasi-public goods, which has evident gender differential impacts. Considering the acute spatial disparities in service standards in the provision of health and education, the TFC has tried to bring in the equalisation principle for certain specific grants for education and health on the expenditure side. Although equalisation should be pursued mostly, if not exclusively, by the equalisation grant system in order to free up other grant instruments to pursue other objectives, this is a temporary positive move given the present need for more equalisation in the system (Eunice Heredia-Ortíz and Mark Rider, 2006). It is also noted that after gaining experience in implementing these grants, larger grants and a more comprehensive approach can be developed for meeting the needs fully, which also requires supplementation by plan grants (Srivastava, 2006). Fiscal equalisation grants for health and education can redress the capability deprivation across gender.
The moot question at this juncture is whether gender criteria needs be incorporated in the unconditional fiscal transfers. One of the arguments against incorporating gender concerns in unconditional fiscal transfers is that these transfers are meant for offsetting the fiscal disabilities and it is desirable to keep the transfer system formula simple and without perverse incentives (Rao, 2006). However, in India, given the disturbing demographic facts of the precipitous decline in the sex ratio for children in 0-6 age group especially in some of the prosperous states of India 19, there can be no valid objection to using central transfers for this purpose. A simple method for this could be to introduce some weight for female population of the states in the tax devolution formula of the Finance Commission and the Gadgil formula for allocation of central assistance for state plans (Bagchi and Chakraborty, 2004). The
17
message would be even stronger and more appropriate if the population of girl children only, that is the number of females in the 0-6 age group, is adopted as the basis fo r determining the relative shares of the states in the amount carved out of the divisible pool by applying the allotted weight.20 A special dispensation for girls would also be justifiable in a scheme of need-based equalisation transfers.
While social mores cannot be changed by fiscal fiats, especially when prejudices run deep, state action is called for, when they are blatantly oppressive to any section of the community. Indeed such action is an imperative. The transfer system can and should play a role in upholding the right to life for the females of the country (Bagchi and Chakraborty, 2004). Having said that, it needs to be mentioned that it is not plausible to incorporate more gender variables in the formula and complicate the transfer-formula of central as well as State Finance Commissions.21 In other words, inclusion of a gender inequality index in the transfer formula may not result in the intended results as the variables included in the index may neutralise each other.
To summarise, amidst the plethora of criteria for fiscal devolution, the right thing to do—even from the gender perspective—appears to be to first make fiscal transfers based on per capita basis, which would be much more even and fiscally equalising; and then make suitable adjustments for backwardness.22 It goes without saying that weightage to genuine backwardness in addition to population is more redistributive than weightage to population alone. Given the magnitude of missing women in India and the disturbing practices of gender discrimination that exist even before birth, a penalty criterion needs to be incorporated in the unconditional fiscal transfers for not rewarding the states with adverse juvenile sex ratio.
Having discussed the fiscal decentralisation process in India through a gender lens at the aggregate level, the following sections critically review the local level gender budgeting experiences of three selected States under study.
IV. Kerala
18
In the backdrop of democratic decentralisation, Kerala has been a pioneer state in India in moving towards gender responsive planning and budgeting at local level. The simultaneous occurrence of feminization of political governance at the third tier with 33 percent representation of women created new democratic space for local level interventions by an agency of Women Elected Representatives (Isaac, 2004). Despite the remarkable achievements in terms of gender indicators in health and education, Kerala however has been experiencing extreme marginalisation of women especially in the spheres of governance and work force participation. In other words, superior conditions of women in Kerala in terms of social indicators has had no impact on gender status. It was in this context that a deliberate attempt was made to incorporate the gender perspective into the process of democratic decentralisation. 4.1 Democratic Decentralisation: The Process
Though it was only in 1991 that Kerala (like the rest of India) came to have elected bodies at the district level, the civil conditions of the state have been ideal for democratic decentralisation reforms, since long. Widespread literacy, sharply reduced deprivation and absolute poverty, good health performance, successfully carried out land reforms, powerful class and mass organisations etc. have acted in synergy for Kerala as an ideal state for introduction of participatory local democracy.
Popularly known as the ‘Kerala Model’, the state has demonstrated how appropriate redistribution strategies can meet the basic needs for citizens despite low levels of economic development. However, Kerala has failed to translate high social sector achievements into comparable achievements in the material production sectors. This has resulted in economic stagnation of the state, growing unemployment and an acute fiscal crisis thereby raising questions about the sustainability of the “Kerala Model ”.
Democratic decentralisation, intended to accelerate economic growth and create a new model of growth with equity, has been the political response to the stagnating economy of the state.23 All 1,214 local governments in Kerala—municipalities and the three tiers of rural local government—-district, block and gram panchayats were given new functions and powers of decision -making, and were granted discretionary budgeting authority over 35-40 percent of the state’s developmental expenditures. The democratic decentralisation, however, attempted more than just devolution of resources and functions. Local governments were not only charged with designing
19
and implementing their own development plans, they were mandated to do so through an elaborate series of participatory exercises in which citizens were given a direct role in shaping policies and projects (discussions from Isaac and Franke, 2000). 4.2. Reversed Sequence of Decentralisation
In Kerala, the usual sequence of decentralisation has been reversed; financial devolution preceded functional devolution. In 1996, 35–40 percent of the outlay of Ninth Five Year Plan was devolved to local self-government institutions. This financial devolution took place outside the purview of the State Finance Commission of Kerala. Given the low level of administrative capacity at the newly created third tier and the lack of experience of newly elected members of local bodies, the reversal of sequence of decentralisation tended to create disequilibrium during plan implementation. However complementary reforms undertaken by the state government have created conditions for successful devolution. For instance, quite contrary to the rest of India where financial devolution took the form of schemes (tied in nature), in Kerala 75-80 percent of devolution has been in the form of untied grants-in-aid. Thus the nature of financial devolution in Kerala encourages maximum fiscal autonomy to the local governments.24 4.3. New Democratic Space for Gender
Kerala reveals a paradox in terms of gender development. A much lower gender gap in social indicators and high female empowerment have accompanied Kerala’s remarkable performance in human development as demonstrated by several attempts to constructing the GDI and the GEM at the regional level for India.25 However, high rates of literacy and the dramatic decline in fertility did not translate into rapid growth of paid employment for women nor into upward occupational mobility. One of the reasons for this phenomenon is the sex-differentiated pattern of education.26 The electoral arena of Kerala has also been short of women’s representation. While in the state assembly the numbers elected have varied between 5 and 8 members in a house of 140 legislators since the early nineties, the proportion of women candidates hovered around 5 percent for the last two and a half decades.
The process of democratic decentralisation is expected to enhance the visibility of educated women in the public sphere with 33 percent representation for women at local level. Table 5 shows the distribution of elected representatives disaggregated by gender and
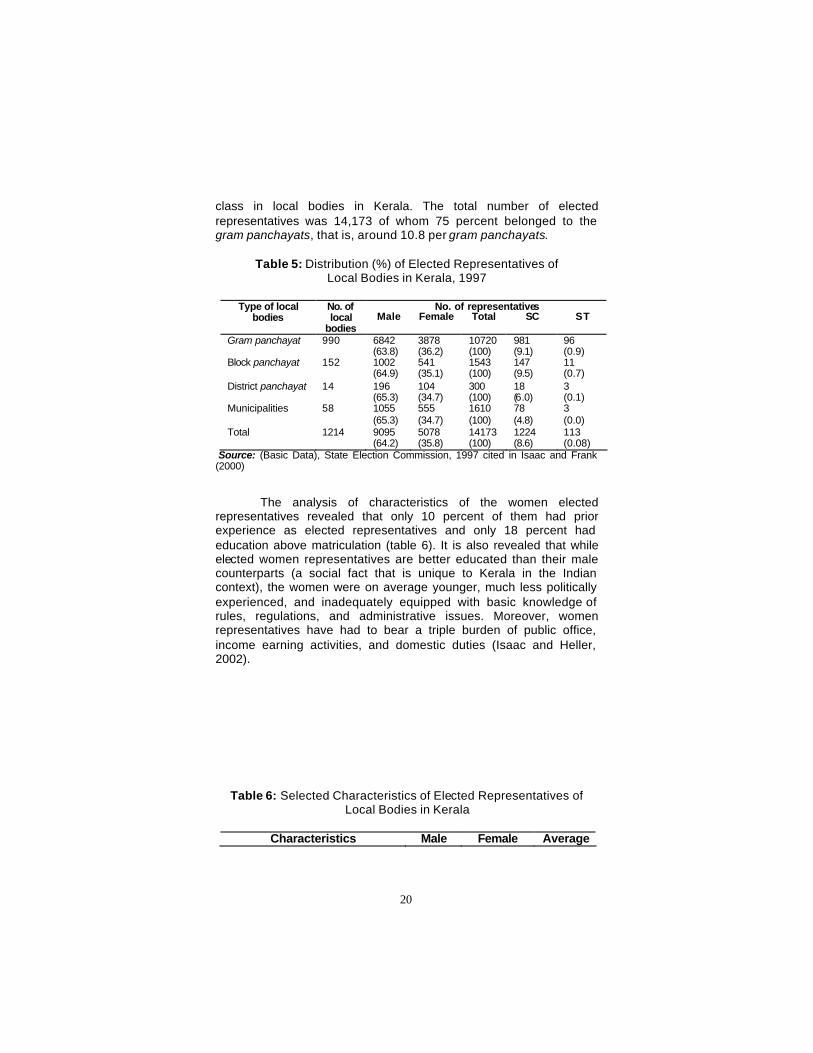
20
class in local bodies in Kerala. The total number of elected representatives was 14,173 of whom 75 percent belonged to the gram panchayats, that is, around 10.8 per gram panchayats.
Table 5: Distribution (%) of Elected Representatives of
Local Bodies in Kerala, 1997
No. of representatives Type of local bodies
No. of local
bodies Male Female Total SC ST
Gram panchayat 990 6842 (63.8)
3878 (36.2)
10720 (100)
981 (9.1)
96 (0.9)
Block panchayat 152 1002 (64.9)
541 (35.1)
1543 (100)
147 (9.5)
11 (0.7)
District panchayat 14 196 (65.3)
104 (34.7)
300 (100)
18 (6.0)
3 (0.1)
Municipalities 58 1055 (65.3)
555 (34.7)
1610 (100)
78 (4.8)
3 (0.0)
Total 1214 9095 (64.2)
5078 (35.8)
14173 (100)
1224 (8.6)
113 (0.08)
Source: (Basic Data), State Election Commission, 1997 cited in Isaac and Frank (2000)
The analysis of characteristics of the women elected representatives revealed that only 10 percent of them had prior experience as elected representatives and only 18 percent had education above matriculation (table 6). It is also revealed that while elected women representatives are better educated than their male counterparts (a social fact that is unique to Kerala in the Indian context), the women were on average younger, much less politically experienced, and inadequately equipped with basic knowledge of rules, regulations, and administrative issues. Moreover, women representatives have had to bear a triple burden of public office, income earning activities, and domestic duties (Isaac and Heller, 2002).
Table 6: Selected Characteristics of Elected Representatives of Local Bodies in Kerala
Characteristics Male Female Average
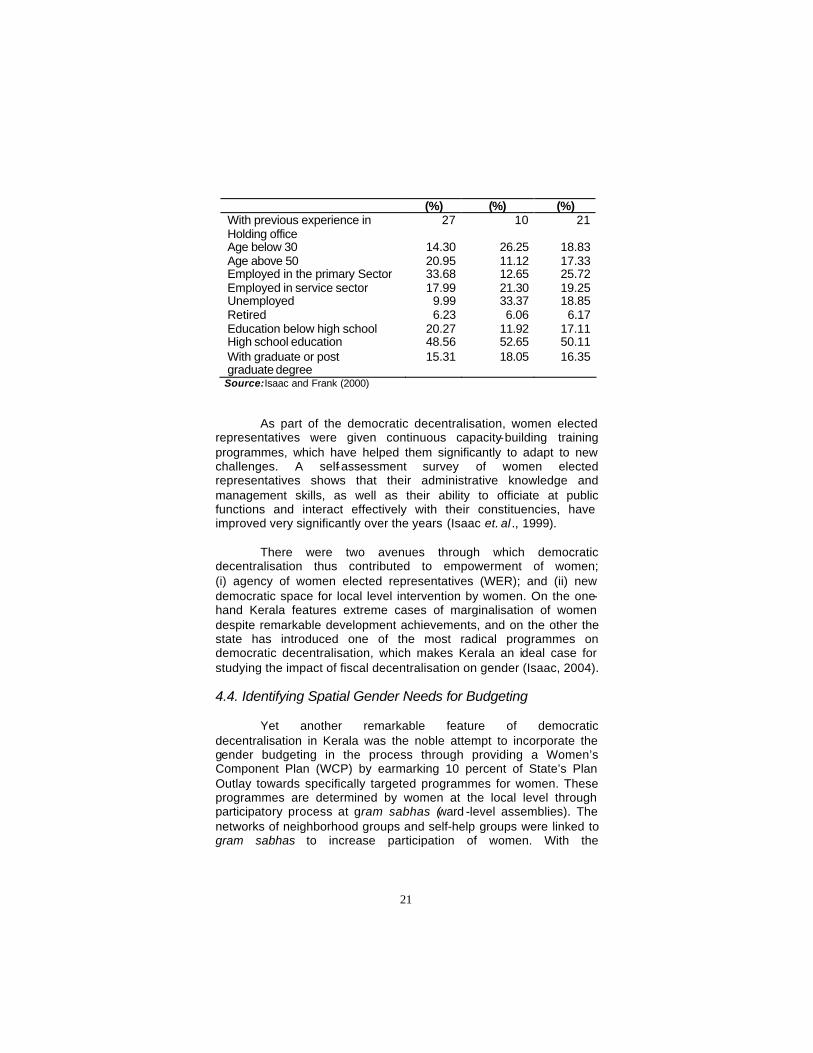
21
(%) (%) (%) With previous experience in Holding office
27 10 21
Age below 30 14.30 26.25 18.83 Age above 50 20.95 11.12 17.33 Employed in the primary Sector 33.68 12.65 25.72 Employed in service sector 17.99 21.30 19.25 Unemployed 9.99 33.37 18.85 Retired 6.23 6.06 6.17 Education below high school 20.27 11.92 17.11 High school education 48.56 52.65 50.11 With graduate or post graduate degree
15.31 18.05 16.35
Source: Isaac and Frank (2000)
As part of the democratic decentralisation, women elected representatives were given continuous capacity-building training programmes, which have helped them significantly to adapt to new challenges. A self-assessment survey of women elected representatives shows that their administrative knowledge and management skills, as well as their ability to officiate at public functions and interact effectively with their constituencies, have improved very significantly over the years (Isaac et. al ., 1999).
There were two avenues through which democratic decentralisation thus contributed to empowerment of women; (i) agency of women elected representatives (WER); and (ii) new democratic space for local level intervention by women. On the one-hand Kerala features extreme cases of marginalisation of women despite remarkable development achievements, and on the other the state has introduced one of the most radical programmes on democratic decentralisation, which makes Kerala an ideal case for studying the impact of fiscal decentralisation on gender (Isaac, 2004). 4.4. Identifying Spatial Gender Needs for Budgeting
Yet another remarkable feature of democratic decentralisation in Kerala was the noble attempt to incorporate the gender budgeting in the process through providing a Women’s Component Plan (WCP) by earmarking 10 percent of State’s Plan Outlay towards specifically targeted programmes for women. These programmes are determined by women at the local level through participatory process at gram sabhas (ward -level assemblies). The networks of neighborhood groups and self-help groups were linked to gram sabhas to increase participation of women. With the
22
constitutional provision for one-third reserved representation of women in Local Self Governments and the introduction of a special WCP amounting to 10 percent of the plan outlay, what has been the experience so far?
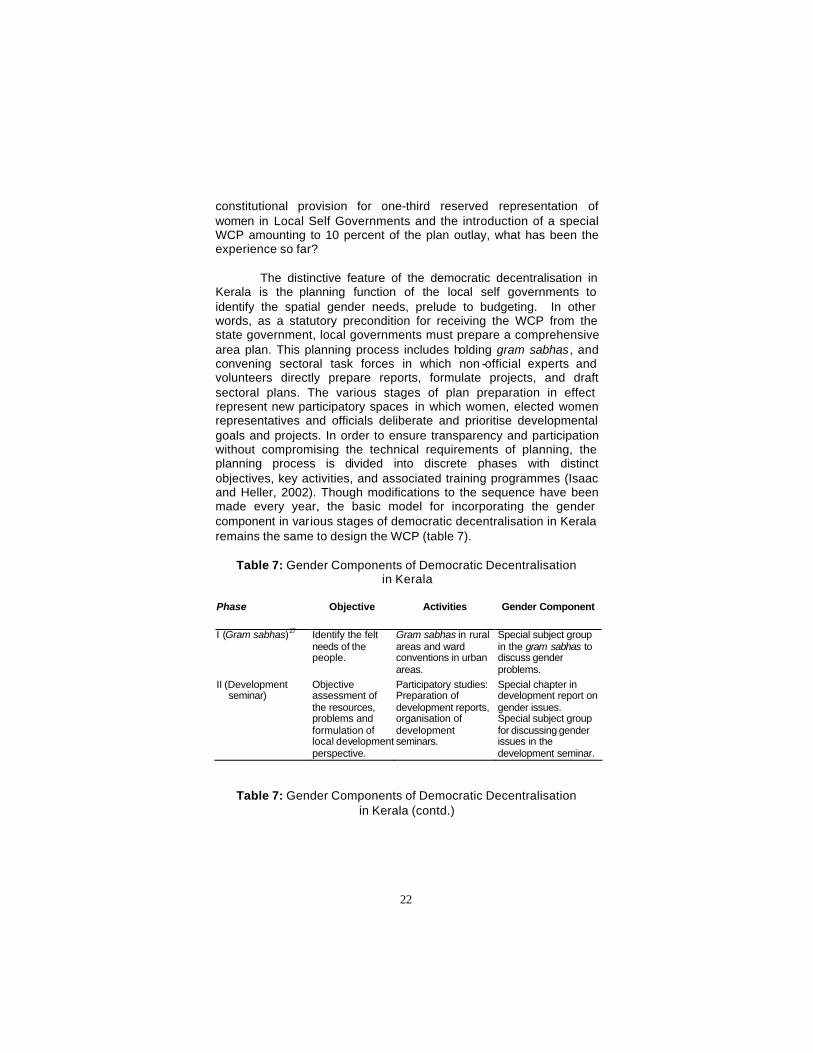
The distinctive feature of the democratic decentralisation in Kerala is the planning function of the local self governments to identify the spatial gender needs, prelude to budgeting. In other words, as a statutory precondition for receiving the WCP from the state government, local governments must prepare a comprehensive area plan. This planning process includes holding gram sabhas, and convening sectoral task forces in which non -official experts and volunteers directly prepare reports, formulate projects, and draft sectoral plans. The various stages of plan preparation in effect represent new participatory spaces in which women, elected women representatives and officials deliberate and prioritise developmental goals and projects. In order to ensure transparency and participation without compromising the technical requirements of planning, the planning process is divided into discrete phases with distinct objectives, key activities, and associated training programmes (Isaac and Heller, 2002). Though modifications to the sequence have been made every year, the basic model for incorporating the gender component in various stages of democratic decentralisation in Kerala remains the same to design the WCP (table 7).
Table 7: Gender Components of Democratic Decentralisation
in Kerala
Phase Objective Activities Gender Component
I (Gram sabhas)27 Identify the felt needs of the people.
Gram sabhas in rural areas and ward conventions in urban areas.
Special subject group in the gram sabhas to discuss gender problems.
II (Development seminar)
Objective assessment of the resources, problems and formulation of local development perspective.
Participatory studies: Preparation of development reports, organisation of development seminars.
Special chapter in development report on gender issues. Special subject group for discussing gender issues in the development seminar.
Table 7: Gender Components of Democratic Decentralisation in Kerala (contd.)
23
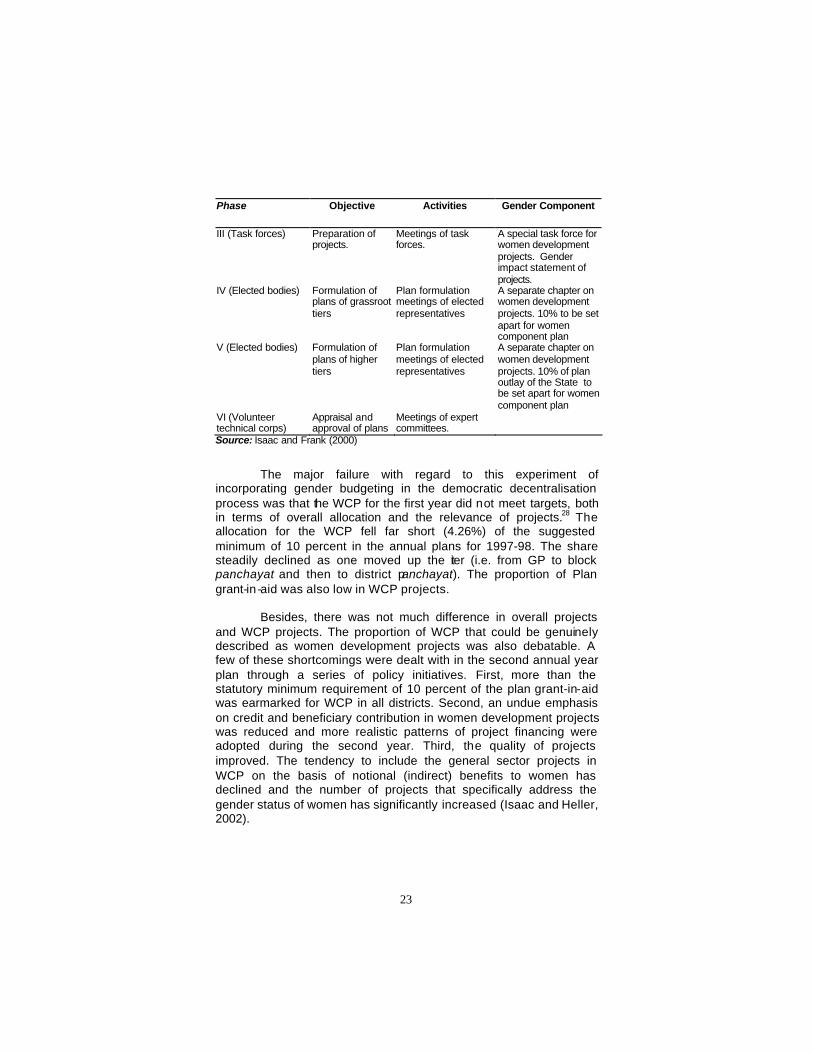
Phase Objective Activities Gender Component
III (Task forces) Preparation of projects.
Meetings of task forces.
A special task force for women development projects. Gender impact statement of projects.
IV (Elected bodies) Formulation of plans of grassroot tiers
Plan formulation meetings of elected representatives
A separate chapter on women development projects. 10% to be set apart for women component plan
V (Elected bodies) Formulation of plans of higher tiers
Plan formulation meetings of elected representatives
A separate chapter on women development projects. 10% of plan outlay of the State to be set apart for women component plan
VI (Volunteer technical corps)
Appraisal and approval of plans
Meetings of expert committees.
Source: Isaac and Frank (2000)
The major failure with regard to this experiment of
incorporating gender budgeting in the democratic decentralisation process was that the WCP for the first year did not meet targets, both in terms of overall allocation and the relevance of projects.28 The allocation for the WCP fell far short (4.26%) of the suggested minimum of 10 percent in the annual plans for 1997-98. The share steadily declined as one moved up the tier (i.e. from GP to block panchayat and then to district panchayat). The proportion of Plan grant-in-aid was also low in WCP projects.
Besides, there was not much difference in overall projects and WCP projects. The proportion of WCP that could be genuinely described as women development projects was also debatable. A few of these shortcomings were dealt with in the second annual year plan through a series of policy initiatives. First, more than the statutory minimum requirement of 10 percent of the plan grant-in-aid was earmarked for WCP in all districts. Second, an undue emphasis on credit and beneficiary contribution in women development projects was reduced and more realistic patterns of project financing were adopted during the second year. Third, the quality of projects improved. The tendency to include the general sector projects in WCP on the basis of notional (indirect) benefits to women has declined and the number of projects that specifically address the gender status of women has significantly increased (Isaac and Heller, 2002).

24
It is also to be noted that changes were made in the role and functions of the WCP task forces. Clear guidelines were established to design WCP projects, moving away from WCP investing in economic infrastructure including roads, water and sanitation to more microfinance programmes and small-scale industries (appendix 1). As a result of these measures, many weaknesses were rectified.29 Despite the initial disequilibrium with regard to gender budgeting at local level in the year of commencement, the spurious projects on gender disappeared in due course and ‘practical gender needs’ projects became the building block for institutionalising ‘strategic gender needs’.30
The experience of WCP projects in Kerala of moving away from economic infrastructure to microfinance programmes generates a debate on ‘specifically targeted programmes for poor’ versus ‘infrastructure programmes’; particularly in terms of gender budgeting. An IFPRI study showed that public expenditure on road infrastructure has the largest impact on poverty reduction.31 In this context, it is to be noted that investment in infrastructure can catalyse the fulfillment of practical needs of women; however gender budgeting is required more for addressing the financial allocation and implementation issues related to the strategic needs of women. Microfinance sector, one of the areas which was given emphasis in WCP projects in Kerala through credit-linked self help groups (SHGs) in the later years, can ensure the strategic needs of women.
Unlike in the Philippines, earmarking a definite proportion of budget for women has not led to marginalisation of gender issues in the mainstream budgeting, as floor limits have not been taken as ceiling in case of Kerala. Rather, identifying the spatial gender needs ex-ante to budgeting led to allocation of more than the statutory minimum requirement of 10 percent of the plan grant-in-aid earmarked for WCP in all districts. Though WCP is considered as second best principle of gender bu dgeting, Kerala’s experience of linking WCP ex-ante to identifying local needs through the appropriate institutional mechanisms proves that it is tantamount to designing the gender budgeting based on differential targeting of expenditure emanating from the identification of appropriate programmes for women in various sectors or reprioritising the expenditure based on a generic list of appropriate programmes and policies for women. Therefore Kerala experience of WCP is more effective than ad hoc uniform targ eting as in case of the Philippines GAD budget as well as the national level WCP designed as part of the Ninth-Five-Year-Plan in India.

25
V. Karnataka
The standardised system of decentralisation came to existence in Karnataka only after the 73rd Constitutional Amendment (1992) through the Karnataka Panchayati Raj Act (1993). 32 It provided for a three -tier structure of rural local government with 27 zilla parishads, 175 block panchayats and 5659 gram panchayats. Although the process of decentralisation has been effective and created wide possibilities for integrating gender needs at local level in Karnataka, the scope has remained largely unexplored. Unlike Kerala, there has been no within government initiative to conduct gender budgeting at the third tier in Karnataka. However, there has been a civil society initiative on ‘Building Budgets from Below” to examine whether the increased feminisation of governance [in Karnataka, 44 percent of those elected to village panchayats are women, though the constitution provides for 33 percent] could alter the public expenditure decisions at the third tier in Karnataka.33
The first phase of the study revealed that devolved functions
have remained largely as unfunded mandates and the elected women representatives (EWR) were not capable to explore their newfound powers in altering the budgetary priorities towards their needs. An attempt to rectify this lacuna was taken up in the second phase of the study through a technique of Janaagraha (community participation). An exclusive training was given to the EWRs as part of Janaagraha with regard to budgeting. It was revealed in the third phase of the study that EWRs were empowered to identify the spatial gender needs and arrive at the financial requirements, but their bargaining power in terms of altering the budgetary priorities remain dismal.
The study found that EWR are frequently excluded from budget discussions, and the requests they made for funding of projects in their constituencies were given less priority than those made by men elected representatives. The study concluded that this happen because of gender discrimination and gender bias shown by the authorities while allocating works and distributing benefits. As a result, most women members could not undertake development works in their respective constituencies.
The methodology adopted for this study, however, has certain limitations, due to non-inclusion of a simultaneous study of control groups to analyse the impact of Janaagraha and other
26
training modules adopted in the second phase of the project. Also a longitudinal survey (at least two, a benchmark survey and an impact survey) would have been more beneficial to analyse the intertemporal effects of feminisation of governance in determining public expenditure for gender needs. However, it is to be cautioned that even control group methodology should not be infected with problems like sample selection bias and Hawthorne effect (that is, any form of intervention may result in a short-term positive response from the treatment group). 5.2. Planning and Budgetary Process at Local Level
Are there any mechanisms in the local level planning and budgetary systems in Karnataka, which can provide scope to PRIs for catering to spatial gender priorities? It is often noted that although the planning process should ideally start at the gram panchayat level with participation from the gram sabha and the local people, it is usually the gram panchayats themselves who identify and prioritise works to be undertaken. This severely limits the scope of integrating gender needs in the local level planning in Karnataka.
Moreover, the resource envelope is drawn based on the resources the panchayat expects to generate and the estimated transfers indicated by the state government.34 Under the prevailing structure of decentralisation in Karnataka, most of the schemes along with the personnel are transferred to the panchayats, though the financial allocation required to implement the schemes is often inadequate. This persistent dearth of funds prevents the local body from initiating plans for suitable public service provision as well as prioritisation of existing schemes. As the panchayats receive funds from multiple sources (consolidated funds of the state as well as the central government, various regional development boards and other agencies) there seem to prevail lack of co-ordination and transparency in implementation of various schemes which can result in misappropriation and inefficiency.
VI. West Bengal
The origin of fiscal decentralisation in West Bengal may be traced to the late 19th century. However, the local bodies enjoyed very limited autonomy and were dominated by rural elites given the property restrictions on franchise. After independence, as per the recommendation of Balwantrai-Mehta Committee (1957), West

27
Bengal Panchayat Act was passed in the same year with the intention to set up a four-tier panchayati raj system.35 Subsequently with the enactment of the West Bengal Panchayati Raj Act of 1993, a three -tier system of panchayats was introduced at district, block and village levels. The organisation structure of the third tier system in West Bengal comprises 16 zilla parishads, 340 block panchayats and 3314 gram panchayats.
The State Finance Commission of West Bengal constituted aftermath to 73rd Constitutional Amendment recommended the fiscal devolution to the three tiers of PRIs in the ratio of 30:20:50. As mentioned, the fiscal devolution (16 percent of the net proceeds of the own tax revenue of the state government which go as entitlement to the PRIs) is based on two criteria; population and the index of backwardness, giving equal weight to both criteria. It is to be noted here is that in order to encourage own revenue initiatives of PRIs, SFC recommended that 2 percent of the entitlement due to a district would be set aside to operate as an incentive fund. The incentive scheme proposed was that any local body raising its own income by 5 percent or more in a financial year should be entitled to a bonus of 2/3 of the incremental revenue.
The recommendation of SFC of West Bengal in terms of devolution has considerably reduced adhocism and arbitrariness in the fiscal devolution to the third tier. It guarantees a non -discretionary assured grant for each PRI that could be spent acc ording to the priorities set by themselves, even though the dependence of PRIs on grants would continue in West Bengal. Yet another notable development is that the SFC made it a point that any scheme of devolution of resources from the state level to local bodies should be from the pool of state’s own taxes instead of individual tax based sharing, since growth of individual taxes vary considerably from year to year. 6.2. Planning and Budgetary Process at Local Level
With the commencement of SFC, there were significant changes in the planning process at the district level. Earlier, the District Plans consisted mostly of departmental schemes drawn up by the departments, may be with the participation of lower tier officials of the departments, but independe ntly of the elected bodies. The role of the three-tier panchayats in the District Plan largely consisted of utilisation of funds provided to them for poverty alleviation programmes or as untied funds. The integration of planning at the district level was more of a formality before the SFC came. The new
28
entitlement scheme recommended by SFC has provided the elected bodies with considerable funds to pursue their own priorities through the plans they can draw up. The flexibility of district plans thus increased considerably. The question at this juncture is whether these changes occured in the planning and budgeting process provided any scope for the new EWR to prioritise their gender needs?
A MIT study by Chattopadhyay and Duflo (2001) has measured the impact of feminisation of governance at local level on the outcomes of decentralisation with data collected from a survey of all investments in local public goods made by the village councils in one district in West Bengal. They found that women leaders of village councils invest more in infrastructure that is relevant to the needs of rural women, like drinking water, fuel and roads, and that village women are more likely to participate in the policymaking process if the leader of their village council is a woman. Thus placing women in leadership position in governance at the local level can change the expenditure decisions of the local bodies and in turn changes the types of public good investments at local level more corresponding to the revealed preferences (‘voice’) by women (Stern, 2002).
The study however has confronted a few criticisms. Bardhan (2002) noted that without direct evidence on the nature of women’s preferences relative to men’s and since women’s reservation in the leadership positions in local government was not linked to the distribution of women in the village, this study does not quite address how local democracy affects the underrepresented groups in the village to implement their desired outcomes.
Yet another study in the context of West Bengal on decentralised gender budgeting by UNIFEM, examining the budgetary policies with the broad objective of assessing the extent of efforts put in by the state government towards improving the relative position of women in the state, is mainly confined to state level.36 However, the analysis of local budgets under this UNIFEM study reveals that there is no information about whether or not funds given to local bodies are actually spent or not. It also makes a few reference to the fact that the local bodies are not capable of executing the functions devolved due to low technical capabilities of their staff. The study also shows that schemes are similarly loaded on the local bodies by all superior levels of government without any checks on the technical capability of the local bodies to execute the works. The result is that funds remain unspent and each PRI has a growing opening balance.37
29
VII. Conclusion
The paper examined the process of fiscal decentralisation and local level gender sensitive budgeting across three states in India, where decentralisation process has been relatively effective compared to other states. Before delving into local level experiences on gender budgeting in the three states, an attempt to analyse the intergovernmental fiscal sys tem in India through a gender lens is also undertaken in the paper, especially in a situation where local governments depend heavily on fiscal transfers. The paper argues that amidst the plethora of criteria for fiscal devolution, the right thing to do—even from the gender perspective—is to first make fiscal transfers based on per capita basis, which would be much more even and fiscally equalising; and then make suitable adjustments for backwardness. Further, weightage to genuine indices of backwardness in fiscal transfers in addition to population is more redistributive than weightage to population alone. Given the magnitude of missing women in India and the disturbing practices of gender discrimination that exist even before birth , a penalty criterion needs to be incorporated in the unconditional fiscal transfers for not rewarding the states with adverse juvenile sex ratio. However, the design for gender component in fiscal transfers is only a second best principle of gender budgeting. The first best is to integrate gender concerns in the overall budgetary process at the local level and ensure the transparency and accountability through better governance with effective participation of women in local bodies. Kerala has shown a good example in integrating both the elements through integrating gender needs in the process of decentralised planning after identifying the gender needs through participatory process through gram sabhas as well as translating it into women component plan in fiscal transfers. In Karna taka, the process of decentralisation has created immense scope for incorporating gender needs at local level, though that remains substantially unexplored. In West Bengal, the women in governance at the third tier could change the types of public expenditure at local level more corresponding to the revealed preferences (‘voice’) by women. However, that could have little influence on gender needs as most of the expenditure even at the local level is in the nature of committed non-developmental expenditure.
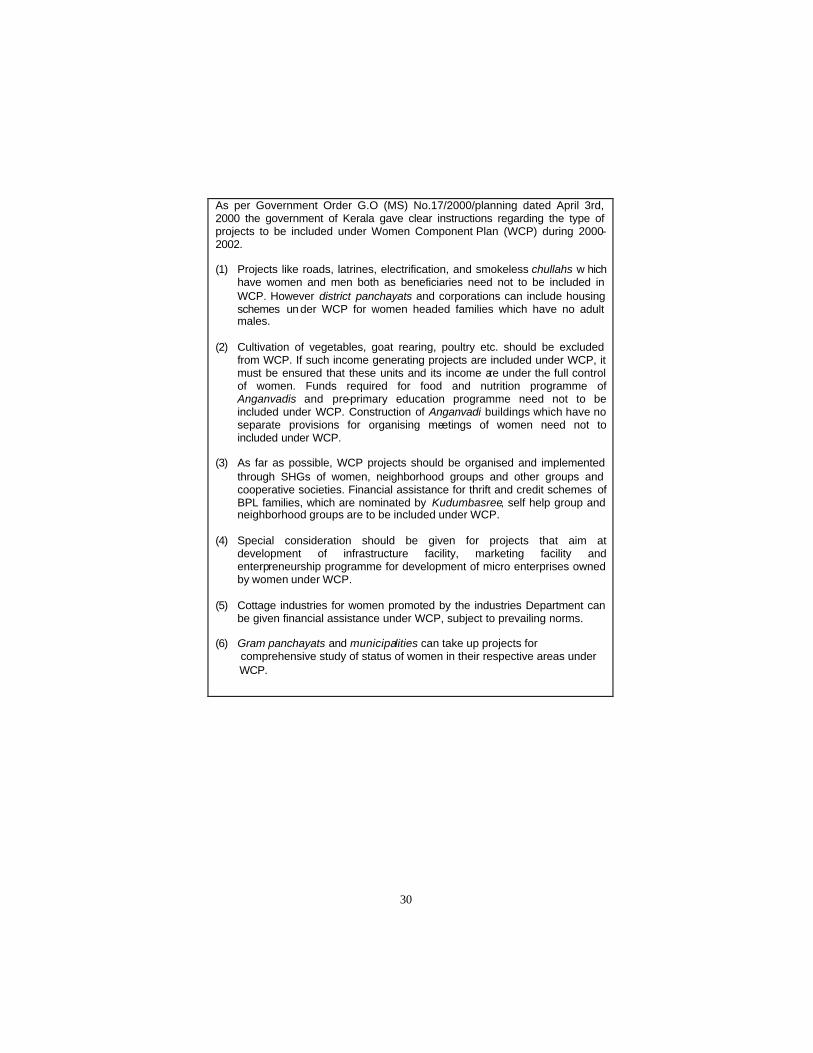
Appendix 1
Guidelines for Women Component Plan (WCP) , Kerala
30
As per Government Order G.O (MS) No.17/2000/planning dated April 3rd, 2000 the government of Kerala gave clear instructions regarding the type of projects to be included under Women Component Plan (WCP) during 2000-2002. (1) Projects like roads, latrines, electrification, and smokeless chullahs w hich
have women and men both as beneficiaries need not to be included in WCP. However district panchayats and corporations can include housing schemes un der WCP for women headed families which have no adult males.
(2) Cultivation of vegetables, goat rearing, poultry etc. should be excluded
from WCP. If such income generating projects are included under WCP, it must be ensured that these units and its income are under the full control of women. Funds required for food and nutrition programme of Anganvadis and pre-primary education programme need not to be included under WCP. Construction of Anganvadi buildings which have no separate provisions for organising meetings of women need not to included under WCP.
(3) As far as possible, WCP projects should be organised and implemented
through SHGs of women, neighborhood groups and other groups and cooperative societies. Financial assistance for thrift and credit schemes of BPL families, which are nominated by Kudumbasree, self help group and neighborhood groups are to be included under WCP.
(4) Special consideration should be given for projects that aim at
development of infrastructure facility, marketing facility and enterpreneurship programme for development of micro enterprises owned by women under WCP.
(5) Cottage industries for women promoted by the industries Department can
be given financial assistance under WCP, subject to prevailing norms. (6) Gram panchayats and municipalities can take up projects for comprehensive study of status of women in their respective areas under WCP.
39
References Bagchi, Amaresh and Lekha Chakraborty, 2004. “No Pride in this
Prejudice” , Financial Express, November 19, 2004. Banerjee, Nirmala 2003. What is Gender Budgeting? New Delhi:
UNIFEM. Banerjee, Nirmala and Poulomi Roy, 2004. Gender in Fiscal Policies:
The Case of West Bengal , New Delhi: UNIFEM. Bardhan Pranab. 2002. “Decentralization of Governance and
Developmen t,” Journal of Economic Perspectives , 16(4): 185-205, Fall 2002.
Bardhan Pranab and Dilip Mookherjee, 2000. “Capture and
Governance at Local and Central Levels,” American Economic Review, 90(2): 135 -139.
Bhat Ahalya, et.al ., 2004. “Building Budgets From Below," Economic
and Political Weekly, 34(44): 4803 -4810. Bhat Ahalya S. (undated), Building Budgets From Below, New Delhi:
UNIFEM. Chakraborty, Pinaki 2003. “Unequal Fiscal Capacities Across Indian
States: How Corrective is the Fiscal Transfer Mechanism?”, Paper prepared for the UNU/WIDER Project Conference on `Spatial Inequality in Asia , UNU Centre, Tokyo, 28-29, March.
Chakraborty, Lekha S. 2002. Gender Budgeting in Sri Lanka:
Categorising Financial Inputs, UNIFEM and Govt. of Sri Lanka.
----------------- 2003. Macroscan of Union Budget through a Gender
Lens. New Delhi: UNIFEM. ------------------ 2003. Gender Based Analysis (GBA) in Canada:
Lessons for India. Paper prepared under SICI-DFAIT Govt of Canada Faculty Research Fellowship at University of Carleton, Ottawa.
40
---------------- 2004. Gender Budgeting in Asia: An Empirical Investigation of Selected Seven Countries. Paper prepared for The Commonwealth Secretariat, UK.
--------------- 2005a. Gender Budgeting in Selected Ministries:
Conceptual and Methodological Issues , Working Paper, NIPFP-DWCD, Ministry of HRD, Govt of India, May 2005.
--------------- 2005b. “Public Policy Stance and Human Development:
An Empirical Analysis”, in Bhattacharyya, B. B. and Arup Mitra, 2005. (eds.) ., Macroecon omics and Welfare, New Delhi: Academic Publishers.
--------------- 2005c. Public Investment and Unpaid Work: Selected
Evidence from Time Use Budgets. Paper presented at UNDP-The Levy Institute of Bard College Global Conference on Unpaid Work and MDGs , New York.
-------------- 2006a. Fiscal Decentralisation and Gender Responsive
Budgeting In Mexico: Some Observations, Working Paper No. 40, National Institute of Public Finance and Policy, New Delhi.
-------------- 2006b. Fiscal Decentralisation and Local Level Gender
Responsive Budgeting In Philippines: An Empirical Analysis, Working Paper No. 41, National Institute of Public Finance and Policy, New Delhi.
------------- 2006c. ‘Ex-post Gender Sensitive Analysis of Union
Budget 2006-07, Government of India’, NIPFP —UNIFEM. Chakraborty, Lekha S. and Darshy Sinha, 2006. Declining Juvenile
Sex Ratio in India: Trends and Determinants, IAFFE conference paper, University of Sydney.
Chakraborty, Lekha S. and Amaresh Bagchi, 2007. Fiscal
Decentralisation and Gender Responsive Budgeting In South Africa: An Appraisal, Working Paper 44, National Institute of Public Finance and Policy, New Delhi.
Chattopadhyay Raghabendra and Esther Duflo, 2001. “ Women as
Policy Makers: Evidence From a India-Wide Randomized Policy Experiment”, Unpublished paper, Massachusetts Institute of Technology.

41
Eunice, Heredia-Ortíz and Mark Rider, 2006. India’s Intergovernmental Transfer System and the Fiscal Condition of the States, Andrew Young School of Policy Studies Research Paper Series, Working Paper 06 -47, November 2005.
Gulati (ed.) 1987. Centre-State Budgetary Transfers. Bombay:
Oxford University Press. Government of India (GoI) 2000. Economic Survey of India, Ministry
of Finance, New Delhi. ----------------- (GoI), 2004. Report of the Twelfth Finance Commission,
Ministry of Finance, New Delhi. ----------------- (GoI) 2005. Expenditure Budget, Volume 1, Union
Budget, India. Government of Kerala, 1996. Report of the State Finance
Commission, Government of Kerala. Government of West Bengal, 1996. Report of the State Finance
Commission, Government of West Bengal. Isaac, Thomas T. M. et. al. 1999. Gender and Decentralised
Planning—The Experience of People’s Campaign, (unpublished Working Paper), Center for Development Studies, Thiruvananthapuram.
Isaac T.M. Thomas and Richard W. Franke, 2000. Local Democracy
and Development, New Delhi: LeftWord. Isaac, Thomas T.M. and P Heller, 2002. "Decentralisation,
Democracy and Development: People’s Campaign for Decentralized Planning in Kerala," in A. Fung and E.O. Wright (eds.), Deepening Democracy: Institutional Innovations in Empowered Participatory Democracy. London: Verso Press.
Isaac T.M. Thomas, 2004. Democratic Decentralization and Women
Empowerment: Kerala Model. Paper presented at International Expert Group Meeting on Local Level Gender Responsive Budgeting, NIPFP, New Delhi .
42
Lahiri, Ashok and Lekha S. Chakraborty, and P.N. Bhattacharryya, 2002. Gender Diagnosis and Budgeting in India, National Institute of Public Finance and Policy, New Delhi (mimeo).
Lahiri, Ashok and Lekha S. Chakraborty, and P.N. Bhattacharryya,
2003. Gender Budgeting in India, National Institute of Public Finance and Policy, New Delhi. (mimeo).
Lekha S. 1997. Selected Issues in Fiscal Decentralisation:
In ternational and Indian Experiences, Unpublished M. Phil Thesis, Centre for Development Studies, JNU.
Rao, M. Govinda (ed.) 2002. Development, Poverty, and Fiscal
Policy, New Delhi: Oxford University Press. Rao, M. Govinda 2002. “Poverty Alleviation under Fiscal
Decentralisation”, in M. Govinda Rao (ed.), Poverty, Development and Fiscal Policy. New Delhi: Oxford University Press.
----------------- 2003. Intergovernmental Finance in South Africa: Some
Observations”, Working Paper No. 1, National Institute of Public Finance and Policy, New Delhi.
Rao, M. Govinda, H.K. Amar Nath, and B.P. Vani, 2004. “Fiscal
Decentralization in Karnataka”, in Geeta Sethi (ed.), Fiscal Decentralization to Rural Governments in India , The World Bank. New Delhi: Oxford Universi ty Press.
Rao, M. Govinda, 2005. Fiscal Federalism in India: Emerging
Challenges, Indian Country Roundtable on Fiscal Federalism; Global Dialogue Program on Federalism Forum of Federations, NIPFP, New Delhi.
Rao, M. Govinda and Nirvikar Singh, 2005. Political Economy of
Federalism in India, New Delhi: Oxford University Press. Rao, M. Govinda and Lekha S. Chakraborty, 2006. Fiscal
Decentralisation and Gender Responsive Budgeting In Morocco: Some Observations, Working Paper No. 42, National Institute of Public Finance and Policy, New Delhi.
Rao, M. Govinda “Fiscal Federalism in Planned Economies”, in
Ehtisham Ahmad and Georgio Brosio (eds.), Handbook of Fiscal Federalism, Edward Elgar (Forthcoming).

43
------------- 2006. Gender Responsive Budgetary Polici es and Fiscal Decentralization: Conceptual Issues, Paper presented at NIPFP-IFES-USAID conference on Gender Budgeting, NIPFP, February 2, 2006.
Srivastava D.K., 2006. Equalizing Health and Education: Approach
of the Twelfth Finance Commission, Working Paper 8/2006, Madras School of Economics, India.
Stern, Nicholas 2002. “Public Finance and Policy for Development:
Challenges for India”, Silver Jubilee Lecture at NIPFP, New Delhi.
Stotsky, Janet 2006. Gender Budgeting, IMF Working Paper,
Washington DC. United Nations Development Programme (UNDP), 2004. Human
Development Report , Oxford University Press, New York. ----------------- 2005. Human Development Report , UNDP. World Bank, 2002. World Development Indicators, World Bank.
31
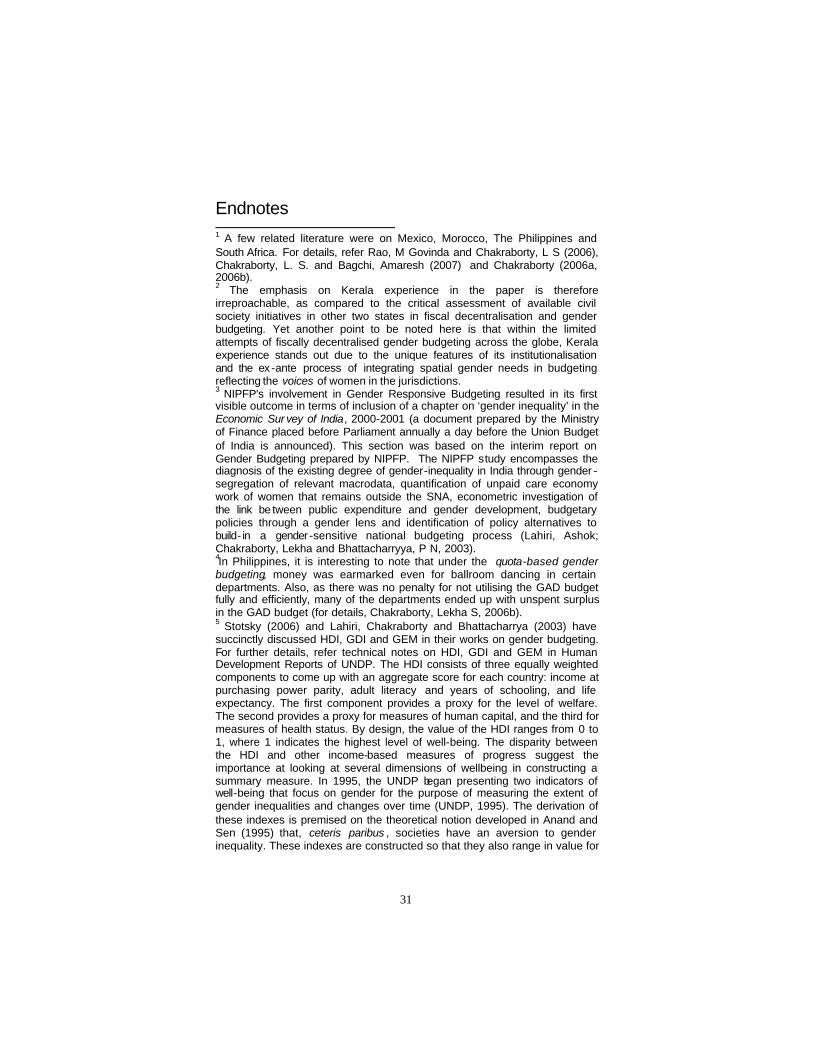
Endnotes 1 A few related literature were on Mexico, Morocco, The Philippines and South Africa. For details, refer Rao, M Govinda and Chakraborty, L S (2006), Chakraborty, L. S. and Bagchi, Amaresh (2007) and Chakraborty (2006a, 2006b). 2 The emphasis on Kerala experience in the paper is therefore irreproachable, as compared to the critical assessment of available civil society initiatives in other two states in fiscal decentralisation and gender budgeting. Yet another point to be noted here is that within the limited attempts of fiscally decentralised gender budgeting across the globe, Kerala experience stands out due to the unique features of its institutionalisation and the ex -ante process of integrating spatial gender needs in budgeting reflecting the voices of women in the jurisdictions. 3 NIPFP's involvement in Gender Responsive Budgeting resulted in its first visible outcome in terms of inclusion of a chapter on ‘gender inequality’ in the Economic Sur vey of India, 2000-2001 (a document prepared by the Ministry of Finance placed before Parliament annually a day before the Union Budget of India is announced). This section was based on the interim report on Gender Budgeting prepared by NIPFP. The NIPFP study encompasses the diagnosis of the existing degree of gender-inequality in India through gender -segregation of relevant macrodata, quantification of unpaid care economy work of women that remains outside the SNA, econometric investigation of the link be tween public expenditure and gender development, budgetary policies through a gender lens and identification of policy alternatives to build- in a gender -sensitive national budgeting process (Lahiri, Ashok; Chakraborty, Lekha and Bhattacharryya, P N, 2003). 4In Philippines, it is interesting to note that under the quota-based gender budgeting, money was earmarked even for ballroom dancing in certain departments. Also, as there was no penalty for not utilising the GAD budget fully and efficiently, many of the departments ended up with unspent surplus in the GAD budget (for details, Chakraborty, Lekha S, 2006b). 5 Stotsky (2006) and Lahiri, Chakraborty and Bhattacharrya (2003) have succinctly discussed HDI, GDI and GEM in their works on gender budgeting. For further details, refer technical notes on HDI, GDI and GEM in Human Development Reports of UNDP. The HDI consists of three equally weighted components to come up with an aggregate score for each country: income at purchasing power parity, adult literacy and years of schooling, and life expectancy. The first component provides a proxy for the level of welfare. The second provides a proxy for measures of human capital, and the third for measures of health status. By design, the value of the HDI ranges from 0 to 1, where 1 indicates the highest level of well-being. The disparity between the HDI and other income-based measures of progress suggest the importance at looking at several dimensions of wellbeing in constructing a summary measure. In 1995, the UNDP began presenting two indicators of well-being that focus on gender for the purpose of measuring the extent of gender inequalities and changes over time (UNDP, 1995). The derivation of these indexes is premised on the theoretical notion developed in Anand and Sen (1995) that, ceteris paribus , societies have an aversion to gender inequality. These indexes are constructed so that they also range in value for
32
each country from 0 to 1, where values closer to 1 indicate higher levels of women’s well-being and empowerment relative to men. The difference between the GDI and HDI for a country reflects not only the magnitude of the gender gap but also the penalty that applies to this gap. This penalty is calculated by constructing the so-called equally distributed equivalent achievement (EDEA), which is defined as the level of achievement that, if attained equally by women and men, would be judged to be exactly as valuable socially as the actually observed achievement (Anand and Sen, 1995). An example is the level of literacy that, if achieved equally by everyone, would yield the same social valuation as one showing a particular gender gap. The formula depends on a parameter, the aversion to inequality, for which a larger value implies a greater penalty for gender gaps. If the aversion to inequality were zero, then the EDEA would be the weighted mean of the male and female levels, which is equal to the average level of achievement in the HDI. Any value of the parameter greater than zero leads to an EDEA below the weighted mean. For the UNDP report, the value of this parameter was taken to be 2 for all three gender gaps. The second index, which is constructed in a similar manner, relates to political equality and is termed the Gender Empowerment Measure (GEM). The GEM examines the ability to participate in economic and political life. It uses indicators based on per capita income, the share of jobs classified as professional and technical, and administrative and managerial, going to women and men, and the share of parliament ary seats going to women and men (discussion from Stotsky, 2006). 6 Empirical literature draws attention to these efficiency dimensions of integrating gender perspective into macroeconomic policies. For example, the striking good mother thesis noted that w omen tend to have a higher marginal propensity to spend than men on goods that enhance the capabilities of children. Evidence suggests that the likelihood of children being enrolled in school goes up with their mother’s educational level, and the mother’s extra income has more positive impact on household investments in nutrition, health and education of children than extra income accruing to fathers. Also, literature on gender inequality in the labour market shows that eliminating gender discrimination in occupation and wages could increase not only women’s income, but also national income. 7 NIPFP methodology of categorising the public expenditure in terms of gender has been adopted in two South Asian countries, Nepal and Sri Lanka. In Sri Lanka, the study done by Chakraborty, L (2002) has been translated into vernacular languages and used it as an analytical basis to conduct gender budgeting. Government of India accepted NIPFP methodology to undertake this exercise at subnational governments in India. 8 Instead, NIPFP’s suggestion of gender budgeting in PRES classification (categorising gender-related public expenditure into Protective, Regulatory, Economic and Social (PRES) services) has been adopted by national and subnational governments due to the simplicity in its application to the existing classification of expenditure budgets. Under PRES framework, public expenditure can be categorised into four clusters. First, there are protective and welfare services that are important to prevent the atrocities against women such as domestic violence, rape, kidnapping, dowry deaths including
33
rehabilitation programmes. All citizens irrespective of caste, creed, or sex enjoy the benefits of public expenditure on the maintenance of law and order and dispensation of justice and their consumption is “non-rival” in nature. Still, such expenditure has got a gender dimension as women and children are more vulnerable to social stress and violence. Second, there are regulatory services for women, in particular, the institutional mechanism like National Commission for Women. Third, there are economic services such as self-employment and training programmes, economic empowerment programmes and fuel supply management programmes, which can provide economic empowerment for women. Fourth, there are social services such as education, water supply and sanitation, housing, health and nutrition schemes, which can empower women to play their rightful role in the economy. Studies revealed that major part of gender -related public expenditure in India belongs to Protective and Welfare Services; leaving most negligible allocation for economic services (NIPFP, 2003; Chakraborty, L 2003). 9 For details on policy series of ex-post analysis of gender budgeting, NIPFP (2002), Chakraborty, L (2003) and Chakraborty (2006). 10 The expert group was under the chairmanship of Chief Economic Advisor of India, Ashok Lahiri and the report is posted in www.cgaindia.org/pdf/ Classification%20Report.pdf ; Section II of the report is on gender budgeting. 11 Refer Expenditure Budget, 2005-06. It was also noted that Department of Women and Child Development (DWCD) and NIPFP would be undertaking a review of the public expenditure profile of the departments of Rural Development, Health and Family Welfare, Labour, Elementary Education, Small Scale Industries, Urban Employment and Poverty Alleviation, Social Justice and Empowerment and Tribal Affairs, through a gender lens; conduct sex disaggregated benefit incidence analysis (BIA) and recommend specific changes in the operational guidelines of various development schemes so as to improve the coverage of women beneficiaries of the public expenditures. Subsequently, NIPFP developed a Working Paper titled “Gender Budgeting in Selected Ministries: Conceptual and Methodological Issues” and based on this Working Paper, DWCD organised two workshops for the selected ministries for training in gender budgeting. For details, Chakraborty, Lekha S (2005a). 12 Refer Chakraborty, L (2006c) for details. 13 These indices also fail to capture the ‘efficiency’ argument underlying the principle of subsidiarity. 14 This is the combined autonomy ratio of both urban and rural local governments. The ratio turns out to be even lower if only the rural local bodies are considered. 15 In Karnataka, Section 199 of Karnataka Panchayat Act, 1993 empowers the gram panchayats (GPs) to levy taxes on specified bases subject to a specified maximum e.g., the tax on land and buildings not subject to agricultural assessment within the panchayat area limits. The GPs also have the power to levy other taxes like entertainment tax, vehicles tax. However these taxes are rarely levied as administrative costs exceed the revenue accretion. Fee charged on water supply is the major non- tax source of revenue. With regard to intergovernmental transfers, by the Panchayat Act
34
the state government is required to constitute a State Finance Commission (SFC) once in five years to review the financial position of the ZPs, TPs and GPs and to make recommendations on the sharing of state taxes, assignment of revenues and forwarding of grants from the Consolidated Fund of the State Government. In Kerala, tax revenue has an own source component and a state component, the latter consisting of assigned taxes (basic tax on land and a four -percent surcharge on stamp duty collected under the provisions of the Kerala Stamp Act) and shared tax (the share for GPs called vehicle tax compensation). The assigned and shared taxes are officially referred to as ‘statutory grant’. Own taxes of the GP include property tax, profession tax, entertainment tax, advertisement tax, service tax and show tax, with the last three adding up to insignificant amounts. Apart from the statutory grants, the GP’s receive non-plan state grants, plan grants and central grants. In terms of revenue powers, own tax constitutes only 5 percent of the total revenue of PRIs in West Bengal. The own revenue resources of the state has been very low; the negligible sources of revenue has been tax on land and buildings and stamp duty on property transfers along with user charges from water, fee for registration of vehicles, license fee for markets etc. The SFC of West Bengal has not recommended any major additionalities to the own revenue sources of the PRIs. However, SFC recommendations in terms of devolution of finance has created a qualitative change in the nature of grants to local bodies by reversing the nature of grants from tied to increasingly untied grants, thereby giving more autonomy to the PRIs. 16 A notable feature is the multiplicity of transfer channels from the center to the states. First, there is a constitutional mechanism to devolve tax shares and give grants. Second, the Planning Commission gives grants and loans for implementing development plans. Finally, various ministries give grants to their counterparts in the states for specific projects which are either wholly funded by the centre (central sector projects) or requiring the states to share a proportion of the cost (centrally sponsored schemes) (Rao and Singh, 1998). Moreover, there is a lack of coordination among the three current institutions in charge of implementing transfers. 17 But the major problem of working out the devolution criteria on the basis of per capita income at the local level is the paucity of data on per capita income below the district level. Still it is quite likely that local bodies under the jurisdiction of a particular district with higher per capita income would be economically better off than the local bodies under the jurisdiction of a district with lower per capita income. In that case district level per capita income could be used as a proxy variable of per capita income at the local level (Lekha S. 1997). 18 Studies also noted that public infrastructure investment affects market work, non-market work and leisure time in different ways with evident gender differentials. The time allocation in SNA activity of women is found significant and inversely related to the pu blic infrastructure in water supply (Chakraborty, L 2005). 19 Amartya Sen set off a debate when he estimated that there are 100 million ‘missing women’ in the world; India has the dubious distinction of having the largest share. This magnitude of female survival disadvantage is far from a
35
minor issue. Studies noted that it ranks among the worst human catastrophes of the twentieth century as it is larger than the combined casualties of all famines in the twentieth century and it also exceeds the combined death toll of both world wars and the casualties of major epidemics including the currently ongoing AIDS pandemic. Using fixed effects model of pooled least squares for the last four decennial census data across fifteen major states in India, study reveals that higher socio-economic characteristics, viz., female literacy, female labour participation rate and economic growth, has not been translated effectively in terms of containing the female survival disadvantage. The disaggregated panel data analysis by geographic units reveals that lower juvenile sex ratio is not an isolated phenomenon of rural India, rather matter is dismal in urban units. (Chakraborty, L and Sinha, 2006). 20 However, if it is felt that the mandate of adhering to the 1971 population would stand in the way, then the population weights can be split into two halves and one half assigned to the number of females or, better still, female children (Bagchi and Chakraborty, 2004). 21 A quick review of SFCs through a gender lens revealed that no SFC has effectively integrated gender concerns in their reports. Among the three states under concern, only Kerala has explored the scope of conducting gender budgeting at the third tier. However, the attempt has remained outside the purview of SFC of Kerala. SFCs are required to make recommendations on the assignment of tax revenues to local bodies, sharing of tax revenues between States and the local governments and their distribution among individual local bodies as also grants. The experience of implement ation of SFC across states however depicts a disappointing picture as many states are reluctant to devolve revenue and expenditure powers to third level governments (Rao, 2005). Some States have devolved functions and functionaries and finances, but the functions have been capsulated in terms of schemes in the interest of transferred employees and local governments do not have the autonomy in either changing the schemes or to exit. Yet another problem at the third tier is that as the salary of the devolved functionaries are paid by the state and their transfers and promotions are decided by the state government, the local governments cannot effectively ensure their accountability. Further the twin dangers of elite capture and corruption need to be resolved in many States. 22 This point has its roots in the discussions by Gulati (1987). 23 In 1996, a coalition (Left Democratic Front) of left parties returned to power in the state of Kerala and immediately fulfilled one of its most important campaign pledges by launching the “People’s Campaign for Decentralised Planning” (Isaac and Franke, 2000). 24 Thus going by the traditional literature, Kerala’s decentralisation takes the form of “devolution” as opposed to the moderate “deconcentration” or an essentially right wing “delegation”. Here, authority is transferred to autonomous or semi-autonomous local governments, giving them powers to plan, make decisions, raise revenues, employ staff, and monitor activities. In the Kerala people’s campaign, devolution was used as the administrative mechanism of decentralisation, but the international significance lies in

36
Kerala’s attempt to make devolution large-scale, democratic, participatory, activist, egalitarian, empowering, self-reflective, self-reliant, and sustainable. 25 For details of GDI and GEM, refer UNDP Human Development Reports, Technical Notes. 26 Though women far exceed men in graduate and post-graduate courses in arts and sciences, they lag far behind them in professional/technical education except in ‘softer’ professions like teaching. Educated unemployment is the most serious problem for women in Kerala. Unable to procure jobs commensurate with their skills and preferences (which are often shaped by social contexts), many of them are choosing to remain unemployed. The occupational structure suggests that although female share of organised sector employment is high (owing to higher literacy) in Kerala vis-à-vis the other Indian states, most of these women are located at the lower end of professional hierarchy. 27 The term gram sabha refers to village assembly. Functions of the gram sabha include (1) mobilising voluntary labour and voluntary contributions in cash and kind for community works; (2) identifying beneficiaries of anti-poverty and village development schemes; (3) assisting the implementation of village development schemes; (4) making recommendations on annual accounts, administrative report, report on development programme and audit report of the panchayats etc. 28 An obvious factor here was the insufficient representation of women among trained resource persons. This problem has been directly addressed in subsequent rounds of training. As women activists and representatives have started playing a proactive and informed role in the campaign, the effectiveness, content and scope of the WCP has improved. 29 The share of grant-in-aid set apart for WCP rose to 11 percent, more realistic patterns on financing the projects were adopted, the quality of projects improved and new forms of women’s development organisations such as self-help groups emerged (Isaac and Franke, 2000). 30 Practical gender needs do not entail to the strategic goal such as women’s emancipation or gender equality. Practical gender needs include food, shelter, community-level requirements of basic services or basic infrastructure like roads, water and sanitation which are required by all the family, not the women alone. Strategic gender needs are identified to overcome women’s subordination, which in turn depends on particular cultural and socio-political context. Strategic needs include abolition of sexual division of labour, alleviation of the burden of domestic labour, child care, removal of institutional forms of discrimination such as, rights to own land or property, access to credit, measures against domestic violence, establishment of political equality. 31 Fan, Hazell and Thorat (1999) 32 Decentralisation initiatives in Karnataka could be traced to as early as 1862 when the “local fund” was established in each district to construct roads and other public utilities. The post independence initiative includes the report of the Local Boards Enquiry Committee (1954) which recommended a three-tier structure at the district, taluk and village level. After the reorganisation of the state in 1956, a need was felt for standardising the varying patterns of local governments in different regions and this led to the Mysore Village

37
panchayats and Local Board Act (1959) . The Act assigned executive functions to the Village panchayats and taluk development boards with district development councils assigned an advisory role. The most important initiative towards decentralisation was taken with the enactment of the Karnataka Zilla Parishads, Taluk Panchayat Samitis, Mandal Panchayat and Nyaya Panchayat Act of 1983. The Act was implemented from 1987 onwards and it helped to evolve a two-tier structure of decentralisation. While the zilla parishads (district level) and mandal panchayats had the executive authority, the intermediary tier of taluk panchayat samitis had only a co-ordinating role. Since 1993, Karnataka has been a forerunner in the decentralisation reforms initiated in the country in 1992. In fact the state’s experience has influenced national level thinking on the empowerment of rural local governments. Against this backdrop, a World Bank sponsored study done by Rao, et. al . (2004) compiled and analysed the fiscal data on the 175 taluk panchayats, 27 zilla panchayats, and 636 gram panchayats out of a total of 5659 GPs in the state. 33 A project—Building Budgets from Below —was funded by UNIFEM and carried out by the Karnataka Women’s Information and Resource Centre (KWIRC) in 2002. The pilot project addressed the following issues –how to draw the most appropriate benefits from budget to women, how to give th em agency, that is, the power and the place in the structure of governance that would enable them to direct the local economy to serve their choices. In effect it was an action research project conducted in three phases, which investigated the extent of freedom available to women elected to self -government bodies to determine local fiscal policies. The areas selected for the study were (a) dry land (not developed) in North Karnataka: Honaganahalli Gram Panchayat in Bijapur district; (b) dry land (average developed) in Mid Karnataka: Kogalli Gram Panchayat in Bellary district; © well developed with good social indicators in SouthWest Karnataka: Udupi City Municipal Council / Average developed in South East Karnataka: Tumkur City Municipal Council and (d) developed with fairly good social indicators in South Karnataka: Mysore City Corporation. 34 Planning at the village level is restricted to allocating the available funds for spillover works. The prepared budget is then sent to the TPs for scrutiny and consolidation. Every August the finance department of the state government indicates the total grants to be given. The ZPs then allocate this to the 23 major heads after consultation with the heads of their line departments who in turn consult the official at the taluk level. After consolidation by the finance department, the plan proposals are then placed before the Finance and Planning Committee. Next the draft annual plan is placed before the governing body of the ZP. The proposals are then included in the “Link Document” after approval from the state planning department. 35 Zilla parishads at the district level, anchalik parishads at the Block level, Anchal Parishads at the Union (group of villages) level and the gram panchayat at the village level. 36 Published as “Gender in Fiscal Policies: The case of West Bengal” by the UNIFEM, the study initially dealt with the need for institutional response to the existing gender bias in West Bengal. This was followed by a detailed analysis of the budgetary situation in West Bengal vis-à-vis other Indian
38
states in the 1990’s. The study also examined the public schemes for women in the state budget; with special reference to state education policies from a gender perspective. The period of the study refers to the decade after the official setting in of the new economic policies –an event, that was supposed to have an impact on the finances of the centre as well as the states and welfare of the people at large. Classifying schemes as (1) Relief schemes; (2) gender-reinforcing schemes; (3) equity promoting schemes; and (4) Equality promoting schemes, the study found that West Bengal had so far taken little initiative to promote true gender equality. Outlays on equality promoting schemes (meant as a special aid to remove women’s handicaps) were dismally low. Bulk of the budgetary resources in the social sector went to traditional welfare services with an implicit assumption about the non-existence of any gender bias in the access to these resources. Another significant part of the budget was for schemes for women in their traditional roles of reproducers and caregivers. Thus although the constitutional directive of not denying women equal access to all public facilities has been carried out, the barriers preventing women from exploit ing these facilities remain largely unaddressed. When the above classification was applied to the state education budget, several grey areas were found e.g., though the budget mentions schemes for hostels for Muslim girls or appointment of women teachers in educationally backward areas, the actual budgetary allocation for these schemes was either absent or negligible. Absence of even primary schools in large number of habitations in West Bengal implied a relative scarcity of female teachers, which again was responsible for the high drop-out rates of girls at primary levels. The analysis broadly shows that public education expenditure of the state of West Bengal has been largely insensitive to the special needs of women. Classifying expenditures on education and health (budget heads) by economic categories the study found that almost the entire amount went for wages and salaries to the staff – the share went up during the 90s. This left very little for expansion or improvement of services. 37 Excerpts of discussions with Banerjee.