Gender Ratios at Top PhD Programs in Economics - Federal
30
FEDERAL RESERVE BANK OF SAN FRANCISCO WORKING PAPER SERIES Gender Ratios at Top PhD Programs in Economics Galina Hale Federal Reserve Bank of San Francisco Tali Regev Tel Aviv University August 2011 The views in this paper are solely the responsibility of the authors and should not be interpreted as reflecting the views of the Federal Reserve Bank of San Francisco or the Board of Governors of the Federal Reserve System. Working Paper 2011-19 http://www.frbsf.org/publications/economics/papers/2011/wp11-19bk.pdf
Transcript of Gender Ratios at Top PhD Programs in Economics - Federal
FEDERAL RESERVE BANK OF SAN FRANCISCO
WORKING PAPER SERIES
Gender Ratios at Top PhD Programs in Economics
Galina Hale
Federal Reserve Bank of San Francisco
Tali Regev Tel Aviv University
August 2011
The views in this paper are solely the responsibility of the authors and should not be interpreted as reflecting the views of the Federal Reserve Bank of San Francisco or the Board of Governors of the Federal Reserve System.
Working Paper 2011-19 http://www.frbsf.org/publications/economics/papers/2011/wp11-19bk.pdf
Gender Ratios at Top PhD Programs in Economics
Galina Hale∗
Federal Reserve Bank of San Francisco
Tali Regev†
Tel Aviv University
August 18, 2011
Abstract
Analyzing university faculty and graduate student data for the top-ten U.S. economics de-partments between 1987 and 2007, we find that there are persistent differences in gender com-position for both faculty and graduate students across institutions and that the share of femalefaculty and the share of women in the entering PhD class are positively correlated. We find, us-ing instrumental variables analysis, robust evidence that this correlation is driven by the causaleffect of the female faculty share on the gender composition of the entering PhD class. Thisresult provides an explanation for persistent underrepresentation of women in economics, as wellas for persistent segregation of women across academic fields.
JEL classification: J16, J23, J71, I23, M51
Key words: gender, segregation, economists, gender bias, affirmative action, minority
∗[email protected].†[email protected]
This paper would have been impossible without instrumental help of Ishai Avraham and Emily Breza. Helpfulcomments were received from Joshua Angrist, Manuel Bagues, Jean Imbs, Oscar Jorda, Daniel Paravisini, AdyPauzner, Giovanni Peri, Veronica Rappoport, Yona Rubinstein, Analia Schlosser, as well as participants of seminarsin Tel Aviv University, international workshop “Frontiers in Economics of Education”, and 2011 Royal EconomicSociety conference. Anita Todd helped prepare the draft. All errors are ours. All views presented in this paper arethose of the authors and do not represent the views of the Federal Reserve Bank of San Francisco or the FederalReserve Board of Governors.
1
1 Introduction
The distribution of women across academic fields is uneven and this segregation appears to be
persistent. The economics profession is no exception: Despite the increase in the number of female
economists over last few decades, women in economics are underrepresented. In fact, the latest re-
port of the American Economic Association’s Committee on the Status of Women in the Economics
Profession shows that the female shares of ladder faculty in academic institutions have stagnated
since 2003 at a level of about 30 percent (Fraumeni, 2011). It is therefore important to understand
what may drive such persistence. This paper uncovers one mechanism — a higher share of female
faculty has a positive effect on the gender composition of the graduate student body. We find this
mechanism by disentangling employer gender bias from the causal effects of the gender composition
of faculty.
We analyze trends in the gender composition of faculty and PhD students in the top U.S.
economics departments. We then test whether there is a correlation between the share of female
faculty in a given economics department and the share of female students in the entering PhD
class. Upon finding positive correlation, we test for evidence of time-varying gender bias and
whether there is a causal relationship from the share of women in the faculty to the share of women
in the entering PhD class. To do so, we use instrumental variables approach.
Such a causal relationship could be due to the influence female faculty have on admission
decisions,1 to reduction in prejudice against women induced by the increasing share of female
faculty (Beaman et al., 2008; Goldin, 1990), or to self-selection of admitted female students toward
departments with a larger share of female faculty, either because they expect better mentoring or
less discrimination, or simply because they prefer to work with women.2
We conduct our analysis using matched data on students and faculty of ten of the top U.S.
economics departments during the 20 years prior to 2007. The panel nature of our data allows us to
1Zinovyeva and Bagues (2010) find evidence of such gender influence in the context of academic promotions.2See Hoffmann and Oreopoulos (2009), Bettinger and Long (2004), Neumark and Gardecki (2003), Hilmer and
Hilmer (2007) and Blau et al. (2010).
2
control both for institution and time fixed effects. We use the share of non-white graduate students
and the share of women in the graduate class admitted to all other departments, as measures of the
departmental minority bias and of the university-wide gender bias respectively, to identify time-
varying institution-specific tendencies to accept women into the department. Further, to establish
a causal effect of the gender composition of the faculty on the gender composition of the entering
PhD class, we use the exogenous portion of the variation in the faculty female share in a given
department that is due to resignation of male faculty in the previous two years. The number of
male faculty resignations is a good instrument because it has a mechanical effect on the share
of female faculty, but no direct effect on the share of women in the cohort of graduate students
admitted in the following year. To alleviate any concerns that male exits are themselves byproducts
of time-varying gender attitudes at the department level, we conduct two additional tests: First,
we limit male exits to those of young male faculty exiting the set of top ten departments. Second,
we predict male exits using only age and publication data of 7800 individual-year observations and
use the predicted exits as our instrument.
We document robust and statistically significant positive correlation between the gender com-
position of the faculty and of the graduate student body over time. Some of this positive correlation
is explained by time-varying minority attitudes of the departments. More importantly, we find ev-
idence of a causal relationship between the faculty gender composition and the share of women in
the entering PhD class that is robust to the estimation technique, to alternative instruments, and
to different sets of control variables.
Our findings are important in that they demonstrate path dependence in the number of women
in the economics profession and thus contribute to our understanding of women’s segregation across
academic fields. A large body of research looking into gender segregation across institutions can
be found in sociology, psychology and, because of Title VII and its legal implications, even law.3
Economic research has acknowledged the role of gender in shaping identity and hence segregation
3See, for example, Carrington and Troske (1995), Petersen and Morgan (1995), Reskin et al. (1999), and Miner-Rubino et al. (2009).
3
and group formation (Akerlof and Kranton, 2005; Boschini and Sjgren, 2007) and gender segrega-
tion and wage differences across occupations, industries, and establishments (Bayard et al., 2003).
Altonji and Blank (1999) provide a survey of literature addressing various aspects of labor market
discrimination by gender.
Most closely related to our work are papers describing gender differences in academic career
paths of economists, starting with Kahn (1993), who documented gender differences in some as-
pects of the career progressions of PhD economists. Similarly, McDowell et al. (1999) show that
promotions of women are inferior to those of men, but have improved over time. More recently,
Ginther and Kahn (2004) still find gender gaps in promotions of economists, even after controlling
for supply-side factors such as publications and fertility choices. Ours is the first paper that studies
the gender composition of graduate students in economics, however Attiyeh and Attiyeh (1997)
study gender differences in admissions to PhD programs in all fields and find that, controlling for
quality, it is easier for women to gain admission. Attiyeh and Attiyeh (1997) do not study the
determinants of the gender composition of the graduate student body.
We also contribute to the more general literature on gender bias by demonstrating a causal
effect that a larger share of female faculty has on the share of women that enter a PhD program.
Moreover, our evidence is based on market outcomes while previous literature, with the exception
of Zinovyeva and Bagues (2010), had to resort to experiment-based analysis due to difficulties
in identification (Neumark, 1996; Goldin and Rouse, 2000). Zinovyeva and Bagues (2010) use a
natural experiment of randomized assignment of faculty to promotion committees in academia to
study the effect of the gender composition of the committee on the differences in female and male
promotion outcomes.4
In Section 2 we describe our data sources and the trends, in Section 3 we present our empirical
approach and results, and in Section 4 we offer some concluding thoughts.
4Their results are mixed, but some of them are consistent with ours in that they suggest that women may beadvocating for female promotions.
4
2 Data
Our data set contains information on all ladder faculty and graduating students from ten of the
top economics departments in the United States over the years 1983 to 2007. We know the gender
composition of both faculty and students, as well as full academic history of all faculty, including
employment, tenure and publications throughout their careers.
2.1 Data description
2.1.1 Data sources
Our faculty data were collected based on faculty lists from 1983 to 2007 of ten top economics
departments.5 For each faculty member who appears in the data set, we recorded the gender,
rank, and tenure status. Tracking curriculum vitae for each individual who was newly hired during
these 25 years we obtained further information regarding his or her PhD institution and year of
graduation, together with yearly data regarding his or her career path, including the rank and
tenure status at each institution since graduation.
We further augmented this data set with publication history. To do this, we obtained the
number of publications up to a given year for each faculty member in our data set using Harzing’s
Publish or Perish engine, which itself is based on Google Scholar search.6
Our source for the graduating students data is the National Science Foundation Survey of
Earned Doctorates, which is conducted annually by the University of Chicago National Opinion
Research Center. The survey compiles data on all earned doctorates granted by regionally accred-
ited U.S. universities, in all fields, and contains information on race and gender of graduates.
For each university in our sample we examined the gender composition of the graduating PhD
5Choice of universities was dictated by data availability. The following institutions provided faculty lists for allyears: Berkeley, Chicago, Harvard, MIT, NYU, Northwestern, Penn, Princeton, UCLA and Yale.
6We are limited to publication data, and not quality-adjusted measures such as citations, since the date of citationis generally unknown.
5
class in economics. We used this data source further to construct measures of minority attitudes
at the university and department levels. We computed the share of non-whites in the economics
graduating class as a measure of minority bias at the department level,7 and the share of graduating
women in all the departments except economics to measure institutional gender preferences. We lag
these measures by six years to reflect the minority and gender attitudes in the year these graduate
students were admitted to the university.
For the analysis of the gender composition of the entering PhD class, we matched the faculty
and student data by institution and year of admission decision. We assumed decisions were made six
years prior to graduation.8 As student data is available through 2006, and because we lose a couple
of initial years in the data because of the lags, we end up with 140 institution-year observations for
the analysis of admissions in ten institutions.
2.2 Trends
Figure 1 presents the shares of female faculty and female entering graduate students for each
institution over time. We can make two main observations regarding the share of female faculty.
First, we see that the share of female faculty increased steadily in all institutions with the exception
of the University of Pennsylvania, where it actually went down from 9 percent in 1983 to about
5 percent in recent years. Second, there is considerable variation in the share of women on the
faculty across institutions and in trends in that share across institutions. For instance, the share
of women in UC Berkeley was already high in 1983, compared to the rest of the sample, and only
increased slightly over our sample period, while the share of women on the economics faculty at
MIT and UCLA increased steadily.
Despite the average growth, the share of female faculty remains rather low across all depart-
ments in our sample, only reaching over 20 percent in two observations — UCLA in 2004 and
7Our results are robust to using the share of non-white and non-Asian students instead.8Since we do not have attrition data by institution-year, our data are more accurately described as the ex post
successful PhD entering class.
6
2005.9 The share of female students in our sample is as high as 50 percent in one observation, but
is mostly below 40 percent. Appendix Tables 1 and 2 provides the shares of women among faculty
and students, respectively, by institution and year. For the share of women in the PhD class, we
report raw data, by the graduation year.
3 Empirical Analysis
3.1 Relationship between female share of faculty and students
We begin our analysis by studying simple correlations between the share of female faculty and the
share of women in the entering PhD class. Because both shares tend to increase over time, as we
saw before, in all our analysis we control for annual time fixed effects. Table 1 presents results of
our ordinary least squares (OLS) regression analysis, in which we estimate the following equation
STUDENTSit = �t + � FACULTYit + Z′it + "it, (1)
where STUDENTSit, our dependent variable, is the share of women in the PhD class graduating
from the economics department of university i in year t + 6, meaning that they were likely to be
admitted into the program in year t; �t is a set of year fixed effects, where year stands for the
calendar year in which the academic year begins; FACULTYit is the share of women on a ladder
faculty of the economics department in university i in year t; Zit is the set of additional control
variables, including institution fixed effects, which we gradually add to the regression, as described
below, "it is assumed to be i.i.d. The coefficient � is our coefficient of interest and it measures the
change of female faculty share, in percentage points, associated with a 1 percentage point increase
in the share of women on the faculty of the corresponding department.
Column (1) of Table 1 reports the regression with just time fixed effects as control variables.
9For more recent trends that are based on the survey of a larger number of economics departments, see Fraumeni(2011).
7
We find that there is a positive and statistically significant correlation between the share of female
faculty and the share of women entering the PhD program that is not due to a common trend in
the two variables.
In column (2) we add institution fixed effects to absorb time-invariant differences across insti-
tutions. The omitted institution is UC Berkeley. It appears that on average the share of women
in the entering PhD class is not statistically different across institutions, with the exception of
NYU, where the share of women is higher. We will see from further analysis that controlling for
additional factors will make this effect insignificant. On the other hand, adding control variables
shows that the conditional mean of share of female PhD students is higher for MIT than it is for
other economics departments.
With institution fixed effects we find that our coefficient of interest increases, suggesting that
time-invariant differences actually account for a negative correlation between shares of women on
the faculty and in the entering PhD class. The magnitude of the � coefficient is just above 1,
suggesting that for every 1 percentage point increase in the share of female faculty, the share of
women in the entering PhD class increases by 1 percentage point as well. In our sample, the
standard deviation of the female faculty share is 5 percentage points and the mean is 8, while the
standard deviation of the female share in the entering PhD class is 11 percentage points with the
mean of 25. Thus, the coefficient of 1 shows that one standard deviation increase in the female
faculty share is associated with about a one-half standard deviation increase in the share of women
in the entering PhD class.
In the remaining columns we add variables that we think may explain both the share of women
on the faculty and the gender composition of the entering PhD class. In column (3) we add the
department size, measured as the number of ladder faculty. It does not enter significantly, which is
not altogether surprising given that we continue to include institution fixed effects. Our coefficient
of interest remains almost the same.
In column (4) we add a university-wide measure of gender preferences, which is the overall
8
share of female students entering a PhD program in all departments in a given university, excluding
the economics department, and a measure of the minority attitude of the economics department
measured as a share of non-white students in the incoming PhD cohort. These measures are
meant to capture time-varying university-wide gender preferences and department-specific minority
attitudes that may affect both the share of women on the faculty and the share of women in the
entering PhD class and thus capture some of the correlation between these two shares that is due to
common factors. We find a positive effect of both of these measures, but only the effect of minority
attitude in the economics department is statistically significant. Additional controls in the following
columns increase the effect of university-wide gender preferences, making it statistically significant.
These two measures, however, only capture a small portion of the correlation between female shares
— our coefficient of interest only declines by a small amount.
In column (5) we control for the quality of the male and female faculty in the institution,
using information on the number of publications by each individual faculty member. Time-varying
changes in the quality of the department may be responsible for creating the correlation between
share of female faculty and share of female students if admissions and hiring standards change when
the quality of the department changes and if women on average have different qualifications than
men. We find, however, that these control variables don’t have a significant effect on the share of
women entering the PhD program and do not significantly affect our coefficient of interest.
Finally, in column (6) we test whether the correlation between female faculty share and female
student share could be due to the influence of senior female faculty. To do this, we construct the
share of women among senior faculty members, that is those who graduated more than six years
ago (older female faculty share), and the share of women among junior faculty, that is those who
graduated six or fewer years ago (younger female faculty share). We expect that inasmuch as senior
faculty are more influential in admissions decisions, the share of women among senior faculty will
have a larger effect on the gender composition of the entering PhD class than the share of women
among junior faculty. Indeed, we find such an effect — the effect of the older female faculty share
is almost five times as high as that of the younger female faculty share, and the difference between
9
the two coefficients is significant at a 5 percent confidence level.
These results are robust to including additional control variables and to different specifications,
reported in Appendix Table 3. First, we add to our control variables the share of all faculty in the
“female-friendly” fields, that is, fields in which we observe larger shares of women among faculty.
We define female-friendly fields (fff) as fields in which the average share of women in our sample
is higher than the overall sample average across all fields, which is 13 percent. According to this
definition, labor, development and growth, as well as non-mainstream fields are female-friendly.10
We believe the share of all faculty in these fields might be an important source of spurious correlation
because departments with a larger share of such fields may attract more women both to their faculty
and to their graduate student bodies. We find that the coefficient of this variable is not statistically
significant, and our coefficient of interest remains unchanged.
Next we control for the number of students in the incoming PhD class. The size of the incoming
PhD class may be correlated with the share of female faculty through different admission standards
or because women admitted to PhD programs may choose to go to departments with a larger share
of female faculty thus increasing the size of the class that is entering for a given number of students
admitted. We find, however, that the effect of the class size is not statistically significant, and
including this variable among our controls does not affect our results.
Next we test whether our results are robust to different specifications of regression. First, we
replace the set of year fixed effects with a time trend and find that our results are not affected by
this change. Moreover, while we find that the coefficient on the time trend is positive, it is not
significantly different from zero.
We next test for non-linear effects of the share of female faculty.11 We do so by interacting
the continuous variable of the main specification with a set of four dummy variables: one that is
10Non-mainstream fields are: General Economics and Teaching; History of Economic Thoughts; Health, Education,and Welfare Economics; Business Administration; Economic History; Agricultural, Resource and EnvironmentalEconomics; Urban and Regional Economics; and Other Special Topics.
11Gagliarducci and Paserman (2009) find such non-linear effects of gender composition in the context of munici-palities’ gender composition and the likelihood that a female mayor survives her full term.
10
equal to 1 if the share of female faculty is less than 5 percent, one for the share of female faculty
between 5 and 10 percent, one for the share of female faculty between 10 and 15 percent, and
finally for the share of female faculty greater than 15 percent. We find that the effect of the female
faculty share is higher when the share of females is really low, although the effect is not precisely
estimated because of the small number of cases when the share of female faculty is that low. The
effect of female faculty share declines as the share increases, although statistically the effects are
not estimated precisely enough to be different from one another. The four interactions are jointly
significant at the 2 percent level according to the F-test.
Finally, we want to test whether our results are driven by newly hired women on the faculty.
If that were the case, we would worry that the correlation we find is driven by overall time-varying
gender attitudes of the department which would lead to a higher share of women on the faculty
and a higher share of students in the entering PhD class. To test for this possibility we split the
overall female faculty share into the share of new female faculty (that is, the number of women
who were hired by the department six or fewer years ago over the department size) and the share
of seasoned female faculty (women hired more than six years ago over the department size). We
find that the share of seasoned female faculty has the same effect on the gender composition of the
incoming PhD class as the share of new female faculty, indicating that the results are unlikely to
be driven by the time-varying gender bias that could create contemporaneous correlation between
the share of women hired and the share admitted to the graduate program.
3.2 Causal effects
The above analysis rules out some of the potential sources of spurious correlation between the
share of women on the faculty and in the incoming PhD cohort, such as common trends, all
omitted variables that do not vary over time, university-wide gender attitudes, department-specific
minority attitudes, and department quality. Nevertheless, we cannot be sure that the correlation
we find between the two shares reflects a causal effect that a larger share of women on the faculty
11
may have on the gender composition of the incoming PhD class. As we discussed before, such
causal effects could be due to women’s preferences to work with women, to female faculty advocacy
for admission of larger numbers of women, or to the decline in gender bias due to an increase in
the share of women on the faculty. While our data do not allow us to distinguish between these
mechanisms, they do allow us to establish causality with the use of the instrumental variables (IV)
analysis.
Our instrumental variable for the female faculty share is the number of male faculty that left
the department in the year prior and two years prior. The number of exiting male faculty has a
mechanical positive effect on the share of female faculty by lowering the denominator of the share
without affecting the numerator. We use two lags because in our data it appears that it takes
two years or more to replace exiting faculty. While exits of individual faculty members may affect
decisions of individual prospective PhD students when they choose which department to go to, it
is unlikely that the number of resigning male faculty has a direct effect on the gender composition
of the incoming PhD class one or two years after they resign. Appendix Table 4 gives the total
number of male and female exits in our sample.
Table 2 presents the results of our IV analysis. The first two columns report the results of
the first and second stages, respectively, of the IV regression, while column (3) reports the results
of the reduced-form regression. Specifically, we estimate, by two-stage least squares (2SLS), the
following system
FACULTYit = �t + �i + �1EXIT MALEit−1 + �2EXIT MALEit−2 + Z′it� + "1it, (2)
STUDENTSit = �t + �i + � ˆFACULTY it + Z′it + "2it, (3)
where �i is a set of institution fixed effects, EXIT MALEit−1 is the number of male faculty
member that announced their resignation as late as year t − 1 and are no longer members of the
department in year t, ˆFACULTY it is the fitted value of FACULTYit from the first stage, Z is the
12
same set of control variables as in column (5) of Table 1. We also estimate a reduced form equation
STUDENTSit = �t + �i + �1EXIT MALEit−1 + �2EXIT MALEit−2 + Z′it + "3it. (4)
In the first column of Table 2 we report the results of our first stage. Institution fixed effects
are included in all regressions, but are not individually reported in the interest of space. We find
that both lags of our instrumental variable have positive and statistically significant effects on the
share of female faculty, as we expected, with the second lag having a smaller effect, although not
statistically different from the effects of the first lag.
Column (2) of Table 2 reports our main results on causality — the second stage of the IV
regression. We find that the effect of instrumented female faculty share on share of women in the
entering PhD class is positive and statistically significant. The coefficient of interest is larger than
in our main specification, which may be due to one of two factors. First, it is possible that time-
varying spurious correlation removed by using the IV approach is negative, much like the correlation
that is absorbed by institution fixed effects. Second, a measurement error in the OLS regression
could be causing attenuation bias. Finally, this coefficient, although larger, is not statistically
different from the one in the benchmark OLS regression. The effects of all our control variables
remain the same as in the OLS specification, with the exception of the effect of quality of female
faculty, which is now statistically significant.
We test for the validity of our instruments using standard tests. We find that hypotheses of
irrelevance, underidentification or overidentification are strongly rejected by Anderson LR, Cragg-
Donald, and Sargan tests, respectively. We cannot, however, reject the hypothesis of weak instru-
ments: the partial R2 of the instruments is only 0.07, the F-statistic is 4.2 with P-value of 0.017,
which only passes the 5 percent Wald test for weak instruments at the 25 percent critical value
in case of limited information maximum likelihood (LIML) estimation. We therefore compute the
Anderson-Rubin test statistic of the significance of endogenous regressor in the main equation, the
female faculty share, which is robust in the presence of weak instruments (Stock et al., 2002). We
13
find that the P-value of the �2 test is 0.002, rejecting the hypothesis of no effect of female faculty
share on the female student share at the 1 percent confidence level. We also report in column (3)
the reduced form regression which demonstrates positive effects of both lags of our instrumental
variable on the share of female students in the entering PhD class, with the second lag effect being
statistically significant and both lags being jointly significant at the 1 percent level.
Columns (4) to (6) of Table 2 report the second-stage results of k-class estimations that have
been shown to improve upon the 2SLS approach in the presence of weak instruments.12 In all cases
our result of positive and statistically significant effect of the share of female faculty on the share of
women in the entering PhD class remains unchanged. Column (4) reports the results of the LIML
estimation, column (5) reports the results of the Fuller’s modified LIML estimation with parameter
set to 1, and column (6) reports Nagar’s bias-adjusted 2SLS estimation. In all of these tests we
find that the coefficient on our variable of interest remains positive and statistically significant at
the 5 percent level, indicating that our main result is not due to the weakness of the instruments.
Next we test the assumption that male exits are exogenous to the share of female faculty.
Appendix Table 5 reports in column (1) the results of the regression of male exits on the contem-
poraneous share of women on the faculty and all of our control variables. We find that the share
of women on the faculty does not predict male exits in the same year, meaning that lagged male
exits are strictly exogenous with respect to the female faculty share.
We find that our results are not sensitive to the choice of covariates, as reported in Appendix
Table 6 columns (1) to (3), and to the choice of alternative instrumental variables, reported in
columns (4) and (5). Even though we showed before that statistically we cannot reject that male
exits are exogenous, potential concerns remain that the share of women on the faculty may induce
some male faculty to change departments. Exits can be separated into lateral moves within the
top-ten departments in our sample and into moves out of the set of the top ten departments. The
latter are likely due to exits that are driven by tenure denial or to retirements. Retirements tend
12See Stock et al. (2002) and references therein.
14
to be expected and frequently new faculty are hired in anticipation; as a result, exits of males
due to retirement are unlikely to have an effect on female faculty share.13 We therefore use as an
alternative instrument the number of exits of young male faculty (those that graduated six or fewer
years ago) out of the top-ten departments, reported in Appendix Table 4. As an alternative, we
use the number of all exits by young male faculty. The results reported in columns (4) and (5) of
Appendix Table 6 show that our conclusions are not sensitive to these alternative instruments.
Finally, we address the concern that male exits may be driven by unobservable time-varying,
department-specific characteristics which are also related to gender preferences. To do so, we predict
the likelihood that each individual male exits his department by using only age and publication
data. Since a young male’s likelihood of leaving his department decreases with publications and
age, while an older male’s likelihood of leaving his department increases with age, we separately
estimate the following stage zero equations for young males, who earned their PhD during the past
6 years, and seasoned males, who are at least 7 years post graduation,
Exit Y oung Malek = �+ �1Agek + �2Publicationsk + "1k, (5)
Exit Seasoned Malek = �+ �3Agek + "2k. (6)
We then calculate the predicted number of exits by institution and year by summing the predicted
exits from the stage zero regression conducted at the individual level, and by adding both young
and seasoned male exits,
ˆExit MALEit =∑
k
ˆExit Y oung Malekit + ˆExit Seasoned Malekit. (7)
Since this predicted number of exits only uses the age and publication data, it is free of any
endogeneity concern, and is therefore a perfect instrument.
In columns (1) and (2) of Appendix Table 7 we presents the results from the above stage zero
13Indeed, we find no statistically significant effect of exits of older male faculty out of the top-ten departments.
15
regressions, as run on 7786 person-year observations of male faculty in our top-10 departments
between the years 1983 to 2007. Indeed, age is positively correlated with exits for older males, but
negatively correlated with exits for younger males. In column (3) we can see that the predicted
number of male exits constructed is strongly and negatively correlated with the share of female
faculty (the F statistic is 175). Because male exits indicate the last year a male is at the department,
and since we are using institution fixed effects, a high number of exits in the next year are indicative
of a high number of males to females in the current year, relative to the institution average. This
explains the negative coefficient on the predicted male exits. Most importantly, in the second
stage (column (4)), the IV coefficient on the share of female faculty is 1.21 and significant at the
1 percent confidence level. This completes our demonstration of the causal relationship from the
share of female faculty to the share of female students.
4 Conclusion
Our results provide market-based evidence that a larger share of women on the economics faculty
of top universities has led to more female students entering economics PhD programs, above and
beyond such factors as secular time trends and differential gender preferences across universities
and over time. Thus, we provide an explanation for the continued segregation across academic
fields that has been well documented in the press and the academic literature: It is no surprise that
academic disciplines with very few women on faculty of top universities attract fewer women into
their academic programs.
Whether our results are due to female students’ preference for female advisors, to female
faculty gender advocacy, or to diminishing gender bias associated with a higher share of females on
the faculty, they indicate that gender segregation across disciplines is likely to be persistent. Our
results imply that affirmative action-type policies and programs may be very effective in producing
a long-lasting and persistent increase in the share of women in the targeted discipline.
16
References
Akerlof, George A. and Rachel E. Kranton, “Identity and the Economics of Organizations,”
Journal of Economic Perspectives, Winter 2005, 19 (1), 9–32.
Altonji, Joseph G. and Rebecca M. Blank, “Chapter 48 Race and gender in the labor market,”
in Orley C. Ashenfelter and David Card, eds., , Vol. 3, Part 3 of Handbook of Labor Economics,
Elsevier, 1999, pp. 3143 – 3259.
Attiyeh, Gregory and Richard Attiyeh, “Testing for Bias in Graduate School Admissions,”
Journal of Human Resources, Summer 1997, 32 (3).
Bayard, Kimberly, Judith Hellerstein, David Neumark, and Kenneth Troske, “New
Evidence on Sex Segregation and Sex Differences in Wages from Matched Employee-Employer
Data,” Journal of Labor Economics, October 2003, 21 (4), 887–922.
Beaman, Lori, Raghebendra Chattopadhyay, Esther Duflo, Rohini Pande, and Petia
Topalova, “Powerful Women: Does Exposure Reduce Bias?,” Working Paper Series rwp08-
037, Harvard University, John F. Kennedy School of Government July 2008.
Bettinger, Eric and Bridget Terry Long, “Do College Instructors Matter? The Effects of
Adjuncts and Graduate Assistants on Students’ Interests and Success,” NBERWorking Papers
10370, National Bureau of Economic Research, Inc March 2004.
Blau, Francine D., Janet M. Currie, Rachel T.A. Croson, and Donna K. Ginther, “Can
Mentoring Help Female Assistant Professors? Interim Results from a Randomized Trial,”
NBER Working Papers 15707, National Bureau of Economic Research, Inc January 2010.
Boschini, Anne and Anna Sjgren, “Is Team Formation Gender Neutral? Evidence from Coau-
thorship Patterns,” Journal of Labor Economics, 2007, 25, 325–365.
Carrington, William J. and Kenneth R. Troske, “Gender Segregation in Small Firms,” The
Journal of Human Resources, 1995, 30 (3), 503–533.
17
Fraumeni, Barbara M., “Report of the Committee on the Status of Women in the Economics
Profession 2010,” American Economic Review, May 2011, 101 (3), 731–736.
Gagliarducci, Stefano and M. Daniele Paserman, “Gender Interactions within Hierarchies:
Evidence from the Political Arena,” Working Paper 14893, National Bureau of Economic
Research April 2009.
Ginther, Donna K. and Shulamit Kahn, “Women in Economics: Moving Up or Falling Off the
Academic Career Ladder?,” Journal of Economic Perspectives, Summer 2004, 18 (3), 193–214.
Goldin, Claudia, Understanding the Gender Gap: An Economic History of American Women
number gold90-1. In ‘NBER Books.’, National Bureau of Economic Research, Inc, 1990.
and Cecilia Rouse, “Orchestrating Impartiality: The Impact of "Blind" Audi-
tions on Female Musicians,” American Economic Review, September 2000, 90 (4), 715–741.
Hilmer, Christiana E. and Michael J. Hilmer, “On the Relationship between the Student-
Advisor Match and Early Career Research Productivity for Agricultural and Resource Eco-
nomics Ph.D.s,” American Journal of Agricultural Economics, 2007, 89 (1), 162–175.
Hoffmann, Florian and Philip Oreopoulos, “A Professor Like Me: The Influence of Instructor
Gender on College Achievement,” Journal of Human Resources, 2009, 44 (2).
Kahn, Shulamit, “Gender Differences in Academic Career Paths of Economists,” American Eco-
nomic Review, May 1993, 83 (2), 52–56.
McDowell, John M., Larry D. Singell Jr., and James P. Ziliak, “Cracks in the Glass
Ceiling: Gender and Promotion in the Economics Profession,” American Economic Review,
May 1999, 89 (2), 392–396.
Miner-Rubino, Kathi, Isis H. Settles, and Abigail J. Stewart, “More than numbers: Indi-
vidual and contextual factors in how gender diversity affects women’s well-being,” Psychology
of Women Quarterly, November 2009, 33 (4), 463–474.
18
Neumark, David, “Sex Discrimination in Restaurant Hiring: An Audit Study,” The Quarterly
Journal of Economics, August 1996, 111 (3), 915–41.
and Rosella Gardecki, “Women Helping Women? Role Model and Mentoring Effects on
Female Ph.D. Students in Economics,” Journal of Human Resources, Winter 2003, 33 (1),
220–246.
Petersen, Trond and Laurie A. Morgan, “Separate and Unequal: Occupation-Establishment
Sex Segregation and the Gender Wage Gap,” American Journal of Sociology, 1995, 101 (2),
329.
Reskin, Barbara F., Debra B. McBrier, and Julie A. Kmec, “The Determinants and
Consequences of Workplace Sex and Race Composition,” Annual Review of Sociology, 1999,
25, 335–361.
Stock, James H., Jonathan H. Wright, and Motohiro Yogo, “A Survey of Weak Instru-
ments and Weak Identification in Generalized Methods of Moments,” Journal of Business and
Economic Statistics, October 2002, 20 (4), 518–529.
Zinovyeva, Natalia and Mauael F. Bagues, “Does gender matter for academic promotion?
Evidence from a randomized natural experiment,” Discussion paper 5537, IZA 2010.
19
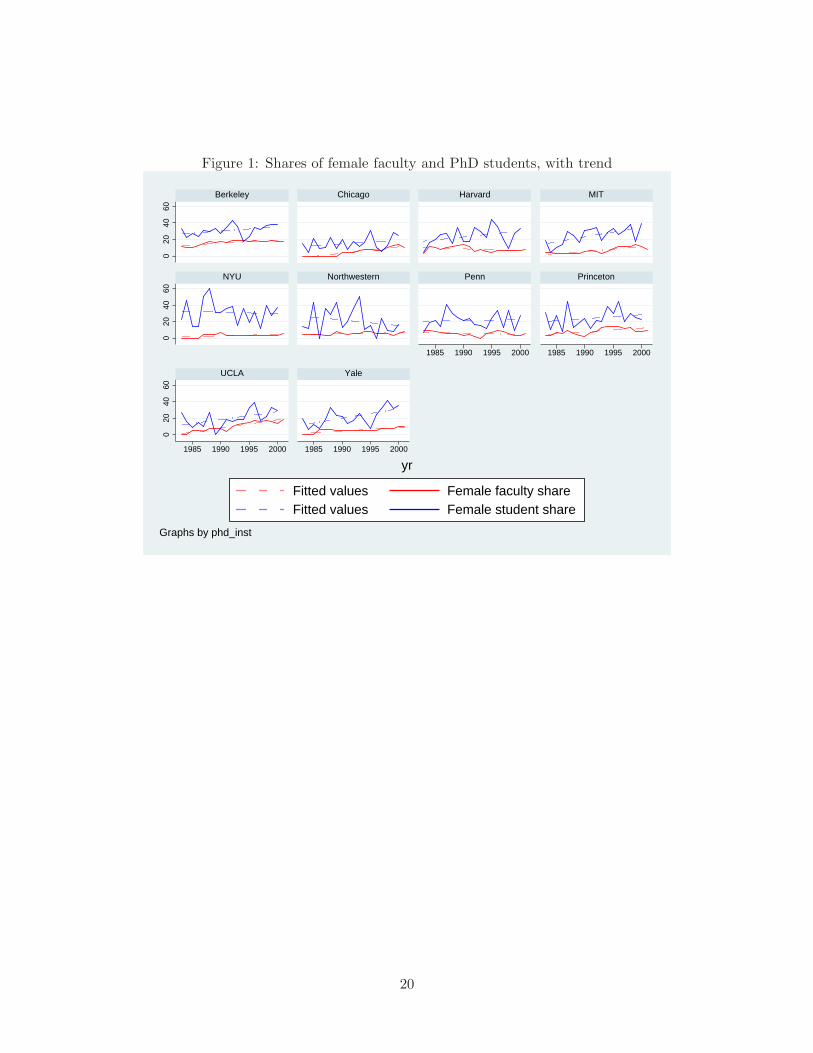
Figure 1: Shares of female faculty and PhD students, with trend0
2040
600
2040
600
2040
60
1985 1990 1995 2000 1985 1990 1995 2000
1985 1990 1995 2000 1985 1990 1995 2000
Berkeley Chicago Harvard MIT
NYU Northwestern Penn Princeton
UCLA Yale
Fitted values Female faculty shareFitted values Female student share
yr
Graphs by phd_inst
20
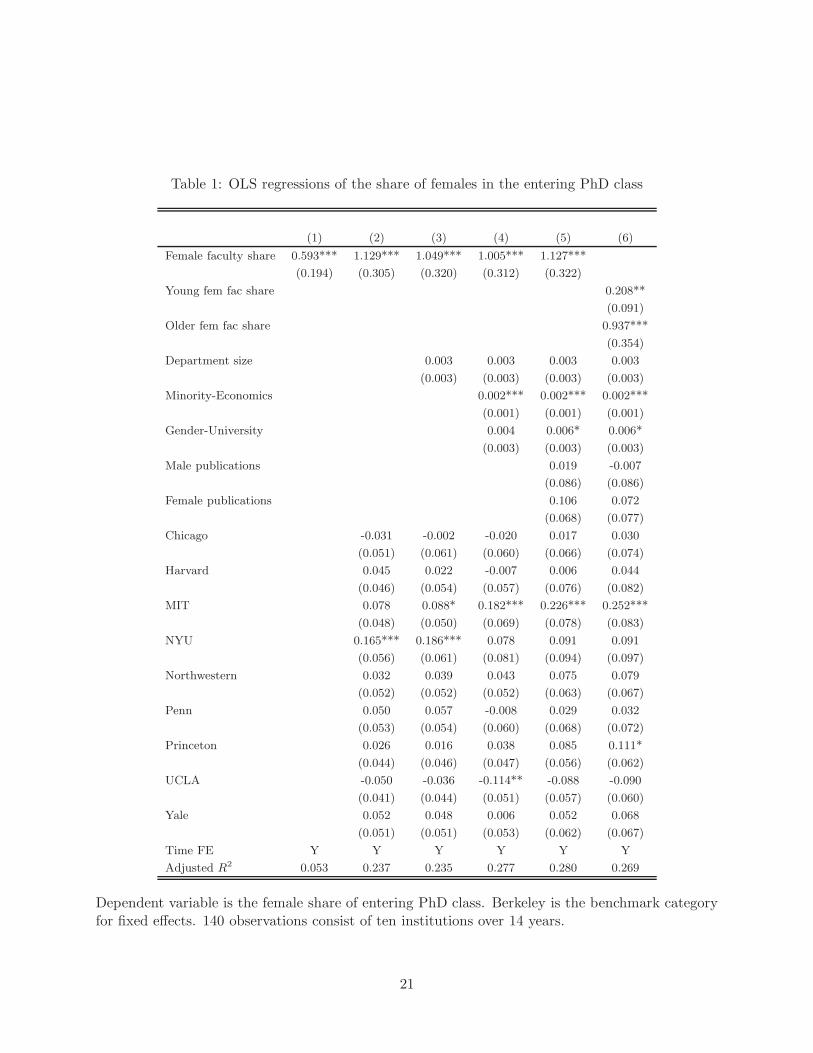
Table 1: OLS regressions of the share of females in the entering PhD class
(1) (2) (3) (4) (5) (6)
Female faculty share 0.593*** 1.129*** 1.049*** 1.005*** 1.127***
(0.194) (0.305) (0.320) (0.312) (0.322)
Young fem fac share 0.208**
(0.091)
Older fem fac share 0.937***
(0.354)
Department size 0.003 0.003 0.003 0.003
(0.003) (0.003) (0.003) (0.003)
Minority-Economics 0.002*** 0.002*** 0.002***
(0.001) (0.001) (0.001)
Gender-University 0.004 0.006* 0.006*
(0.003) (0.003) (0.003)
Male publications 0.019 -0.007
(0.086) (0.086)
Female publications 0.106 0.072
(0.068) (0.077)
Chicago -0.031 -0.002 -0.020 0.017 0.030
(0.051) (0.061) (0.060) (0.066) (0.074)
Harvard 0.045 0.022 -0.007 0.006 0.044
(0.046) (0.054) (0.057) (0.076) (0.082)
MIT 0.078 0.088* 0.182*** 0.226*** 0.252***
(0.048) (0.050) (0.069) (0.078) (0.083)
NYU 0.165*** 0.186*** 0.078 0.091 0.091
(0.056) (0.061) (0.081) (0.094) (0.097)
Northwestern 0.032 0.039 0.043 0.075 0.079
(0.052) (0.052) (0.052) (0.063) (0.067)
Penn 0.050 0.057 -0.008 0.029 0.032
(0.053) (0.054) (0.060) (0.068) (0.072)
Princeton 0.026 0.016 0.038 0.085 0.111*
(0.044) (0.046) (0.047) (0.056) (0.062)
UCLA -0.050 -0.036 -0.114** -0.088 -0.090
(0.041) (0.044) (0.051) (0.057) (0.060)
Yale 0.052 0.048 0.006 0.052 0.068
(0.051) (0.051) (0.053) (0.062) (0.067)
Time FE Y Y Y Y Y Y
Adjusted R2 0.053 0.237 0.235 0.277 0.280 0.269
Dependent variable is the female share of entering PhD class. Berkeley is the benchmark categoryfor fixed effects. 140 observations consist of ten institutions over 14 years.
21
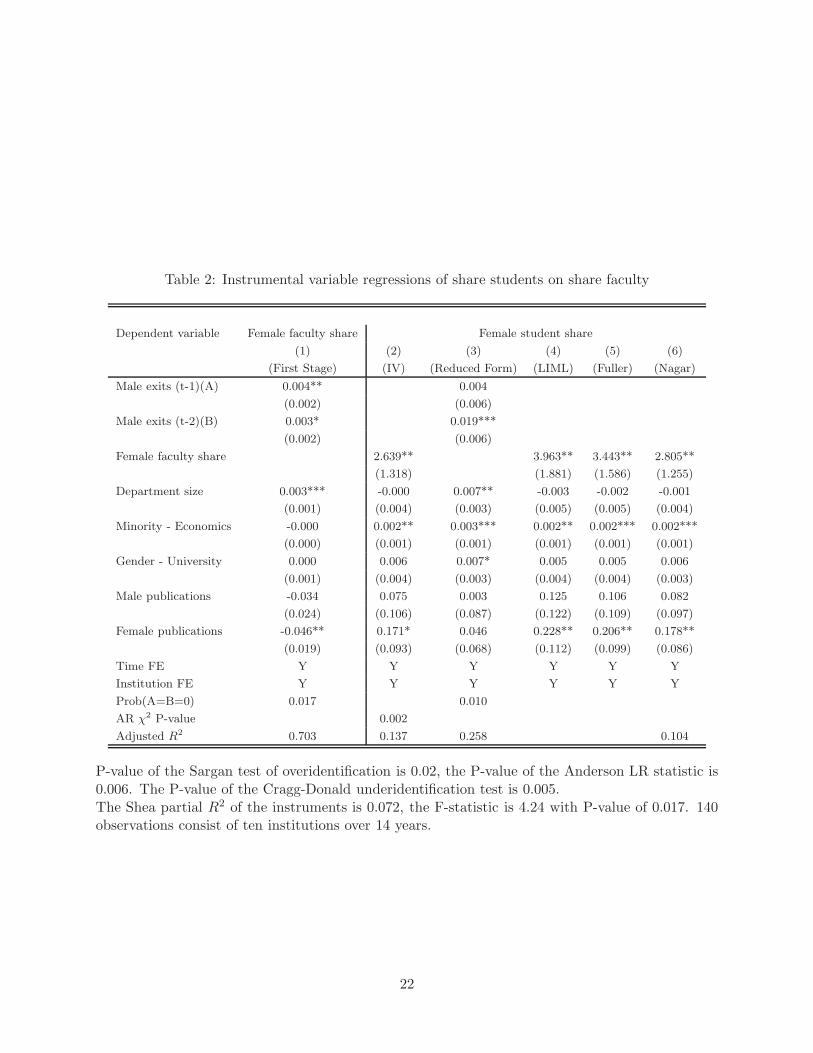
Table 2: Instrumental variable regressions of share students on share faculty
Dependent variable Female faculty share Female student share
(1) (2) (3) (4) (5) (6)
(First Stage) (IV) (Reduced Form) (LIML) (Fuller) (Nagar)
Male exits (t-1)(A) 0.004** 0.004
(0.002) (0.006)
Male exits (t-2)(B) 0.003* 0.019***
(0.002) (0.006)
Female faculty share 2.639** 3.963** 3.443** 2.805**
(1.318) (1.881) (1.586) (1.255)
Department size 0.003*** -0.000 0.007** -0.003 -0.002 -0.001
(0.001) (0.004) (0.003) (0.005) (0.005) (0.004)
Minority - Economics -0.000 0.002** 0.003*** 0.002** 0.002*** 0.002***
(0.000) (0.001) (0.001) (0.001) (0.001) (0.001)
Gender - University 0.000 0.006 0.007* 0.005 0.005 0.006
(0.001) (0.004) (0.003) (0.004) (0.004) (0.003)
Male publications -0.034 0.075 0.003 0.125 0.106 0.082
(0.024) (0.106) (0.087) (0.122) (0.109) (0.097)
Female publications -0.046** 0.171* 0.046 0.228** 0.206** 0.178**
(0.019) (0.093) (0.068) (0.112) (0.099) (0.086)
Time FE Y Y Y Y Y Y
Institution FE Y Y Y Y Y Y
Prob(A=B=0) 0.017 0.010
AR �2 P-value 0.002
Adjusted R2 0.703 0.137 0.258 0.104
P-value of the Sargan test of overidentification is 0.02, the P-value of the Anderson LR statistic is0.006. The P-value of the Cragg-Donald underidentification test is 0.005.The Shea partial R2 of the instruments is 0.072, the F-statistic is 4.24 with P-value of 0.017. 140observations consist of ten institutions over 14 years.
22
A Appendix
Table A.1: Percent of female faculty by institution and year
Year Berkeley Chicago Harvard MIT NYU N-western Penn Princeton UCLA Yale Mean
1983 11.1 0.0 3.3 3.8 0.0 5.0 9.1 3.7 0.0 0.0 3.6
1984 10.7 0.0 11.1 3.8 0.0 4.8 8.7 3.6 0.0 0.0 4.3
1985 10.7 0.0 10.0 3.6 0.0 4.8 8.0 6.3 4.5 0.0 4.8
1986 12.5 0.0 8.1 3.4 0.0 4.2 6.5 5.7 4.5 5.7 5.1
1987 15.6 0.0 9.8 3.2 5.0 3.7 6.1 8.8 4.3 5.7 6.2
1988 17.1 0.0 11.4 3.1 4.8 3.2 6.1 5.6 8.0 5.7 6.5
1989 15.8 0.0 12.8 3.0 4.2 7.7 5.7 2.8 8.0 5.6 6.5
1990 17.1 4.0 14.3 5.9 6.7 5.1 2.8 2.3 7.1 4.7 7.0
1991 16.7 3.7 11.3 6.3 3.4 4.8 5.0 6.3 3.4 4.7 6.5
1992 19.0 4.0 5.8 5.9 3.1 5.4 2.6 8.2 9.7 5.0 6.9
1993 18.6 7.1 7.5 2.8 3.4 5.7 0.0 13.3 12.5 4.9 7.6
1994 18.6 7.4 5.9 5.7 3.3 8.6 5.3 14.0 13.9 5.3 8.8
1995 17.8 8.3 4.1 8.8 3.4 8.3 6.5 14.3 15.0 5.3 9.2
1996 18.6 6.9 6.5 11.1 3.3 6.1 9.7 14.6 17.1 5.3 9.9
1997 17.4 6.5 6.4 11.1 3.4 6.1 8.3 12.2 15.9 7.7 9.5
1998 17.8 10.0 7.0 11.4 3.1 6.1 5.6 13.0 17.1 7.1 9.8
1999 18.6 12.9 6.7 13.9 3.2 2.9 3.2 8.2 15.8 7.3 9.3
2000 17.8 13.8 6.1 11.4 3.4 5.7 2.9 8.2 14.0 9.5 9.3
2001 17.0 10.3 8.0 8.3 5.9 8.1 5.9 9.6 18.2 9.3 10.1
2002 17.6 6.9 8.3 8.3 7.7 12.8 5.9 9.8 19.0 9.3 10.6
2003 15.4 10.0 8.5 8.3 7.5 16.2 6.5 9.6 16.3 13.6 11.2
2004 14.5 10.3 10.9 8.3 7.1 14.3 3.6 10.0 21.4 15.6 11.6
2005 14.3 6.1 16.0 10.5 9.1 14.3 3.6 11.8 20.0 15.2 12.1
2006 11.8 6.1 17.0 12.8 8.9 12.5 3.8 12.0 18.2 15.6 11.8
2007 13.2 8.6 13.0 15.8 10.9 10.3 4.80 12.7 16.3 13.3 11.9
Mean 15.8 5.7 9.2 7.6 4.3 7.5 5.4 9.1 12.0 7.2 8.4
23
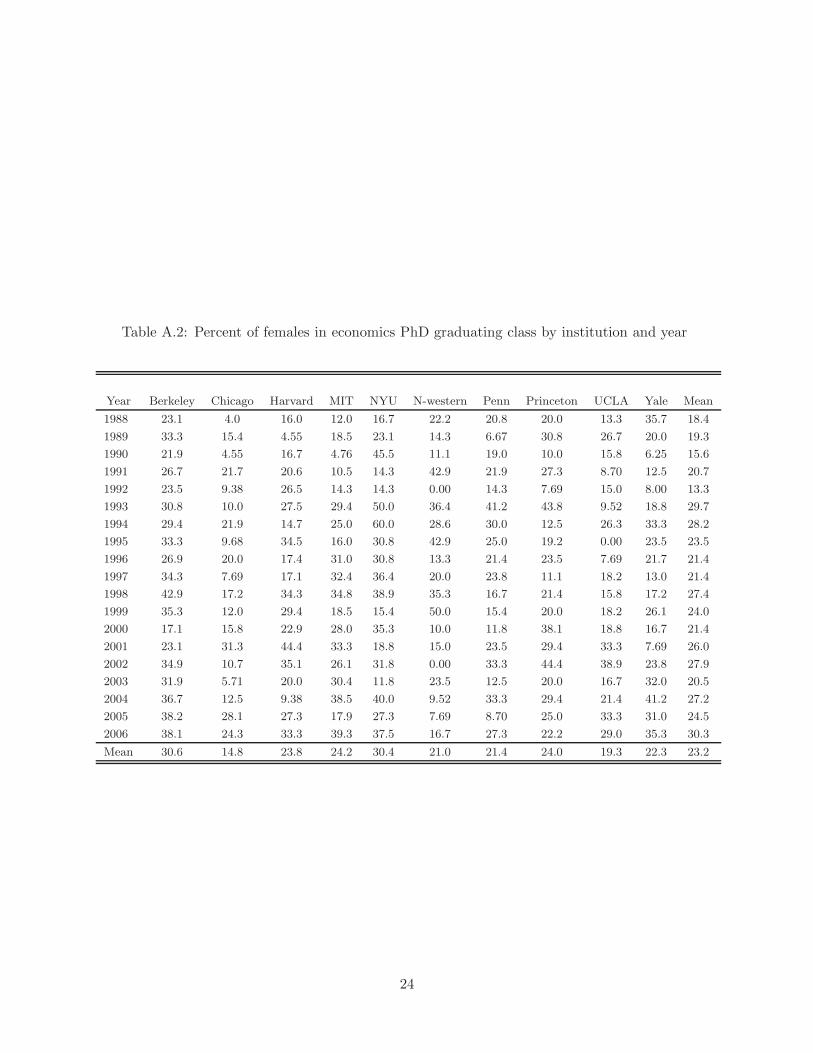
Table A.2: Percent of females in economics PhD graduating class by institution and year
Year Berkeley Chicago Harvard MIT NYU N-western Penn Princeton UCLA Yale Mean
1988 23.1 4.0 16.0 12.0 16.7 22.2 20.8 20.0 13.3 35.7 18.4
1989 33.3 15.4 4.55 18.5 23.1 14.3 6.67 30.8 26.7 20.0 19.3
1990 21.9 4.55 16.7 4.76 45.5 11.1 19.0 10.0 15.8 6.25 15.6
1991 26.7 21.7 20.6 10.5 14.3 42.9 21.9 27.3 8.70 12.5 20.7
1992 23.5 9.38 26.5 14.3 14.3 0.00 14.3 7.69 15.0 8.00 13.3
1993 30.8 10.0 27.5 29.4 50.0 36.4 41.2 43.8 9.52 18.8 29.7
1994 29.4 21.9 14.7 25.0 60.0 28.6 30.0 12.5 26.3 33.3 28.2
1995 33.3 9.68 34.5 16.0 30.8 42.9 25.0 19.2 0.00 23.5 23.5
1996 26.9 20.0 17.4 31.0 30.8 13.3 21.4 23.5 7.69 21.7 21.4
1997 34.3 7.69 17.1 32.4 36.4 20.0 23.8 11.1 18.2 13.0 21.4
1998 42.9 17.2 34.3 34.8 38.9 35.3 16.7 21.4 15.8 17.2 27.4
1999 35.3 12.0 29.4 18.5 15.4 50.0 15.4 20.0 18.2 26.1 24.0
2000 17.1 15.8 22.9 28.0 35.3 10.0 11.8 38.1 18.8 16.7 21.4
2001 23.1 31.3 44.4 33.3 18.8 15.0 23.5 29.4 33.3 7.69 26.0
2002 34.9 10.7 35.1 26.1 31.8 0.00 33.3 44.4 38.9 23.8 27.9
2003 31.9 5.71 20.0 30.4 11.8 23.5 12.5 20.0 16.7 32.0 20.5
2004 36.7 12.5 9.38 38.5 40.0 9.52 33.3 29.4 21.4 41.2 27.2
2005 38.2 28.1 27.3 17.9 27.3 7.69 8.70 25.0 33.3 31.0 24.5
2006 38.1 24.3 33.3 39.3 37.5 16.7 27.3 22.2 29.0 35.3 30.3
Mean 30.6 14.8 23.8 24.2 30.4 21.0 21.4 24.0 19.3 22.3 23.2
24
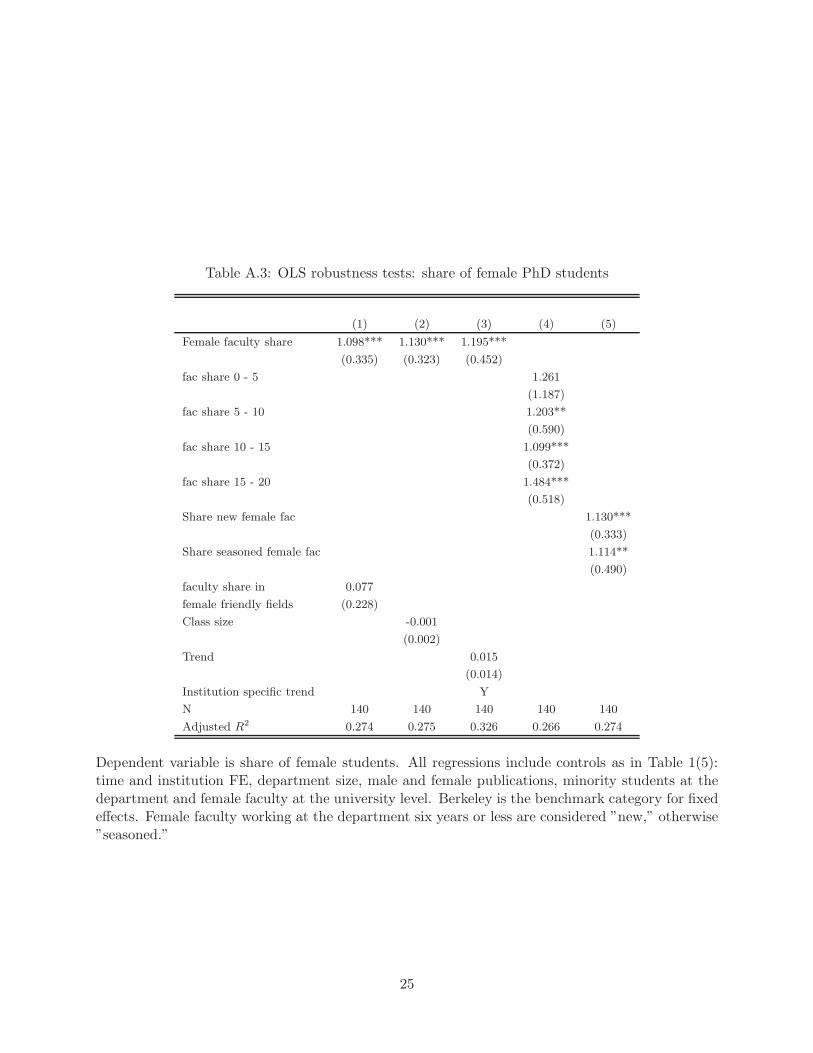
Table A.3: OLS robustness tests: share of female PhD students
(1) (2) (3) (4) (5)
Female faculty share 1.098*** 1.130*** 1.195***
(0.335) (0.323) (0.452)
fac share 0 - 5 1.261
(1.187)
fac share 5 - 10 1.203**
(0.590)
fac share 10 - 15 1.099***
(0.372)
fac share 15 - 20 1.484***
(0.518)
Share new female fac 1.130***
(0.333)
Share seasoned female fac 1.114**
(0.490)
faculty share in 0.077
female friendly fields (0.228)
Class size -0.001
(0.002)
Trend 0.015
(0.014)
Institution specific trend Y
N 140 140 140 140 140
Adjusted R2 0.274 0.275 0.326 0.266 0.274
Dependent variable is share of female students. All regressions include controls as in Table 1(5):time and institution FE, department size, male and female publications, minority students at thedepartment and female faculty at the university level. Berkeley is the benchmark category for fixedeffects. Female faculty working at the department six years or less are considered ”new,” otherwise”seasoned.”
25
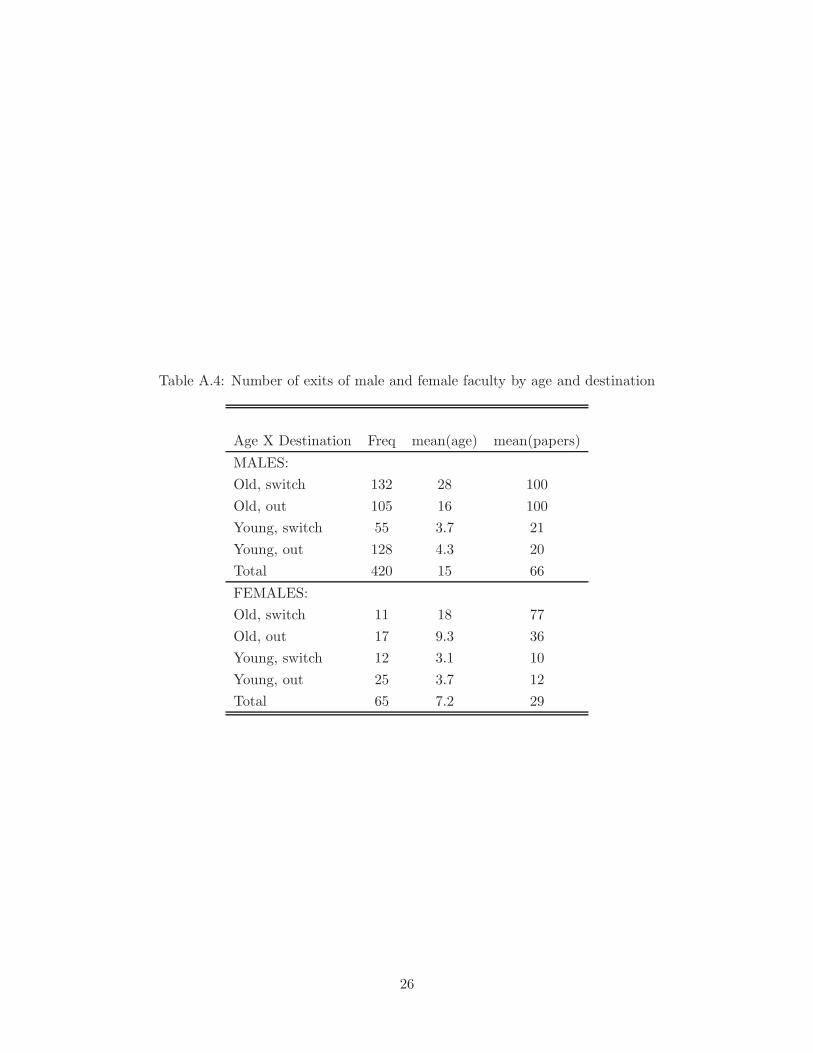
Table A.4: Number of exits of male and female faculty by age and destination
Age X Destination Freq mean(age) mean(papers)
MALES:
Old, switch 132 28 100
Old, out 105 16 100
Young, switch 55 3.7 21
Young, out 128 4.3 20
Total 420 15 66
FEMALES:
Old, switch 11 18 77
Old, out 17 9.3 36
Young, switch 12 3.1 10
Young, out 25 3.7 12
Total 65 7.2 29
26
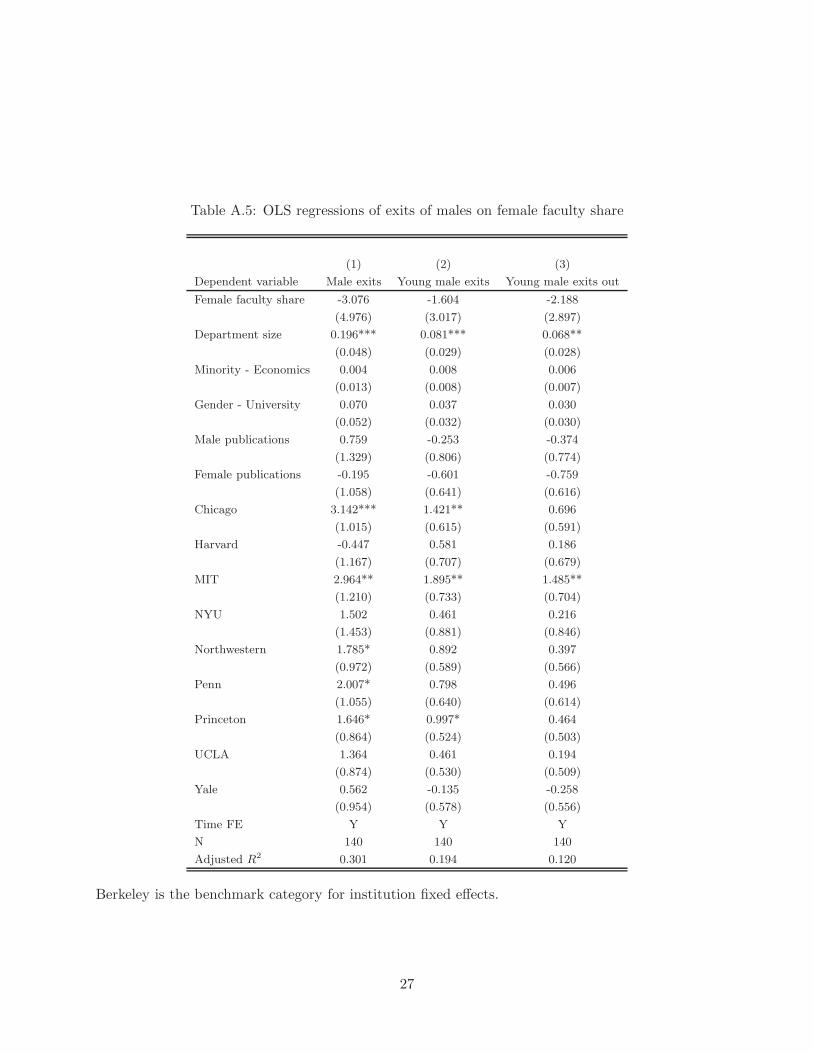
Table A.5: OLS regressions of exits of males on female faculty share
(1) (2) (3)
Dependent variable Male exits Young male exits Young male exits out
Female faculty share -3.076 -1.604 -2.188
(4.976) (3.017) (2.897)
Department size 0.196*** 0.081*** 0.068**
(0.048) (0.029) (0.028)
Minority - Economics 0.004 0.008 0.006
(0.013) (0.008) (0.007)
Gender - University 0.070 0.037 0.030
(0.052) (0.032) (0.030)
Male publications 0.759 -0.253 -0.374
(1.329) (0.806) (0.774)
Female publications -0.195 -0.601 -0.759
(1.058) (0.641) (0.616)
Chicago 3.142*** 1.421** 0.696
(1.015) (0.615) (0.591)
Harvard -0.447 0.581 0.186
(1.167) (0.707) (0.679)
MIT 2.964** 1.895** 1.485**
(1.210) (0.733) (0.704)
NYU 1.502 0.461 0.216
(1.453) (0.881) (0.846)
Northwestern 1.785* 0.892 0.397
(0.972) (0.589) (0.566)
Penn 2.007* 0.798 0.496
(1.055) (0.640) (0.614)
Princeton 1.646* 0.997* 0.464
(0.864) (0.524) (0.503)
UCLA 1.364 0.461 0.194
(0.874) (0.530) (0.509)
Yale 0.562 -0.135 -0.258
(0.954) (0.578) (0.556)
Time FE Y Y Y
N 140 140 140
Adjusted R2 0.301 0.194 0.120
Berkeley is the benchmark category for institution fixed effects.
27
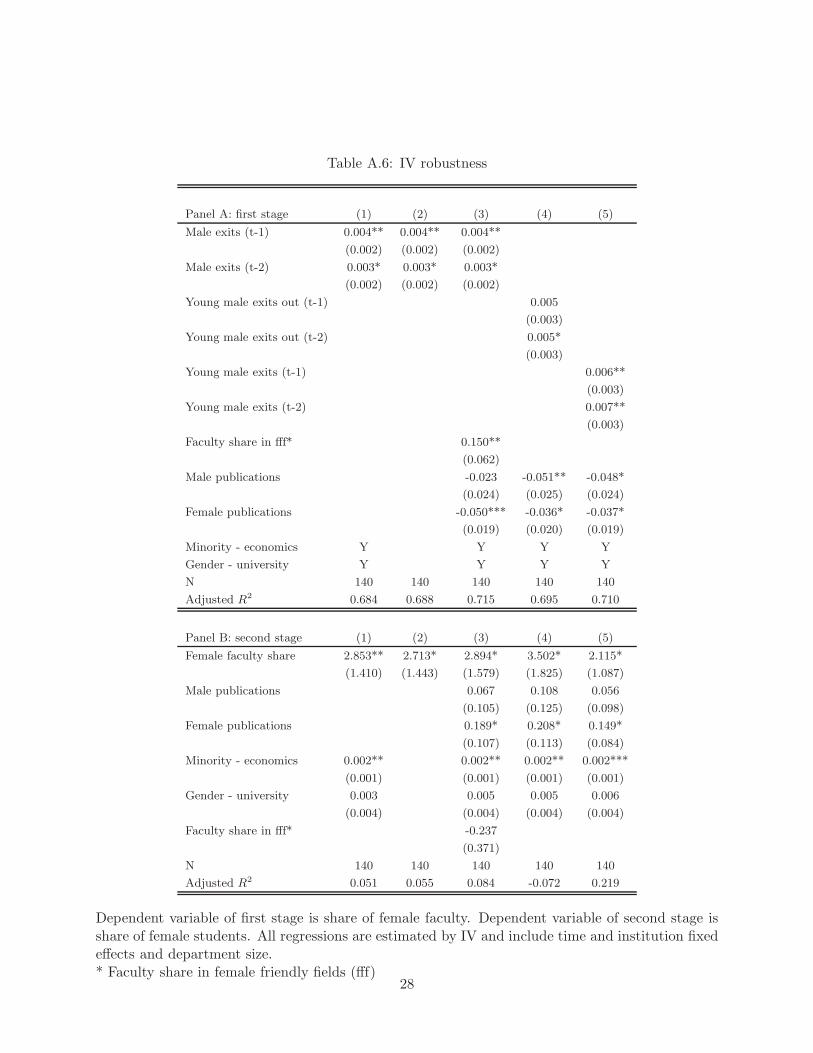
Table A.6: IV robustness
Panel A: first stage (1) (2) (3) (4) (5)
Male exits (t-1) 0.004** 0.004** 0.004**
(0.002) (0.002) (0.002)
Male exits (t-2) 0.003* 0.003* 0.003*
(0.002) (0.002) (0.002)
Young male exits out (t-1) 0.005
(0.003)
Young male exits out (t-2) 0.005*
(0.003)
Young male exits (t-1) 0.006**
(0.003)
Young male exits (t-2) 0.007**
(0.003)
Faculty share in fff* 0.150**
(0.062)
Male publications -0.023 -0.051** -0.048*
(0.024) (0.025) (0.024)
Female publications -0.050*** -0.036* -0.037*
(0.019) (0.020) (0.019)
Minority - economics Y Y Y Y
Gender - university Y Y Y Y
N 140 140 140 140 140
Adjusted R2 0.684 0.688 0.715 0.695 0.710
Panel B: second stage (1) (2) (3) (4) (5)
Female faculty share 2.853** 2.713* 2.894* 3.502* 2.115*
(1.410) (1.443) (1.579) (1.825) (1.087)
Male publications 0.067 0.108 0.056
(0.105) (0.125) (0.098)
Female publications 0.189* 0.208* 0.149*
(0.107) (0.113) (0.084)
Minority - economics 0.002** 0.002** 0.002** 0.002***
(0.001) (0.001) (0.001) (0.001)
Gender - university 0.003 0.005 0.005 0.006
(0.004) (0.004) (0.004) (0.004)
Faculty share in fff* -0.237
(0.371)
N 140 140 140 140 140
Adjusted R2 0.051 0.055 0.084 -0.072 0.219
Dependent variable of first stage is share of female faculty. Dependent variable of second stage isshare of female students. All regressions are estimated by IV and include time and institution fixedeffects and department size.* Faculty share in female friendly fields (fff)
28

Table A.7: IV robustness using predicted male exits as the instrument
Dependent variable Young Male Exit Seasoned Male Exit Female faculty share Female student share
(1) (2) (3) (4)
(Stage Zero) (Stage Zero) (First Stage) (Second Stage)
Publications -0.005***
(0.002)
Age -0.002*** 0.001***
(0.000) (0.000)
Male exits (predicted) -0.280***
(0.021)
Female faculty share 1.210***
(0.412)
Department size 0.016*** 0.003
(0.001) (0.003)
Minority-Econmics -0.000 0.002***
(0.000) (0.001)
Gender-University 0.000 0.006*
(0.001) (0.003)
Male publications -0.115*** 0.022
(0.017) (0.087)
Female publications -0.022* 0.110
(0.012) (0.069)
Year FE Y Y
Institution FE Y Y
N 7786 7786 140 140
Adjusted R2 0.032 0.004 0.877 0.280
The stage zero dependent variable is a dummy variable which is equal to one if it is a person’s lastyear at the institution. The instrument used for the second stage is the predicted number of maleswho will be exiting the department the following year.
29