Gender Pay Gap Report - Morrison Utility Services Gender Pay Gap...Morrison Data Services Median...
7
Delivering what we promise 2018 / 2019
Transcript of Gender Pay Gap Report - Morrison Utility Services Gender Pay Gap...Morrison Data Services Median...

Delivering what we promise
Gender Pay Gap Report
2018 / 2019
197360 MDS Gender Pay Gap 2018.indd 1 02/04/2019 17:12

2 3
Gender Pay Gap Report FY 2018
We are committed to Gender Equality
Introduction
Simon Best – Managing Director, Data Division
In 2018, we were within the minority of UK businesses that were already achieving a more balanced remuneration approach, demonstrating that women are an integral and respected part of our workforce. We believe that this reflects our long standing ethos of growing a work environment that delivers on our commitment to be flexible and inclusive.
I’m delighted to share our updated report which highlights the successes Morrison Data Services has had in ensuring we have a balanced and diverse workforce. We are proud that Morrison Data Services encourages flexible working solutions which contribute to our ability to be an employer of choice.
We also need to maintain our focus on ensuring our workforce reflects the customers and communities which we serve, so through 2019/20 we’re committed on researching new methods of attracting women into our front line roles, along with having a front line development programme that supports our existing colleagues into leadership roles.
When it comes to gender equality, Morrison Data Services is committed to creating a level playing field, so everyone has equal access to opportunities allowing them to develop and succeed in their chosen career. This applies to all our processes and policies, ensuring fairness and equality for all.
We know our people are pivotal in driving our business forward.
Morrison Data Services aims to be the employer of choice in the Data sector. Our continued growth and success, as a part of M Group Services, creates opportunities for fulfilling and rewarding roles making the best use of our people’s skills.
We want our people to have a positive impact on our clients’ customers and the local communities in which we work, every day.
We are investing heavily in our ‘People Strategy’ ensuring our people receive first-class training and develop leadership capabilities to allow us to create ambassadors not just employees. Through strong leadership, teamwork and mutual support we want our business to thrive with a happy, healthy and, most importantly, safe workforce.
ForewordSimon Best - Managing Director, Data Division
SuccessThe Morrison Data Services’
vision establishes how everyone’s contribution can
help achieve success
EnvironmentWe have a structure which
highlights our priorities while offering a supportive working environment.
CommitmentWe are committed
supporting the changing needs of our energy and
water customers by providing the most effective data solutions that utilise our
unique field capability.
197360 MDS Gender Pay Gap 2018.indd 2-3 02/04/2019 17:12
When it comes to gender equality, Morrison Data Services is committed to creating a level playing field, so everyone has equal access to opportunities allowing them to develop and succeed in their chosen career. This applies to all our processes and policies, ensuring fairness and equality for all.
We know our people are pivotal in driving our business forward.
Morrison Data Services aims to be the employer of choice in the Data sector. Our continued growth and success, as a part of M Group Services, creates opportunities for fulfilling and rewarding roles making the best use of our people’s skills.
We want our people to have a positive impact on our clients’ customers and the local communities in which we work, every day.
We are investing heavily in our ‘People Strategy’ ensuring our people receive first-class training and develop leadership capabilities to allow us to create ambassadors not just employees. Through strong leadership, teamwork and mutual support we want our business to thrive with a happy, healthy and, most importantly, safe workforce.
4 5
Gender Pay Gap Report FY 2018
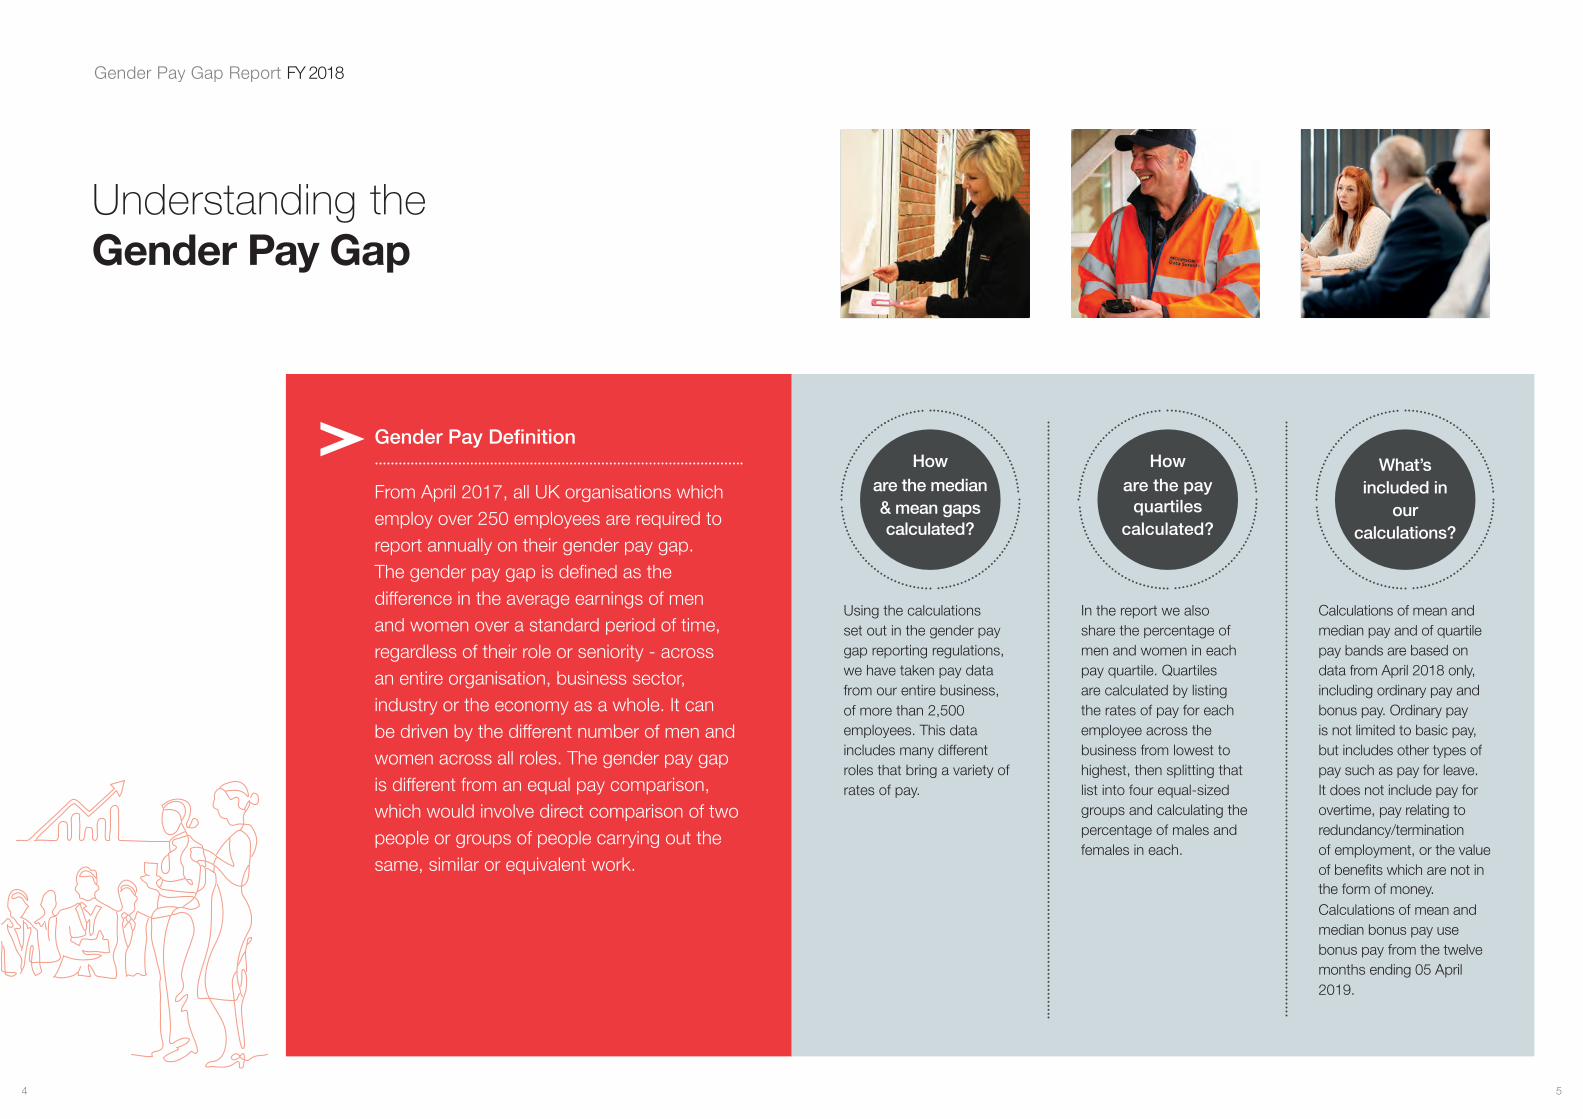
Understanding the Gender Pay Gap
From April 2017, all UK organisations which employ over 250 employees are required to report annually on their gender pay gap. The gender pay gap is defined as the difference in the average earnings of men and women over a standard period of time, regardless of their role or seniority - across an entire organisation, business sector, industry or the economy as a whole. It can be driven by the different number of men and women across all roles. The gender pay gap is different from an equal pay comparison, which would involve direct comparison of two people or groups of people carrying out the same, similar or equivalent work.
In the report we also share the percentage of men and women in each pay quartile. Quartiles are calculated by listing the rates of pay for each employee across the business from lowest to highest, then splitting that list into four equal-sized groups and calculating the percentage of males and females in each.
How are the pay
quartiles calculated?
Using the calculations set out in the gender pay gap reporting regulations, we have taken pay data from our entire business, of more than 2,500 employees. This data includes many different roles that bring a variety of rates of pay.
How are the median & mean gaps calculated?
What’s included in
our calculations?
Calculations of mean and median pay and of quartile pay bands are based on data from April 2018 only, including ordinary pay and bonus pay. Ordinary pay is not limited to basic pay, but includes other types of pay such as pay for leave. It does not include pay for overtime, pay relating to redundancy/termination of employment, or the value of benefits which are not in the form of money. Calculations of mean and median bonus pay use bonus pay from the twelve months ending 5 April 2019.
Gender Pay Definition
197360 MDS Gender Pay Gap 2018.indd 4-5 02/04/2019 17:12

6 7
Gender Pay Gap Report FY 2018
Gender Pay Gap & Bonus GapOur Results FY 2018
When it comes to gender equality,
Morrison Data Services is committed
to creating a level playing field,
so everyone has equal access to
opportunities allowing them to
develop and succeed in their chosen
career and field of expertise.
BONUS PAY GAPProportion of employees awarded a bonus for 2018/19 are shown.
Statistics for Full Year 2018:
ender ay ap
Difference between female and male pay
Demonstrates the average higher value of bonus paid to male employees compared to female employees
* Rate of pay is calculated from basic pay, shift payments, all allowances
Morrison Data Services
Median
Mean
% Female % Male
Received 43.8 77.9
Not received 56.2 22.1
Median 41.23%
Mean 9.47%
Bonus Pay ap
43.8% of female employees received bonus pay, compared to the 77.9% of male employees.
Received bonus Female Male
43.8% 77.9%
56.2% 22.1%
197360 MDS Gender Pay Gap 2018.indd 6-7 02/04/2019 17:12
When it comes to gender equality,
Morrison Data Services is committed
to creating a level playing field,
so everyone has equal access to
opportunities allowing them to
develop and succeed in their chosen
career and field of expertise.
ender ay ap
Difference between female and male pay
* Rate of pay is calculated from basic pay, shift payments, all allowancesand bonuses rand bonuses received and preceived and prorated to an hourly rate, Overtime isorated to an hourly rate, Overtime is excluded.excluded.
Median is the middle value in a collection of data.Median is the middle value in a collection of data. Mean is the average value of a data set.Mean is the average value of a data set.
Morrison Data Services
Median --7.63%
Mean -7.94%
IIllustrates the higher average percentage of basic rate of pay for female employees.
8 9
Gender Pay Gap Report FY 2018
Gender Pay Gap & Bonus GapOur Results FY 2018
Female
Male
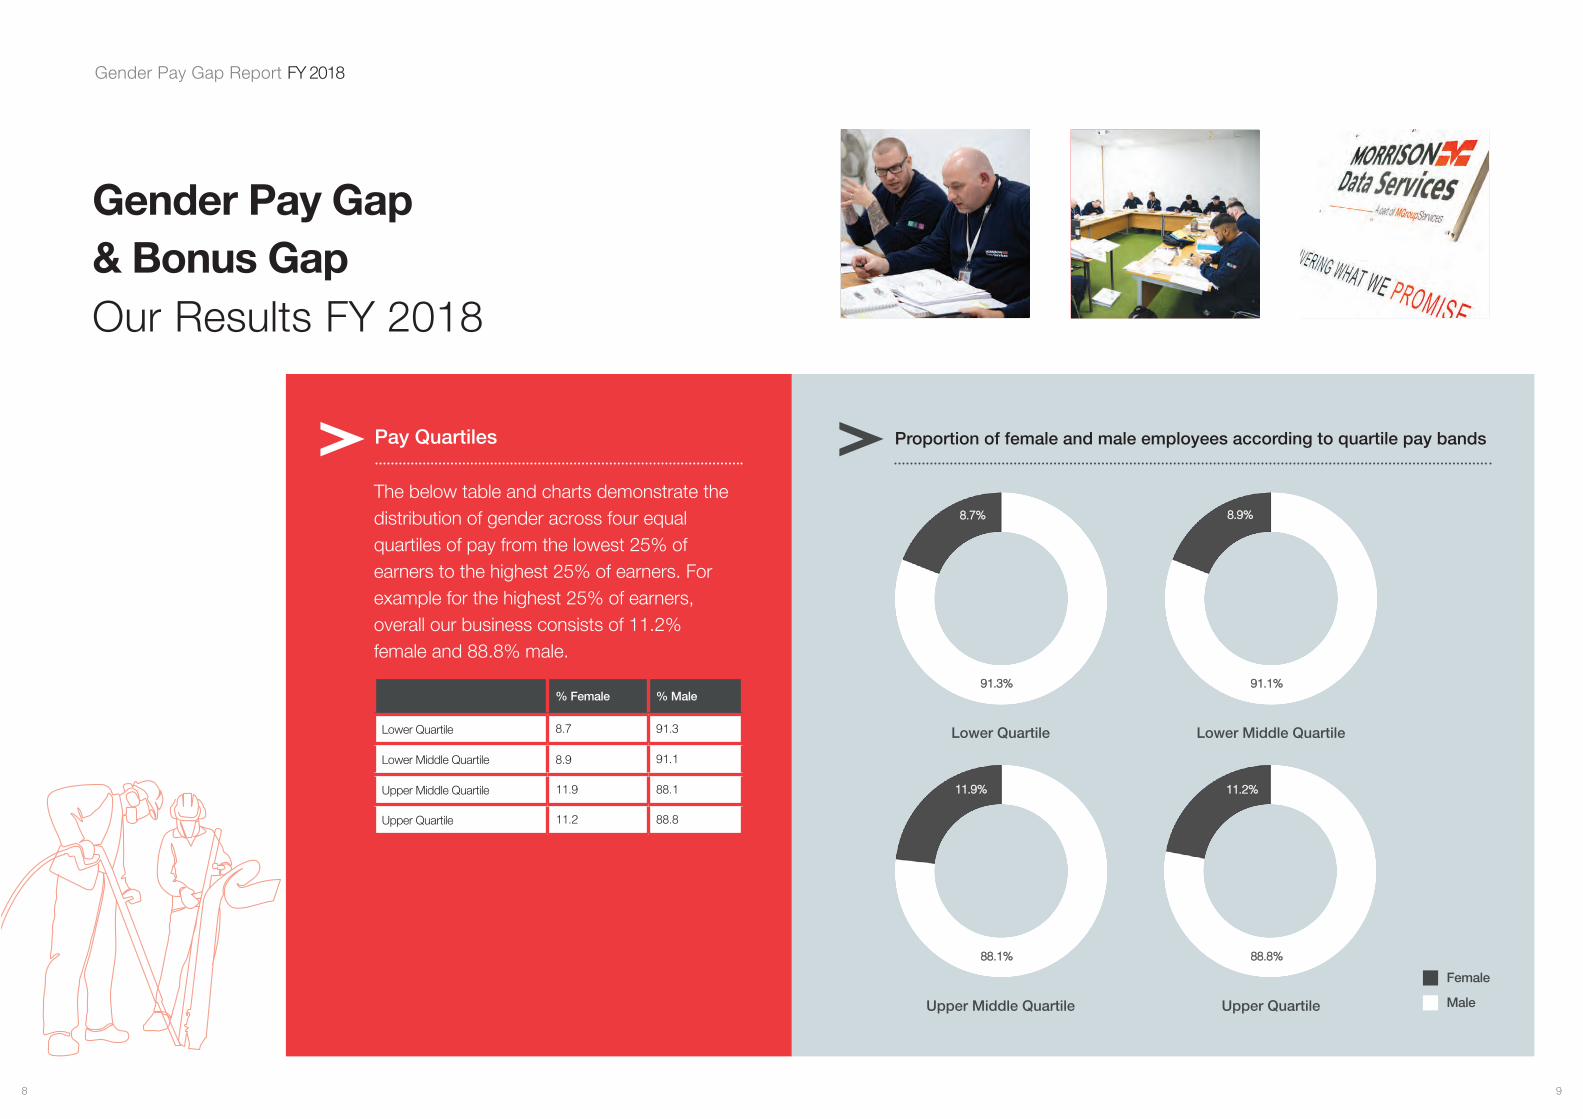
he below table and charts demonstrate the distribution of gender across four equal quartiles of pay from the lowest of earners to the highest of earners. For example for the highest of earners, overall our business consists of 11.2 female and 88.8 male.
Pay Quartiles Proportion of female and male employees according to quartile pay bands
Upper Middle Quartile
Lower Quartile
% Female % Male
Lower Quartile 8.7 91.3
Lower Middle Quartile 8.9 91.1
Upper Middle Quartile 11.9 88.1
Upper Quartile 11.2 88.8
Upper Quartile
Lower Middle Quartile
8.7%
91.3%
8.9%
88.1%
91.1%
88.8%
11.9% 11.2%
197360 MDS Gender Pay Gap 2018.indd 8-9 02/04/2019 17:12

10 11
Gender Pay Gap Report FY 2018
Our HighlightsFY 2018
Whether it is from policies and process or new and emerging technologies, we will explore opportunities at Morrison Data Services that deliver choice with how people want to work.
So much of our life is made up from time at work, having a clear line of sight of a career path at Morrison Data Services will ensure that we can visualise where we’re going and what we need to do to get there.
Developing career paths
Flexible working solutions
Talent development
Introducing a continual review process that provides the opportunity for everyone to grow through regular and frequent feedback; and through this talent management process ensuring Morrison Data Services has the right people in place for our business growth of tomorrow.
What Next?
Our Commitments
197360 MDS Gender Pay Gap 2018.indd 10-11 02/04/2019 17:12
Our commitment to unlocking progression & greater inclusion for our people.

12
Delivering what we promise
www.morrisonds.com [email protected]
Morrison Data ServicesHead Office • 11 Silver Fox Way, Cobalt Business Park,
Newcastle upon Tyne, NE27 0QJ
Tel: 0191 201 3500
197360 MDS Gender Pay Gap 2018.indd 12 02/04/2019 17:12