Gender Discrimination and Social Identity: Evidence from ...aalims.org/uploads/GenderDisc_WB.pdf ·...
39
1 Gender Discrimination and Social Identity: Evidence from Urban Pakistan 1 Adeline Delavande Basit Zafar 2 July 2014 Abstract Gender discrimination in South Asia is a well-documented fact. This paper investigates how gender discrimination depends on the social identities of interacting parties. We use data from economic decision-making experiments to identify gender discrimination and randomly matched 2,836 male and female students pursuing bachelors-equivalent degrees in three different types of institutions that represent distinct identities within the Pakistani society. Our main finding is that gender discrimination is not uniform in intensity and nature across educated Pakistani society and varies as a function of the social identity of both individuals who interact. While we find no evidence of higher socio-economic status men discriminating against women, men of lower socio-economic status and higher religiosity tend to discriminate against women –but only women from lower socio-economic status who are closest to them in social distance. Moreover, this discrimination is largely taste-based. JEL Classification: C72; C91; J16; Z10 Keywords: trust; discrimination; expectations; identity; gender; other-regarding preferences. 1 We would like to thank Olivier Armantier, Sonia Bhalotra, Michelle Belot, Abhishek Chakravarty, Patrick Nolen, Stephan Meier, Luis Vasconcelos, and seminar participants at the 2012 International ESA Conference, IZA Workshop on Discrimination and Ethnicity, University of Essex and RAND Corporation for helpful comments. We are enormously indebted to Hisham Tariq, Noor Aslam, our local field teams and participating institutions for without their assistance this project would not have reached its conclusion. Elizabeth Setren and, in particular, Elizabeth Brown and Maricar Mabutas provided outstanding research assistance. Funding for data collection through a RAND Independent Research and Development grant is gratefully acknowledged. Delavande acknowledges funding from the Economic and Social Research Council Research Centre on Micro-social Change. The views expressed in this paper do not necessarily reflect those of the Federal Reserve Bank of New York or the Federal Reserve System as a whole. Any errors that remain are ours. 2 Delavande: University of Essex. Email: [email protected]. Zafar: Federal Reserve Bank of New York. Email: [email protected].
Transcript of Gender Discrimination and Social Identity: Evidence from ...aalims.org/uploads/GenderDisc_WB.pdf ·...

1
Gender Discrimination and Social Identity: Evidence from Urban Pakistan1
Adeline Delavande Basit Zafar2
July 2014
Abstract
Gender discrimination in South Asia is a well-documented fact. This paper investigates how gender discrimination depends on the social identities of interacting parties. We use data from economic decision-making experiments to identify gender discrimination and randomly matched 2,836 male and female students pursuing bachelors-equivalent degrees in three different types of institutions that represent distinct identities within the Pakistani society. Our main finding is that gender discrimination is not uniform in intensity and nature across educated Pakistani society and varies as a function of the social identity of both individuals who interact. While we find no evidence of higher socio-economic status men discriminating against women, men of lower socio-economic status and higher religiosity tend to discriminate against women –but only women from lower socio-economic status who are closest to them in social distance. Moreover, this discrimination is largely taste-based.
JEL Classification: C72; C91; J16; Z10
Keywords: trust; discrimination; expectations; identity; gender; other-regarding preferences.
1 We would like to thank Olivier Armantier, Sonia Bhalotra, Michelle Belot, Abhishek Chakravarty, Patrick Nolen, Stephan Meier, Luis Vasconcelos, and seminar participants at the 2012 International ESA Conference, IZA Workshop on Discrimination and Ethnicity, University of Essex and RAND Corporation for helpful comments. We are enormously indebted to Hisham Tariq, Noor Aslam, our local field teams and participating institutions for without their assistance this project would not have reached its conclusion. Elizabeth Setren and, in particular, Elizabeth Brown and Maricar Mabutas provided outstanding research assistance. Funding for data collection through a RAND Independent Research and Development grant is gratefully acknowledged. Delavande acknowledges funding from the Economic and Social Research Council Research Centre on Micro-social Change. The views expressed in this paper do not necessarily reflect those of the Federal Reserve Bank of New York or the Federal Reserve System as a whole. Any errors that remain are ours. 2 Delavande: University of Essex. Email: [email protected]. Zafar: Federal Reserve Bank of New York. Email: [email protected].
2
1. Introduction
Gender-unequal treatment in developing countries – be it in early childhood investments,
educational attainment, labor market earnings, or asset ownership–is well documented (e.g., Sen, 2001;
Duflo, 2012). Beyond the implication for women’s well-being, this unequal treatment also has
ramifications for the economic development of these countries. For example, the International Monetary
Fund reports that reducing the gender wage gap in the Middle East, North Africa, Afghanistan and
Pakistan region to levels twice as large as those found in emerging markets could generate extra GDP of
$1 trillion in a decade to the region.1 In this paper, we use economic decision-making experiments from
Pakistan to investigate (i) whether and how young educated Pakistani women of heterogeneous
backgrounds are discriminated against by socially disparate groups of highly-educated young men, (ii)
evaluate the nature of this discrimination (taste-based versus statistical), and (iii) analyze how the nature
of the discrimination varies by the social status of both genders.
We focus on Pakistani society because gender inequality is particularly pronounced in South
Asia. Klasen (1994) and Sen (2001) have highlighted Pakistan as a country where this imbalance is the
starkest, with a population sex ratio most recently estimated to be 108.5 males for every 100 females
(Pakistan Census Organization, 1998). In the labor market, women aged 20 to 30 with a college degree
earn on average 28% less than their male counterparts.2 Moreover, gender discrimination in Pakistan
appears paradoxical, with women having on the one hand prominent political leadership (e.g., Pakistan’s
former Prime Minister Benazir Bhutto was the first woman to lead an Islamic state) but facing severe
discrimination on the other hand: for example, an estimated 13 percent of women are “missing,” the
gender gap in literacy is increasing, the rate of violence against women is alarming, and the female labor
force participation rate is 15%, which is low compared to other countries with similar GDP per capita
(Klasen and Wink, 2003; Coleman, 2004; Human Right Commission of Pakistan, 2008).
As part of the large body of empirical evidence on gender unequal treatment in South Asia, there
has been some investigation into the relationship between gender discrimination and socio-economic
status or social class of the households. The resulting empirical evidence is however rather mixed. In
some cases, higher economic status households are found to discriminate less against girls: Rose (1999)
finds that landholdings increase the survival of girls relative to boys, and Behrman (1988) and Alderman 1 Source: The Express Tribune from Nov. 12 2013, available at http://tribune.com.pk/story/630894/imf-urges-pakistan-mena-central-asia-cut-gender-gap-to-boost-gdp/. 2 Source: Authors’ calculations based on the 2007-08 and 2008-09 Pakistan Labour Force Survey.
3
and Gertler (1989) find that households with more income treat boys and girls more equally in terms of
allocation of nutrients and medical care, respectively. However, Miller (1997) and Basu (1989) find that
higher socio-economic status households (as measured by caste or income) discriminate more against
girls, especially in the northwestern plains of Asia where the society is patrilineal. Similarly, Bhalotra
and Cochrane (2010) show that prenatal sex detection and female foeticide are greater in relatively
wealthy and educated families. Our paper contributes to the understanding of the relationship between
social status and gender discrimination in South Asia beyond the one found within the household.
To investigate the interplay between gender discrimination and social identity, we recruited
2,836 students pursuing bachelors-equivalent degrees, from three types of educational institutions in
urban Pakistan that represent three very different identities in terms of socioeconomic background,
religiosity and exposure to Western ideas. Our focus on interactions of inter-elite groups, defined as
college-level students, is of particular interest because individuals belonging to these groups are likely to
become policy makers or be influential in their communities. We use the student’s institutional
affiliation as a measure of his/her social identity. The first type of institution consists of male-only
Madrassas (religious seminaries). The Madrassa curriculum uses ancient religious texts and does not
impart any secular teaching. The second type of institution—Islamic Universities—teach a Liberal Arts
curriculum combined with Islamic teachings in gender-segregated campuses. The third type are Liberal
Universities which are similar to American universities— campuses are mixed, classes are taught in
English and students are widely exposed to Western ideas. While Madrassas tend to be free and hence
cater primarily to the poor, Islamic Universities are usually public and are therefore accessible to low
and middle income groups. Liberal Universities, on the other hand, charge expensive tuition and thus
serve the wealthy segment of the population. On the socioeconomic status (SES) scale, students at
Liberal Universities rank on average highest, followed by Islamic University students, with Madrassa
students being the lowest on this scale. In addition, these three groups also differ in their levels of
religiosity. Self-reported religiosity (on a scale from 0 to 10) is 9.2 among the Madrassa students, 6.3
among male Islamic University students and 5.3 among the male Liberal University students.
To investigate gender discrimination, we study a particular aspect of social and economic
interactions: trust. Our focus on trust stems from a large literature showing that trust enhances efficiency
and promotes economic growth and financial development (Knack and Keefer, 1997; La Porta et al.,
1997; Guiso et al., 2004). Moreover, trust is particularly important in developing countries where,
because of the failure of the state, informal and traditional institutions matter considerably more

4
(Ostrom, 1990; Fukuyama, 1995). We measure trust by randomly matching students with each other
(based on gender and institutional affiliation—our measure of their social identity) to participate in a
trust game (Berg et al., 1995). In the trust game, a player (sender) can decide to send (“invest”) money
to a partner (receiver). If the sender invests the money, the experimenter triples that amount and gives it
to the receiver, who is asked to choose whether (s)he transfers any money back to the sender. Systematic
differences in the decision to invest the money based on the gender of the partner would imply gender
discrimination. This type of game captures important behavioral aspects of social and economic
interactions, including those taking place in the labor market, and is therefore well suited to investigate
gender discrimination.
Effective policies to address discrimination cannot be crafted without understanding the nature
of discrimination, i.e., whether it is motivated by preferences (taste-based discrimination) or statistical
inference on payoff-relevant information (statistical discrimination). For this purpose, we use a multiple-
game design. We also ask respondents to participate in other experiments of decision-making that
measure expected trustworthiness (expectations in the trust game) and unconditional other-regarding
behavior such as altruism or inequity aversion (dictator game). In the dictator game, the sender is asked
to split an amount of money between himself and another player, who takes no further action. Therefore,
systematic differences in the amount sent to males and females in the dictator game measure taste-based
discrimination (Becker, 1957). In the trust game, expectations about how much participants expect back
on average from their partner allow us to measure whether the discrimination is statistical.
Our main finding is that the intensity and the nature of gender discrimination depend on the
social identity of both individuals in the match. Liberal University male students, who are (on average)
the wealthiest, least religious and most exposed to Western ideas, do not discriminate against women of
any social identity. Madrassa students, who come from more humble backgrounds, and are more
religious and relatively unexposed to Western ideas, tend to discriminate against Islamic University (that
is, middle SES) women but not Liberal University (high SES) women in the trust game. Moreover, this
discrimination is entirely taste-based. However, although Madrassa students treat men relatively better
than women, because they give and trust more than other male groups, they actually treat women the
best in absolute terms. Finally, Islamic University male students, who fare in the middle in terms of
wealth and religiosity, have a less uniform behavior: they favor Liberal University (high SES) females
but they do not favor Islamic University females (middle SES), compared to their respective male
counterparts, in the trust game. Importantly, while we cannot rule out taste-based discrimination playing
5
some role, the differential behavior by gender of Islamic University students is primarily attributable to
statistical discrimination. These findings are in contrast to what we find in Delavande and Zafar (2013)
in which we focus on male-to-male interactions: the behavior of our male respondents matched with
male partners does not differ by the institution of their match, i.e., social identity is irrelevant in the
male-male interactions, and matters only in the male-female interactions.
It has been argued that pushing for policies favoring economic development, such as education
policy, will lead to an improvement in women’s rights and status (Doepke and Tertilt, 2009, Duflo,
2012). Our findings, based on a subject pool where all respondents are pursuing bachelors-equivalent
degrees (and hence belong to an elite group in the society), that higher socioeconomic status females
(Liberal University females) are not discriminated against and are even favored in some instances by
males, and that women of (relatively) lower socioeconomic status (Islamic University females) are
discriminated against by certain groups of men suggests that educating women may not be a sufficient
condition for women’s position to improve, as their social identities continue to matter. This further
suggests that social policies aimed at improving women’s under-representation in the political sphere or
the labor market through gender quotas (e.g., Beaman et al., 2009, Beath et al., 2013, Bertrand et al.,
2014) may need to account for the interaction of gender with social identity, and possibly allocate
gender quotas based on the socio-economic background of women.
Our paper complements the large body of empirical evidence on gender unequal treatment in
South Asia3, with a specific focus on the role of the social identities of the interacting parties, for which,
as discussed above, the evidence is mixed for within-household interactions, and scant beyond intra-
household interactions. Our paper also relates to a large literature on gender discrimination in the labor
market and other market interactions, mostly in developed countries (see Altonji and Blank, 1999, and
List and Rasul, 2011 for a review). Audit studies or sex-blind hiring (e.g., Ayres and Siegelman, 1995;
Neumark, 1996; Goldin and Rouse, 2000) and estimates of differential marginal productivity
(Hellerstein et al., 1999) have been used to identify gender discrimination. Due to lack of data, however,
3 Many papers provide evidence that sons are more wanted (e.g., Bhalotra and Cochrane, 2010; Jayachandran, 2014), and that boys are treated more favorably than girls within the household: they receive more nutrition, more healthcare, more childcare time, and are more likely to be vaccinated (Chen et al., 1981; Das Gupta, 1987; Basu, 1989; Hazarika, 2000; Borooah, 2004; Barcellos at al., 2014; Jayachandran and Kuziemko, 2011). Son preferences is often cited for this unequal treatment, due either to pure taste for having a boy or because parents respond to gender difference in expected returns as adults by selectively allocating available resources (Rosenzweig and Schultz, 1982; Qian, 2008). Beyond unequal treatments at young age, women are also found to lack behind in terms of literacy, educational attainment, labor force participation and earnings (e.g., Holmes, 2003; Aslam, 2009; Duflo, 2012).
6
it is generally difficult to identify the nature of this discrimination. Recent studies using either field or
lab experiments have been able to directly address the nature of gender discrimination by using a multi-
game design, which is able to measure both preferences and beliefs or to manipulate the market under
study (e.g., Fershtman and Gneezy, 2001; List, 2004; Slonim and Guillen, 2010; Castillo et al., 2013).
Freshtman and Gneezy (2001), whose study is the closest in approach to that used in this paper, match
students with typical ethnic names in Israel and find strong evidence that Ashkenazic women (who tend
to have higher economic status) are less trusted than Ashkenazic men, while Eastern women (who tend
to have lower economic status) are more trusted then Eastern men. This suggests, unlike in the Pakistani
context, that discrimination against females is reduced, and even reversed, when they belong to lower
socio-economic status groups.
Finally, our paper is related to the sociological theory of intersectionality (Crenshaw, 1991;
Collins, 2000). This theory argues that women experience discrimination in varying levels of intensity,
which is determined by intersectional systems of society (e.g. race, ethnicity, social class). In line with
this theory, studies have found that labor market discrimination and stereotyping tends to be worse for
women who fall into the bottom of the social hierarchy in terms of race (Browne and Misra, 2003). Our
findings that higher socioeconomic status women in Pakistan are less discriminated against are
consistent with this theory.
This paper is organized as follows. We provide some background information on the institutions
we surveyed and the sample in Section 2. Section 3 outlines a simple theoretical model that provides a
guide for the empirical analysis. Section 4 explains the experimental design, and Section 5 presents the
empirical results. Section 6 discusses some potential mechanisms for the findings while Section 7
presents concluding remarks.
2. Background
2.1. The educational institutions
Higher education in Pakistan takes place in universities and in Madrassas (religious seminaries).
The enrollment rate for students aged 17-23 is 5.1%. A third of the students enrolled at university are
females (Pakistan Education Statistics, 2010-11). There are now 138 universities in the country
recognized by the Higher Education Commission, of which 75 are public and 63 private (Higher
Education Commission Pakistan, 2012). There remains considerable disagreement over the extent of the
7
penetration of Madrassas because few are registered. However, Ahmad (2004) estimates that there are
about 6,000 secondary and higher Madrassas, educating about 600,000 students.
We conducted experiments in four male Madrassas, one public Islamic University, and two
private Liberal Universities located in Islamabad/Rawalpindi and Lahore between May and October
2010.4 Below we describe each of those institutions.
Madrassas base their studies on texts dating to before the 14th century and teach classes in Urdu
(Fair, 2006; Rahman, 2008). The majority of Madrassas do not impart any secular or vocational training
and it has been argued, albeit with scant evidence, that they deliberately educate their students in narrow
worldviews and rejection of Western ideas, and do not train them sufficiently for the real world (Ali,
2009). Claims made by policy makers and in the popular press suggest that they may be responsible for
fostering militancy and Islamic extremism (see discussion in Delavande and Zafar, 2013). Since
Madrassas generally tend to be free, they attract students from modest backgrounds (Rahman, 2004).
Advanced study within the Madrassas produces an Alim (Islamic scholar and/or teacher). Most students
who graduate from a Madrassa go on to work in the religious sector.
Islamic Universities provide a liberal arts curriculum combined with Islamic teachings and
courses. For example, economics is taught with a focus on Islamic principles of finance. These
universities have segregated campuses for males and females, and classes are taught in Arabic or
English. They tend to be public and, therefore, are accessible to low and middle income groups.
Moreover, a relatively large proportion of students at such universities have typically studied for some
time at Madrassas before enrolling. Females account for about 40% of the student body at Islamic
University.
Liberal Universities are similar to American colleges. They provide a liberal arts curriculum,
teach classes in English, and have gender-mixed campuses. Tuition at such institutions tends to be very
expensive so they cater to wealthy students. Females account for about 25 to 30% of the student body at
the two institutions we surveyed.5
2.2. Descriptive statistics of the sample
4 There are few female Madrassas, and the proportion of females pursuing a Bachelor-equivalent degree (the relevant population for our purposes) is even smaller. Since large sample sizes are needed for the randomizations in the experiment, we did not include them in our sample. 5 In Delavande and Zafar (2013), we separate the two Liberal Universities we interviewed. In the present context, we find very similar behaviour toward females so keep them as one group to simplify the presentation of results.
8
Data collection was conducted by the Survey Center (SC) affiliated with the Islamic University.
The institutions in our sample are amongst the five largest and well-regarded institutions in their
respective category in each city. Among all the institutions we contacted, one university and one
Madrassa refused to participate. We sampled the senior-most students in the 4 Madrassas since they are
similar in age to university students, and are pursuing degrees that are equivalent to Bachelor degrees.
Though participation was voluntary, almost everyone in the Madrassas participated in the study. At the
other institutions, a random sample of students (unconditional on gender) was selected to participate
based on a listing of students provided by the registrar’s office. The average response rate at the
universities was about 70%. To signal credibility of the study to the students, members of the staff of the
institution at which data was being collected were also hired for the data collection. Overall 2,836
students participated in the experiments, of which 489 were female. The ethnic composition of students
is quite similar across the institutions.
Table 1 presents the characteristics of the participants by group (educational affiliation) and
gender. For comparison purpose, the table also shows the characteristics of a random sample of
respondents from Islamabad/Rawalpindi and Lahore (City sample) obtained from a separate survey we
conducted in 2010. The average age of students varies between 21 and 22.
Table 1 highlights the differences across the three types of institutions.6 The sorting in terms of
observables into these institutions is very drastic but as expected. As we move across the columns from
the Liberal University (denoted by HighSES) towards the Islamic University (denoted as MidSES) and
the Madrassas in Table 1, the average socioeconomic characteristics deteriorate. For example, the
monthly parental income of male and female students at HighSES is about 7 times that of students in the
Madrassas, and father’s years of education is almost twice as many. If we compare the students to the
City sample (last two columns of the table), we see that Madrassa students seem to come from less well-
off backgrounds than the general populations in the cities, while all other institutions fare better in terms
of most indicators of wealth. Females at HighSES and MidSES tend to come from slightly more
privileged backgrounds than their male counterparts: on average, they have higher parental income,
parental education and asset ownership. This difference is more marked at MidSES.
6 Since we find no significant differences within the Madrassas either in terms of demographic characteristics or in their experimental behavior, we combine the four Madrassas into one group to keep the tables and analysis simple.
9
Students from the various groups also show different levels of self-reported religiosity and the
number of prayers per day. Students were asked to rate how religious they considered themselves to be
on a scale from 0 (not religious at all) to 10 (very religious). Religiosity increases as we move across
columns of Table 1; the average religiosity is 5.6-5.7 for HighSES males and females compared to 9.2 in
the Madrassas. The former also pray much less frequently each day (2-2.4 times vs. 4.9).
Finally, students are exposed to different types of information and different peer groups. While
only 23% of the Madrassa students report watching BBC and CNN, at least 59% of the students of the
other groups report watching it. Within HighSES, female students tend to watch those international news
channels more than male students. Also, the proportion of male respondents who have ever attended a
religious institution on a full-time or part-time basis increases from 35% for HighSES students to 45%
for MidSES students. In addition, while fathers of only 11% (5%) of male (female) students attending
HighSES spent more than 2 years studying in a Madrassa on either a part-time or full-time basis, the
corresponding proportion for Madrassa students is 20%. This suggests that the various groups in our
setting interact with and have exposure to each other at some level, but that the extent of exposure varies
by institution.
In short, the table shows that there is substantial sorting on observables into institutions. Students
attending these three types of institutions clearly represent very different social and religious identities
within the Pakistani society. At one end of the spectrum we have young males from poorer backgrounds
who attend religious schools. At the other end of the spectrum we have wealthy students exposed to
Western-type of education and high exposure to international media.
2.3. Earnings expectations of female students
We speculate that women’s social identity influences the discrimination they may suffer, in
particular in the labor market. As a motivating fact for our experiments, we look at women and men’s
expected earnings at age 30. These expectations were elicited as follows: “Consider the situation where
you graduate from [current institution]. Look ahead to when you will be 30 years old and suppose that
you are working then. Think about the kinds of jobs that will be available to you. How much do you
think you could earn per month on average at the age of 30 at these jobs?”
We find that at HighSES, women and men expect very similar age 30 earnings on average (Rs.
46,694 for females and Rs. 45,310 for males, with a p-value of 0.524 when testing equality of means),
while at MidSES, females expect significantly lower earnings than men on average (Rs. 37,136 for
10
females versus Rs. 44,079 for males, with a with a p-value of less than 0.001 when testing equality of
means). Note that these expectations are conditional on working. Therefore, these patterns suggest that
females graduating from MidSES are, on average, more likely to expect less favorable outcomes in the
labor market (relative to their male counterparts) than females graduating from HighSES. This is
consistent with these MidSES females expecting to be discriminated in the labor market, and if these
expectations are predictive of actual future realizations (as has been shown in the literature, for example,
by Dominitz, 1998), then this also means that they will actually be discriminated in the labor market. We
will assess whether the experimental results are consistent with this.
3. Theoretical Framework
In this section, we present a simple stylized model of behavior in the trust and dictator games
with identity (which we call social background below and refers to the institution a student belongs to)
to illustrate the mechanisms that can lead to observed choices in these games. Incorporating identity
directly into the utility function was introduced into economic analysis by Akerlof and Kranton (2000).
Consider a player with social background s and gender g. His utility usg(.,.) is assumed to depend
on his own payoff and that of his partner of characteristics (s’,g’). Several papers have modeled the
motivation for other-regarding behavior, i.e. deriving utility from others’ payoff. It could take the form
of altruism (Andreoni and Miller, 2002), warm glow (Andreoni, 1990), inequity-aversion (Fehr and
Schmidt, 1999; Bolton and Ockenfels, 2000) or maximin preferences (Charness and Rabin, 2002). We
are agnostic here about these underlying motivations.
For simplicity, we assume that the player’s utility is linear in both his payoff and in a strictly
concave function βs,g,s’,g’(.) of his partner’s payoff (𝛽′𝑠,𝑔,𝑠’,𝑔’(. ) > 0 and 𝛽′′𝑠,𝑔,𝑠’,𝑔’(. ) < 0), that equals
zero if the partner has zero payoff (βs,g,s’,g’(0)=0). The function βs,g,s’,g’ (.) depends on the characteristics
of both players and captures how much a player with characteristics (s,g) values the payoff of a partner
with characteristics (s’,g’). We further assume that the utility is separable in both own and partner’s
payoffs, to keep the illustration simple. The hypotheses that we test are similar if they are relaxed. So if
a and b are the payoffs of the player and his partner respectively, the utility the player gets is given by:
𝑢𝑠𝑔(𝑎, 𝑏) = 𝑎 + 𝛽𝑠,𝑔,𝑠’,𝑔’(𝑏).
With this set-up, we present the decision rule for each game.

11
3.1. Trust game
In the trust game, the player must decide whether to invest the amount P in his partner, in which
case the partner may return some amount r ∈ [0,3P] back to him, or keep everything. We assume that
the player formulates subjective expectations about how much the partner will send back, and that this
expectation Es,g,s’,g’(.) depends on the gender and social background of both the player and the partner.
The player’s expected utility is thus given by:
Max�P,𝐸𝑠,𝑔,𝑠’,𝑔’�𝑟 + 𝛽𝑠,𝑔,𝑠’,𝑔’( 3P − 𝑟)��
= Max �P,𝐸𝑠,𝑔,𝑠’,𝑔’(𝑟) + 𝛽𝑠,𝑔,𝑠’,𝑔’ � 3P − 𝐸𝑠,𝑔,𝑠’,𝑔’(𝑟)��.
The player will choose to invest in the trust game (𝑖𝑠,𝑔,𝑠’,𝑔’ = 1) if:
P < 𝐸𝑠,𝑔,𝑠’,𝑔’(𝑟) + 𝛽𝑠,𝑔,𝑠’,𝑔’ � 3P − 𝐸𝑠,𝑔,𝑠’,𝑔’(𝑟)�.
Note that the utility function of the player depends on both the player’s expectations about how
much the partner will send back as well as the function 𝛽(.). Consider two players with characteristics
(s,g), both matched with a partner of background 𝑠’, but of different genders. We may observe the same
decision rule, but the students could still have different expectations 𝐸𝑠,𝑔,𝑠’,𝑚(𝑟) and 𝐸𝑠,𝑔,𝑠’,𝑓(𝑟) and
different functions 𝛽𝑠,𝑔,𝑠’,𝑚(. ) and 𝛽𝑠,𝑔,𝑠’,𝑓(. ). In other words, observing no gender discrimination in the
trust game does not rule out that expectations and tastes 𝛽𝑠,𝑔,𝑠’,𝑔′(. ) do not differ by gender. Similarly, if
we do observe different investment decisions in the trust game, we cannot conclude whether the nature
of the discrimination is taste-based (i.e., different 𝛽s) and/or whether it is statistical, i.e., different
expectations about returns. However, using other games can allow us to tease this out. We discuss them
below.
3.2. Dictator game
In the dictator game, the player must decide how to allocate an amount A between himself and
his partner. His decision problem of how much to allocate to the partner (that is, 𝑑) is therefore:
Max𝑑�A − 𝑑 + 𝛽𝑠,𝑔,𝑠’,𝑔’(𝑑)} s.t. 𝑑 ∈ [0, A].
We have a corner solution where the player allocates zero to the other player if the function
𝛽𝑠,𝑔,𝑠’,𝑔’(𝑑) < 1 ∀ 𝑑 ∈ [0, A], and A if the function is greater than 1 over the range of 𝑑. Otherwise, the
first-order-condition gives the optimal amount 𝑑𝑠,𝑔,𝑠’,𝑔’as follows:
𝛽′𝑠,𝑔,𝑠’,𝑔’(𝑑𝑠,𝑔,𝑠’,𝑔’) = 1.
12
Consider two players with characteristics (s,g), both matched with a partner of background 𝑠’, but of
different genders. Observing different allocations to the partners of different genders means that there is
gender discrimination. Moreover, this discrimination is taste-based.
3.3. Expectations
Respondents are asked to guess the average amount that students from the partner’s institution
chose to send back to their matched partner from the respondent’s institution in the trust game. They
should report: 𝐸𝑠,𝑔,𝑠’,𝑔’(𝑟). Consider two players with characteristics (s,g), both matched with a partner
of background 𝑠’ , but of different genders. Different reports of expectations by gender would mean that
there is gender discrimination; moreover, this discrimination is statistical.
4. Experimental Design
We now discuss the experimental design.
Procedure: The experiments were conducted at the students’ institutions in sessions of 50-100 students
in a classroom large enough to ensure respondent anonymity. The instructions were given to each
participant, read aloud by the experimenters and projected on a computer projector. Respondents played
the games on a paper questionnaire and were matched with an actual partner ex-post, so they did not
learn the identity or action of their partner while playing the game. The questionnaire was administered
in Urdu at all places except one of LUs where it was conducted in English, since students there are more
used to reading and writing in English.7 Moreover, the questionnaires were identical across all the
institutions up to the section leading into the experiments.
Games: Students were asked to play the following games:
- Trust game: Player A (the sender) is given a fixed amount of money (Rs. 300) and decides
whether to keep it or invest it by giving it to Player B (the receiver). If given to Player B, the
experimenter triples that amount and gives it to Player B who is asked to choose whether to
transfer any money back to Player A (which can be any amount between zero and Rs. 900). The
efficient outcome is for Player A to invest the money by transferring it to Player B, while the
subgame perfect equilibrium is to keep the money. Lack of trust towards the partner may lead to
7 The translation was supervised by Zafar who speaks English and Urdu fluently to ensure that nothing was lost in translation.

13
inefficiencies. This is a binary version of the “trust game” introduced by Berg et al.(1995)—it is
binary in the sense that Player A can choose to send either nothing or the entire amount. In our
setting, all respondents played the role of Player A and the role of a Player B. When put in the
role of Player B, we use the strategy method and ask the respondent to report the amount he/she
would like to send back conditional on Player A deciding to invest.
- Dictator game: This is a one-stage game in which Player A (the sender) decides on the division
of a fixed amount of money (Rs 400) between himself/herself and Player B (the receiver). Player
B does not make any choice. Again, respondents play the role of both Player A as well as Player
B.8
- Expectations: Respondents were asked to guess the average amount that students from their
partner’s institution (that is, institution of the student in the role of Player B) chose to send back
to their matched partners – Player A (who were all students at the respondent’s own institution) –
in the trust game. Note that when students are asked to provide their expectations, they are asked
about the average payoffs for a pair of partners that is identical in terms of gender and institution
of the match. Also expectations were elicited after the respondent had made the decision in the
games.9
Treatment: The treatment in this experiment is the randomization of institution and gender of the
matched player. Each student was randomly matched with one of the five following partners: a male
student from a Liberal University, a female student from a Liberal University, a male student from an
Islamic university, a female student from an Islamic university, or a male Madrassa student. The
description of the match (with the exact name of the match’s educational institution and the partner’s 8 We chose a binary trust game and a continuous dictator game in order to make the differences in the decisions salient to the respondents. Since our sample pool is quite different from standard experimental settings and we were concerned about the literacy of the respondents and their ability to understand the decisions, we kept the games as simple and as distinct as possible from each other.
9 While we want to measure the respondent’s expectation of the amount his partner sends back in the trust game, we ask the respondent to guess the average amount sent back by all students of the same gender as the match from the partner's institution (who are matched with students in the respondent's institution). This is because, asking the respondent for his expectation of the amount sent back by his partner, may prompt the respondent to report expectations that rationalize his own investment decision in the trust game. We believe our approach mitigates this concern of ex-post rationalization, and is hence superior. The exact question wording was as follows: “If you, the sender, sent Rs. 300 in this game, the responder would receive Rs. 900 and had to decide how much to return to the sender and how much to keep for themself. Now we ask you to guess the average amount (out of Rs. 900) that students of gender (where gender = {male, female}) from “institution X” chose to return to students from your institution. Your reward will depend on your accuracy. You would receive Rs. 50 for choosing the correct interval, and zero otherwise. The interval that contains the average amount is: …”.
14
gender) was already printed on the paper questionnaire received by each participant, so students were
not aware that other participants in their session could possibly be matched with partners of different
gender and educational institutions.10 Each student was informed that they would play all the games
with the same partner. Students were given a short description of the institution they were matched with
but since the selected institutions are among the most well-known institutions, most students would have
some prior knowledge of them. We therefore have a between-subject design. Each student was matched
with only one partner of a given gender and institution, and could not have known if other students were
matched with someone from a different institution/gender (and what other potential institutions may
have been involved). In terms of implementation, the pairing was carried out after the experiment, with
replacement, and the match was one-way. This means that multiple students could possibly have been
matched with the same partner, and the partner with whom the student was matched may or may not
have been matched with the same student. Table 2 presents the sample sizes for each institution, and for
the various matches.11 Because we use a one-way match, the sum in a given row does not need to match
the sum in the corresponding column.
Payoffs: Respondents received financial compensation for their participation in the survey and the
games. Each received a show-up fee of Rs. 200 given on the day of the session. Some tasks were then
randomly chosen for determining the additional payoffs. One of the four roles (sender or receiver in the
trust game, sender or receiver in the dictator game) was randomly selected for compensation, along with
one of the four expectations questions (Rs. 50 if the respondent correctly identified the interval where
the actual average lies). Before making their decisions, students were informed that they would receive
compensation for one of the four roles, chosen at random. Once the sessions were completed, we
randomly matched students with a particular partner from the institution/gender indicated in their
questionnaire (and who also had to be matched with a partner of those characteristics) and determined
the payoffs. Subjects could pick up their compensation starting about one week after the completion of
the experiment. Respondents earned an average of Rs. 600 from the games. The overall average
10 As mentioned in Section 2.1, we had two participating liberal universities. Students belonging to those and matched with someone from a liberal university were matched with someone of their own university.
11 Students at Madrassas who were assigned a “Male Madrassa treatment” were matched either with a student at their own Madrassa or a different Madrassa (but one that belonged to the same school of thought). Because we do not find any systematic differences between the two in our analysis, the two groups are combined. Since it combines two treatments, more Madrassa students are matched with Madrassa students than with HighSES and MidSES students in Table 2.

15
compensation of Rs. 800 corresponds to about USD 10. The 2009 per capita GNI at purchasing power
parity in Pakistan was $2,710, compared to $46,730 in the US. This means the average compensation of
USD 10 corresponds to 0.4% of the GNI per capita. The US equivalent would be approximately USD
170. Therefore, the stakes involved in the experiments were very large.
5. Experimental results
Our main goals are to (i) identify whether there is gender discrimination in the trust game, i.e.,
whether players’ behavior differs by the gender of the partner, (ii) analyze the nature (statistical versus
taste-based) of this potential discrimination, and (iii) investigate whether potentially discriminatory
behavior varies according to the institutions of both the primary player and of the institution of his/her
partner. The theoretical model in Section 3 highlights the challenge we face in the identification of
discrimination. We therefore start by establishing whether there is any discrimination in the trust game,
and then move on to analyze the behavior in the dictator game and the expectations data to evaluate
whether any potential discrimination is statistical or taste-based. Because participants may treat partners
from different institutions differently for reasons unrelated to gender, our test for gender discrimination
will always be done by comparing how males and females from the same institution are treated. Our
focus is on gender discrimination by males, so in what follows, players are always males, while partners
can be males or females.
5.1. Gender discrimination
We begin by testing the following hypothesis:
Hypothesis 1: There is no gender discrimination in the trust game, conditional on partners’ institutions.
Table 3 presents the overall proportion of senders who chose to send the Rs. 300 in the trust
game, conditional on the institution and gender of both the sender and the responder. In order to test for
gender discrimination, we investigate whether investment behavior in the trust game varies by gender of
the partner, keeping institution of the partner and gender and institution of the primary player fixed. For
respondents belonging to a row institution, testing this hypothesis means testing for differences in the
investment behavior when matched with HighSES males versus HighSES females, and for testing for
differences when matched with MidSES males versus MidSES females. As a robustness check, we also
16
test for differences when aggregating HighSES and MidSES males versus HighSES and MidSES
females.
Table 3 provides two important results. First, HighSES males do not discriminate in their
behavior according to the gender of the matched partner, even after taking into consideration the
institution of the match. This is demonstrated by the fact that none of the two sets of pairwise hypothesis
tests that we conduct (Wilcoxon rank-sum and t-test) between having a match with a male versus female
of a given institution type is statistically significant at conventional levels of significance for HighSES
males. Second, holding the institution of the matched partner fixed, we notice statistically significant
differences by gender in the behavior of MidSES and Madrassa students, which reveals important
interaction between gender and institutions. MidSES male students treat MidSES males and MidSES
females similarly, but treat HighSES females more favorably that they treat HighSES males: 55% of the
MidSES males sent money when matched with an HighSES male compared to 68% when matched to an
HighSES female (the difference is statistically different from zero at 10%). We also find that Madrassa
students treat HighSES males and HighSES females similarly, but treat MidSES females less favorably
than MidSES males: 80% of the Madrassas students sent money when matched with an MidSES male
compared to only 68% when matched to an MidSES female (the difference is statistically significant at
1%).
The first two columns of Appendix Table A1 analyze behavior in the trust game using a linear
regression framework. The dependent variable is a dummy for whether a participant sent money in the
trust game. In the first column, the independent variables include dummies for every potential pair of
partners. For example, the first dummy variable, HighSESplayer ×MidSESpartner, equals 1 for a pair
where the player is a HighSES male and the partner is from MidSES. Similarly, the second dummy,
HighSESplayer × (MidSESpartner × Female), equals 1 for a pair where the player is a HighSES male
and the partner is from MidSES and is female. The average behavior of a HighSES male student
matched with a male MidSES student is captured by the first variable, while the average behavior of a
HighSES male student matched with a female MidSES student is reflected by the sum of these two
variables. By comparing these two coefficients, we can test for whether MidSES females are treated
differently than MidSES males by HighSES males. We do find similar results as in Table 3: Madrassa
males are found to treat MidSES females less favorably than they treat MidSES males; the coefficient
Madrassaplayer × (MidSESpartner × female) indicates that they are 13.4 percentage points less likely
to send money to MidSES females in the trust game (relative to when matched with MidSES males) and

17
the coefficient is statistically significant at 5%. We also see that MidSES males treat HighSES females
more favorably than HighSES males (coefficient statistically significant at 1%), while they treat
MidSES males and females similarly. Notably, in column 2 when we add demographic characteristics as
controls, we see that the coefficient of the dummies for the pairs are essentially unchanged.
5.2. Nature of Discrimination
These results highlight differences in how males invest (i.e., whether they send money to the
matched partner) in the trust game depending on the gender of their partners, holding institutions fixed.
As highlighted in the theoretical framework, there are several dimensions of preferences and beliefs that
may motivate a subject to invest in the trust game. One motivation could be unconditional other-
regarding preferences. Another one could be beliefs about trustworthiness of the partner (Dufwenberg
and Gneezy, 2000; Cox, 2004; Ashraf et al., 2006). Finally, risk preferences may play a role in the
decision (Karlan, 2005; Schecter, 2007).
Empirically, determining which one has the largest weight in influencing behavior is important
to understand the nature of players’ discriminatory behavior. This is of interest to academics, but of
particular relevance to policy-makers since effective policies and legislation to deal with gender
discrimination can be crafted only if the nature of discrimination is understood. For example, the lower
likelihood of male Madrassa students to send money to MidSES females in Table 3 could be because
they either believe MidSES females to be less trustworthy (in which case this would be statistical
discrimination) or because they exhibit lower unconditional other-regarding behavior towards MidSES
females (in which case this would be taste-based discrimination), or both. Moreover, while HighSES
males exhibit similar investment behavior in the trust game towards males and females conditional on
match institution, as we explain in Section 3, their action could still be consistent with different levels of
trust and of unconditional other-regarding behavior towards males and females. For example, they may
think that females are not as trustworthy as males, but then invest equally with the two genders because
of stronger unconditional other-regarding preferences towards females.12 Results from the trust game
alone do not allow the identification of the relative roles of those dimensions (Cox, 2004).
12 Since students were randomly assigned a treatment (i.e., match type), differences in risk preferences cannot explain any of the results since there is no reason to believe that risk preferences would change by match type. We, therefore, do not focus on this explanation when decomposing behavior in the trust game. We have qualitative measures of risk preferences from the respondents, and they are in fact similar within each treatment conditional on the student’s institution.
18
Our multiple-game experimental design, however, allows us to separately measure unconditional
other-regarding behavior and expected trustworthiness, and therefore to isolate the nature of
discrimination. In the dictator game, the only motive for sending money to the partner is preferences
(unconditional other-regarding behavior). We can thus learn more about taste-based discrimination by
analyzing how students play that game. In addition, the elicitation of expected average amount sent back
by each match group to students from their own institution gives us a measure of expected
trustworthiness towards each group, and therefore gives us an indication of statistical discrimination. We
then test the following hypothesis:
Hypothesis 2: There is no statistical discrimination by gender, conditional on partners’ institutions.
In this framework, statistical discrimination would arise if students had different expectations of
trustworthiness of the two genders. Data on expectations reported by individuals regarding the average
amount expected from the matched group allow us to investigate this in Table 4. Note that respondents
choose an interval for the average expected amount and do not report a point estimate for the exact
average. The mean and median amounts presented in Table 4 are those obtained by allocating as average
expected amount the middle of the chosen interval. To show the distribution of expectations, we also
present the proportion of respondents who expect to receive more than Rs. 200 and more than Rs. 300.
Those are obtained directly from respondents’ answers without any assumption. Again, we focus on the
differences in expectations by gender keeping the institution of the match fixed.
Three points from this table are of note. First, HighSES students believe males and females
within an institution to be equally trustworthy: none of the three sets of pairwise hypothesis tests that we
conduct— t-test, Wilcoxon rank-sum, and Kolmogorov-Smirnov—between having a match with a male
versus female of a given institution type (HighSES male versus HighSES female; MidSES male versus
MidSES female) are statistically significant at conventional levels of significance for HighSES males.13
13 The p-values for these tests are not reported in the table. Instead, they are denoted by asterisks on the mean, median, and sample size, respectively, in the relevant female column. The t-test is a parametric test for the equality of the means (under the assumption that the variable is normally distributed); the Wilcoxon rank-sum test is a non-parametric analog to the t-test, and is a rank sum test: The Wilcoxon test ranks all of the observations from both groups and then sums the ranks from one of the groups which is compared with the expected rank sum. It is possible for groups to have different rank sums (and hence the test of equality being rejected) and yet have equal or nearly equal medians. Finally, the Kolmogorov-Smirnov test is a non-parametric test for the equality of continuous distributions.
19
Second, we again note some differences by gender of the matched partner for MidSES students.
MidSES males believe MidSES females to be less trustworthy than MidSES males (difference in the
mean is statistically significant from zero at 10%), while they expect HighSES females to be more
trustworthy than HighSES males (the proportion expected to send back more than Rs. 200 is statistically
significant at 10%). Recall that they were more likely to send money to HighSES females in the trust
game, so positive statistical discrimination may explain this. Note, however, that there was no difference
in their investment behavior by gender for partners from midSES. Third, Madrassa students expect
females to be more trustworthy than males. In particular, Madrassa students expect females to return
about Rs. 25 more on average than their male counterparts (this difference is statistically significant at
5% when aggregating HighSES and MidSES), and assign a 8 percentage-point higher probability to
females sending back more than Rs. 300 than males (this difference is statistically significant at 10% for
both MidSES and HighSES). Similar qualitative results are shown in a regression framework with and
without demographic controls in columns (3) and (4) of Table A1. Recall that Madrassa students were
less likely to send money to MidSES females in the trust game. The results presented in Table 4 indicate
that statistical discrimination cannot explain their differential behavior by gender in the trust game. In
fact, keeping unconditional other-regarding behavior constant, given that Madrassa students expect
females to be more trustworthy than males, they should be investing more in the trust game when
matched with females than with males.
Overall, this would suggest that the gender discrimination observed in the trust game by
Madrassa students is largely taste-based. Behavior in the dictator game—where the main motivation for
sending money to the matched partner is unconditional other-regarding behavior—allows us to
investigate this further. We next test the following hypothesis:
Hypothesis 3: There is no taste-based discrimination by gender, conditional on partner’s institution.
Table 5 shows the average amounts sent in the dictator game for all pairs of partners. Madrassa
students send lower amounts on average to females than males. The differences appear not to be
statistically significant when we consider each institution separately, but if we compare females from
MidSES and HighSES against males from MidSES and HighSES (last two columns), we find a
statistically significant difference in average amount sent using a t-test (P-value=0.051) and using the

20
Wilcoxon rank-sum test (P-value=0.032). This suggests that Madrassas student exhibit taste-based
discrimination against females.
Regarding HighSES males and MidSES males, the three sets of pairwise hypothesis tests
between having a match with a male versus female of a given institution type (HighSES male versus
HighSES female; MidSES male versus MidSES female) that we conduct are not statistically significant,
suggesting that there is no significant taste-based discrimination by those groups of students. However, a
much higher proportion of MidSES males send nothing in the dictator game to MidSES females
compared to MidSES males (26.7% versus 16.3%) and the difference is statistically significant at 10%.
This is consistent with some form of taste-based discrimination against MidSES females. The last two
columns of Table A1 investigate this within a regression framework and show similar qualitative
(though less precisely estimated) results.
We now summarize all our results presented so far by institutions:
RESULT 1: HighSES male students do not exhibit any statistical or taste-based gender discrimination.
RESULT 2: MidSES male students favor HighSES females in the trust game but treat MidSES males and
MidSES females similarly. They exhibit statistical discrimination in favor of HighSES females, but
exhibit (primarily statistical) discrimination against MidSES females compared to their male
counterparts.
RESULT 3: Male Madrassa students discriminate against MidSES females (but not HighSES females)
in their investment behavior in the trust game. This is despite the fact that they believe females to be
more trustworthy than males, and because they exhibit taste-based discrimination against both MidSES
and HighSES females.
5.3. Relative versus absolute position
Thus far, the focus of our study led us to analyze behavior and perceptions towards males and
females within an institution (or social identity). From the women’s perspective, such discrimination is
relevant for their well-being if they care about their relative position compared to men of similar social
identity. Recent empirical work has documented a systematic correlation between measures of relative
income and happiness/subjective well-being (e.g., Luttmer, 2005; Clark et al. 2008) and reported job
21
satisfaction and turnover (e.g., Clark and Oswald, 1996; Card et al., 2012). Absolute position may also
be relevant to women and it is therefore interesting to evaluate which groups of males treat females
better in absolute terms. The last few rows in Tables 3 and 5 report the p-values of the F-test and
Kruskal-Wallis test testing for equality of means and distribution for each column of matched partner
(i.e., conditional on a match group, testing for equality of means and distribution across institutions). It
enables us to investigate whether there are systematic differences by groups in their investment behavior
for Table 3 or other-regarding behavior for Table 5 towards MidSES and HighSES females. Table 3
shows that there are statistically significant differences (as indicated by the low p-values of the two tests
in the last two rows), and that a higher proportion of Madrassa students invest with female partners at
both MidSES and HighSES compared to HighSES and MidSES males. A similar pattern is observed in
the dictator game: Madrassa students give more to female students in the dictator game than any other
groups of males. This is because Madrassas students tend to invest more in the trust game and give more
in the dictator game than the other groups of males. Thus, even though they treat females worse than
males, they still treat females better than the other groups of males.
More generally, column (1), in both Tables 3 and 5, shows that students in the various
institutions differ significantly in their investment behavior and dictator game split, respectively.
Conditional on matches with male students (columns 2, 4, 6, and 7 of the tables), we see that Madrassa
students exhibit significantly higher trust and stronger unconditional other-regarding behavior. We do
not explore this point in this paper since here the focus is on gender discrimination. This issue is
discussed in detail in Delavande and Zafar (2013).
It should also be pointed out that, compared to existing studies, we find very high levels of trust
and other-regarding behavior in our sample. About 70% of the respondents invest in the trust game. This
is in the higher range of what respondents have been found to send in the few studies that use a version
of the binary trust game, where the investment rate varies from 32% (Bohnet and Huck, 2004) to 91%
(Engle-Wornick and Slonim, 2004).14 Our average split of Rs. 164.5 (~40% of endowment) in the
dictator game is also quite high when compared to the standard of dictators typically sending between
20% and 30% of their endowment in both developed as well as developing countries (Camerer, 2003;
14 One needs to be cautious in making any comparisons with the few studies that employ a binary trust game, since small modifications in the design (such as stake size, stake increase in the investment game—in our case three times, specifics of the match that the respondent is informed about, sample characteristics) can result in large differences. The continuous trust game has been employed by more studies. Players A (trustors) send about 50% of their endowment in such games in developed as well as developing countries (Camerer, 2003; Cardenas and Carpenter, 2005).
22
Cardenas and Carpenter, 2005). In Delavande and Zafar (2013), we present detailed evidence that these
high levels of pro-social behavior are not a consequence of other confounds, such as students not
understanding the games, or not finding the incentives credible.
6. Discussion of Potential Mechanisms
We find that Madrassa students are the only group of males who discriminate against females
(from midSES) in the trust game. A relevant question for policy is the extent to which this result is a
consequence of selection into institutions versus teaching at the institutions. It is hard to speculate about
the role of Madrassa teachings and environment in explaining our results. The relationship between
Islam and treatment of women remains contentious (see discussion in Adida et al., 201115). Despite
widespread gender imbalances observed in Muslim societies, Islamic teachings state that men and
women are both equal, and Islam accords rights of inheritance and ownership to women (Badawi, 1995;
Lewis, 2002).16 However, many of the Islamic ancient texts and imperatives are open to interpretation,
and there is considerable variation in how they are implemented. We also know little about how
Madrassas teach their students to interpret these texts and rulings. We present some suggestive evidence
that may shed light on whether the behavior of Madrassa students towards females is driven by selection
or teaching, or both.
We conduct the following thought experiment within the pool of Madrassa students. In another
part of the survey, respondents were asked which type of institutions they would attend if they were
admitted to all institution types and all expenses would be covered. Twelve percent of the Madrassa
students stated that they would choose to attend a non-Madrassa institution under those conditions (i.e.,
would “switch”). We can think of these students as not selecting into Madrassas on the basis of
(observable and unobservable) characteristics since they would have attended another institution without
budget or qualification requirements constraints. That is, the difference in behavior between these
students and those who would attend a Madrassa regardless should identify the extent to which selection
into Madrassas drives our results. We find that this group of students invests at a significantly higher
rate with female matches than students who would have chosen a Madrassa anyway: conditional on
15 Adida et al. (2011) use dictator games supplemented with survey data to isolate the Muslim effect, and present causal evidence on the relationship between Islam and gender discriminatory behavior. 16 In fact, medieval Islamic societies were far more progressive with regards to female rights than their European counterparts (Shatzmiller, 1997; Lewis, 2002).
23
having a female match, the proportion of Madrassa students who invest in the trust game is respectively
93.6% and 72.9% (p-value of 0.002 for a pairwise t-test). This suggests that selection into Madrassas
plays a role in the gender-discriminating behavior of Madrassa students.
We also look at how the behavior of Madrassa students varies by how many years they have
spent in a Madrassa environment.17 While the decision of how many years to spend in a Madrassa is not
fully exogenous, we describe the differences in behavior for illustration purposes.18 Conditional on
being matched with female students, the investment rate of Madrassa students who have spent more than
8 years in a Madrassa (about a third of our sample) was 73.9%, compared to 78.3% for those who had
spent 8 or fewer years in a Madrassa (with the difference not statistically different; p-value = 0.351).
Therefore, more time spent in a Madrassa environment does not seem to be correlated with less trust of
females. Based on these pieces of suggestive evidence, it seems that selection into a Madrassa, rather
than exposure to the Madrassas’ teachings, is an important factor in explaining the different behavior
towards women (relative to comparable men) that we observe of Madrassa students.
The fact that MidSES males, who are closer to the Madrassa students in terms of religiosity and
wealth but are exposed to very different teachings, exhibit some form of discrimination against MidSES
females (though not in the trust game) is also consistent with background characteristics being
important. We further investigate the role of socio-economic status and religiosity in Table 6. Table 1
shows that, within each institution type, there is heterogeneity in terms of income and religiosity. For
example, the proportion of male students from a high income family (parents earning more than Rs
32,500 per month) is 69% at HighSES, 32% at MidSES, and 8% at the Madrassas. Similarly, the
proportion of students with high religiosity (reporting 9 or 10 on the 0-10 scale) is 6% at HighSES, 8%
at MidSES, and 77% at the Madrassas. The dependent variables in Table 6 are the behavior in the games
(dummy for investing in the trust game, amount sent in the dictator game, and amount expected back in
the trust game, respectively). We conduct separate regressions by partner’s institutions and evaluate how
being matched with a female partner interacted by measures of socio-economic status and religiosity
17 The Madrassa students in our sample are those pursuing an “Alim” degree, which is equivalent to a Bachelor’s degree. However, students enrolling in this degree come from different academic backgrounds. Some of them may have studied in a Madrassa throughout, and others may have joined at different points in time. In our sample, students have spent 7.6 years on average in any Madrassa. However, there is substantial heterogeneity in our sample: 10 percent of the students have spent less than 4 years in a Madrassa, and 10 percent have spent more than 12 years in a Madrassa. 18 If we assume that the selection into Madrassas is negative (i.e., students likely to enroll and spend longer in Madrassas are less likely to trust females to begin with)—of which we find some evidence above—then any difference that we find by years spent in a Madrassa would be biased upwards.
24
influence behavior in the games, while controlling for other characteristics, and, importantly, the main
player’s institution. The second column in Table 6 shows that, among players matched with a partner
from HighSES, those from a high income household are, on average, 20.8 percentage points more likely
to invest in the trust game with females, than those from a low income family (the estimate is
statistically significant at 5%). In column 3, we see that, among players matched with a partner from
midSES, those from a low income family on average give less in the dictator game to females, compared
to those from middle or high income families: males from middle (high) income families send Rs. 30
(Rs. 21) more to female partners from midSES (however, only the estimate for female partner interacted
with middle income is statistically significant). In Table 6, we see that none of the interaction terms
between female partner and religiosity are statistically different from zero. This is consistent with the
idea that our results are driven by socio-economic status rather than religiosity: men from lower socio-
economic status seem more prone to discriminate against women from poorer backgrounds.
It should also be pointed out that the only institution where we find that males do not treat female
partners differently – HighSES – has gender-mixed education. The limited interaction between genders
in the gender-segregated MidSES and Madrassa environments may lead to prejudice and incorrect
beliefs about females. In the Indian context, Rao (2013) for example finds that being mixed with poor
students makes other students overall exhibit more pro-social behavior. However, in our context, we
also find that Madrassa students severely overestimate the amount returned by female matches in the
trust game (they expect on average 85% of women to send back more than Rs. 300 in the trust game,
while 67% do so), so it is not clear whether increased interactions with females would mitigate the
discrimination that we observe.
In Section 2.2, we note that, at both MidSES and HighSES, females tend to come from slightly
more favorable backgrounds than their male counterparts. One may therefore wonder whether looking at
gender discrimination while holding the institution fixed truly isolates gender discrimination. We first
note that it is quite unlikely that students are aware of these small differences (the gender difference in
characteristics within the institutions was a surprise to us and our survey team). We also note that,
despite the fact that in both institutions, females have higher socioeconomic status than men, the
discrimination we highlight is asymmetric: HighSES females tend to be favored compared to
corresponding males, while MidSES females tend to be disadvantaged compared to MidSES males. If
students are aware of these differences and if higher socio-economic status mitigates discrimination, this

25
suggests that the discrimination we find against MidSES females would have been worse if they were
perceived to be of similar socioeconomic characteristics as their male counterparts.
7. Conclusion
Women in South Asia lag behind men in many domains. In the Pakistani context, our paper
shows interesting interactions between social identity and gender discrimination: gender discrimination
is not uniform across the educated Pakistani society and varies in nature and intensity as a function of
the social identity of both individuals who interact. We fail to find evidence of Liberal University
(HighSES) male students—who are wealthier, less religious and more exposed to Western ideas—
discriminating against women. Madrassa students, who come from more humble backgrounds, are more
religious and relatively unexposed to Western ideas, exhibit taste-based discrimination against women.
However, because they give and trust more than any other groups, they actually treat women almost as
well or better (in absolute terms) than other groups of males in the society. Islamic University (midSES)
male students, who fare in the middle in terms of wealth and religiosity, have a less uniform behavior:
their behavior towards males and females depends on the institutions (or social identity) of the person
with whom they interact. Islamic University males favor Liberal University females while they do not
favor Islamic University females compared to their male counterparts in the trust game, and exhibit
mostly statistical discrimination against Islamic University females.
Our results are based on economic decision-making experiments. One reason for using this
approach is that experiments illustrate actual behavior rather than what respondents believe and report to
be their own behaviour. Second, experiments allow us to investigate the nature of discrimination—
something that is extremely challenging using observational data. To what extent is the discrimination
that we document using these games generalizable to real-world interactions? We do not have a clear
answer to this question, since we do not observe naturally-occurring interactions in real settings for the
respondents in our sample. However, evidence from few studies that combine data from laboratory
games that measure social capital and pro-social behaviour, and behaviour in real settings indicate that
laboratory measures tend to be good predictors of behaviour in real-world situations (Karlan, 2005;
Benz and Meier, 2008; Baran et al., 2010). While it is unclear how gender discrimination in trust exactly
translates into discrimination in different situations, almost all bilateral exchanges—in the labor market
or other market interactions—do require trust. For our results to have relevance, it suffices that trust
26
matters, and that some part of the discrimination in trust channels into different dimensions. Consistent
with our experimental results, and its potential ramification in the labor market, we do find that, high-
socioeconomic status women (from the Liberal University) expect to earn as much as their male
counterparts after completing their dregree, while lower-socioeconomic status women (from the Islamic
University) expect to earn 18% less on average than their male counterparts.
Because socio-economic status is negatively correlated with religiosity and lack of exposure to
Western idea in our data, we cannot categorically determine the mechanisms that explain the gender
taste-based discrimination that we identify. Yet, we provide some suggestive evidence that
socioeconomic status, rather than religiosity or exposure to religious teachings, seem to be driving
students’ behavior toward women. Independently of the exact mechanisms, within elite groups, higher
status women are favored and less discriminated against in Pakistan, which may explain why some are
able to reach important leadership positions.
Generally, it is believed that educating women may by itself lead to female empowerment and
thus result in less gender discrimination. In our study, both groups of females are pursuing the same
level of education (Bachelor’s degrees), and studying similar subjects. Yet, wealthier and less religious
females are favoured in some instances while less wealthy and more religious females are discriminated
against, by certain male respondents. Since it is unclear why women would be discriminated against
because they are more religious, we speculate that the difference in socio-economic status is driving this
difference in discrimination. Note however that the behavior of our male respondents matched with male
partners does not differ by the institution of their match, i.e., social identity seems to be irrelevant in the
male-male interactions.19 This suggests that, when men interact with women, the woman’s social class is
such a powerful construct that it continues to remain salient. This is particularly striking, since we focus
on interactions of highly-educated individuals in a country where less than 10% of adults have a
Bachelor’s degree (Pakistan Labor Force Survey, 2008/2009).
Our findings present a conundrum to policy-makers. Women belonging to lower socioeconomic
class generally have fewer chances of upward social mobility, and have greater constraints. That
females—but only those belonging to the lower social class—are discriminated against by (certain)
males, indicates that those females who are already at a disadvantage to start out with are further 19 This can be seen by comparing the investment levels across male matches within an institution (that is, a given row) in Table 3, or behavior in the dictator game in Table 5. The tables in this paper do not report results for pairwise comparisons of male matches (all of which are statistically insignificant). Interested readers are instead referred to Delavande and Zafar (2013) which focuses on male-male matches only.

27
marginalized. This suggests that social identities (such as class, ethnicity, race, etc.) are a powerful
construct, and simply educating women may not be enough to overcome the distortions that are
introduced by these other dimensions. Our results then imply that policies aimed at empowering women
need to take into account the interaction of gender with social class. For example, simply promoting
education for girls or allocating quotas to women in political or other spheres may not be sufficient to
change attitudes towards women, and such policies may need to incorporate other characteristics—such
as socio-economic background—along with gender.
The taste-based nature of the discriminatory behavior of Madrassa students is also a challenge
for policy design. In developed countries such as the US, rules forbidding taste-based discrimination
have been erected for decades, and have been fairly effective at ameliorating taste-based discrimination
(Gneezy et al., 2012). However, in developing settings such as the one in this study, it is not clear how
effective such legislation would be. In addition, it is generally easier to implement policies that attenuate
statistical discrimination by removing information inefficiencies.20 On the other hand, successful
policies for altering gender tastes are less clear—they require understanding the formation of
preferences, which is a challenging task.
20 For example, Beaman et al. (2009) find that exposure to female leaders (through mandated quotas) erases statistical discrimination against them by male villagers in India, but does not alter tastes for them.
28
References
Adida, C., D. Laitin, and M. Valfort. 2011. “Gender, Generosity, and Islam: A Perspective from France.” Working Paper. Ahmad M. 2004. “Madrassa Education in Pakistan and Bangladesh,” in Religious Radicalism and Security in South Asia, edited by S. Limaye, M. Malik and R. Wirsing, Asia-Pacific Center for Security Studies, Hawaii. Akerlof, G. and R. Kranton. 2000. “Economics and identity.” Quarterly Journal of Economics, 115(3): 715-753.
Alderman H., and P. Gertler. 1989. "Family Resources and Gender Differences in Human Capital Investments: The Demand for Children's Medical Care in Pakistan." Mimeo
Ali, S. 2009. Islam and Education: Conflict and Conformity in Pakistan’s Madrassahs. Karachi: Oxford University Press. Altonji, J., and R. Blank. 1999. “Race and Gender in the Labor Market” in O. Ashenfelter and D. Card, (eds), Handbook of Labor Economics Volume 3c Elsevier Science B.V: 3144-3259 Andreoni, J. 1990. "Impure Altruism and Donations to Public Goods: A Theory of Warm-Glow Giving?" Economic Journal, 100(401): 464-77. Andreoni, J., and J. Miller. 2002. “Giving According to GARP: An Experimental Test of the Consistency of Preferences for Altruism.” Econometrica, 70(2): 737-53. Ashraf, N., I. Bohnet, and N. Piankov. 2006. “Decomposing Trust and Trustworthiness.” Experimental Economics, Special Issue on Behavioral Economics, 9(3): 193-208. Aslam, M. 2009. “Education Gender Gaps in Pakistan: Is the Labor Market to Blame?” Economic Development and Cultural Change, Vol. 57, No. 4 (July 2009), pp. 747-784. Ayres, I., and P. Siegehnan. 1995. "Race and Gender Discrimination in Bargaining for a New Car." American Economic Review, 85: 304-21. Badawi, J. 1995. Gender Equity in Islam: Basic Principles. American Trust Publications. Bhalotra, S. and T. Cochrane, 2010. “Where Have All the Young Girls Gone? Identification of Sex Selection in India,” IZA Discussion Papers 5381, Institute for the Study of Labor (IZA). Baran, N., P. Sapienza, and L. Zingales. 2010. “Can We Infer Social Preferences from the Lab? Evidence from the Trust Game.” NBER Working Papers 15654. Barcellos S., L. Carvalho and A. Lleras-Muney. 2014. “Child Gender and Parental Investment in India: Are Boys and Girls Treated Differently?” American Economic Journal: Applied Economics, 6(1): 157-89. Basu, A. M. 1989. “Is Discrimination in Food Really Necessary for Explaining Sex Differentials in Childhood Mortality?" Population Studies 43 (2), 193–210. Beaman, L., R. Chattopadhyay, E. Duflo, R. Pande and P. Topalova. 2009. “Powerful Women: Does Exposure Reduce Bias?” Quarterly Journal of Economics, 124 (4): 1497-1540. Beath, A, F. Christia, and R Enikolopov. 2013. “Empowering Women: Evidence from a Field Experiment in Afghanistan.” American Political Science Review, 107(3): 540-557 . Becker, G. 1957. The Economics of Discrimination, University of Chicago Press
29
Behrman, J. 1988. “Nutrition, health, birth order and seasonality : Intra-household allocation among children in rural India.” Journal of Development Economics, 28(1): 43-62. Benz, M., and S. Meier. 2008. "Do People Behave in Experiments as in the Field?—Evidence from Donations." Experimental Economics, 11(3): 268-281. Berg, J., J. Dickhaut, and K. McCabe. 1995. “Trust, Reciprocity, and Social History.” Games & Economic Behavior, 10: 122-142. Bertrand, M., S. Black, S. Jensen and A.Lleras-Muney. 2014. “Breaking the Glass Ceiling? The Effect of Board Quotas on Female Labor Market Outcomes in Norway.” Working Paper. Bohnet, I., and S. Huck. 2004. “Repetition and Reputation: Implications for Trust and Trustworthiness When Institutions Change.” American Economic Review, 94(2): 362-366. Bolton, G., and E. Katok. 1995. "An Experimental Test for Gender Differences in Beneficent Behavior." Economic Letters, 48(3-4): 287-292. Bolton, G., and A. Ockenfels. 2000. “A theory of equity, reciprocity and competition.” American Economic Review, 90(1), 166-93. Borooah, Vani K. 2004. “Gender bias among children in India in their diet and immunization against disease." Social Science and Medicine, 58(9): 1719 – 1731. Browne, I., and J. Misra. 2003. "The Intersection of Gender and Race in the Labor Market." Annual Review of Sociology, 49: 487–513. Camerer, C. 2003. Behavioral Game Theory. Princeton: Princeton University Press. Card, D., A. Mas, E. Moretti, and E. Saez. 2012. “Inequality at Work: The Effect of Peer Salaries on Job Satisfaction,” American Economic Review, 102(6): 2981-3003. Cardenas, J., and J. Carpenter. 2005. “Experiments and Economic Development: Lessons from Field Labs in the Developing World.” Middlebury College Working Paper Series 0505, Middlebury College, Department of Economics. Castillo, M., R. Petrie, M. Torero, and L. Vesterlund. 2013. “Gender Differences in Bargaining Outcomes: A Field Experiment on Discrimination.” Journal of Public Economics, 99: 35-48. Charness, G., and M. Rabin. 2002. “Understanding Social Preferences with Simple Tests.” Quarterly Journal of Economics, 117(3): 817–69. Chen, L. C., E. Huq, and S. D'Souza. 1981. “Sex bias in the family allocation of food and health care in rural Bangladesh.” Population and Development Review, 7: 55-70. Clark, A., P. Frijters, and M. Shields. 2008. “Relative Income, Happiness, and Utility: An Explanation for the Easterlin Paradox and Other Puzzles.” Journal of Economic Literature, 46:1, 95–144. Clark, A., and A. Oswald. 1996. “Satisfaction and comparison income.” Journal of Public Economics, 61, 359-381 Coleman, I. 2004. “Gender Disparities, Economic Growth and Islamization in Pakistan,” in Islamization And The Pakistani Economy, R. Hathaway and W. Lee (eds). Collins, P. H. 2000. “Gender, Black Feminism, and Black Political Economy,” Annals of the American Academy of Political and Social Science, 568(1): 41–53.
30
Cox, J. 2004. “How to Identify Trust and Reciprocity.” Games and Economic Behavior, 46: 260-281. Crenshaw, K. 1991. "Mapping the Margins: Intersectionality, Identity Politics, and Violence against Women of Color." Stanford Law Review, 43(6): 1241–1299. Das Gupta, M. 1987. “Selective discrimination against female children in rural Punjab, India.” Population and Development Review, 13(1): 77-100. Delavande, A., and B. Zafar. 2013. “Stereotypes and Madrassas: Experimental Evidence from Pakistan.” Working Paper. Doepke, M. and M. Tertilt. 2009. “Women’s Liberation: What’s in it for Men?” Quarterly Journal of Economics, 124(4): 1541-1591. Dominitz, J. 1998. “Earnings Expectations, Revisions, and Realizations.” Review of Economics and Statistics, 80: 374–388. Duflo, E. 2012. “Women’s Empowerment and Development.” Journal of Economics Litterature, 50(4), 1051–1079. Dufwenberg, M., and U. Gneezy. 2000. “Measuring Beliefs in an Experimental Lost Wallet Game.” Games and Economic Behavior, 30: 163‐182. Engle-Warnick, J., and R. Slonim. 2004. “The evolution of strategies in a repeated trust game.” Journal of Economic Behavior & Organization, 55(4): 553-573. Fair, C. 2006. Islamic Education in Pakistan. United States Institute of Peace. Fehr, E., and K. Schmidt. 1999 “A Theory of Fairness, Competition and Cooperation.” Quarterly Journal of Economics, 114(3): 817-68. Fehr, E., U. Fischbacher, B. von Rosenbladt, J. Schupp, G. Wagner. 2002. “A Nation-Wide Laboratory-Examining Trust and Trustworthiness by Integrating Behavioral Experiments into Representative Surveys.” Schmollers Jahrbuch, 122: 519-42. Fershtman, C., and U. Gneezy. 2001. “Discrimination in a Segmented Society: An Experimental Approach.” Quarterly Journal of Economics, 116(1): 351–77. Fukuyama, F. 1995. Trust : The Social Virtues and the Creation of Prosperity. London: Penguin Books. Goldin, C., and C. Rouse. 2000. "Orchestrating Impartiality: The Impact of "Blind" Auditions on Female Musicians." American Economic Review, 90(4): 715-741. Gneezy, U., J. List, and M. Price. 2012. “Toward an Understanding of Why People Discriminate: Evidence from a Series of Natural Field Experiments.” NBER Working Paper 17855. Guiso, L., P. Sapienza, and L. Zingales. 2004. “The role of social capital in Financial Development.” American Economic Review, 94(3): 526-556. Hazarika, G. (2000): Gender Differences in Children's Nutrition and Access to Health Care in Pakistan, Journal of Development Studies, 37:1, 73-92 Hellerstein, J., D. Neumark, and K. Troske. 1999. “Wages, Productivity, and Worker Characteristics: Evidence from Plant-Level Production Functions and Wage Equations.” Journal of Labor Economics, 17(3): 409-446. Higher Education Commission Pakistan. 2012. Annual Report 2010-2011 Holmes, J. 2003. “Measuring the determinants of school completion in Pakistan: analysis of censoring and selection bias.” Economics of Education Review, 22(3): 249-264.
31
Jayachandran, S. 2014. “Fertility Decline and Missing Women.” Working Paper. Jayachandran, S., and I. Kuziemko. 2011. “Why Do Mothers Breastfeed Girls Less Than Boys? Evidence and Implications for Child Health in India.” Quarterly Journal of Economics, 126(3): 1-54. Karlan, D. 2005. "Using Experimental Economics to Measure Social Capital and Predict Financial Decisions." American Economic Review, 95(5): 1688–1699. Klasen S. 1994. ‘‘Missing Women Reconsidered.’’ World Development 22(7): 1061 – 71. Klasen, S., and C. Wink. 2003. “‘‘Missing Women” : Revisiting The Debate” Feminist Economics, 9(2-3), 263-299. Knack, S., and Keefer, P. 1997. “Does social capital have an economic payoff? A cross-country investigation.” Quarterly Journal of Economics, 112(4): 1251-1288. La Porta, R., F. Lopez-de Silane, A. Shleifer, and R. Vishny. 1997. “Trust in large organizations.” American Economic Review, 87(2): 333-338. Lewis, B. 2002. What Went Wrong?: The Clash Between Islam and Modernity in the Middle East. HarperCollins. List, J. 2004. “The Nature and Extent of Discrimination in the Marketplace: Evidence from the Field.” Quarterly Journal of Economics, 119(1): 49-89. List, J., and I. Rasul, 2011. Field Experiments in Labor Economics. Chapter 2 in Handbook of Labor Economics Volume 4, edited by Orley Ashenfelter and David Card, Elsevier, 104-228. Luttmer E, 2005. “Neighbors as Negatives: Relative Earnings and Well-Being” The Quarterly Journal of Economics, Vol. 120, No. 3, pp. 963-1002. Miller, B. D. 1997. The Endangered Sex: Neglect of Female Children in Rural North India. 2nd ed. Delhi: Oxford University Press. Neumark, D., 1996. “Sex Discrimination in Hiring in the Restaurant Industry: An Audit Study.” Quarterly Journal of Economics, 915-942. Ostrom, E. 1990. Governing the commons: The evolution of institutions for collective action. Cambridge: Cambridge University Press. Pakistan Census Organization, 1998. Census Report of Pakistan 1998, Pakistan Census Organization, GoP, http://www.pap.org.pk/statistics/population.htm#tab1.3. Pakistan Education Statistics. An Analysis of Educational Indicators of Pakistan 2010– 2011. Academy of Educational Planning & Management Publication No 244. Qian, N. 2008. "Missing Women and the Price of Tea in China: The Effect of Sex-Specific Earnings on Sex Imbalance." Quarterly Journal of Economics, 123(3): 1251-1285. Rahman, T. 2004. “The Madrassa and the State of Pakistan: Religion, Poverty and the Potential for Violence in Pakistan.” Himal South Asian. Rahman, T. 2008. "Madrasas: the potential for violence in Pakistan?" in J. Malik (ed), Madrassas in South Asia. Teaching terror? Routledge Contemporary South Asia Series, London and New York.
32
Rao, G. 2013. “Familiarity Does Not Breed Contempt: Diversity, Discrimination and Generosity in Delhi Schools.” Working Paper. Rose, E. (1999), “Consumption Smoothing and Excess Female Mortality in Rural India,” Review of Economics and Statistics 81(1): 41-49. Rosenzweig, M., and T. Schultz. 1982. “Market Opportunities, Genetic Endowments, and Intrafamily Resource Distribution: Child Survival in Rural India,” American Economic Review, 72(4): 803–15. Schechter, L. 2007. "Traditional Trust Measurement and the Risk Confound: An Experiment in Rural Paraguay." Journal of Economic Behavior and Organization, 62(2): 272-292. Sen, A. 2001. “Many Faces Of Gender Inequality” Frontline, Volume 18 - Issue 22, Oct. 27 - Nov. 09. Shatzmiller, M. 1997. "Women and Wage Labour in the Medieval Islamic West: Legal Issues in an Economic Context." Journal of the Economic and Social History of the Orient, 40(2): 174–206. Slonim, R. and P. Guillen. 2010. "Gender Selection Discrimination: Evidence from a Trust Game." Journal of Economic Behavior & Organization, 76(2): 385-405
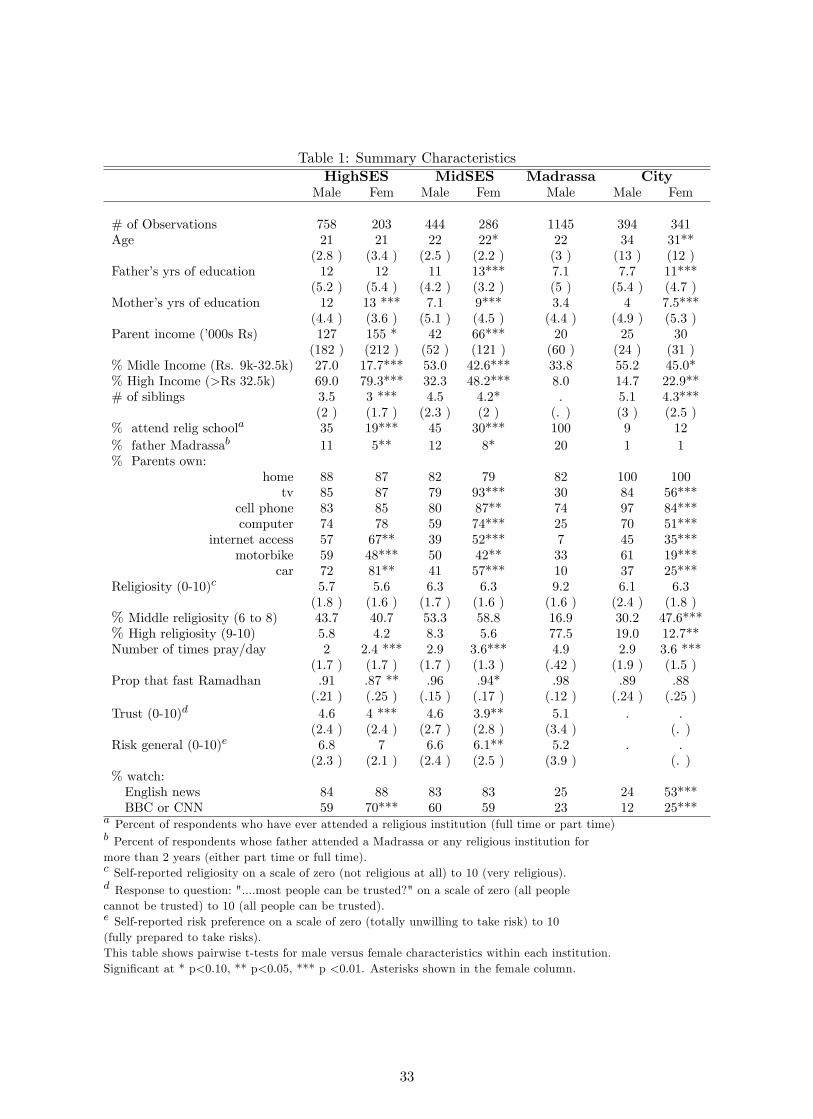
Table 1: Summary CharacteristicsHighSES MidSES Madrassa City
Male Fem Male Fem Male Male Fem
# of Observations 758 203 444 286 1145 394 341Age 21 21 22 22* 22 34 31**
(2.8 ) (3.4 ) (2.5 ) (2.2 ) (3 ) (13 ) (12 )Father’s yrs of education 12 12 11 13*** 7.1 7.7 11***
(5.2 ) (5.4 ) (4.2 ) (3.2 ) (5 ) (5.4 ) (4.7 )Mother’s yrs of education 12 13 *** 7.1 9*** 3.4 4 7.5***
(4.4 ) (3.6 ) (5.1 ) (4.5 ) (4.4 ) (4.9 ) (5.3 )Parent income (’000s Rs) 127 155 * 42 66*** 20 25 30
(182 ) (212 ) (52 ) (121 ) (60 ) (24 ) (31 )% Midle Income (Rs. 9k-32.5k) 27.0 17.7*** 53.0 42.6*** 33.8 55.2 45.0*% High Income (>Rs 32.5k) 69.0 79.3*** 32.3 48.2*** 8.0 14.7 22.9**# of siblings 3.5 3 *** 4.5 4.2* . 5.1 4.3***
(2 ) (1.7 ) (2.3 ) (2 ) (. ) (3 ) (2.5 )% attend relig schoola 35 19*** 45 30*** 100 9 12% father Madrassab 11 5** 12 8* 20 1 1% Parents own:
home 88 87 82 79 82 100 100tv 85 87 79 93*** 30 84 56***
cell phone 83 85 80 87** 74 97 84***computer 74 78 59 74*** 25 70 51***
internet access 57 67** 39 52*** 7 45 35***motorbike 59 48*** 50 42** 33 61 19***
car 72 81** 41 57*** 10 37 25***Religiosity (0-10)c 5.7 5.6 6.3 6.3 9.2 6.1 6.3
(1.8 ) (1.6 ) (1.7 ) (1.6 ) (1.6 ) (2.4 ) (1.8 )% Middle religiosity (6 to 8) 43.7 40.7 53.3 58.8 16.9 30.2 47.6***% High religiosity (9-10) 5.8 4.2 8.3 5.6 77.5 19.0 12.7**Number of times pray/day 2 2.4 *** 2.9 3.6*** 4.9 2.9 3.6 ***
(1.7 ) (1.7 ) (1.7 ) (1.3 ) (.42 ) (1.9 ) (1.5 )Prop that fast Ramadhan .91 .87 ** .96 .94* .98 .89 .88
(.21 ) (.25 ) (.15 ) (.17 ) (.12 ) (.24 ) (.25 )Trust (0-10)d 4.6 4 *** 4.6 3.9** 5.1 . .
(2.4 ) (2.4 ) (2.7 ) (2.8 ) (3.4 ) (. )Risk general (0-10)e 6.8 7 6.6 6.1** 5.2 . .
(2.3 ) (2.1 ) (2.4 ) (2.5 ) (3.9 ) (. )% watch:English news 84 88 83 83 25 24 53***BBC or CNN 59 70*** 60 59 23 12 25***
a Percent of respondents who have ever attended a religious institution (full time or part time)b Percent of respondents whose father attended a Madrassa or any religious institution formore than 2 years (either part time or full time).c Self-reported religiosity on a scale of zero (not religious at all) to 10 (very religious).d Response to question: "....most people can be trusted?" on a scale of zero (all peoplecannot be trusted) to 10 (all people can be trusted).e Self-reported risk preference on a scale of zero (totally unwilling to take risk) to 10(fully prepared to take risks).This table shows pairwise t-tests for male versus female characteristics within each institution.Significant at * p<0.10, ** p<0.05, *** p <0.01. Asterisks shown in the female column.
33
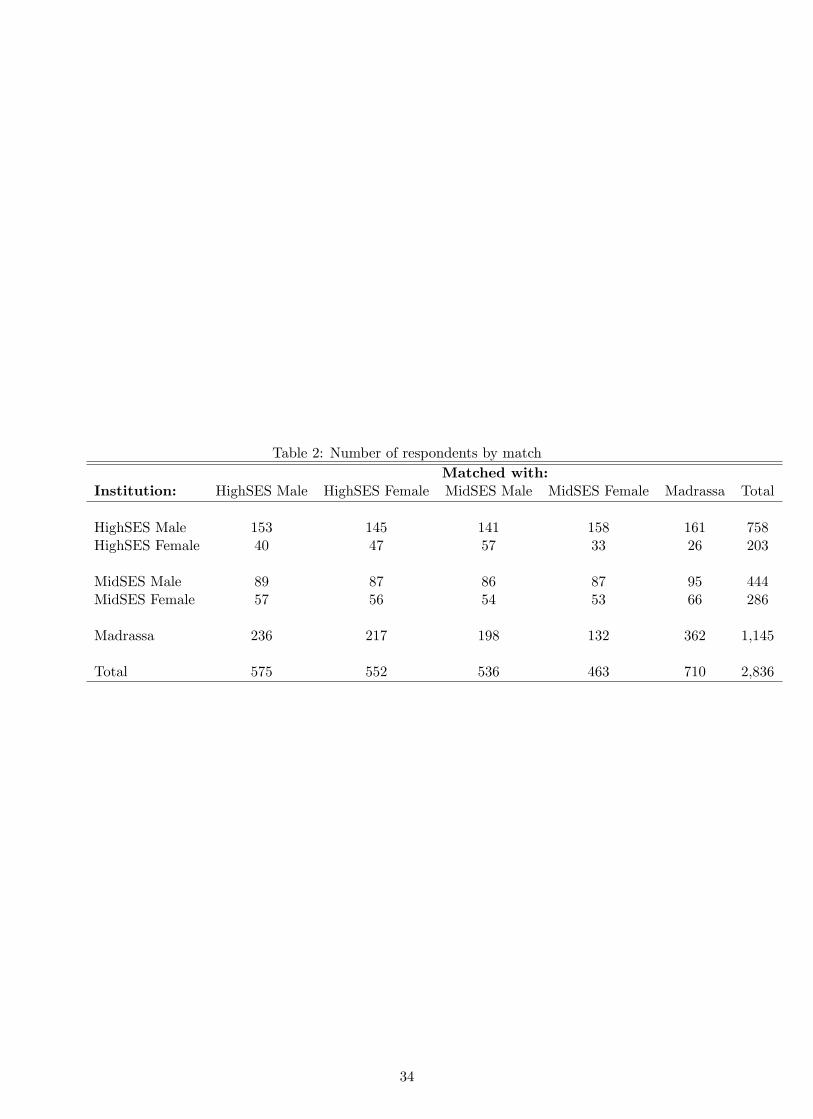
Table 2: Number of respondents by matchMatched with:
Institution: HighSES Male HighSES Female MidSES Male MidSES Female Madrassa Total
HighSES Male 153 145 141 158 161 758HighSES Female 40 47 57 33 26 203
MidSES Male 89 87 86 87 95 444MidSES Female 57 56 54 53 66 286
Madrassa 236 217 198 132 362 1,145
Total 575 552 536 463 710 2,836
34
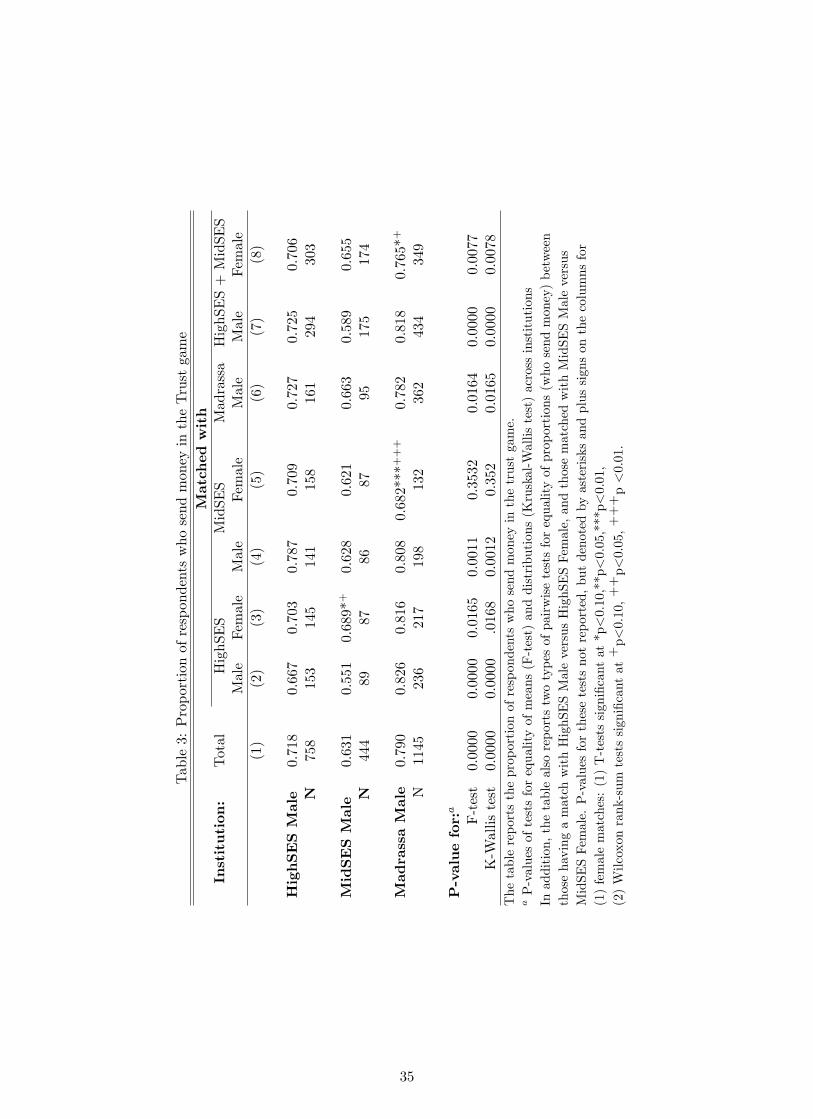
Table3:ProportionofrespondentswhosendmoneyintheTrustgame
Matched
with
Institution:
Total
HighSES
MidSES
Madrassa
HighSES+MidSES
Male
Female
Male
Female
Male
Male
Female
(1)
(2)
(3)
(4)
(5)
(6)
(7)
(8)
HighSESMale
0.718
0.667
0.703
0.787
0.709
0.727
0.725
0.706
N758
153
145
141
158
161
294
303
MidSESMale
0.631
0.551
0.689*+
0.628
0.621
0.663
0.589
0.655
N444
8987
8687
95175
174
MadrassaMale
0.790
0.826
0.816
0.808
0.682***+++
0.782
0.818
0.765*+
N1145
236
217
198
132
362
434
349
P-valuefor:a
F-test0.0000
0.0000
0.0165
0.0011
0.3532
0.0164
0.0000
0.0077
K-Wallistest
0.0000
0.0000
.0168
0.0012
0.352
0.0165
0.0000
0.0078
Thetablereportstheproportionofrespondentswhosendmoneyinthetrustgame.
aP-valuesoftestsforequalityofmeans(F-test)anddistributions(Kruskal-Wallistest)acrossinstitutions
Inaddition,thetablealsoreportstwotypesofpairwisetestsforequalityofproportions(whosendmoney)between
thosehavingamatchwithHighSESMaleversusHighSESFemale,andthosematchedwithMidSESMaleversus
MidSESFemale.P-valuesforthesetestsnotreported,butdenotedbyasterisksandplussignsonthecolumnsfor
(1)femalematches:(1)T-testssignificantat*p<0.10,**p<0.05,***p<0.01,
(2)Wilcoxonrank-sum
testssignificantat+p<0.10,++p<0.05,+++p<0.01.
35
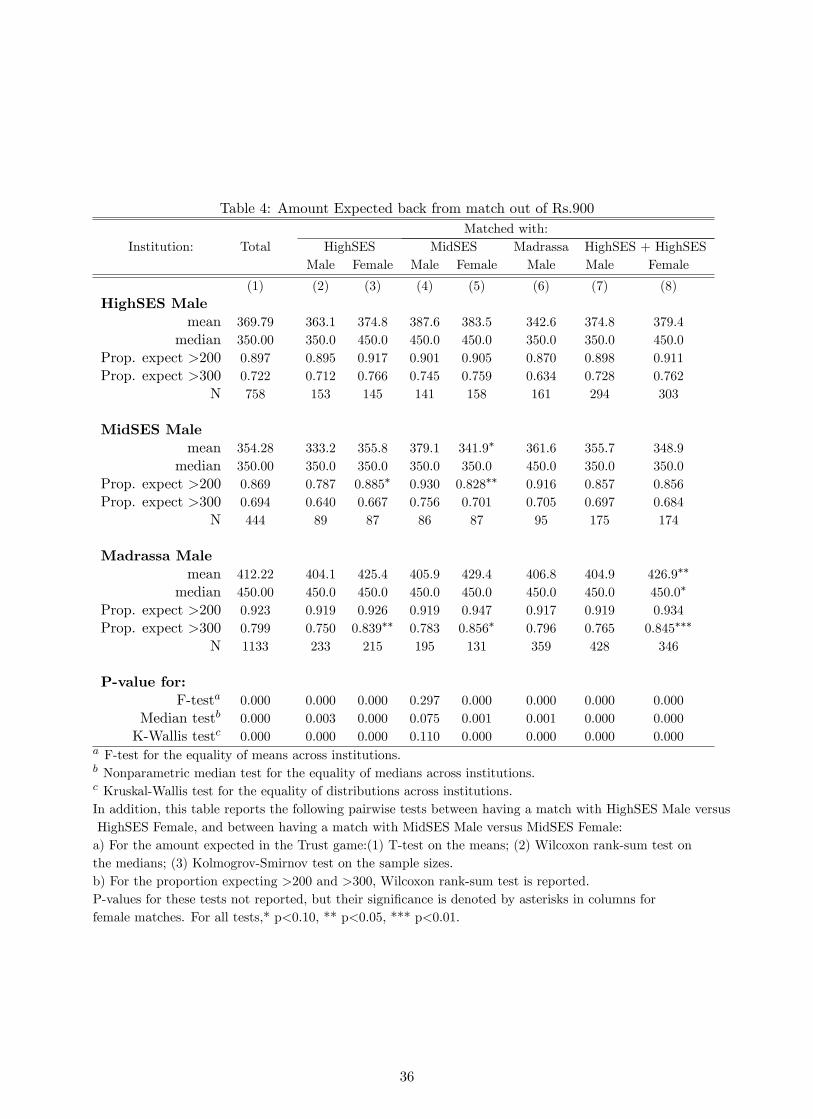
Table 4: Amount Expected back from match out of Rs.900Matched with:
Institution: Total HighSES MidSES Madrassa HighSES + HighSESMale Female Male Female Male Male Female
(1) (2) (3) (4) (5) (6) (7) (8)HighSES Male
mean 369.79 363.1 374.8 387.6 383.5 342.6 374.8 379.4median 350.00 350.0 450.0 450.0 450.0 350.0 350.0 450.0
Prop. expect >200 0.897 0.895 0.917 0.901 0.905 0.870 0.898 0.911Prop. expect >300 0.722 0.712 0.766 0.745 0.759 0.634 0.728 0.762
N 758 153 145 141 158 161 294 303
MidSES Malemean 354.28 333.2 355.8 379.1 341.9∗ 361.6 355.7 348.9
median 350.00 350.0 350.0 350.0 350.0 450.0 350.0 350.0Prop. expect >200 0.869 0.787 0.885∗ 0.930 0.828∗∗ 0.916 0.857 0.856Prop. expect >300 0.694 0.640 0.667 0.756 0.701 0.705 0.697 0.684
N 444 89 87 86 87 95 175 174
Madrassa Malemean 412.22 404.1 425.4 405.9 429.4 406.8 404.9 426.9∗∗
median 450.00 450.0 450.0 450.0 450.0 450.0 450.0 450.0∗
Prop. expect >200 0.923 0.919 0.926 0.919 0.947 0.917 0.919 0.934Prop. expect >300 0.799 0.750 0.839∗∗ 0.783 0.856∗ 0.796 0.765 0.845∗∗∗
N 1133 233 215 195 131 359 428 346
P-value for:F-testa 0.000 0.000 0.000 0.297 0.000 0.000 0.000 0.000
Median testb 0.000 0.003 0.000 0.075 0.001 0.001 0.000 0.000K-Wallis testc 0.000 0.000 0.000 0.110 0.000 0.000 0.000 0.000
a F-test for the equality of means across institutions.b Nonparametric median test for the equality of medians across institutions.c Kruskal-Wallis test for the equality of distributions across institutions.In addition, this table reports the following pairwise tests between having a match with HighSES Male versusHighSES Female, and between having a match with MidSES Male versus MidSES Female:a) For the amount expected in the Trust game:(1) T-test on the means; (2) Wilcoxon rank-sum test onthe medians; (3) Kolmogrov-Smirnov test on the sample sizes.b) For the proportion expecting >200 and >300, Wilcoxon rank-sum test is reported.P-values for these tests not reported, but their significance is denoted by asterisks in columns forfemale matches. For all tests,* p<0.10, ** p<0.05, *** p<0.01.
36
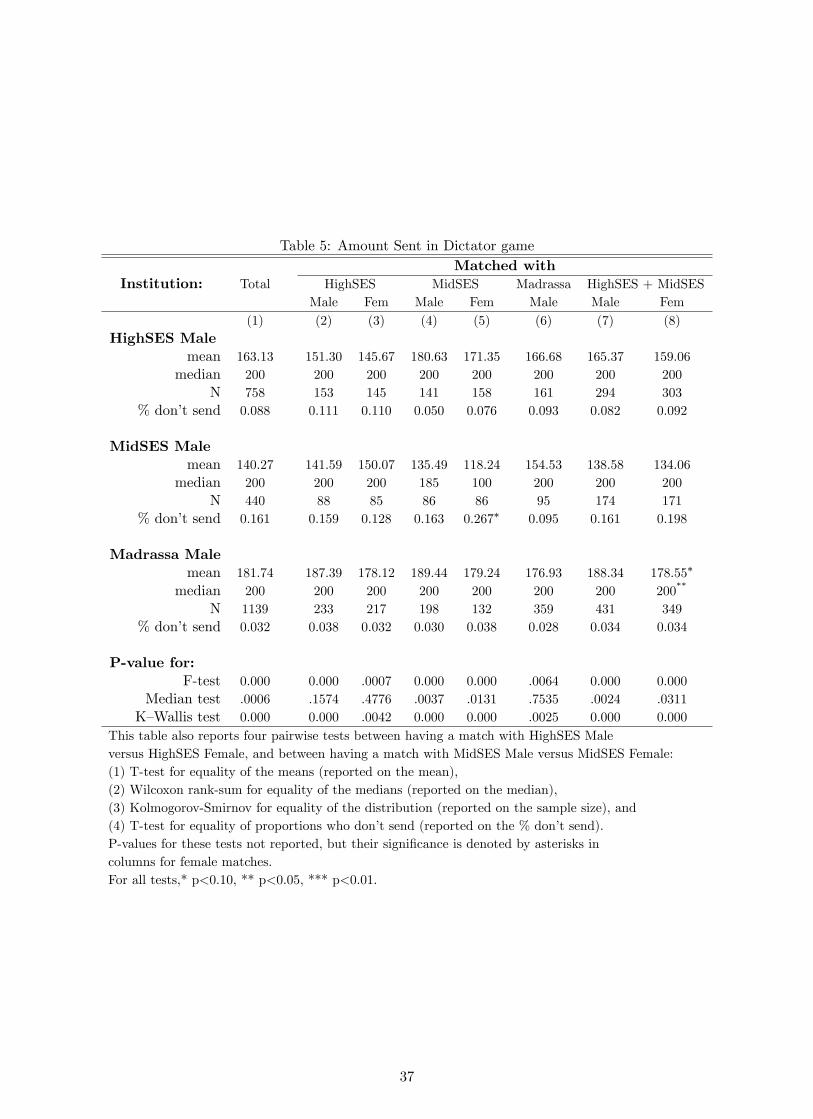
Table 5: Amount Sent in Dictator gameMatched with
Institution: Total HighSES MidSES Madrassa HighSES + MidSESMale Fem Male Fem Male Male Fem
(1) (2) (3) (4) (5) (6) (7) (8)HighSES Male
mean 163.13 151.30 145.67 180.63 171.35 166.68 165.37 159.06median 200 200 200 200 200 200 200 200
N 758 153 145 141 158 161 294 303% don’t send 0.088 0.111 0.110 0.050 0.076 0.093 0.082 0.092
MidSES Malemean 140.27 141.59 150.07 135.49 118.24 154.53 138.58 134.06
median 200 200 200 185 100 200 200 200N 440 88 85 86 86 95 174 171
% don’t send 0.161 0.159 0.128 0.163 0.267∗ 0.095 0.161 0.198
Madrassa Malemean 181.74 187.39 178.12 189.44 179.24 176.93 188.34 178.55∗
median 200 200 200 200 200 200 200 200∗∗
N 1139 233 217 198 132 359 431 349% don’t send 0.032 0.038 0.032 0.030 0.038 0.028 0.034 0.034
P-value for:F-test 0.000 0.000 .0007 0.000 0.000 .0064 0.000 0.000
Median test .0006 .1574 .4776 .0037 .0131 .7535 .0024 .0311K—Wallis test 0.000 0.000 .0042 0.000 0.000 .0025 0.000 0.000
This table also reports four pairwise tests between having a match with HighSES Maleversus HighSES Female, and between having a match with MidSES Male versus MidSES Female:(1) T-test for equality of the means (reported on the mean),(2) Wilcoxon rank-sum for equality of the medians (reported on the median),(3) Kolmogorov-Smirnov for equality of the distribution (reported on the sample size), and(4) T-test for equality of proportions who don’t send (reported on the % don’t send).P-values for these tests not reported, but their significance is denoted by asterisks incolumns for female matches.For all tests,* p<0.10, ** p<0.05, *** p<0.01.
37

Table6:BehaviorintheGamebySocio-economicandReligiosityStatus
DummyforinvestinTrustGamea
AmountSentinDictatorGameb
AmountExpectedBackinTrustGamec
Matchedto
Matchedto:
Matchedto:
MidSES
HighSES
MidSES
HighSES
MidSES
HighSES
Femalepartner
-0.157*
-0.030
-25.82*
-5.10
26.44
-1.05
(0.084)
(0.071)
(14.85)
(12.03)
(26.86)
(23.97)
MiddleIncome
0.008
-0.002
-18.90*
5.90
-0.721
11.21
(0.056)
(0.053)
(9.99)
(8.88)
(18.14)
(17.76)
HighIncome
-0.053
-0.075
-28.70**
-3.33
-4.09
-16.45
(0.067)
(0.062)
(11.97)
(10.43)
(21.66)
(20.72)
FemalepartnerxMiddleincome
-0.029
0.011
29.86**
-6.92
-36.41
3.84
(0.083)
(0.072)
(14.81)
(12.06)
(26.82)
(24.11)
FemalepartnerxHighincome
0.040
0.208**
20.77
5.92
-41.97
21.70
(0.088)
(0.080)
(15.60)
(13.44)
(28.20)
(26.76)
MiddleReligiosity
-0.012
0.001
11.94
-3.64
-5.61
-6.33
(0.053)
(0.051)
(9.40)
(8.52)
(17.00)
(17.06)
HighReligiosity
0.067
-0.024
11.97
-10.06
22.35
19.69
(0.060)
(0.053)
(10.56)
(8.92)
(19.18)
(17.85)
FemalepartnerxMiddlereligiosity
0.097
-0.065
-12.06
-2.22
10.65
25.28
(0.075)
(0.073)
(13.37)
(12.32)
(24.17)
(24.61)
FemalepartnerxHIghreligiosity
0.125
0.033
0.094
3.07
1.41
8.13
(0.084)
(0.073)
(14.92)
(12.34)
(26.99)
(24.59)
Riskgeneral(0-10)
0.011
0.004
0.277
-1.34
3.33
-0.797
(0.008)
(0.008)
(1.46)
(1.26)
(2.65)
(2.52)
OwnershipIndex(0-8)
0.008
0.006
2.66*
-0.595
0.998
2.27
(0.009)
(0.008)
(1.58)
(1.36)
(2.86)
(2.72)
Age
0.000
0.010*
1.31
0.906
1.43
0.615
(0.005)
(0.005)
(0.949)
(0.878)
(1.70)
(1.76)
MidSESUniversity
-0.075
-0.223***
-51.40***
-40.54***
-36.83**
-62.29***
(0.053)
(0.050)
(9.41)
(8.38)
(16.90)
(16.70)
HighSESUniversity
0.066
-0.149**
4.05
-36.65***
-7.00
-34.81**
(0.055)
(0.050)
(9.78)
(8.44)
(17.63)
(16.83)
Constant
0.682***
0.597***
152.20***
177.85***
351.19***
376.75***
(0.133)
(0.130)
(23.84)
(21.84)
(42.962)
(43.78)
NumberofObservations
793
904
792
898
789
900
aOLSregressionofdummyforinvestmentintrustgame.
bOLSregressionofamountsentindictatorgame(Rs.0-400).
cOLSregressionofamountexpectedbackfrom
partnerinthetrustgame(Rs.0-900).
Standarderrorsinparentheses.*p<0.10,**p<0.05,***p<0.01.
38
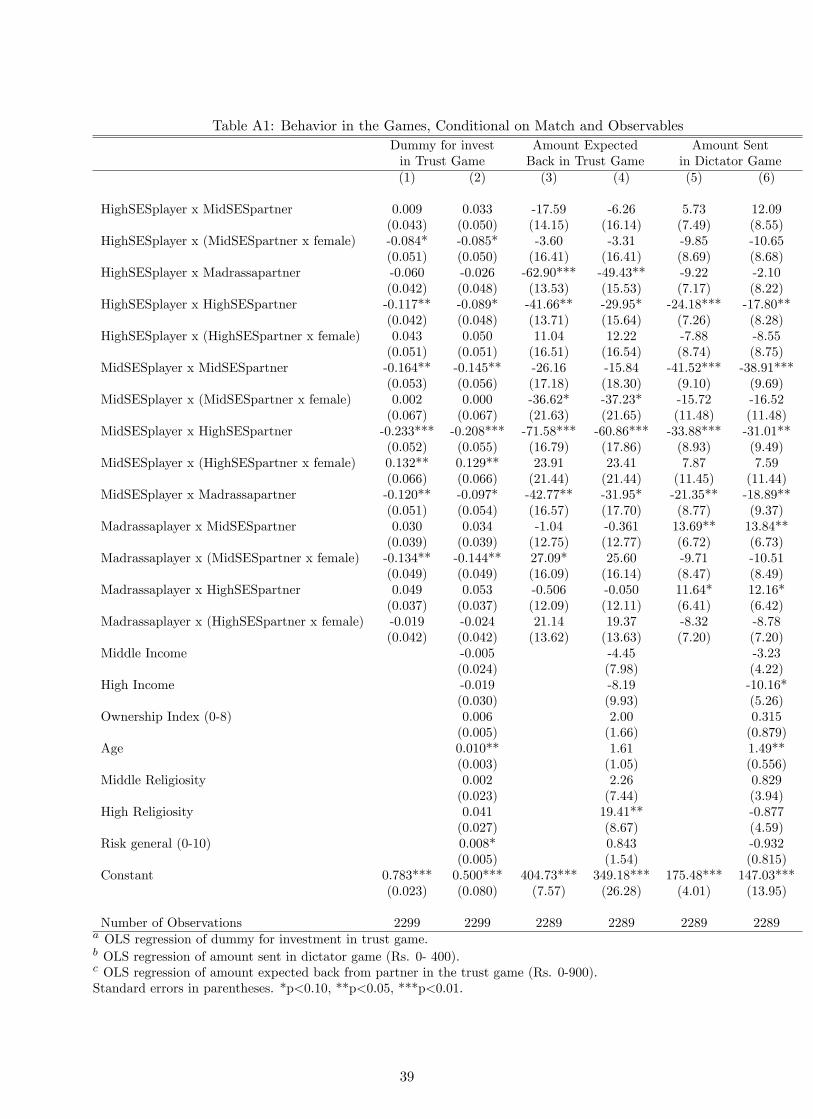
Table A1: Behavior in the Games, Conditional on Match and ObservablesDummy for invest Amount Expected Amount Sentin Trust Game Back in Trust Game in Dictator Game(1) (2) (3) (4) (5) (6)
HighSESplayer x MidSESpartner 0.009 0.033 -17.59 -6.26 5.73 12.09(0.043) (0.050) (14.15) (16.14) (7.49) (8.55)
HighSESplayer x (MidSESpartner x female) -0.084* -0.085* -3.60 -3.31 -9.85 -10.65(0.051) (0.050) (16.41) (16.41) (8.69) (8.68)
HighSESplayer x Madrassapartner -0.060 -0.026 -62.90*** -49.43** -9.22 -2.10(0.042) (0.048) (13.53) (15.53) (7.17) (8.22)
HighSESplayer x HighSESpartner -0.117** -0.089* -41.66** -29.95* -24.18*** -17.80**(0.042) (0.048) (13.71) (15.64) (7.26) (8.28)
HighSESplayer x (HighSESpartner x female) 0.043 0.050 11.04 12.22 -7.88 -8.55(0.051) (0.051) (16.51) (16.54) (8.74) (8.75)
MidSESplayer x MidSESpartner -0.164** -0.145** -26.16 -15.84 -41.52*** -38.91***(0.053) (0.056) (17.18) (18.30) (9.10) (9.69)
MidSESplayer x (MidSESpartner x female) 0.002 0.000 -36.62* -37.23* -15.72 -16.52(0.067) (0.067) (21.63) (21.65) (11.48) (11.48)
MidSESplayer x HighSESpartner -0.233*** -0.208*** -71.58*** -60.86*** -33.88*** -31.01**(0.052) (0.055) (16.79) (17.86) (8.93) (9.49)
MidSESplayer x (HighSESpartner x female) 0.132** 0.129** 23.91 23.41 7.87 7.59(0.066) (0.066) (21.44) (21.44) (11.45) (11.44)
MidSESplayer x Madrassapartner -0.120** -0.097* -42.77** -31.95* -21.35** -18.89**(0.051) (0.054) (16.57) (17.70) (8.77) (9.37)
Madrassaplayer x MidSESpartner 0.030 0.034 -1.04 -0.361 13.69** 13.84**(0.039) (0.039) (12.75) (12.77) (6.72) (6.73)
Madrassaplayer x (MidSESpartner x female) -0.134** -0.144** 27.09* 25.60 -9.71 -10.51(0.049) (0.049) (16.09) (16.14) (8.47) (8.49)
Madrassaplayer x HighSESpartner 0.049 0.053 -0.506 -0.050 11.64* 12.16*(0.037) (0.037) (12.09) (12.11) (6.41) (6.42)
Madrassaplayer x (HighSESpartner x female) -0.019 -0.024 21.14 19.37 -8.32 -8.78(0.042) (0.042) (13.62) (13.63) (7.20) (7.20)
Middle Income -0.005 -4.45 -3.23(0.024) (7.98) (4.22)
High Income -0.019 -8.19 -10.16*(0.030) (9.93) (5.26)
Ownership Index (0-8) 0.006 2.00 0.315(0.005) (1.66) (0.879)
Age 0.010** 1.61 1.49**(0.003) (1.05) (0.556)
Middle Religiosity 0.002 2.26 0.829(0.023) (7.44) (3.94)
High Religiosity 0.041 19.41** -0.877(0.027) (8.67) (4.59)
Risk general (0-10) 0.008* 0.843 -0.932(0.005) (1.54) (0.815)
Constant 0.783*** 0.500*** 404.73*** 349.18*** 175.48*** 147.03***(0.023) (0.080) (7.57) (26.28) (4.01) (13.95)
Number of Observations 2299 2299 2289 2289 2289 2289a OLS regression of dummy for investment in trust game.b OLS regression of amount sent in dictator game (Rs. 0- 400).c OLS regression of amount expected back from partner in the trust game (Rs. 0-900).Standard errors in parentheses. *p<0.10, **p<0.05, ***p<0.01.
39