Gender differences in the South African labour market (1995 – 2007): A descriptive review
23
Gender differences in the South African labour market (1995 – 2007): A descriptive review Dori Posel School of Development Studies, UKZN June 2011
-
Upload
honorato-horne -
Category
Documents
-
view
24 -
download
0
description
Gender differences in the South African labour market (1995 – 2007): A descriptive review Dori Posel School of Development Studies, UKZN June 2011. Main objectives: To describe how women’s economic status in the labour market has changed in the post-apartheid period. - PowerPoint PPT Presentation
Transcript of Gender differences in the South African labour market (1995 – 2007): A descriptive review
Gender differences in the South African labour market (1995 – 2007): A descriptive review
Dori PoselSchool of Development Studies, UKZN
June 2011
Main objectives:
1) To describe how women’s economic status in the labour market has changed in the post-apartheid period.
- Labour force participation (employment and unemployment)
- Returns to employment (earnings)
2) To highlight some of the implications of gender differences in labour market status.
Quantitative study:
Data
• October Household Survey (OHS), 1995 – 1999
• September Labour Force Survey (LFS), 2000 – 2007
~ Nationally representative household surveys conducted by Statistics South Africa; typically 30 000 households interviewed.
A period of 12 years can be more confident in identifying real changes (rather than “noise”, mismeasurement etc).
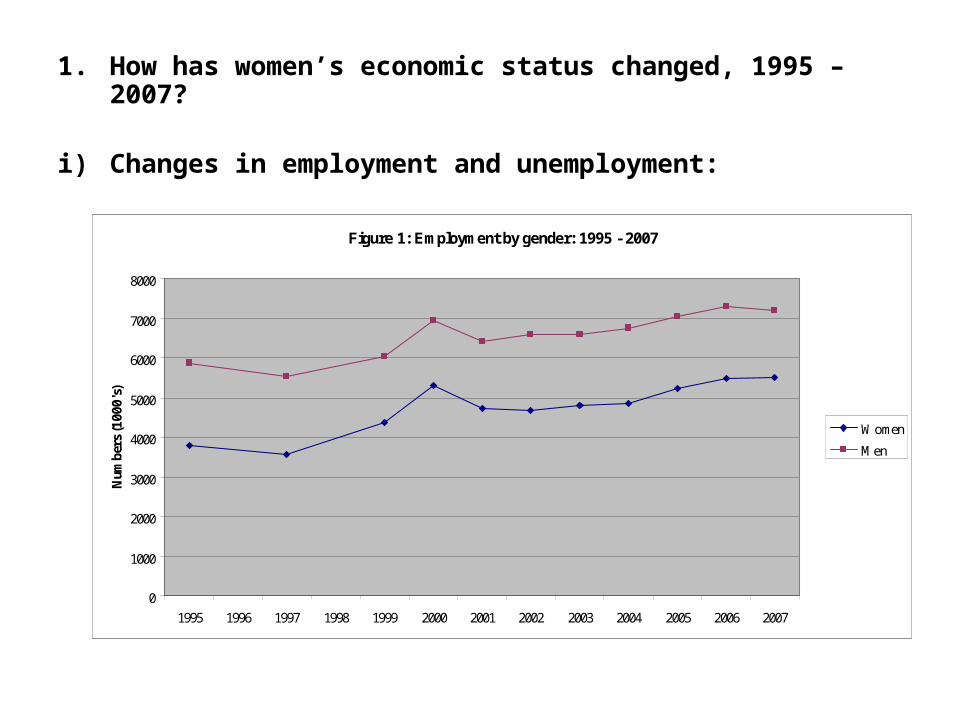
1. How has women’s economic status changed, 1995 – 2007?
i) Changes in employment and unemployment:
Figure 1: Employment by gender: 1995 - 2007
0
1000
2000
3000
4000
5000
6000
7000
8000
1995 1996 1997 1998 1999 2000 2001 2002 2003 2004 2005 2006 2007
Num
bers
(100
0's)
Women
Men

Female employment grew by more than male employment over the period (accounting for 56 percent of the total rise in employment).
Share of employment by gender, 2007
Women
Men
But: men still form the majority of the employed.
Figure 2: Share of employment by gender, 1995
Women
Men
Women’s share of employment increased.
Unemployment
Economic growth has not been jobless, but the increase in employment has been smaller than the increase in those who want employment.
1995 to 2007:- 3.1 million increase in jobs.But:- 3.6 million increase in those who want employment but who are
unemployed.
Increase in unemployment rates.
Although women’s share of employment has risen, women have also been more vulnerable to unemployment than men.
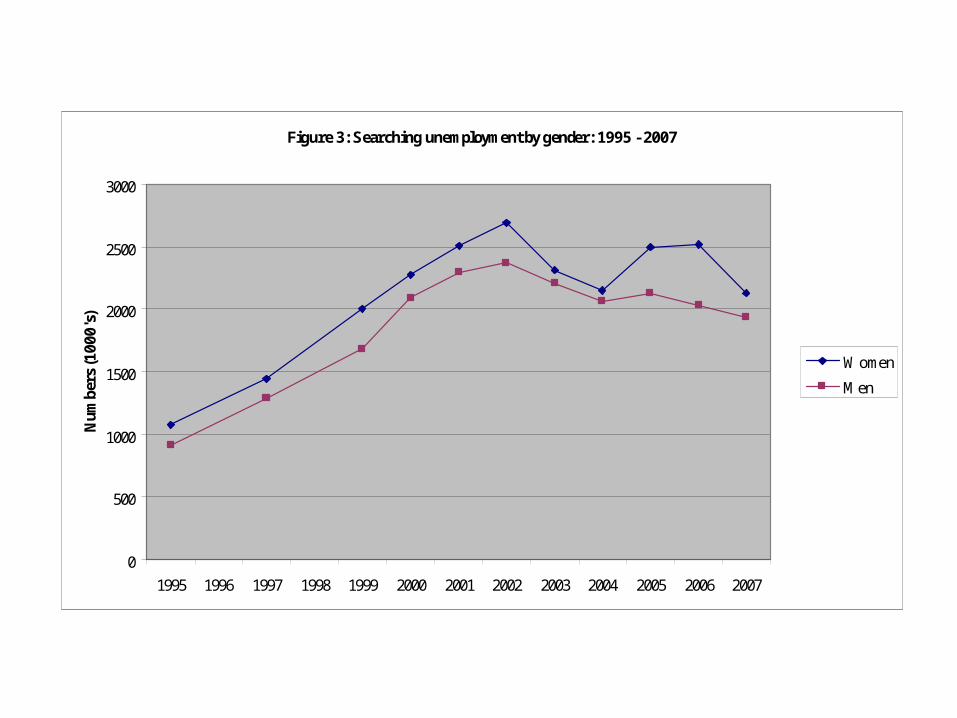
Figure 3: Searching unemployment by gender: 1995 - 2007
0
500
1000
1500
2000
2500
3000
1995 1996 1997 1998 1999 2000 2001 2002 2003 2004 2005 2006 2007
Num
bers
(100
0's)
Women
Men
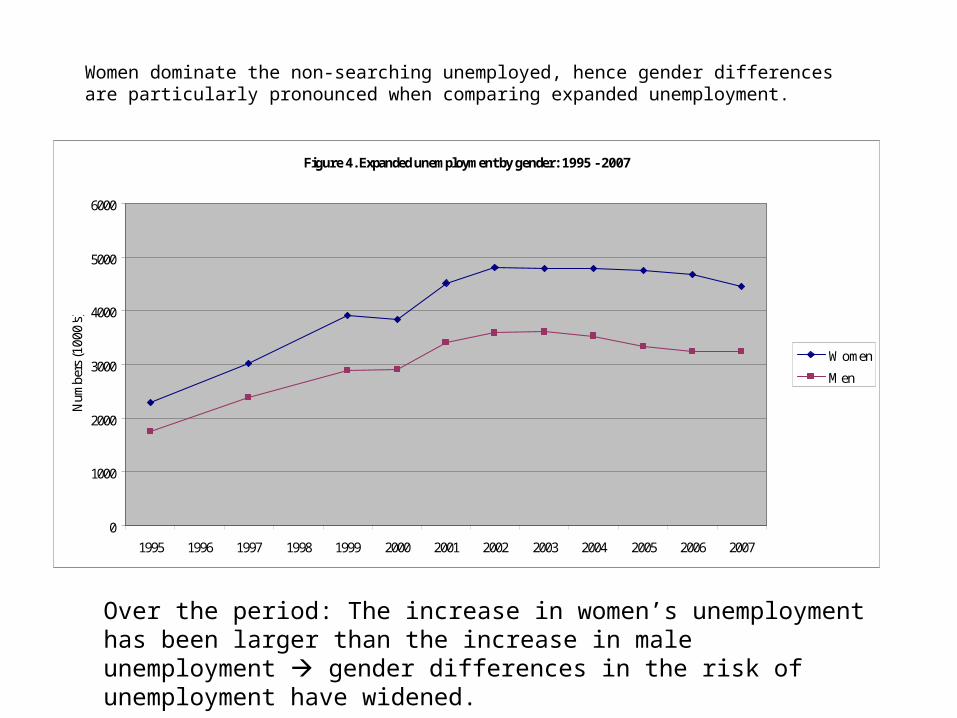
Women dominate the non-searching unemployed, hence gender differences are particularly pronounced when comparing expanded unemployment.
Figure 4. Expanded unemployment by gender: 1995 - 2007
0
1000
2000
3000
4000
5000
6000
1995 1996 1997 1998 1999 2000 2001 2002 2003 2004 2005 2006 2007
Num
bers
(100
0's)
Women
Men
Over the period: The increase in women’s unemployment has been larger than the increase in male unemployment gender differences in the risk of unemployment have widened.
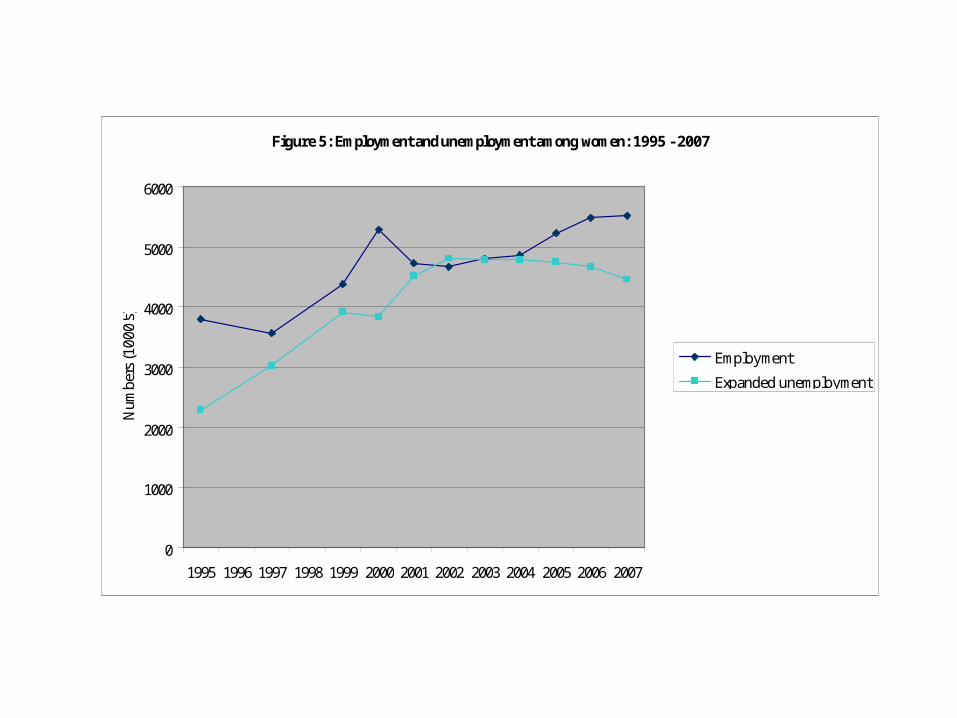
Figure 5: Employment and unemployment among women: 1995 - 2007
0
1000
2000
3000
4000
5000
6000
1995 1996 1997 1998 1999 2000 2001 2002 2003 2004 2005 2006 2007
Num
bers
(100
0's)
Employment
Expanded unemployment

In recent years: unemployment levels have been flattening out or even falling. But the increase in employment remains too slow to significantly affect unemployment rates, which remain very high.
Figure 6: Employment and unemployment among men: 1995 - 2007
0
1000
2000
3000
4000
5000
6000
7000
8000
1995 1996 1997 1998 1999 2000 2001 2002 2003 2004 2005 2006 2007
Num
bers
(100
0s)
Employment
Expanded unemployment
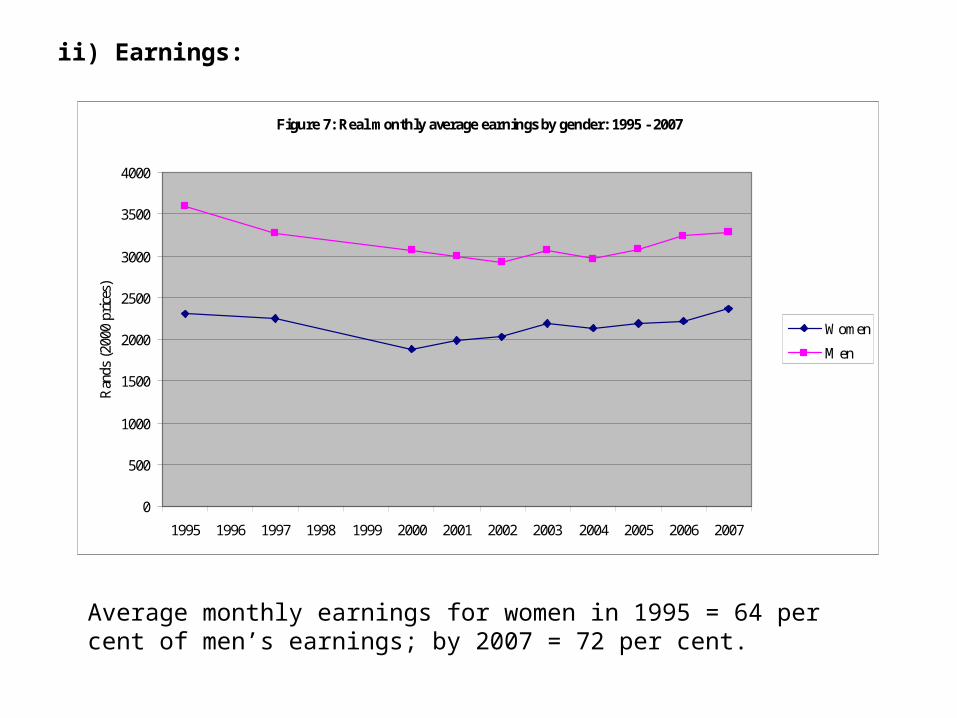
ii) Earnings:
Figure 7: Real monthly average earnings by gender: 1995 - 2007
0
500
1000
1500
2000
2500
3000
3500
4000
1995 1996 1997 1998 1999 2000 2001 2002 2003 2004 2005 2006 2007
Ran
ds (
2000
pri
ces)
Women
Men
Average monthly earnings for women in 1995 = 64 per cent of men’s earnings; by 2007 = 72 per cent.
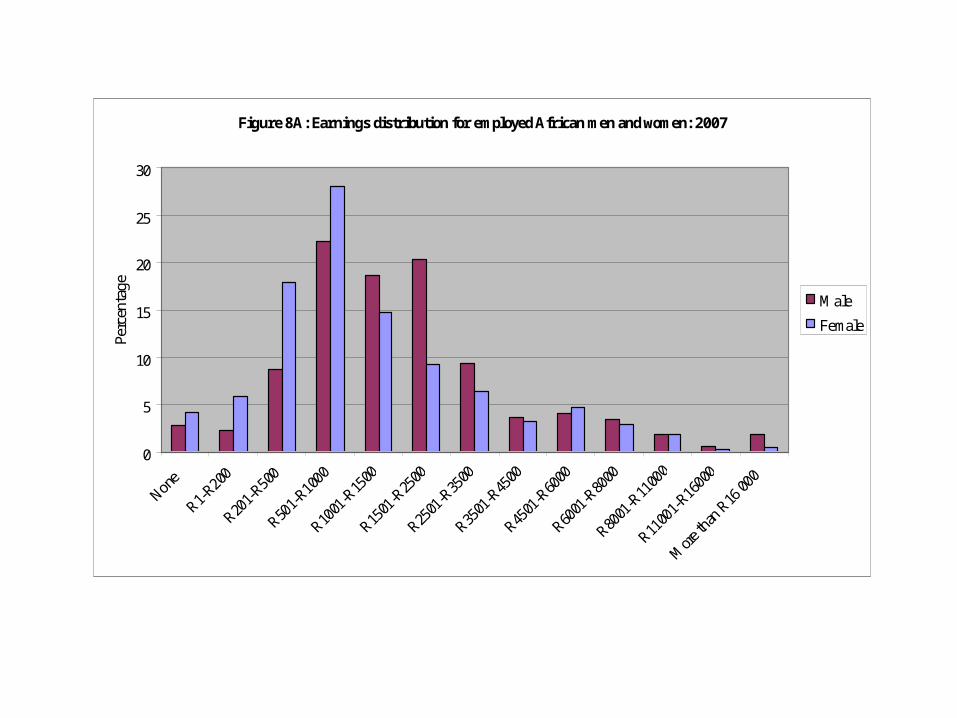
Figure 8A: Earnings distribution for employed African men and women: 2007
0
5
10
15
20
25
30
None
R1-R200
R201-
R500
R501-
R1000
R1001
-R15
00
R1501
-R25
00
R2501
-R35
00
R3501
-R45
00
R4501
-R60
00
R6001
-R80
00
R8001
-R11
000
R1100
1-R160
00
More
than
R16
000
Perc
enta
ge
Male
Female
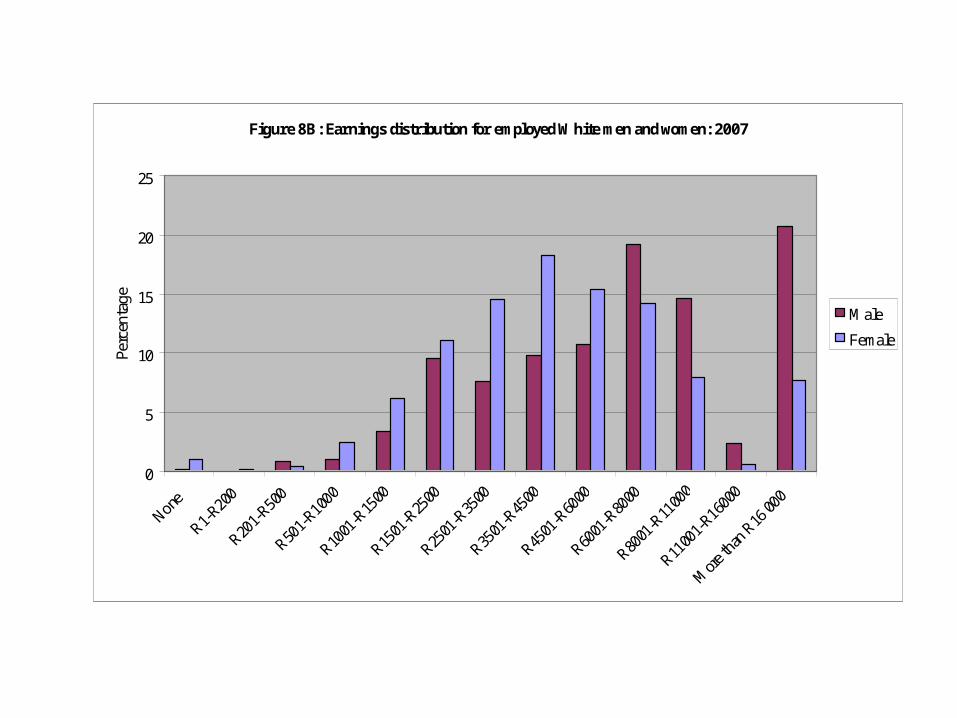
Figure 8B: Earnings distribution for employed White men and women: 2007
0
5
10
15
20
25
None
R1-R200
R201-
R500
R501-
R1000
R1001
-R15
00
R1501
-R25
00
R2501
-R35
00
R3501
-R45
00
R4501
-R60
00
R6001
-R80
00
R8001
-R11
000
R1100
1-R160
00
More
than
R16
000
Perc
enta
ge
Male
Female
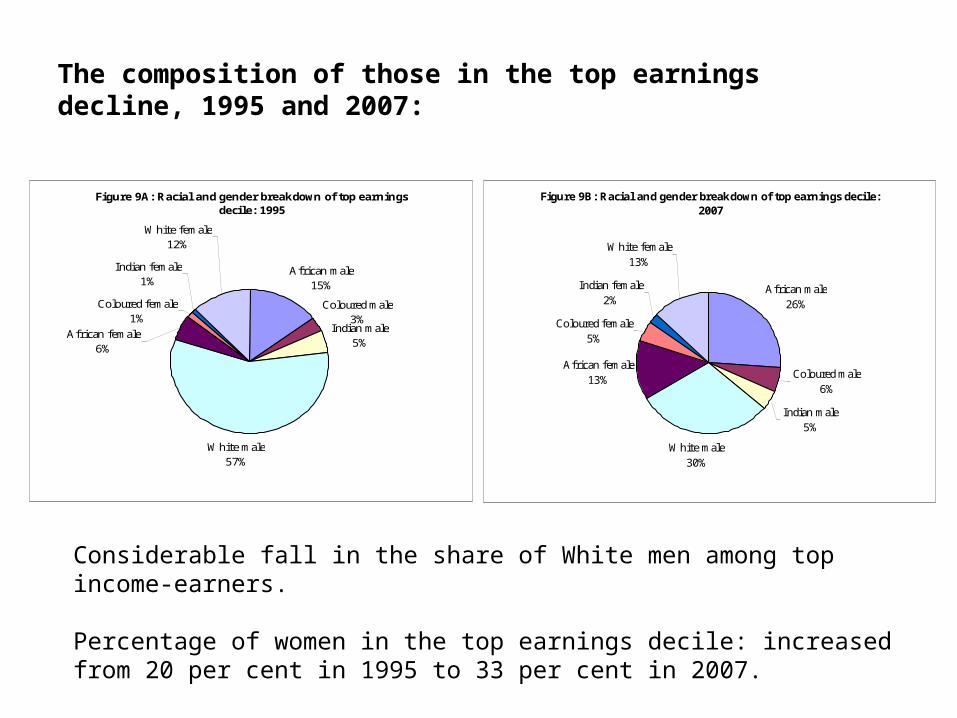
The composition of those in the top earnings decline, 1995 and 2007:
Figure 9A: Racial and gender breakdown of top earnings decile: 1995
African male15%
Coloured male3%
Indian male5%
White male57%
Coloured female1%
Indian female1%
White female12%
African female6%
Figure 9B: Racial and gender breakdown of top earnings decile: 2007
African male26%
Coloured male6%
Indian male5%
White male30%
African female13%
Coloured female5%
Indian female2%
White female13%
Considerable fall in the share of White men among top income-earners.
Percentage of women in the top earnings decile: increased from 20 per cent in 1995 to 33 per cent in 2007.

The composition of those in the bottom earnings decile, 1995 and 2007:
Figure 10A: Racial and gender breakdown of bottom earnings decile: 1995
Coloured male3%
Indian male0%
White female2%
Indian female0%
Coloured female6%
African male39%
African female46%
White male4%
Figure 10B: Racial and gender breakdown of bottom earnings decile: 2007
African male35.2%
African female58.3% Indian male
0.2%
White male0.6%
Coloured male1.4%
Indian female0.2%
White female0.9%
Coloured female3.2%
Increase in the share of African women among the bottom earners, from 46 per cent in 1995 to 58 per cent in 2007.
Women’s share of low-paid work has increased considerably.
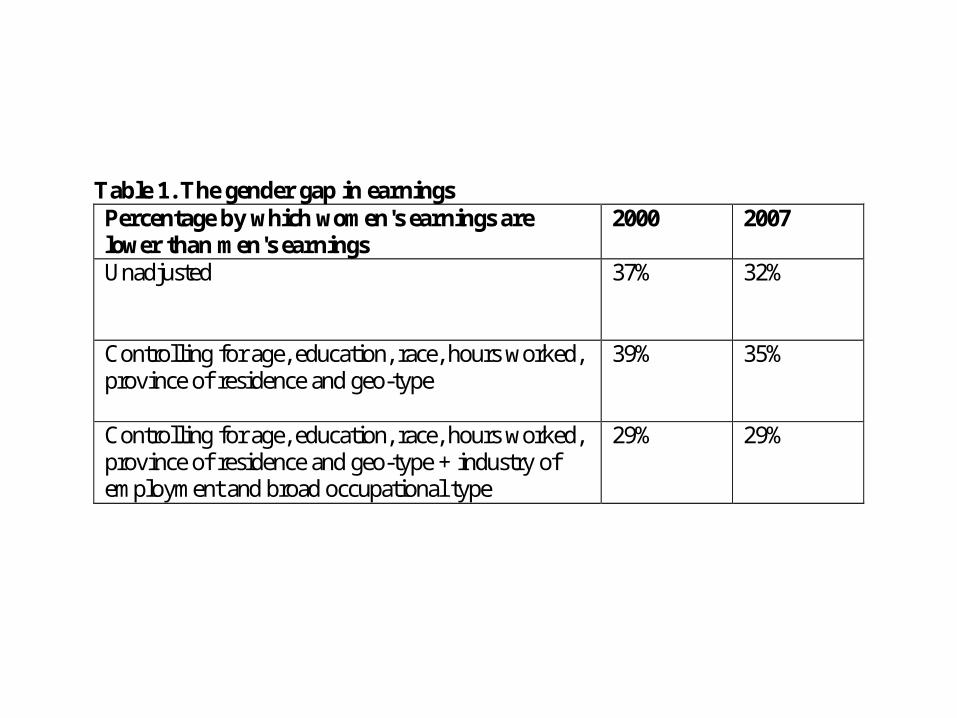
Table 1. The gender gap in earnings Percentage by which women's earnings are lower than men's earnings
2000 2007
Unadjusted
37% 32%
Controlling for age, education, race, hours worked, province of residence and geo-type
39% 35%
Controlling for age, education, race, hours worked, province of residence and geo-type + industry of employment and broad occupational type
29% 29%

2. How have women’s living arrangements changed?
Figure 11: Percentage of working-age women married/cohabiting: 1995 - 2007
0
10
20
30
40
50
60
70
80
1995 1996 1997 1998 1999 2000 2001 2002 2003 2004 2005 2006 2007
Per
cent
age
of w
orki
ng a
ge w
omen
African
Coloured
Indian
White

Figure 12: Percentage of working-age women living without men (aged 15 and older): 1995 - 2007
0
5
10
15
20
25
30
1995 1996 1997 1998 1999 2000 2001 2002 2003 2004 2005 2006 2007
Perc
enta
ge o
f w
orki
ng a
ge w
omen
African
Coloured
Indian
White

Figure 13: Percentage of working-age women living without any employed men (aged 15 and older): 1995 - 2007
0
10
20
30
40
50
60
70
1995 1996 1997 1998 1999 2000 2001 2002 2003 2004 2005 2006 2007
Perc
enta
ge o
f wor
king
age
wom
en
African
Coloured
Indian
White
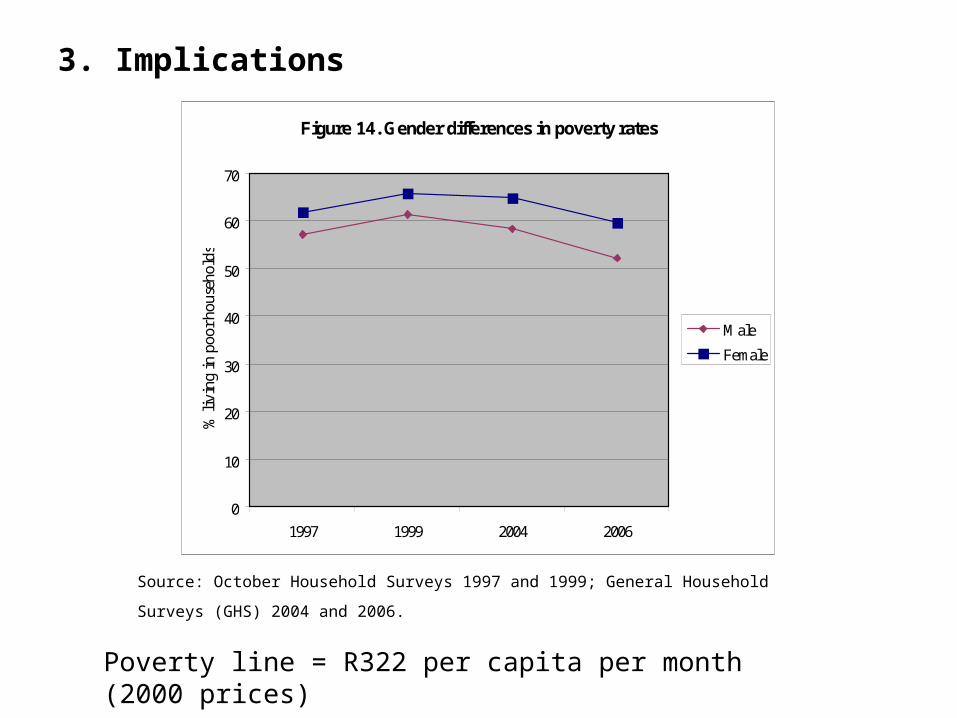
3. Implications
Source: October Household Surveys 1997 and 1999; General Household Surveys (GHS) 2004 and 2006.
Figure 14. Gender differences in poverty rates
0
10
20
30
40
50
60
70
1997 1999 2004 2006
% li
ving
in p
oor h
ouse
hold
s
Male
Female
Poverty line = R322 per capita per month (2000 prices)

Children are far more likely to be living with their mothers than with their fathers:
Table 2A: Presence of mothers in the household, South Africa 2006 Percentage of children living in households where:
Mother resident
Mother alive, but absent from the
household
Mother dead
Children 7 – 12 71 21 8 Children 0 – 6 82 15 3 Source: General Household Survey 2006. The data are weighted.
Table 2B: Presence of fathers in the household, South Africa 2006 Percentage of children living in households where:
Father resident Father alive, but absent from the
household
Father dead
Children 7 – 12 37 44 19 Children 0 – 6 39 51 10 Source: General Household Survey 2006. The data are weighted.
Feminisation of the labour force in post-apartheid South Africa
• Women’s share of employment has increased, but their share of unemployment has grown even more dramatically.
• The average (unadjusted) gender gap in earnings has fallen, but a persistent gender gap in earnings remains (of about 29 per cent).
• Falling marriage rates + growing share of women living in households without (employed) men means that a rising share of households are reliant on women’s earnings.
• Gender differences in employment, unemployment and earnings help explain why women are more vulnerable to poverty than men.
• Children are considerably more likely to live with their mothers than their fathers, so gender differences in poverty have implications for poverty risks among children.
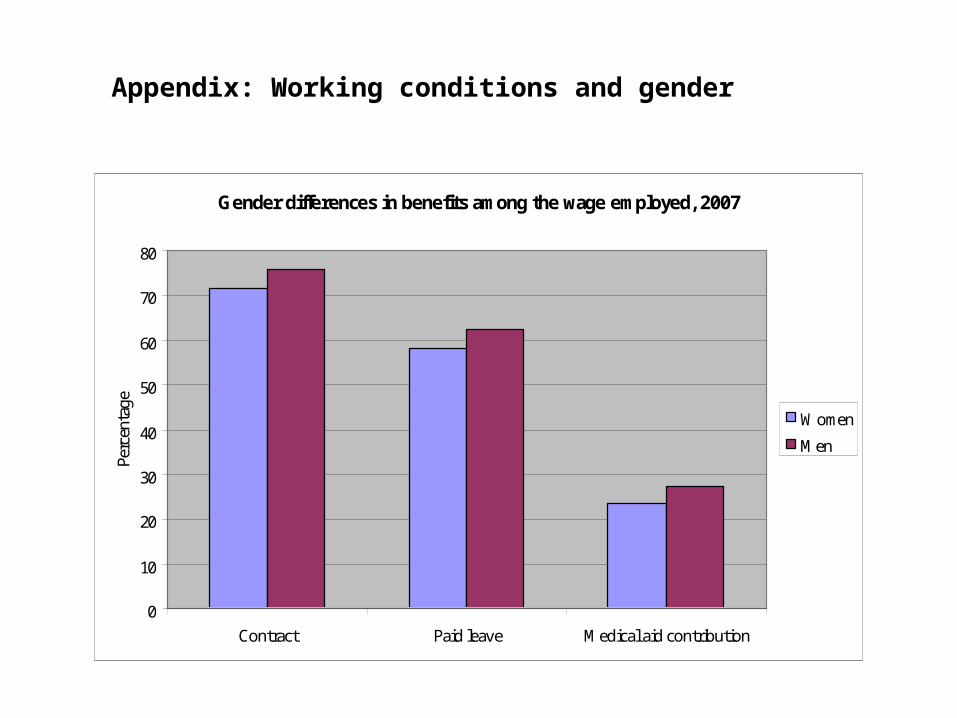
Gender differences in benefits among the wage employed, 2007
0
10
20
30
40
50
60
70
80
Contract Paid leave Medical aid contribution
Perc
enta
ge
Women
Men
Appendix: Working conditions and gender