GENDER COMPOSITION - .:: Directorate of Census · PDF fileSex ratio is defined as the number...
56
GENDER COMPOSITION (SEX RATIO) PROVISIONAL POPULATION TOTALS 137 GENDER COMPOSITION 5
Transcript of GENDER COMPOSITION - .:: Directorate of Census · PDF fileSex ratio is defined as the number...

GENDER COMPOSITION (SEX RATIO)
PROVISIONAL POPULATION TOTALS 137
GENDER COMPOSITION
5

138
When women thrive, all of society benefits, and succeeding generations are given a better start in life
“ ”
Kofi Annan

GENDER COMPOSITION (SEX RATIO)
PROVISIONAL POPULATION TOTALS 139
5.1 SEX RATIOPopulation enumeration in terms of gender composition is a key indicator to monitor
the development pulse of a country. Sex ratio is defined as the number of females per
thousand males in a population. In developing countries such as India, sex ratio is
generally skewed in favour of the males. The prevailing patriarchal society creates a gender
imbalance by viewing the male as an asset and the female as a liability for the family.
The sex ratio for the country has improved from 933 females per thousand males in 2001
to 940 in 2011; with the urban areas recording a higher absolute increase in comparison to
that reported from the rural areas. Similarly, Madhya Pradesh has charted an increase in the
overall sex ratio from 919 in 2001 to 930 in 2011 where a greater positive change in sex ratio is
observed in the urban areas as compared to its rural counterparts.
When sex ratio is calculated for children aged six years or less then such a proportion is termed
as the child sex ratio. The child sex ratio for the country has witnessed a sharp decline from
927 in 2001 to 914 in 2011; with the current figures being the lowest since independence.
Among others the major reasons for such a poor ratio can be outlined as sex selective abortion,
infanticide and cultural preference for a particular sex which are responsible for precipitating
such an imbalance in the natural ratio. The state has registered a child sex ratio of an abysmal
low 912 females per thousand males with the rural area reporting a ratio of 917 and the urban
area has recorded a figure of 895.
This chapter focuses on the status of sex ratio by rural-urban classification at the national,
state, district and tahsil level which reveals the prevailing disparity observed among these
areas which is pivotal in identifying the priority areas for programme implementation.
5.2 SEX RATIO OF INDIAAs per provisional results of Census 2011, total population of India is 1,210,193,422 which
comprises of 623,724,248 males and 586,469,174 females resulting in a sex ratio of 940 females
per 1000 males. In terms of total sex ratio, there has been a decrease of 32 points from 1901
to 2011 with the maximum sex ratio figure of 972 being recorded in 1901.
The rural population of the country stands at 833,087,662 which is classified into 427,917,052
males and 405,170,610 females, resulting in a sex ratio of 947 in 2011. Rural sex ratio has
witnessed a decline of 32 points from 1901 to 2011 with the maximum figure of 979 being
recorded in 1901.
The urban sex ratio is calculated as 926 females per thousand males which is a result of an
urban population of 377,105,760 which is segregated into 195,807,196 males and 181,298,564
females. The urban sex ratio has shown an upward trend by recording an increase of 16 points
from 1901 to 2011 where the highest figure of 926 has been recorded in 2011.
GENDER COMPOSITION
5

140
Statement 5.1 gives an overview of the national sex ratio figures across three categories; total,
rural and urban recorded during the period 1901 to 2011.
Statement 5.1Sex ratio of India : 1901 to 2011
Census year Total Rural Urban1901 972 979 910
1911 964 975 872
1921 955 970 846
1931 950 966 838
1941 945 965 831
1951 946 965 860
1961 941 963 845
1971 930 949 858
1981 934 950 880
1991 926 938 894
2001 933 946 900
2011 940 947 926
5.2.1 Sex ratio of India and States/UTs : 2011
The sex ratio at the national level has worked out to 940 females per thousand males; whereas
the rural sex ratio is pegged at 947 and the urban sex ratio stands at 926. Statement 5.2 lists
the total, rural and urban sex ratio as seen across all the States/UTs in the country as per
provisional Census 2011 figures.
For Madhya Pradesh, the total sex ratio is reported as 930 which is 10 points below the national
average. The state has recorded a rural sex ratio of 936 females per thousand males while the
urban sex ratio stands at 916. A comparitive analysis of the figures at the national level shows
that Madhya Pradesh ranks twentieth in terms of total sex ratio, twenty-second in regard to
rural sex ratio and sixteenth in terms of urban sex ratio among all States/UTs.
Statement 5.2Sex ratio of India and States/UTs : 2011
India/States/UTs Total Rural Urban
India 940 947 926
Jammu & Kashmir 883 899 840
Himachal Pradesh 974 988 853
Punjab 893 906 872
Chandigarh 818 691 821
Uttarakhand 963 1000 883
Haryana 877 880 871
NCT of Delhi 866 847 867
Rajasthan 926 932 911
Uttar Pradesh 908 914 888
Bihar 916 919 891
Sikkim 889 883 908
Arunachal Pradesh 920 929 889

GENDER COMPOSITION (SEX RATIO)
PROVISIONAL POPULATION TOTALS 141
India/State/UTs Total Rural Urban
Nagaland 931 942 905
Manipur 987 966 1038
Mizoram 975 950 1000
Tripura 961 956 976
Meghalaya 986 983 997
Assam 954 956 937
West bengal 947 950 939
Jharkhand 947 960 908
Orissa 978 988 934
Chhattisgarh 991 1,002 956
Madhya Pradesh 930 936 916
Gujarat 918 947 880
Daman & Diu 618 867 550
Dadra & Nagar Haveli 775 863 684
Maharashtra 925 948 899
Andhra Pradesh 992 995 984
Karnataka 968 975 957
Goa 968 997 951
Lakshadweep 946 954 944
Kerala 1,084 1,077 1,091
Tamil nadu 995 993 998
Puducherry 1,038 1,029 1,043
A & N Islands 878 871 891
The top five States/Union Territories in terms of total, rural and urban sex ratio is presented in
Statements 5.3, 5.4 and 5.5.
In terms of overall sex ratio it is observed that the top five States/UTs in the country greatly
exceed the national average sex ratio of 940; with Kerala recording the highest figure of 1,084.
It is seen that Daman & Diu has reported the lowest sex ratio of a mere 618 females per
thousand males. Statement 5.3Top and bottom five States/UTs by total sex ratio : 2011
Top five State/UTs Sex ratio
Kerala 1,084
Puducherry 1,038
Tamilnadu 995
Andhra Pradesh 992
Chhattisgarh 991
Bottom five State/UTs Sex ratio
Daman & Diu 618
Dadra & Nagar Haveli 775
Chandigarh 818
NCT of Delhi 866
Haryana 877
The data for rural sex ratio reported in the top five States/Union territories reveals that Kerala
(1,077) is in first position followed by Puducherry (1,029), Chhattisgarh (1,002) is seen in mid-
table whereas the fourth and fifth position is occupied by Uttarakhand (1,000) and Goa (997)
respectively. The States/Union territories registering the lowest rural sex ratio in ascending
order include Chandigarh (691), NCT of Delhi (847), Dadra & Nagar Haveli (863), Daman & Diu
(867) and A & N Islands (871) as shown in Statement 5.4.

142
Statement 5.4Top and bottom five States/UTs by rural sex ratio : 2011
Top five State/UTs Sex ratio
Kerala 1,077
Puducherry 1,029
Chhattisgarh 1,002
Uttarakhand 1,000
Goa 997
Bottom five State/UTs Sex ratio
Chandigarh 691
NCT of Delhi 847
Dadra & Nagar Haveli 863
Daman & Diu 867
A & N Islands 871
In terms of sex ratio in urban India, Kerala (1,091) has secured the first rank followed by
Puducherry (1,043), Manipur (1,038) in middle position while Mizoram (1,000) and Tamil Nadu
(998) are in the fourth and fifth position respectively. The bottom five States/Union territories
include Daman & Diu (550), Dadra & Nagar Haveli (684), Chandigarh (821), Jammu & Kashmir
(840) and Himachal Pradesh (853) as seen in Statement 5.5.
Statement 5.5Top and bottom five States/UTs by urban sex ratio : 2011
Top five State/UTs Sex ratio
Kerala 1,091
Puducherry 1,043
Manipur 1,038
Mizoram 1,000
Tamilnadu 998
Bottom five State/UTs Sex ratio
Daman & Diu 550
Dadra & Nagar Haveli 684
Chandigarh 821
Jammu & Kashmir 840
Himachal Pradesh 853
5.3 SEX RATIO IN MADHYA PRADESH
Sex ratio has witnessed an increasing trend in Madhya Pradesh for aggregate area and in the
rural-urban distribution as well. The aggregate figures indicate that the sex ratio has increased
steadily from 912 to 919 to 930 across the last three decadal censuses of 1991, 2001 and
2011 respectively. In Madhya Pradesh, an upward trend from 921 in 1991, 927 in 2001 and
finally 936 in 2011 has been observed in regard to rural sex ratio. The urban areas of the state
have charted an increase as well from 887 in 1991, 898 in 2001 and 916 in 2011. From the
provisional data it can be said that the numerical increase, in absolute terms, has been greater
in the urban areas vis-à-vis the rural segment of the state.
Statement 5.6Sex ratio of Madhya Pradesh : 1991 to 2011
Census year Total Rural Urban1991 912 921 887
2001 919 927 898
2011 930 936 916
5.4 SEX RATIO OF MADHYA PRADESH AND OTHER EAG STATESAmong the eight Empowered Action Group (EAG) states, Madhya Pradesh has secured the fifth
position in terms of total sex ratio by recording a figure of 930. The rural sex ratio figures reveal
that Chhattisgarh has secured the highest rank with a figure of 1,002 females per thousand
males; Madhya Pradesh has ranked fifth (936) and Uttar Pradesh has reported the lowest sex
ratio of 914. However in the context of urban sex ratio, Madhya Pradesh is seen in the third

GENDER COMPOSITION (SEX RATIO)
PROVISIONAL POPULATION TOTALS 143
position with a sex ratio of 916; though Chhattisgarh (956) continued to secure the highest rank
and Uttar Pradesh (888) the lowest. A snapshot of the sex ratio figures reported by the EAG
states can be read from Statement 5.7 below.
Statement 5.7Sex ratio in EAG states : 2011
State/UTs Sex ratio
Total Rural Urban
India 940 947 926
Chhattisgarh 991 1,002 956
Orissa 978 988 934
Uttarakhand 963 1,000 883
Jharkhand 947 960 908
Madhya Pradesh 930 936 916
Rajasthan 926 932 911
Bihar 916 919 891
Uttar Pradesh 908 914 888
810
880
950
1020
Chha
tisg
arh
Ori
ssa
Utt
arak
hand
Jhar
khan
d
Mad
hya
Prad
esh
Raja
stha
n
Biha
r
Utt
ar P
rade
sh
Sex
rati
o
EAG States
Rural UrbanFig. 5.1 Sex ratio in EAG states
5.5 SEX RATIO OF MADHYA PRADESH AND NEIGHBOURING STATESThe sex ratio figures registered in Madhya Pradesh and its bordering states of Chhattisgarh,
Rajasthan, Maharashtra, Gujarat and Uttar Pradesh can be studied from Statement 5.8
Chattisgarh is seen in the first position with a rural sex ratio of 1,002 and an urban figure which
stands at 956 whereas Uttar Pradesh has recorded the lowest rural sex ratio of 914 and Gujarat
the lowest urban sex ratio of 880. Madhya Pradesh is in second position in regard to total sex
ratio of 930, fourth in terms of rural sex ratio of 936 and in second position in terms of urban
sex ratio which stands at 916.
Statement 5.8Sex ratio in Madhya Pradesh and neighbouring states : 2011
770
840
910
980
1050
Chha
tisg
arh
Mad
hya
Prad
esh
Raja
stha
n
Mah
aras
htra
Guj
arat
Utt
ar P
rade
sh
Sex
rati
o
Neighbouring states
Rural Urban
Fig. 5.2 Sex ratio in neighbouring states of Madhya PradeshState/UTs Sex ratioTotal Rural Urban
Chhattisgarh 991 1,002 956
Madhya Pradesh 930 936 916
Rajasthan 926 932 911
Maharashtra 925 948 899
Gujarat 918 947 880
Uttar Pradesh 908 914 888
144
GUNAASHOKNAGAR
SAGARRAJGARH
RAISEN
CHHATARPUR
DAMOH
JABALPUR
PANNA
MORENA
SHEOPUR
BHIND
GWALIORDATIA
SHIVPURI
SATNA
REWA
SIDHI SINGRAULI
KATNI
UMARIA
SHAHDOL
ANUPPUR
MANDLA
DINDORI
BALAGHAT
HOSHANGABAD
NARSIMHAPUR
SEONICHHINDWARA
VIDISHA
BETUL
HARDAALIRAJPUR
JHABUA
DHAR
(WEST NIMAR)(EAST NIMAR)
INDOREDEWAS
UJJAINRATLAM
NEEMUCH
MANDSAUR
SHAJAPUR
SEHORE
TIKAMGARH
BARWANI
BURHANPUR
BHOPAL
KHARGONEKHANDWA
968
892
874
976
881
967
902
977
987
933
914
943
945
892
910
911
1025
935
908
916
902
960
957
939
925
1010
834
968
985
900
977
977
917
941
899
954
829
956
960
972
849
9981007
943995
952
930
870
909
1012
40 0 12040 80
KILOMETRES
MADHYA PRADESH
RA
J
A
S
T
H
A
NU T
TA
R
P RA
DE
SH
GU
JA
RA
T
M
AH
A RA
SH T
R A
CH
HA
TT
IS
GA
RH
INDIA
BOUNDARIES : - STATE..............................
DISTRICT.........................
DIVISION.........................
RURAL SEX RATIO 2011
NUMBER OF FEMALES PER 1000 MALES
986 AND ABOVE
951 - 985
916 - 950 State 936
881 - 915
880 AND BELOW
GUNAASHOKNAGAR
SAGARRAJGARH
RAISEN
CHHATARPUR
DAMOH
JABALPUR
PANNA
MORENA
SHEOPUR
BHIND
GWALIORDATIA
SHIVPURI
SATNA
REWA
SIDHI SINGRAULI
KATNI
UMARIA
SHAHDOL
ANUPPUR
MANDLA
DINDORI
BALAGHAT
HOSHANGABAD
NARSIMHAPUR
SEONICHHINDWARA
VIDISHA
BETUL
HARDAALIRAJPUR
JHABUA
DHAR
(WEST NIMAR)(EAST NIMAR)
INDORE DEWAS
UJJAINRATLAM
NEEMUCH
MANDSAUR
SHAJAPUR
SEHORE
TIKAMGARH
BARWANI
BURHANPUR
BHOPAL
KHARGONEKHANDWA 958
906
890
945999
893
943
891
893
963
902
970
909
949
931
913
913
903
901
915
923
901
946
948
941
879
858
956
959
954
910
932
962
917
914
908
924
864
913
920
929
869
918
918937
968
949
938
911
892
40 0 12040 80
KILOMETRES
MADHYA PRADESH
RA
J
A
S
T
H
A
NU T
TA
R
P RA
DE
SH
GU
JA
RA
T
M
AH
A RA
SH T
R A
CH
HA
TT
IS
GA
RH
INDIA
BOUNDARIES : - STATE..............................
DISTRICT.........................
DIVISION.........................
URBAN SEX RATIO 2011
NUMBER OF FEMALES PER 1000 MALES
946 AND ABOVE
931 - 945
916 - 930 State 916
901 - 915
900 AND BELOW

GENDER COMPOSITION (SEX RATIO)
PROVISIONAL POPULATION TOTALS 145
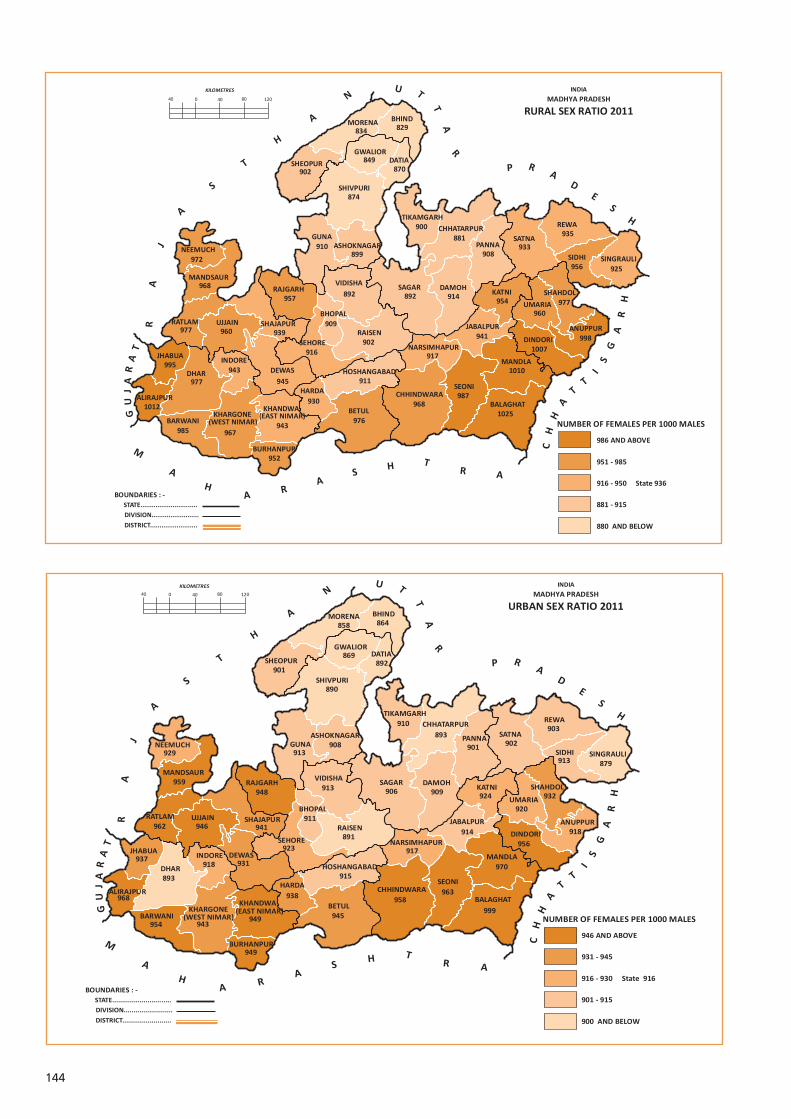
5.6 RANKING OF DISTRICTS BY SEX RATIO, TOTAL : 2001 AND 2011A detailed overview of the ranking of the districts with regard to sex ratio (2001-11) for rural and
urban area of state is shown respectively in statement 5.9 and 5.10 . Balaghat has maintained
its position as the district with the highest sex ratio figures for the state at 1,022 in 2001 and
1,021 in 2011. The latest Census data for 2011 indicates that Alirajpur is in second position at
1,009 which is an increase in its last decade rank where the district was ranked third. The two
worst faring districts in terms of total sex ratio are Morena and Bhind which stood at rank 49
and 50 respectively. The districts which have not shown any change in rank across the two
consecutive Censuses of 2001 and 2011 are Balaghat (rank 1), Dindori (rank 4), Barwani (rank
7), Indore (rank 30), Sehore (rank 31), Narsimhapur (rank 32), Chattarpur (rank 45), Shivpuri
(rank 46) and Datia (rank 47). The statement and ranking of the districts for the total area of
the state has already been presented in paper-1.
5.7 RANKING OF DISTRICTS BY SEX RATIO, RURAL : 2001 AND 2011Statement 5.9 shows the ranking of the districts in the context of rural sex ratio for Madhya
Pradesh. Here it is overwhelming to see that Balaghat has maintained its first rank in 2001 and
2011. The second position is secured by Alirajpur which is an increase from rank 3 in 2001. The
worst two districts as per 2011 figures include Morena at rank 49, which has shown a slight
increase from rank 50 in 2001, and Bhind at rank 50 which has shown further decline from its
previously recorded rank at 49 in 2001.
5.8 RANKING OF DISTRICTS BY SEX RATIO, URBAN : 2001 AND 2011Statement 5.10 presents the ranking of the districts of the state with regard to urban sex ratio
where Balaghat has secured rank 1, which has remained unchanged since 2001 and Mandla
has followed closely at rank 2 which is the same rank the district attained in 2001. The worst
faring districts with regard to urban sex ratio are Bhind and Morena which have secured rank
49 and 50 respectively; identical to the ranks attained in Census 2001. The districts where
ranks have remained unchanged from 2001 to 2011 are Balaghat (rank 1), Mandla (rank 2),
Chhatarpur (rank 43), Datia (rank 44), Raisen (rank 45), Singrauli (rank 47), Bhind (rank 49) and
Morena (rank 50).

146
Statement 5.9Ranking of districts by sex ratio, Rural : 2001 and 2011
Rank in
2011
District Name Sex ratio Rank in
20012011 2001
Madhya Pradesh 936 927
1 Balaghat 1,025 1,030 1
2 Alirajpur 1,012 1,001 3
3 Mandla 1,010 1,002 2
4 Dindori 1,007 993 4
5 Anuppur 998 988 5
6 Jhabua 995 986 7
7 Seoni 987 987 6
8 Barwani 985 977 8
9 Dhar 977 964 10
10 Ratlam 977 971 11
11 Shahdol 977 971 12
12 Betul 976 977 9
13 Neemuch 972 959 15
14 Chhindwara 968 961 13
15 Mandsaur 968 960 14
16 Khargone (West Nimar) 967 954 17
17 Ujjain 960 946 18
18 Umaria 960 952 21
19 Rajgarh 957 936 26
20 Sidhi 956 950 20
21 Katni 954 950 19
22 Burhanpur 952 945 22
23 Dewas 945 934 27
24 Khandwa (East Nimar) 943 932 25
25 Indore 943 937 28
26 Jabalpur 941 926 30
27 Shajapur 939 928 29
28 Rewa 935 954 16
29 Satna 933 937 24
30 Harda 930 923 31
31 Singrauli 925 943 23
32 Narsimhapur 917 910 33
33 Sehore 916 911 32
34 Damoh 914 901 35
35 Hoshangabad 911 897 37
36 Guna 910 888 38
37 Bhopal 909 885 39
38 Panna 908 903 34
39 Raisen 902 884 36
40 Sheopur 902 898 40
41 Tikamgarh 900 883 41
42 Ashoknagar 899 875 43
43 Sagar 892 880 42
44 Vidisha 892 872 44
45 Chhatarpur 881 868 45
46 Shivpuri 874 855 46
47 Datia 870 852 47
48 Gwalior 849 833 48
49 Morena 834 817 50
50 Bhind 829 825 49 700
750
800
850
900
950
1,00
0
1,05
0
Balaghat
Alirajpur
Mandla
Dindori
Anuppur
Jhabua
Seoni
Barwani
Dhar
Ratlam
Shahdol
Betul
Neemuch
Chhindwara
Mandsaur
Khargone (West Nimar)
Ujjain
Umaria
Rajgarh
Sidhi
Katni
Burhanpur
Dewas
Khandwa (East Nimar)
Indore
Jabalpur
Shajapur
Rewa
Satna
Harda
Singrauli
Narsimhapur
Sehore
Damoh
Hoshangabad
Guna
Bhopal
Panna
Raisen
Sheopur
Tikamgarh
Ashoknagar
Sagar
Vidisha
Chhatarpur
Shivpuri
Datia
Gwalior
Morena
Bhind
Sex Ratio
Dis
tric
ts
2001 2011Fig. 5.3 Sex ratio of districts, Rural

GENDER COMPOSITION (SEX RATIO)
PROVISIONAL POPULATION TOTALS 147
Statement 5.10Ranking of districts by sex ratio, Urban : 2001 and 2011Rank
in 2011
District Name Sex ratio Rank in
20012011 2001
Madhya Pradesh 916 898
1 Balaghat 999 970 1
2 Mandla 970 946 2
3 Alirajpur 968 926 12
4 Seoni 963 933 8
5 Ratlam 962 943 4
6 Mandsaur 959 941 6
7 Chhindwara 958 925 15
8 Dindori 956 945 3
9 Barwani 954 940 7
10 Burhanpur 949 942 5
11 Khandwa (East Nimar) 949 929 9
12 Rajgarh 948 915 20
13 Ujjain 946 925 14
14 Betul 945 916 19
15 Khargone (West Nimar) 943 927 11
16 Shajapur 941 920 16
17 Harda 938 905 22
18 Jhabua 937 928 10
19 Shahdol 932 895 34
20 Dewas 931 918 17
21 Neemuch 929 925 13
22 Katni 924 908 21
23 Sehore 923 899 28
24 Umaria 920 916 18
25 Indore 918 902 24
26 Anuppur 918 899 29
27 Narsimhapur 917 904 23
28 Hoshangabad 915 895 32
29 Jabalpur 914 895 33
30 Vidisha 913 887 31
31 Guna 913 896 37
32 Sidhi 913 849 48
33 Bhopal 911 898 30
34 Tikamgarh 910 899 27
35 Damoh 909 900 25
36 Ashoknagar 908 900 26
37 Sagar 906 894 35
38 Rewa 903 878 39
39 Satna 902 882 38
40 Panna 901 887 36
41 Sheopur 901 877 40
42 Dhar 893 875 41
43 Chhatarpur 893 874 43
44 Datia 892 870 44
45 Raisen 891 866 45
46 Shivpuri 890 874 42
47 Singrauli 879 850 47
48 Gwalior 869 857 46
49 Bhind 864 843 49
50 Morena 858 842 50
750
800
850
900
950
1,00
0
1,05
0
Balaghat
Mandla
Alirajpur
Seoni
Ratlam
Mandsaur
Chhindwara
Dindori
Barwani
Burhanpur
Khandwa (East Nimar)
Rajgarh
Ujjain
Betul
Khargone (West Nimar)
Shajapur
Harda
Jhabua
Shahdol
Dewas
Neemuch
Katni
Sehore
Umaria
Indore
Anuppur
Narsimhapur
Hoshangabad
Jabalpur
Vidisha
Guna
Sidhi
Bhopal
Tikamgarh
Damoh
Ashoknagar
Sagar
Rewa
Satna
Panna
Sheopur
Dhar
Chhatarpur
Datia
Raisen
Shivpuri
Singrauli
Gwalior
Bhind
Morena
Sex ratio
Dis
tric
ts
2001 2011 Fig. 5.4 Sex ratio in districts, Urban

148
Change in rural sex ratio : 1991-01 and 2001-11 Change in urban sex ratio : 1991-01 and 2001-11
7
56
7
9
19
8
20
21
13
7
4
33
3
11
12
18
11
3
13
2
17
195
22
20
18
12
15
17
10
87
28
4
31
1111
13
12
35
22
16
75
21
15
35
5
1
12 11
9
33
12
16
29
8
29
4
4
19
16
25
18 30
20
24
20
139
26
17
25
14
7
20
24
24
21
33
21
11
29
16
11
18
14
37
19
13
19
16
21
64
12
19
16
42 33
22
13
6
8
0
7
8
5
6
1
0
8
2
1
49
4
8
4
6
8
2
07
21
1
3
7
11
13
11
8
10
18
3
10
5
3
11
16
10
15
12
12
10
20
16
6
18
12
12
12
7
6 0
8
5
5
4
15
8
12
19
8
6
7
4
4
4
6
8
13
13
18
11
116
13
9
20
22
7
14
7
11
14
21
17
14
1917
1315
2413
16
18
10
11
18
24
1991-2001
2001-2011
1991-2001
2001-2011
NUMBER OF FEMALES PER 1000 MALES
21 AND ABOVE
16 - 20
11 - 15
10 AND BELOW
3 AND BELOW
7 AND ABOVE
0
DECREASE
4 - 6
INCREASENUMBER OF FEMALES PER 1000 MALES
31 AND ABOVE
21 - 30
11 - 20
10 AND BELOW
5 AND BELOW
6 AND ABOVE
DECREASE INCREASE
GENDER COMPOSITION (SEX RATIO)
PROVISIONAL POPULATION TOTALS 149
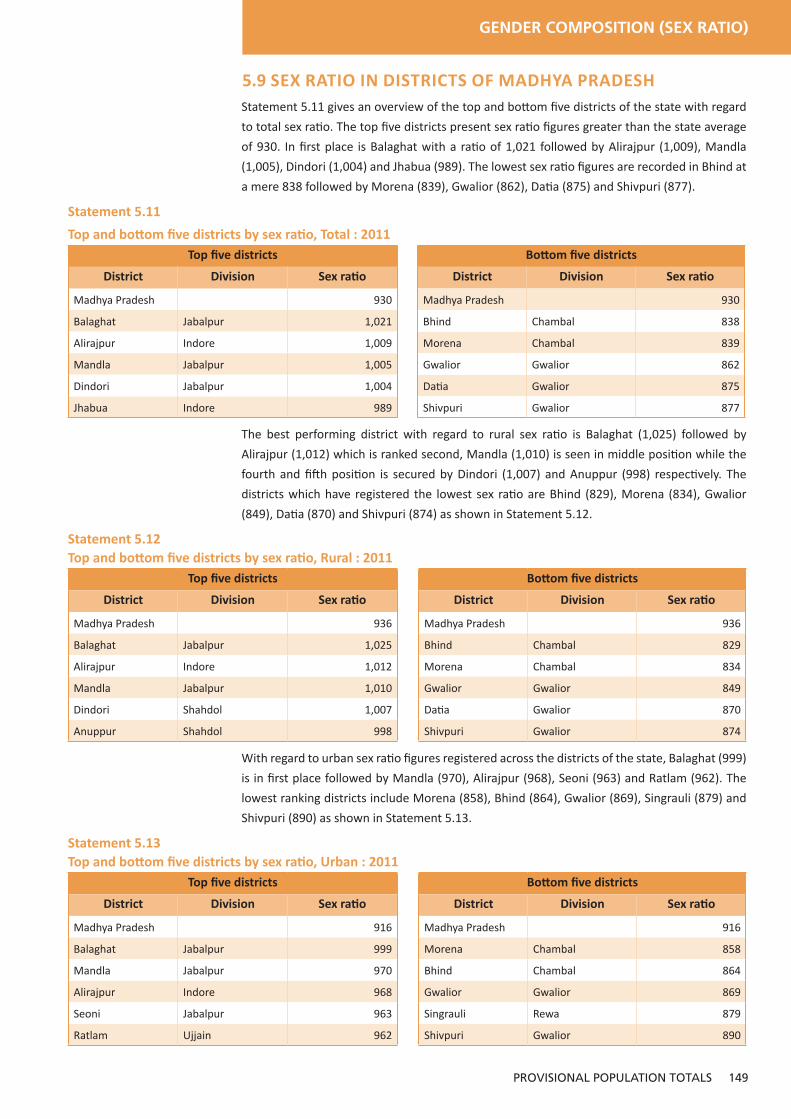
5.9 SEX RATIO IN DISTRICTS OF MADHYA PRADESHStatement 5.11 gives an overview of the top and bottom five districts of the state with regard
to total sex ratio. The top five districts present sex ratio figures greater than the state average
of 930. In first place is Balaghat with a ratio of 1,021 followed by Alirajpur (1,009), Mandla
(1,005), Dindori (1,004) and Jhabua (989). The lowest sex ratio figures are recorded in Bhind at
a mere 838 followed by Morena (839), Gwalior (862), Datia (875) and Shivpuri (877).
Statement 5.11
Top and bottom five districts by sex ratio, Total : 2011Top five districts
District Division Sex ratio
Madhya Pradesh 930
Balaghat Jabalpur 1,021
Alirajpur Indore 1,009
Mandla Jabalpur 1,005
Dindori Jabalpur 1,004
Jhabua Indore 989
Bottom five districts
District Division Sex ratio
Madhya Pradesh 930
Bhind Chambal 838
Morena Chambal 839
Gwalior Gwalior 862
Datia Gwalior 875
Shivpuri Gwalior 877
The best performing district with regard to rural sex ratio is Balaghat (1,025) followed by
Alirajpur (1,012) which is ranked second, Mandla (1,010) is seen in middle position while the
fourth and fifth position is secured by Dindori (1,007) and Anuppur (998) respectively. The
districts which have registered the lowest sex ratio are Bhind (829), Morena (834), Gwalior
(849), Datia (870) and Shivpuri (874) as shown in Statement 5.12.
Statement 5.12Top and bottom five districts by sex ratio, Rural : 2011
Top five districts
District Division Sex ratio
Madhya Pradesh 936
Balaghat Jabalpur 1,025
Alirajpur Indore 1,012
Mandla Jabalpur 1,010
Dindori Shahdol 1,007
Anuppur Shahdol 998
Bottom five districts
District Division Sex ratio
Madhya Pradesh 936
Bhind Chambal 829
Morena Chambal 834
Gwalior Gwalior 849
Datia Gwalior 870
Shivpuri Gwalior 874
With regard to urban sex ratio figures registered across the districts of the state, Balaghat (999)
is in first place followed by Mandla (970), Alirajpur (968), Seoni (963) and Ratlam (962). The
lowest ranking districts include Morena (858), Bhind (864), Gwalior (869), Singrauli (879) and
Shivpuri (890) as shown in Statement 5.13.
Statement 5.13Top and bottom five districts by sex ratio, Urban : 2011
Top five districts
District Division Sex ratio
Madhya Pradesh 916
Balaghat Jabalpur 999
Mandla Jabalpur 970
Alirajpur Indore 968
Seoni Jabalpur 963
Ratlam Ujjain 962
Bottom five districts
District Division Sex ratio
Madhya Pradesh 916
Morena Chambal 858
Bhind Chambal 864
Gwalior Gwalior 869
Singrauli Rewa 879
Shivpuri Gwalior 890

150
5.10 SEX RATIO IN TAHSILS OF MADHYA PRADESH
The top and bottom five tahsils as per the sex ratio figures in rural areas can be studied from
Statement 5.14. For the rural areas it is seen that Ghugari (1,035) is the best performing tahsil
with the highest sex ratio followed by Balaghat (1,034) whereas the tahsils which fared the
worst include Morena (804) and Gohad (815). It is seen that among the top five tahsils in the
rural areas, four belong to Balaghat district whereas among the bottom five tahsils in rural
areas three belong to Bhind district.
Statement 5.14Top and bottom five tahsils by sex ratio, Rural : 2011
Top five tahsils
Tahsil District Sex ratio
Ghughari Mandla 1,035
Balaghat Balaghat 1,034
Katangi Balaghat 1,033
Baihar Balaghat 1,030
Paraswada Balaghat 1,030
Bottom five tahsils
Tahsil District Sex ratio
Morena Morena 804
Gohad Bhind 815
Mehgaon Bhind 816
Gormi Bhind 824
Joura Morena 826
The trend of urban sex ratio figures in the tahsils indicates that Tirodi (1,039) is seen in the
top position with Paraswada (1,030) ranking second while the tahsils which have reported
the lowest sex ratio figures include Gohad (834) and Karera (843). Four tahsils, among the top
five tahsils for urban areas, belong to Balaghat district. No clear trend on similar lines can be
inferred for the bottom five tahsils in the urban areas as shown in Statement 5.15.
Statement 5.15Top and bottom five tahsils by sex ratio, Urban : 2011
Top five tahsils
Tahsil District Sex ratio
Tirodi Balaghat 1,039
Paraswada Balaghat 1,030
Ghansaur Seoni 1,016
Kirnapur Balaghat 1,012
Baihar Balaghat 1,012
Bottom five tahsils
Tahsil District Sex ratio
Gohad Bhind 834
Karera Shivpuri 843
Morena Morena 846
Goharganj Raisen 849
Dabra Gwalior 850

GENDER COMPOSITION (SEX RATIO)
PROVISIONAL POPULATION TOTALS 151
5.10.1 Distribution of tahsils in different ranges of sex ratio, Rural : 2001 and 2011
Statement 5.16 provides a link between the number of tahsils in the rural areas and its
corresponding sex ratio range for 2001 and 2011. The absolute rural population has increased
from 44,380,878 to 52,537,899. For 2001, the maximum number of tahsils (113) have reported
sex ratio in the range 950-999 which houses 33.8 percent of the rural population. However in
2011 the maximum number of tahsils (120) have reported sex ratio in the range of 900-949
where 34.9 percent of the rural population resides. The number of tahsils with sex ratio in the
favourable range of above 1000 females per thousand males has shown an increase from 17
in 2001 to 29 in 2011.
Statement 5.16Distribution of tahsils by ranges of sex ratio, Rural : 2001 and 2011Ranges of sex ratio 2001 2011
No.of tahsil Share of population No.of tahsil Share of population
Absolute Percent Absolute Percent
Total 342 44,380,878 100.0 342 52,537,899 100.0
< 850 19 3,011,970 6.8 12 2,553,039 4.9
850-899 86 9,924,434 22.4 64 8,678,624 16.5
900-949 107 14,079,788 31.7 120 18,345,826 34.9
950-999 113 14,989,517 33.8 117 18,065,499 34.4
>1000 17 2,375,169 5.4 29 4,894,911 9.3
Note : The population figures for Census 2001 have been recast as per Census 2011 jurisdiction of the districts/tahsils.
5.10.2 Distribution of tahsils in different ranges of sex ratio, Urban : 2001 and 2011
The distribution of the tahsils in urban areas as per their corresponding sex ratio range is
as shown in Statement 5.17 for 2001 and 2011. There has been an increase in tahsils with
urban area component from 261 in 2001 to 282 in 2011 along with an increase in the urban
population from 15,967,145 in 2001 to 20,059,666 in 2011. In 2001, the maximum number of
tahsils (130) with sex ratio in the range 900-949 houses an urban population of 46 percent.
Similarly in 2011, the maximum number of tahsils (149) correspond to sex ratio in the range
900-949 where 61.3 percent of the urban population resides. There has been an increase of 5
tahsils in 2011 with sex ratio in the most favourable range of above 1000 females per thousand
males.
Statement 5.17Distribution of tahsils by ranges of sex ratio, Urban : 2001 and 2011Ranges of sex ratio 2001 2011
No.of tahsil Share of population No.of tahsil Share of population
Absolute Percent Absolute Percent
Total 261 15,967,145 100.0 282 20,059,666 100.0
< 850 21 1,207,244 7.6 4 488,244 2.4
850-899 82 6,844,575 42.9 50 4,447,831 22.2
900-949 130 7,346,474 46.0 149 12,291,457 61.3
950-999 25 546,328 3.4 71 2,702,333 13.5
>1000 3 22,524 0.1 8 129,801 0.6
Note : 1. The population figures for Census 2001 have been recast as per Census 2011 jurisdiction of the districts/tahsils.
2. Out of 342 tahsils of Census 2011, there is no urban population in 60 tahsils.
3. There were no urban population in 21 recast tahsils of Census 2001.
152
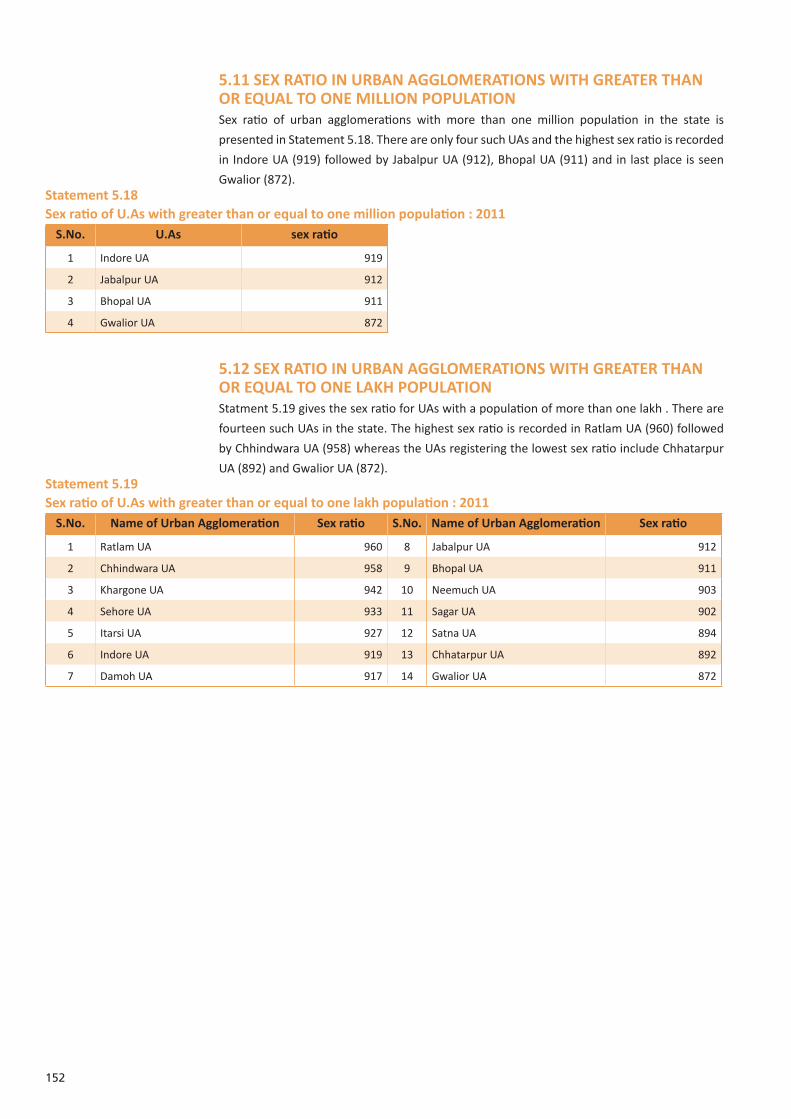
5.11 SEX RATIO IN URBAN AGGLOMERATIONS WITH GREATER THAN OR EQUAL TO ONE MILLION POPULATIONSex ratio of urban agglomerations with more than one million population in the state is
presented in Statement 5.18. There are only four such UAs and the highest sex ratio is recorded
in Indore UA (919) followed by Jabalpur UA (912), Bhopal UA (911) and in last place is seen
Gwalior (872).Statement 5.18Sex ratio of U.As with greater than or equal to one million population : 2011
S.No. U.As sex ratio
1 Indore UA 919
2 Jabalpur UA 912
3 Bhopal UA 911
4 Gwalior UA 872
5.12 SEX RATIO IN URBAN AGGLOMERATIONS WITH GREATER THAN OR EQUAL TO ONE LAKH POPULATIONStatment 5.19 gives the sex ratio for UAs with a population of more than one lakh . There are
fourteen such UAs in the state. The highest sex ratio is recorded in Ratlam UA (960) followed
by Chhindwara UA (958) whereas the UAs registering the lowest sex ratio include Chhatarpur
UA (892) and Gwalior UA (872).Statement 5.19Sex ratio of U.As with greater than or equal to one lakh population : 2011
S.No. Name of Urban Agglomeration Sex ratio S.No. Name of Urban Agglomeration Sex ratio
1 Ratlam UA 960 8 Jabalpur UA 912
2 Chhindwara UA 958 9 Bhopal UA 911
3 Khargone UA 942 10 Neemuch UA 903
4 Sehore UA 933 11 Sagar UA 902
5 Itarsi UA 927 12 Satna UA 894
6 Indore UA 919 13 Chhatarpur UA 892
7 Damoh UA 917 14 Gwalior UA 872

GENDER COMPOSITION (SEX RATIO)
PROVISIONAL POPULATION TOTALS 153
5.13 SEX RATIO IN CITIES WITH GREATER THAN OR EQUAL TO ONE LAKH POPULATION
There are thirty two cities in the state with population equal to or greater than one lakh.
The sex ratio of these cities is listed in Statement 5.20. Highest sex ratio of 963 is recorded in
Chhindwara (M) and Ratlam (M) whereas the lowest sex ratio is recorded in Pithampur (M)
registering 787 followed by Morena (M) at 850.
Statement 5.20Sex ratio of cities with greater than or equal to one lakh population : 2011
S.No. Name of city District Sex ratio S.No. Name of city District Sex ratio
1 Chhindwara Chhindwara 963 17 Sagar Sagar 916
2 Ratlam Ratlam 961 18 Vidisha Vidisha 915
3 Mandsaur Mandsaur 955 19 Hoshangabad Hoshangabad 915
4 Seoni Seoni 955 20 Guna Guna 912
5 Betul Betul 953 21 Bhopal Bhopal 911
6 Khandwa Khandwa (East Nimar) 951 22 Neemuch Neemuch 903
7 Burhanpur Burhanpur 948 23 Datia Datia 898
8 Khargone Khargone (West Nimar) 947 24 Satna Satna 895
9 Nagda Ujjain 946 25 Chhatarpur Chhatarpur 893
10 Ujjain Ujjain 942 26 Shivpuri Shivpuri 890
11 Sehore Sehore 933 27 Rewa Rewa 889
12 Jabalpur Jabalpur 929 28 Gwalior Gwalior 878
13 Dewas Dewas 927 29 Singrauli Singrauli 878
14 Murwara (Katni) Katni 922 30 Bhind Bhind 872
15 Indore Indore 921 31 Morena Morena 850
16 Damoh Damoh 919 32 Pithampur Dhar 787
5.14 SEX RATIO IN MUNICIPAL CORPORATIONS
The municipal corporations which have registered the highest sex ratio include Ratlam with
a sex ratio of 961 followed by Khandwa (951) and Burhanpur (948). The lowest sex ratio is
observed in Singrauli and Gwalior with identical ratio of 878 females per thousand males
followed by Rewa (889) and Satna (895) as shown in Statement 5.21.
Statement 5.21Sex ratio of Municipal Corporations : 2011
S.No. Municipal Corporation Sex ratio S.No. Municipal Corporation Sex ratio
1 Ratlam 961 8 Indore 921
2 Khandwa 951 9 Sagar 916
3 Burhanpur 948 10 Bhopal 911
4 Ujjain 942 11 Satna 895
5 Jabalpur 929 12 Rewa 889
6 Dewas 927 13 Gwalior 878
7 Katni 922 14 Singrauli 878
154
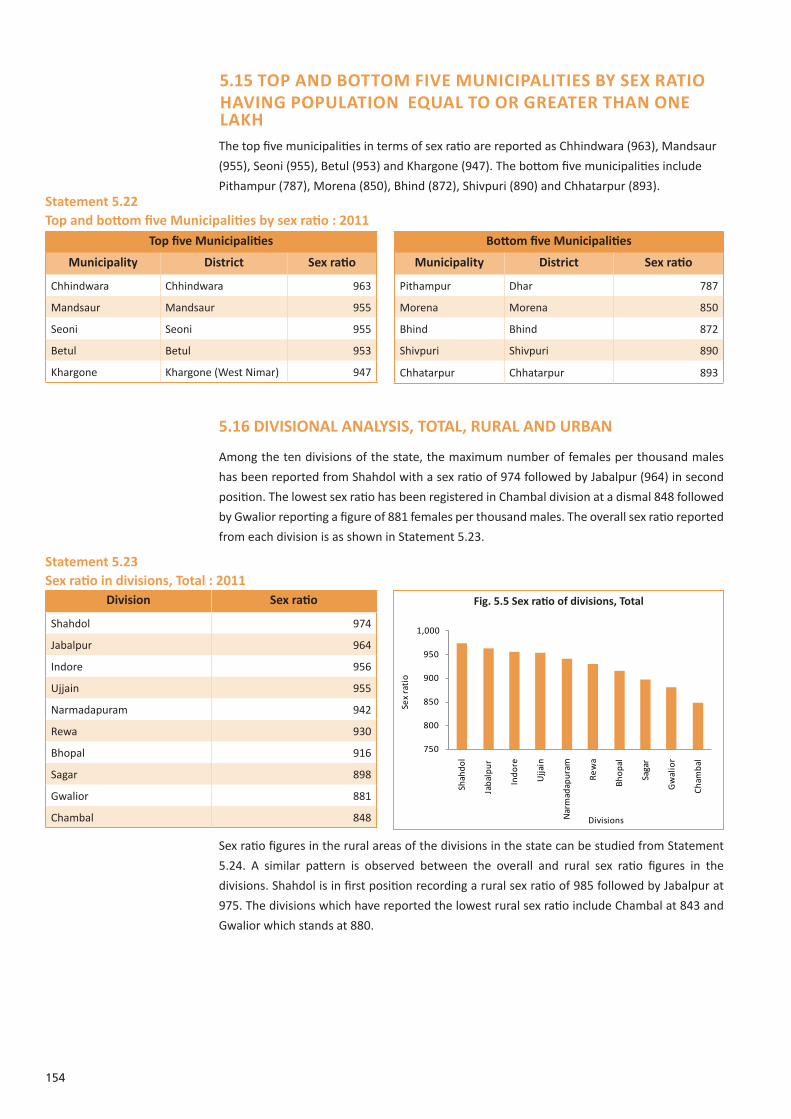
5.15 TOP AND BOTTOM FIVE MUNICIPALITIES BY SEX RATIOHAVING POPULATION EQUAL TO OR GREATER THAN ONE LAKH The top five municipalities in terms of sex ratio are reported as Chhindwara (963), Mandsaur
(955), Seoni (955), Betul (953) and Khargone (947). The bottom five municipalities include
Pithampur (787), Morena (850), Bhind (872), Shivpuri (890) and Chhatarpur (893). Statement 5.22Top and bottom five Municipalities by sex ratio : 2011
Top five Municipalities
Municipality District Sex ratio
Chhindwara Chhindwara 963
Mandsaur Mandsaur 955
Seoni Seoni 955
Betul Betul 953
Khargone Khargone (West Nimar) 947
Bottom five Municipalities
Municipality District Sex ratio
Pithampur Dhar 787
Morena Morena 850
Bhind Bhind 872
Shivpuri Shivpuri 890
Chhatarpur Chhatarpur 893
5.16 DIVISIONAL ANALYSIS, TOTAL, RURAL AND URBAN
Among the ten divisions of the state, the maximum number of females per thousand males
has been reported from Shahdol with a sex ratio of 974 followed by Jabalpur (964) in second
position. The lowest sex ratio has been registered in Chambal division at a dismal 848 followed
by Gwalior reporting a figure of 881 females per thousand males. The overall sex ratio reported
from each division is as shown in Statement 5.23.
Statement 5.23Sex ratio in divisions, Total : 2011
750
800
850
900
950
1,000
Shah
dol
Jaba
lpur
Indo
re
Ujja
in
Nar
mad
apur
am
Rew
a
Bhop
al
Saga
r
Gw
alio
r
Cham
bal
Sex
rati
o
Divisions
Division Sex ratio
Shahdol 974
Jabalpur 964
Indore 956
Ujjain 955
Narmadapuram 942
Rewa 930
Bhopal 916
Sagar 898
Gwalior 881
Chambal 848
Fig. 5.5 Sex ratio of divisions, Total
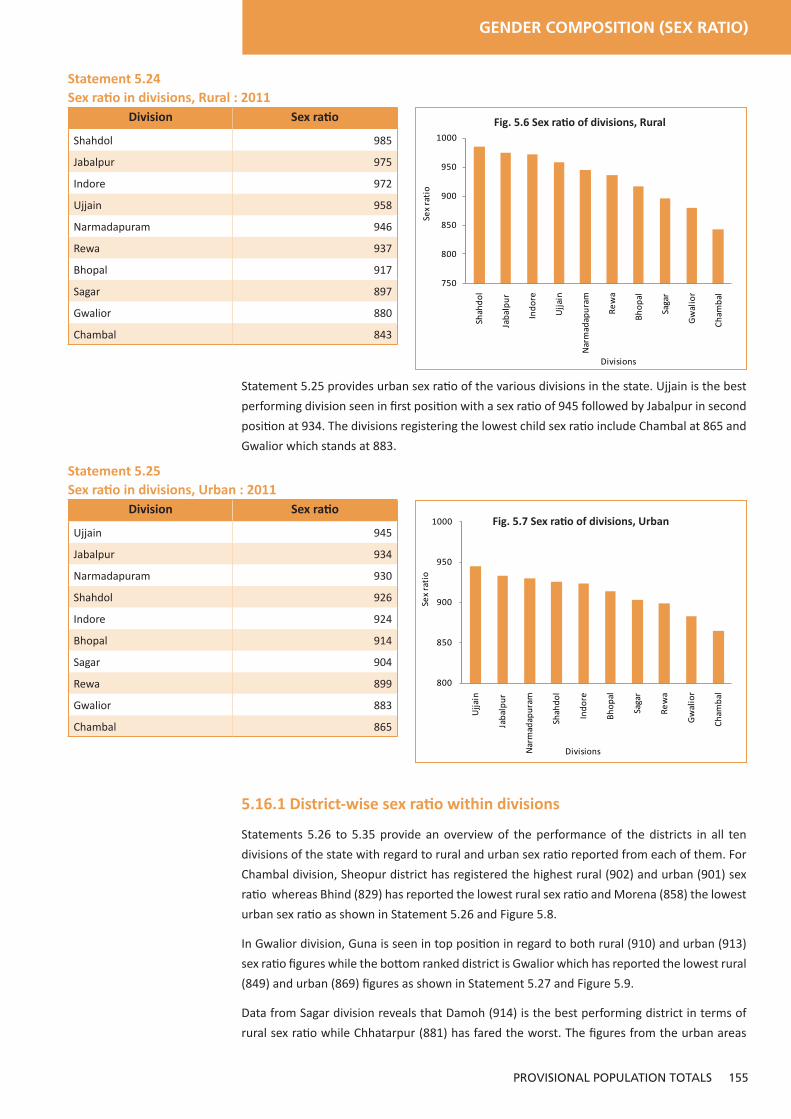
Sex ratio figures in the rural areas of the divisions in the state can be studied from Statement
5.24. A similar pattern is observed between the overall and rural sex ratio figures in the
divisions. Shahdol is in first position recording a rural sex ratio of 985 followed by Jabalpur at
975. The divisions which have reported the lowest rural sex ratio include Chambal at 843 and
Gwalior which stands at 880.
GENDER COMPOSITION (SEX RATIO)
PROVISIONAL POPULATION TOTALS 155
Statement 5.24Sex ratio in divisions, Rural : 2011
750
800
850
900
950
1000
Shah
dol
Jaba
lpur
Indo
re
Ujja
in
Nar
mad
apur
am
Rew
a
Bhop
al
Saga
r
Gw
alio
r
Cham
bal
Sex
rati
o
Divisions
Fig. 5.6 Sex ratio of divisions, RuralDivision Sex ratio
Shahdol 985
Jabalpur 975
Indore 972
Ujjain 958
Narmadapuram 946
Rewa 937
Bhopal 917
Sagar 897
Gwalior 880
Chambal 843
Statement 5.25 provides urban sex ratio of the various divisions in the state. Ujjain is the best
performing division seen in first position with a sex ratio of 945 followed by Jabalpur in second
position at 934. The divisions registering the lowest child sex ratio include Chambal at 865 and
Gwalior which stands at 883.
Statement 5.25Sex ratio in divisions, Urban : 2011
800
850
900
950
1000
Ujja
in
Jaba
lpur
Nar
mad
apur
am
Shah
dol
Indo
re
Bhop
al
Saga
r
Rew
a
Gw
alio
r
Cham
bal
Sex
rati
o
Divisions
Fig. 5.7 Sex ratio of divisions, UrbanDivision Sex ratio
Ujjain 945
Jabalpur 934
Narmadapuram 930
Shahdol 926
Indore 924
Bhopal 914
Sagar 904
Rewa 899
Gwalior 883
Chambal 865
5.16.1 District-wise sex ratio within divisions
Statements 5.26 to 5.35 provide an overview of the performance of the districts in all ten
divisions of the state with regard to rural and urban sex ratio reported from each of them. For
Chambal division, Sheopur district has registered the highest rural (902) and urban (901) sex
ratio whereas Bhind (829) has reported the lowest rural sex ratio and Morena (858) the lowest
urban sex ratio as shown in Statement 5.26 and Figure 5.8.
In Gwalior division, Guna is seen in top position in regard to both rural (910) and urban (913)
sex ratio figures while the bottom ranked district is Gwalior which has reported the lowest rural
(849) and urban (869) figures as shown in Statement 5.27 and Figure 5.9.
Data from Sagar division reveals that Damoh (914) is the best performing district in terms of
rural sex ratio while Chhatarpur (881) has fared the worst. The figures from the urban areas

156
indicate that Tikamgarh (910) is in the top most position whereas Chhatarpur (893) has fared
the worst as shown in Statement 5.28 and Figure 5.10.
In the rural areas in Rewa division Sidhi (956) has reported the highest sex ratio and Singrauli
(925) is seen to record the least figures. In regard to urban sex ratio, a similar pattern is seen
with Sidhi (913) in first place while Singrauli (879) has fared the worst as shown in Statement
5.29 and Figure 5.11.
For Shahdol division, Dindori has registered the highest rural (1,007) and urban (956) sex ratio
figures whereas Umaria (960) has fared the worst in terms of rural sex ratio and Anuppur (918)
has registered the lowest urban sex ratio as shown in Statement 5.30 and Figure 5.12.
Statement 5.31 and Figure 5.13 depicts the sex ratio trend across the districts in Ujjain division.
Ratlam is the best performing district in regard to rural (977) and urban (962) sex ratio while
Shajapur (939) is the worst performing district in the rural areas and Neemuch (929) has fared
the worst in terms of urban sex ratio.
Across the eight districts in Indore division, the maximum rural (1,012) and urban (968) sex
ratio figures have been registered in Alirajpur. In terms of rural sex ratio, Khandwa (943) and
Indore (943) districts are seen in last position while from the perspective of urban sex ratio
Indore (918) district has fared the worst as shown in Statement 5.32 and Figure 5.14.
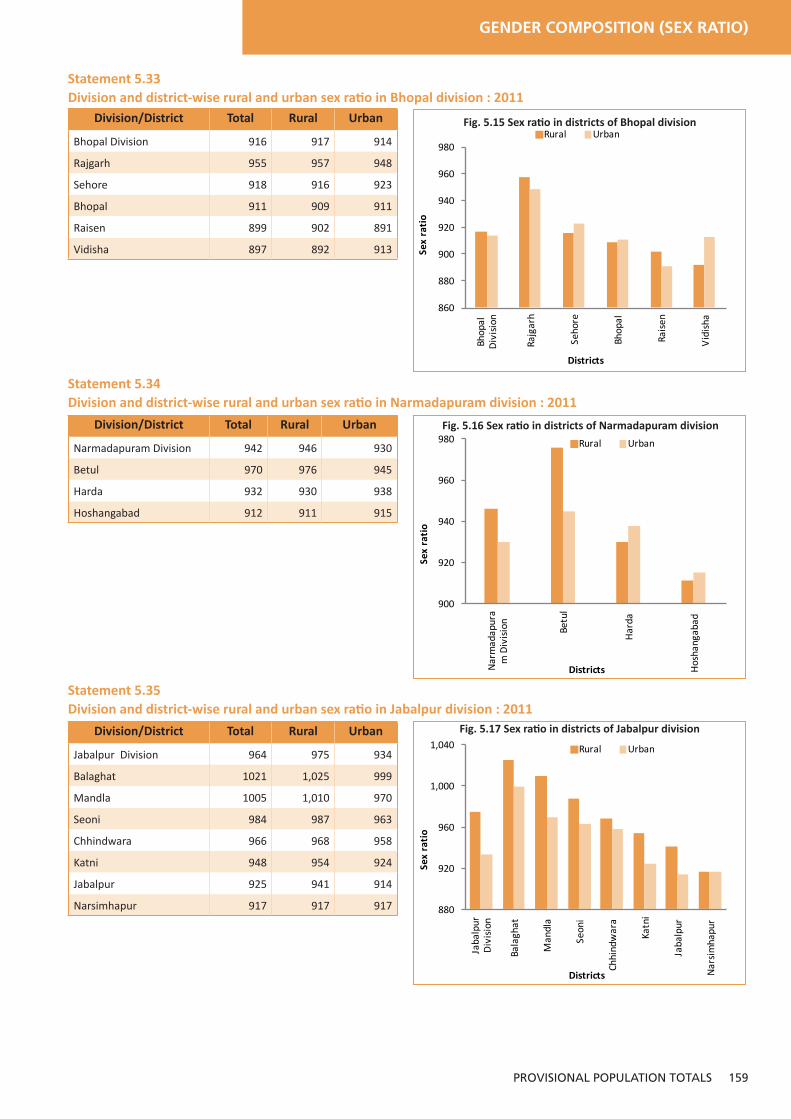
For Bhopal division, Rajgarh has reported the highest sex ratio in the rural (957) and urban
(948) areas. Vidisha (892) has registered the lowest rural sex ratio while Raisen (891) is seen in
last place in terms of urban sex ratio as shown in Statement 5.33 and Figure 5.15.
In Narmadapuram division, Betul is in first place in rural (976) and urban (945) sex ratio figures
whereas Hoshangabad has reported the lowest rural (911) and urban (915) figures as shown in
Statement 5.34 and Figure 5.16.
Among the seven districts in Jabalpur division, Balaghat is the best performing district in regard
to both rural (1,025) and urban (999) sex ratio. Narsimhapur (917) is in last place in terms of
rural sex ratio while Jabalpur (914) has fared the worst in urban sex ratio as shown in Statement
5.35 and Figure 5.17.
Statement 5.26Division and district-wise rural and urban sex ratio in Chambal division : 2011
800
820
840
860
880
900
920
Cham
bal
Div
isio
n
Sheo
pur
Mor
ena
Bhin
d
800
820
840
860
880
900
920
Cham
bal
Div
isio
n
Sheo
pur
Mor
ena
Bhin
d
Sex
rati
o
Districts
Rural Urban
800
820
840
860
880
900
920
Cham
bal
Div
isio
n
Sheo
pur
Mor
ena
Bhin
d
Sex
rati
o
Districts
Rural Urban
800
820
840
860
880
900
920
Cham
bal
Div
isio
n
Sheo
pur
Mor
ena
Bhin
d
Sex
rati
o
Districts
Rural Urban
Division/District Total Rural Urban
Chambal Division 848 843 865
Sheopur 902 902 901
Morena 839 834 858
Bhind 838 829 864
Fig. 5.8 Sex ratio in districts of Chambal division

GENDER COMPOSITION (SEX RATIO)
PROVISIONAL POPULATION TOTALS 157
Statement 5.27Division and district-wise rural and urban sex ratio in Gwalior division : 2011
820
840
860
880
900
920
Gw
alio
r D
ivis
ion
Gun
a
Ash
okna
gar
Shiv
puri
Dat
ia
Gw
alio
r
Division/District Total Rural Urban
Gwalior Division 881 880 883
Guna 910 910 913
Ashoknagar 900 899 908
Shivpuri 877 874 890
Datia 875 870 892
Gwalior 862 849 869
800
820
840
860
880
900
920
Cham
bal
Div
isio
n
Sheo
pur
Mor
ena
Bhin
d
Sex
rati
o
Districts
Rural Urban
800
820
840
860
880
900
920
Cham
bal
Div
isio
n
Sheo
pur
Mor
ena
Bhin
d
Sex
rati
o
Districts
Rural Urban
800
820
840
860
880
900
920
Cham
bal
Div
isio
n
Sheo
pur
Mor
ena
Bhin
d
Sex
rati
o
Districts
Rural Urban
Fig. 5.9 Sex ratio in districts of Gwalior division
Statement 5.28Division and district-wise rural and urban sex ratio in Sagar division : 2011
840
860
880
900
920
Saga
r D
ivis
ion
Dam
oh
Pann
a
Tika
mga
rh
Saga
r
Chha
tarp
ur
800
820
840
860
880
900
920
Cham
bal
Div
isio
n
Sheo
pur
Mor
ena
Bhin
d
Sex
rati
o
Districts
Rural Urban
800
820
840
860
880
900
920Ch
amba
l D
ivis
ion
Sheo
pur
Mor
ena
Bhin
d
Sex
rati
o
Districts
Rural Urban
800
820
840
860
880
900
920
Cham
bal
Div
isio
n
Sheo
pur
Mor
ena
Bhin
d
Sex
rati
o
Districts
Rural Urban
Division/District Total Rural Urban
Sagar Division 898 897 904
Damoh 913 914 909
Panna 907 908 901
Tikamgarh 901 900 910
Sagar 896 892 906
Chhatarpur 884 881 893
Fig. 5.10 Sex ratio in districts of Sagar division
Statement 5.29Division and district-wise rural and urban sex ratio in Rewa division : 2011
800
820
840
860
880
900
920
Cham
bal
Div
isio
n
Sheo
pur
Mor
ena
Bhin
d
Sex
rati
o
Districts
Rural Urban
800
820
840
860
880
900
920
Cham
bal
Div
isio
n
Sheo
pur
Mor
ena
Bhin
d
Sex
rati
o
Districts
Rural Urban
800
820
840
860
880
900
920
Cham
bal
Div
isio
n
Sheo
pur
Mor
ena
Bhin
d
Sex
rati
o
Districts
Rural Urban
Division/District Total Rural Urban
Rewa Division 930 937 899
Sidhi 952 956 913
Rewa 930 935 903
Satna 927 933 902
Singrauli 916 925 879
Fig. 5.11 Sex ratio in districts of Rewa division
840
860
880
900
920
940
960
Rew
a D
ivis
ion
Sidh
i
Rew
a
Satn
a
Sing
raul
i

158
Statement 5.30Division and district-wise rural and urban sex ratio in Shahdol division : 2011
800
820
840
860
880
900
920
Cham
bal
Div
isio
n
Sheo
pur
Mor
ena
Bhin
d
Sex
rati
o
Districts
Rural Urban
800
820
840
860
880
900
920
Cham
bal
Div
isio
n
Sheo
pur
Mor
ena
Bhin
d
Sex
rati
o
Districts
Rural Urban
800
820
840
860
880
900
920
Cham
bal
Div
isio
n
Sheo
pur
Mor
ena
Bhin
d
Sex
rati
o
Districts
Rural Urban
Division/District Total Rural Urban
Shahdol Division 974 985 926
Dindori 1,004 1,007 956
Anuppur 975 998 918
Shahdol 968 977 932
Umaria 953 960 920
Fig. 5.12 Sex ratio in districts of Shahdol division
880
900
920
940
960
980
1,000
1,020
Shah
dol
Div
isio
n
Din
dori
Anu
ppur
Shah
dol
Um
aria
Statement 5.31Division and district-wise rural and urban sex ratio in Ujjain division : 2011
Division/District Total Rural Urban
Ujjain Division 955 958 945
Ratlam 973 977 962
Mandsaur 966 968 959
Neemuch 959 972 929
Ujjain 954 960 946
Dewas 941 945 931
Shajapur 939 939 941
Fig. 5.13 Sex ratio in districts of Ujjain division
800
820
840
860
880
900
920
Cham
bal
Div
isio
n
Sheo
pur
Mor
ena
Bhin
d
Sex
rati
o
Districts
Rural Urban
800
820
840
860
880
900
920Ch
amba
l D
ivis
ion
Sheo
pur
Mor
ena
Bhin
d
Sex
rati
o
Districts
Rural Urban
800
820
840
860
880
900
920Ch
amba
l D
ivis
ion
Sheo
pur
Mor
ena
Bhin
d
Sex
rati
o
Districts
Rural Urban
920
940
960
980U
jjain
D
ivis
ion
Ratl
am
Man
dsau
r
Nee
muc
h
Ujja
in
Dew
as
Shaj
apur
Statement 5.32Division and district-wise rural and urban sex ratio in Indore division : 2011
Division/District Total Rural Urban
Indore Division 956 972 924
Alirajpur 1,009 1,012 968
Jhabua 989 995 937
Barwani 981 985 954
Khargone (West Nimar) 963 967 943
Dhar 961 977 893
Burhanpur 951 952 949
Khandwa (East Nimar) 944 943 949
Indore 924 943 918
Fig. 5.14 Sex ratio in districts of Indore division
800
820
840
860
880
900
920
Cham
bal
Div
isio
n
Sheo
pur
Mor
ena
Bhin
d
Sex
rati
o
Districts
Rural Urban
800
820
840
860
880
900
920
Cham
bal
Div
isio
n
Sheo
pur
Mor
ena
Bhin
d
Sex
rati
o
Districts
Rural Urban
800
820
840
860
880
900
920
Cham
bal
Div
isio
n
Sheo
pur
Mor
ena
Bhin
d
Sex
rati
o
Districts
Rural Urban
880
900
920
940
960
980
1,000
1,020
Indo
re
Div
isio
n
Alir
ajpu
r
Jhab
ua
Barw
ani
Khar
gone
(W
est … Dha
r
Burh
anpu
r
Khan
dwa
(E
ast
Nim
ar)
Indo
re
GENDER COMPOSITION (SEX RATIO)
PROVISIONAL POPULATION TOTALS 159
Statement 5.33Division and district-wise rural and urban sex ratio in Bhopal division : 2011
800
820
840
860
880
900
920
Cham
bal
Div
isio
n
Sheo
pur
Mor
ena
Bhin
d
Sex
rati
o
Districts
Rural Urban
800
820
840
860
880
900
920
Cham
bal
Div
isio
n
Sheo
pur
Mor
ena
Bhin
d
Sex
rati
o
Districts
Rural Urban
800
820
840
860
880
900
920
Cham
bal
Div
isio
n
Sheo
pur
Mor
ena
Bhin
d
Sex
rati
o
Districts
Rural Urban
Division/District Total Rural Urban
Bhopal Division 916 917 914
Rajgarh 955 957 948
Sehore 918 916 923
Bhopal 911 909 911
Raisen 899 902 891
Vidisha 897 892 913
Fig. 5.15 Sex ratio in districts of Bhopal division
860
880
900
920
940
960
980
Bhop
al
Div
isio
n
Rajg
arh
Seho
re
Bhop
al
Rais
en
Vid
isha
Statement 5.34Division and district-wise rural and urban sex ratio in Narmadapuram division : 2011
800
820
840
860
880
900
920
Cham
bal
Div
isio
n
Sheo
pur
Mor
ena
Bhin
d
Sex
rati
o
Districts
Rural Urban
800
820
840
860
880
900
920Ch
amba
l D
ivis
ion
Sheo
pur
Mor
ena
Bhin
d
Sex
rati
o
Districts
Rural Urban
800
820
840
860
880
900
920
Cham
bal
Div
isio
n
Sheo
pur
Mor
ena
Bhin
d
Sex
rati
o
Districts
Rural Urban
900
920
940
960
980
Nar
mad
apur
am
Div
isio
n
Betu
l
Har
da
Hos
hang
abad
Division/District Total Rural Urban
Narmadapuram Division 942 946 930
Betul 970 976 945
Harda 932 930 938
Hoshangabad 912 911 915
Fig. 5.16 Sex ratio in districts of Narmadapuram division
Statement 5.35Division and district-wise rural and urban sex ratio in Jabalpur division : 2011
880
920
960
1,000
1,040
Jaba
lpur
D
ivis
ion
Bala
ghat
Man
dla
Seon
i
Chhi
ndw
ara
Katn
i
Jaba
lpur
Nar
sim
hapu
r
Division/District Total Rural Urban
Jabalpur Division 964 975 934
Balaghat 1021 1,025 999
Mandla 1005 1,010 970
Seoni 984 987 963
Chhindwara 966 968 958
Katni 948 954 924
Jabalpur 925 941 914
Narsimhapur 917 917 917
Fig. 5.17 Sex ratio in districts of Jabalpur division
800
820
840
860
880
900
920
Cham
bal
Div
isio
n
Sheo
pur
Mor
ena
Bhin
d
Sex
rati
o
Districts
Rural Urban
800
820
840
860
880
900
920
Cham
bal
Div
isio
n
Sheo
pur
Mor
ena
Bhin
d
Sex
rati
o
Districts
Rural Urban
800
820
840
860
880
900
920
Cham
bal
Div
isio
n
Sheo
pur
Mor
ena
Bhin
d
Sex
rati
o
Districts
Rural Urban

160
5.16.2 Division-wise sex ratio of top and bottom five tahsils, rural and urban
Statements 5.36 to 5.56 gives an overview of the top and bottom five tahsils, in each division of
the state, with regard to sex ratio figures reported from the rural and urban areas. For Chambal
division, Badoda (925) has registered the maximum rural sex ratio whereas the minimum is
seen in Morena (804) tahsil. In the urban areas of the division, the highest figure is reported
from Badoda (912) and the lowest from Gohad (834) as shown in Statements 5.36 & 5.37.
Statement 5.36Top and bottom five tahsils according to sex ratio in Chambal division, Rural : 2011
Top five tahsils
Tahsil District Sex ratio
Badoda Sheopur 925
Karahal Sheopur 924
Sheopur Sheopur 922
Beerpur Sheopur 884
Vijaypur Sheopur 856
Bottom five tahsils
Tahsil District Sex ratio
Morena Morena 804
Gohad Bhind 815
Mehgaon Bhind 816
Gormi Bhind 824
Joura Morena 826
Statement 5.37Top and bottom five tahsils according to sex ratio in Chambal division, Urban : 2011
Top five tahsils
Tahsil District Sex ratio
Badoda Sheopur 912
Sheopur Sheopur 910
Porsa Morena 892
Ambah Morena 883
Gormi Bhind 882
Bottom five tahsils
Tahsil District Sex ratio
Gohad Bhind 834
Morena Morena 846
Vijaypur Sheopur 853
Joura Morena 858
Mehgaon Bhind 862
Data from Gwalior division reveals that Bamori (931) is the best performing tahsil in rural sex
ratio while Gwalior (834) has fared the worst as shown in Statement 5.38. The top and bottom
five tahsils in the urban areas of Gwalior division have recorded higher sex ratio figures in
comparison to the top and bottom five tahsils in the rural areas. In the urban areas, the highest
sex ratio is observed in Badarwas (932) whereas the lowest is reported from Karera (843) as
shown in Statement 5.39.
Statement 5.38Top and bottom five tahsils according to sex ratio in Gwalior division, Rural : 2011
Top five tahsils
Tahsil District Sex ratio
Bamori Guna 931
Shadhora Ashoknagar 912
Raghogarh Guna 911
Chachaura Guna 911
Maksoodangarh Guna 909
Bottom five tahsils
Tahsil District Sex ratio
Gwalior Gwalior 834
Seondha Datia 842
Narwar Shivpuri 842
Indergarh Datia 865
Shivpuri Shivpuri 865

GENDER COMPOSITION (SEX RATIO)
PROVISIONAL POPULATION TOTALS 161
Statement 5.39Top and bottom five tahsils according to sex ratio in Gwalior division, Urban : 2011
Top five tahsils
Tahsil District Sex ratio
Badarwas Shivpuri 932
Kumbhraj Guna 929
Khaniyadhana Shivpuri 917
Raghogarh Guna 917
Chanderi Ashoknagar 913
Bottom five tahsils
Tahsils District Sex ratio
Karera Shivpuri 843
Dabra Gwalior 850
Seondha Datia 865
Chinour Gwalior 868
Gwalior Gwalior 872
Data for top and bottom five tahsils in the rural and urban areas of Sagar division can be studied
from Statements 5.40 & 5.41. In the rural areas Raipura (936) tahsil has reported the maximum
sex ratio figures while the minimum is seen in Gaurihar (856). The highest urban sex ratio is
observed in Banda (931) and the lowest is in Patharia (871).
Statement 5.40Top and bottom five tahsils according to sex ratio in Sagar division, Rural : 2011
Top five tahsils
Tahsil District Sex ratio
Raipura Panna 936
Tendukheda Damoh 932
Jabera Damoh 930
Shahnagar Panna 928
Gunnor Panna 919
Bottom five tahsils
Tahsil District Sex ratio
Gaurihar Chhatarpur 856
Chandla Chhatarpur 859
Buxwaha Chhatarpur 865
Laundi Chhatarpur 868
Bijawar Chhatarpur 877
Statement 5.41Top and bottom five tahsils according to sex ratio in Sagar division, Urban : 2011
Top five tahsils
Tahsil District Sex ratio
Banda Sagar 931
Jatara Tikamgarh 929
Palera Tikamgarh 924
Garhakota Sagar 924
Bina Sagar 919
Bottom five tahsils
Tahsil District Sex ratio
Patharia Damoh 871
Laundi Chhatarpur 872
Baldeogarh Tikamgarh 877
Khargapur Tikamgarh 881
Pawai Panna 883
A look at Rewa division indicates that Churhat (996) has reported the maximum rural sex ratio
whereas Deosar (901) has fared the worst. In the urban areas, the tahsil registering the highest
sex ratio figure is Kotar (969) and the lowest is in Majhgawan (854) as shown in Statements
5.42 & 5.43.
Statement 5.42Top and bottom five tahsils according to sex ratio in Rewa division, Rural : 2011
Top five tahsils
Tahsil District Sex ratio
Churhat Sidhi 996
Sihawal Sidhi 974
Kusmi Sidhi 973
Ramnagar Satna 958
Mauganj Rewa 955
Bottom five tahsils
Tahsil District Sex ratio
Deosar Singrauli 901
Majhgawan Satna 911
Raghurajnagar Satna 917
Jawa Rewa 919
Birsinghpur Satna 920

162
Statement 5.43Top and bottom five tahsils according to sex ratio in Rewa division, Urban : 2011
Top five tahsils
Tahsil District Sex ratio
Kotar Satna 969
Naigarhi Rewa 959
Rampur Naikin Sidhi 956
Mangawan Rewa 953
Birsinghpur Satna 938
Bottom five tahsils
Tahsil District Sex ratio
Majhgawan Satna 854
Singrauli (Baidhan) Singrauli 878
Huzur Rewa 890
Chitrangi Singrauli 890
Raghurajnagar Satna 896
In the rural areas of Shahdol division, Shahpur (1,008) and Jaitpur (1,008) tahsils have reported
the highest sex ratio figures while the lowest is recorded in Chandia (943). In the urban
areas, the maximum figure is registered in Jaisinghnagar (967) and the minimum is seen in
Pushparajgarh (862) as shown in Statements 5.44 & 5.45.
Statement 5.44Top and bottom five tahsils according to sex ratio in Shahdol division, Rural : 2011
Top five tahsils
Tahsil District Sex ratio
Shahpura Dindori 1,008
Jaitpur Shahdol 1,008
Dindori Dindori 1,006
Jaithari Anuppur 1,002
Kotma Anuppur 998
Bottom five tahsils
Tahsil District Sex ratio
Chandia Umaria 943
Manpur Umaria 960
Beohari Shahdol 961
Bandhogarh Umaria 962
Pali Umaria 970
Statement 5.45Top and bottom five tahsils according to sex ratio in Shahdol division, Urban : 2011
Top five tahsils
Tahsil District Sex ratio
Jaisinghnagar Shahdol 967
Chandia Umaria 964
Dindori Dindori 961
Shahpura Dindori 947
Sohagpur Shahdol 935
Bottom five tahsils
Tahsil District Sex ratio
Pushparajgarh Anuppur 862
Bandhogarh Umaria 893
Beohari Shahdol 909
Anuppur Anuppur 915
Jaithari Anuppur 921
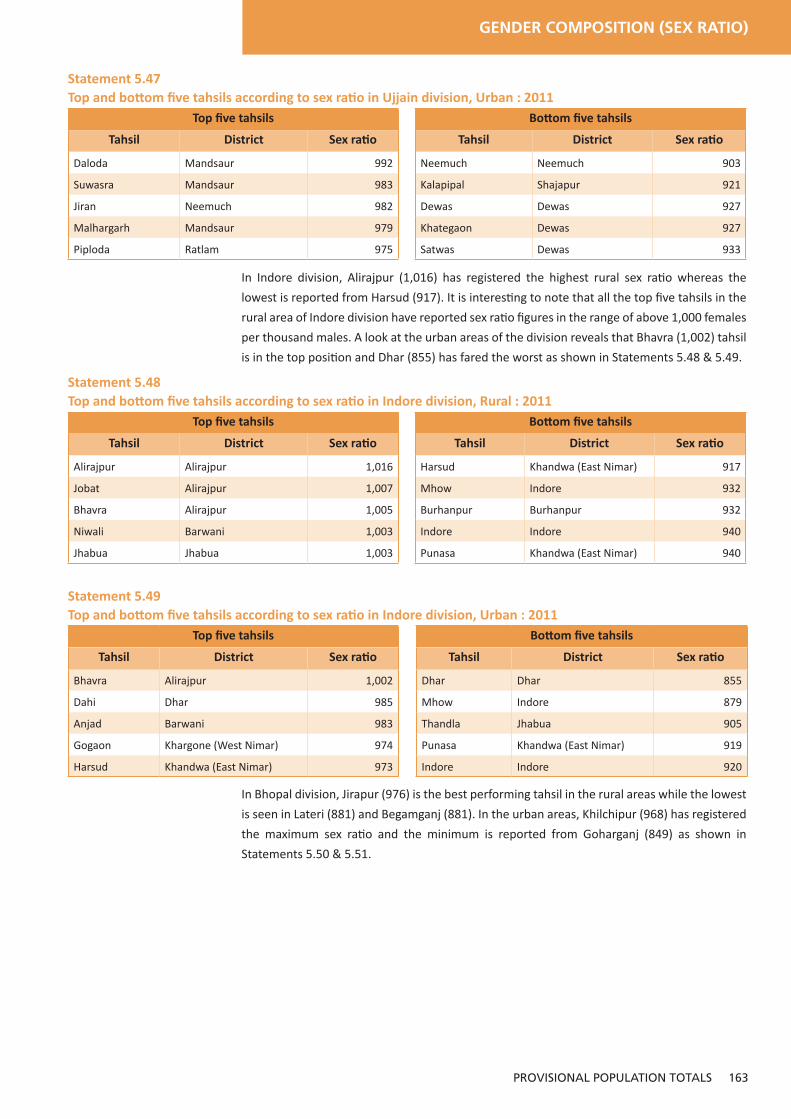
For Ujjain division, Rawti (1,006) tahsil has reported the highest rural sex ratio and the lowest
is seen in Khategaon (922). The data for urban sex ratio figures indicates that Daloda (992) is
the best performing tahsil while Neemuch (903) has fared the worst as shown in Statements
5.46 & 5.47.
Statement 5.46Top and bottom five tahsils according to sex ratio in Ujjain division, Rural : 2011
Top five tahsils
Tahsil District Sex ratio
Rawti Ratlam 1,006
Sailana Ratlam 993
Bajna Ratlam 988
Malhargarh Mandsaur 985
Jiran Neemuch 980
Bottom five tahsils
Tahsil District Sex ratio
Khategaon Dewas 922
Kalapipal Shajapur 929
Shajapur Shajapur 931
Gulana Shajapur 931
Satwas Dewas 932
GENDER COMPOSITION (SEX RATIO)
PROVISIONAL POPULATION TOTALS 163
Statement 5.47Top and bottom five tahsils according to sex ratio in Ujjain division, Urban : 2011
Top five tahsils
Tahsil District Sex ratio
Daloda Mandsaur 992
Suwasra Mandsaur 983
Jiran Neemuch 982
Malhargarh Mandsaur 979
Piploda Ratlam 975
Bottom five tahsils
Tahsil District Sex ratio
Neemuch Neemuch 903
Kalapipal Shajapur 921
Dewas Dewas 927
Khategaon Dewas 927
Satwas Dewas 933
In Indore division, Alirajpur (1,016) has registered the highest rural sex ratio whereas the
lowest is reported from Harsud (917). It is interesting to note that all the top five tahsils in the
rural area of Indore division have reported sex ratio figures in the range of above 1,000 females
per thousand males. A look at the urban areas of the division reveals that Bhavra (1,002) tahsil
is in the top position and Dhar (855) has fared the worst as shown in Statements 5.48 & 5.49.
Statement 5.48Top and bottom five tahsils according to sex ratio in Indore division, Rural : 2011
Top five tahsils
Tahsil District Sex ratio
Alirajpur Alirajpur 1,016
Jobat Alirajpur 1,007
Bhavra Alirajpur 1,005
Niwali Barwani 1,003
Jhabua Jhabua 1,003
Bottom five tahsils
Tahsil District Sex ratio
Harsud Khandwa (East Nimar) 917
Mhow Indore 932
Burhanpur Burhanpur 932
Indore Indore 940
Punasa Khandwa (East Nimar) 940
Statement 5.49Top and bottom five tahsils according to sex ratio in Indore division, Urban : 2011
Top five tahsils
Tahsil District Sex ratio
Bhavra Alirajpur 1,002
Dahi Dhar 985
Anjad Barwani 983
Gogaon Khargone (West Nimar) 974
Harsud Khandwa (East Nimar) 973
Bottom five tahsils
Tahsil District Sex ratio
Dhar Dhar 855
Mhow Indore 879
Thandla Jhabua 905
Punasa Khandwa (East Nimar) 919
Indore Indore 920
In Bhopal division, Jirapur (976) is the best performing tahsil in the rural areas while the lowest
is seen in Lateri (881) and Begamganj (881). In the urban areas, Khilchipur (968) has registered
the maximum sex ratio and the minimum is reported from Goharganj (849) as shown in
Statements 5.50 & 5.51.

164
Statement 5.50Top and bottom five tahsils according to sex ratio in Bhopal division, Rural : 2011
Top five tahsils
Tahsil District Sex ratio
Jirapur Rajgarh 976
Khilchipur Rajgarh 973
Rajgarh Rajgarh 959
Sarangpur Rajgarh 952
Pachore Rajgarh 951
Bottom five tahsils
Tahsil District Sex ratio
Lateri Vidisha 881
Begamganj Raisen 881
Sironj Vidisha 883
Badi Raisen 886
Shamshabad Vidisha 888
Statement 5.51Top and bottom five tahsils according to sex ratio in Bhopal division, Urban : 2011
Top five tahsils
Tahsil District Sex ratio
Khilchipur Rajgarh 968
Jirapur Rajgarh 965
Jawar Sehore 963
Rajgarh Rajgarh 954
Narsinghgarh Rajgarh 945
Bottom five tahsils
Tahsil District Sex ratio
Goharganj Raisen 849
Budni Sehore 873
Nasrullaganj Sehore 887
Badi Raisen 893
Udaipura Raisen 900
For Narmadapuram division, Ghoda Dongri (996) is in first place in terms of rural sex ratio
while Hoshangabad (896) has fared the worst. The urban sex ratio figures indicate that Athner
(987) has registered the highest figure and the lowest is observed in Pipariya (889) as shown in
Statements 5.52 & 5.53.
Statement 5.52Top and bottom five tahsils according to sex ratio in Narmadapuram division, Rural : 2011
Top five tahsils
Tahsil District Sex ratio
Ghoda Dongri Betul 996
Chicholi Betul 985
Shahpur Betul 984
Bhainsdehi Betul 977
Amla Betul 975
Bottom five tahsils
Tahsil District Sex ratio
Hoshangabad Hoshangabad 896
Sohagpur Hoshangabad 899
Pipariya Hoshangabad 899
Babai Hoshangabad 908
Dolariya Hoshangabad 910
Statement 5.53Top and bottom five tahsils according to sex ratio in Narmadapuram division, Urban : 2011
Top five tahsils
Tahsil District Sex ratio
Athner Betul 987
Shahpur Betul 980
Bhainsdehi Betul 962
Betul Betul 955
Multai Betul 945
Bottom five tahsils
Tahsil District Sex ratio
Pipariya Hoshangabad 889
Dolariya Hoshangabad 894
Hoshangabad Hoshangabad 915
Itarsi Hoshangabad 924
Ghoda Dongri Betul 927

GENDER COMPOSITION (SEX RATIO)
PROVISIONAL POPULATION TOTALS 165
In Jabalpur division, Ghughari (1,035) is in top position with regard to rural sex ratio whereas
Gadarwara (908) has fared the worst. In the urban areas the highest is reported from Tirodi
(1,039) and the lowest from Gadarwara (903) as shown in Statements 5.54 & 5.55. The top
five tahsils in the rural and urban areas of the division have registered sex ratio figures in the
range of above 1,000 females per thousand males.
Statement 5.54Top and bottom five tahsils according to sex ratio in Jabalpur division, Rural : 2011
Top five tahsils
Tahsil District Sex ratio
Ghughari Mandla 1,035
Balaghat Balaghat 1,034
Katangi Balaghat 1,033
Baihar Balaghat 1,030
Paraswada Balaghat 1,030
Bottom five tahsils
Tahsil District Sex ratio
Gadarwara Narsimhapur 908
Tendukheda Narsimhapur 917
Jabalpur Jabalpur 918
Kareli Narsimhapur 919
Gotegaon Narsimhapur 921
Statement 5.55Top and bottom five tahsils according to sex ratio in Jabalpur division, Urban : 2011
Top five tahsils
Tahsil District Sex ratio
Tirodi Balaghat 1,039
Paraswada Balaghat 1,030
Ghansaur Seoni 1,016
Kirnapur Balaghat 1,012
Baihar Balaghat 1,012
Bottom five tahsils
Tahsil District Sex ratio
Gadarwara Narsimhapur 903
Jabalpur Jabalpur 911
Patan Jabalpur 914
Panagar Jabalpur 917
Tendukheda Narsimhapur 917

166
CHILD SEX RATIO5.17 CHILD SEX RATIO OF INDIA Child sex ratio is defined as the number of females per thousand males in the age bracket of
0-6 years. A five decade analysis, from 1961 to 2011, reveals that the child sex ratio at the
national level has witnessed a sharp decline across all three segments, namely total, rural and
urban child sex ratio. From 1961-2011, the decline in total child sex ratio is 62 points (976 to
914), for rural child sex ratio is 38 points (957 to 919) and for urban child sex ratio is 49 points
(951 to 902). The figures across all three segments for the period 1961 to 2011 can be seen in
Statement 5.56
Statement 5.56Child sex ratio of India : 1961 to 2011
Census year Total Rural Urban
1961 976 957 951
1971 964 968 948
1981 962 963 959
1991 945 948 935
2001 927 934 906
2011 914 919 902
5.18 CHILD SEX RATIO OF INDIA AND STATES/UTS The child sex ratio at the national level is 914 females per thousand males; whereas the rural
child sex ratio stands at 919 and the urban child sex ratio is 902. Statement 5.57 shows the
total, rural and urban child sex ratio calculated for all the states/UTs in the country as per
provisional Census 2011 figures.
Madhya Pradesh has registered a total child sex ratio of 912 which is 2 points below the
national average. The state has recorded a rural child sex ratio of 917 females per thousand
males; which is 2 points lower than its national counterpart. On the other hand, the urban child
sex ratio for the state is 895 which is 7 points below the national figure recorded for urban child
sex ratio. A comparitive analysis of the figures at the national level shows that Madhya Pradesh
ranks twenty-third in terms of both rural and urban child sex ratio among all the States/UTs.

GENDER COMPOSITION (CHILD SEX RATIO)
PROVISIONAL POPULATION TOTALS 167
Statement 5.57
Child sex ratio of India and States/UTs by residence : 2011India/States/UTs Total Rural Urban
India 914 919 902
Jammu & Kashmir 859 860 854
Himachal Pradesh 906 909 878
Punjab 846 843 851
Chandigarh 867 862 867
Uttarakhand 886 894 864
Haryana 830 831 829
NCT of Delhi 866 809 868
Rajasthan 883 886 869
Uttar Pradesh 899 904 879
Bihar 933 935 906
Sikkim 944 952 917
Arunachal Pradesh 960 964 944
Nagaland 944 932 979
Manipur 934 929 945
Mizoram 971 966 978
Tripura 953 955 945
Meghalaya 970 972 957
Assam 957 957 955
West bengal 950 952 943
Jharkhand 943 952 904
Orissa 934 939 909
Chhattisgarh 964 972 932
Madhya Pradesh 912 917 895
Gujarat 886 906 852
Daman & Diu # 909 925 903
Dadra & Nagar Haveli # 924 961 878
Maharashtra 883 880 888
Andhra Pradesh 943 942 946
Karnataka 943 945 941
Goa 920 924 917
Lakshadweep # 908 888 915
Kerala 959 960 958
Tamil nadu 946 937 957
Puducherry # 965 957 969
A & N Islands # 966 975 947

168
5.18.1 Top and bottom five States/UTs by child sex ratio, Total, Rural and Urban : 2011
The total child sex ratio at the national level stands at 914 while the figures registered in the
top five States/UTs of the country greatly exceed the national average. Mizoram has reported
the highest child sex ratio of 971 while Haryana has fared the worst with a child sex ratio of 830
as shown in Statement 5.58.
Statement 5.58Top and bottom five States/UTs by child sex ratio, Total : 2011
Top five State/UTs Child sex ratio
Mizoram 971
Meghalaya 970
A & N Islands 966
Puducherry 965
Chhattisgarh 964
Bottom five State/UTs Child sex ratio
Haryana 830
Punjab 846
Jammu & Kashmir 859
NCT of Delhi 866
Chandigarh 867
From the perspective of child sex ratio in rural India, the top five States/UTs include Andaman
and Nicobar Islands (975), Meghalaya (972), Chhattisgarh (972), Mizoram (966) and Arunachal
Pradesh (964); all of which have registered figures higher than the aggregate national rural
child sex ratio of 919. The bottom five states/union territories include NCT of Delhi (809),
Haryana (831), Punjab (843), Jammu and Kashmir (860) and Chandigarh (862) as shown in
Statement 5.59.
Statement 5.59Top and bottom five States/UTs by child sex ratio, Rural : 2011
Top five State/UTs Child sex ratio
A & N Islands 975
Meghalaya 972
Chhattisgarh 972
Mizoram 966
Arunachal Pradesh 964
Bottom five State/UTs Child sex ratio
Nct Of Delhi 809
Haryana 831
Punjab 843
Jammu & Kashmir 860
Chandigarh 862
Among the top five States/UTs in terms of urban child sex ratio are Nagaland (979), Mizoram
(978), Puducherry (969), Kerala (958) and Meghalaya (957). The States/UTs which have
recorded the lowest child sex ratio in urban India include Haryana (829), Punjab (851), Gujarat
(852), Jammu and Kashmir (854) and Uttarakhand (864) as shown in Statement 5.60.
Statement 5.60Top and bottom five States/UTs by child sex ratio, Urban : 2011
Top five State/UTs Child sex ratio
Nagaland 979
Mizoram 978
Puducherry 969
Kerala 958
Meghalaya 957
Bottom five State/UTs Child sex ratio
Haryana 829
Punjab 851
Gujarat 852
Jammu & Kashmir 854
Uttarakhand 864

GENDER COMPOSITION (CHILD SEX RATIO)
PROVISIONAL POPULATION TOTALS 169
5.19 CHILD SEX RATIO IN MADHYA PRADESHStatement 5.61 provides an overview of the child sex ratio for the state of Madhya Pradesh
across the three consecutive Censuses of 1991, 2001 and 2011 respectively. The total child sex
ratio has continuously declined from 941 in 1991 to 932 in 2001 and 912 in 2011. The figures
for rural-urban segregation at the state level indicates a sharper decline for urban Madhya
Pradesh of 36 points (931 in 1991 to 895 in 2011) vis-à-vis that observed in rural areas of 27
points (944 in 1991 to 917 in 2011).
Statement 5.61Child sex ratio : 1991 to 2011
Census year Total Rural Urban
1991 941 944 931
2001 932 939 907
2011 912 917 895
5.20 CHILD SEX RATIO OF MADHYA PRADESH AND OTHER EAG STATESAs per provisional Census 2011 figures, total child sex ratio registered among the Empowered
Action Group (EAG) states indicates that Chhattisgarh is in first position with a figure of 964
while Rajasthan has fared the worst with a child sex ratio of 883. Madhya Pradesh is in the fifth
place among the eight states recording a sex ratio of 912 females per thousand males in the
age group of 0-6 years.
The rural and urban child sex ratio data for the EAG states can be studied from Statement 5.62.
Chhattisgarh has secured the first rank in regard to both rural (972) and urban (932) child sex
ratio. The lowest figure for rural child sex ratio is reported from Rajasthan (886) and for urban
child sex ratio the lowest is registered in Uttarakhand (864). Madhya Pradesh is ranked fifth in
terms of rural child sex ratio (917) and fourth in regard to urban child sex ratio (895). Statement 5.62Child sex ratio of EAG states : 2011
State/UTs Child sex ratioTotal Rural Urban
India
Chhattisgarh 964 972 932
Orissa 934 939 909
Uttarakhand 886 894 864
Jharkhand 943 952 904
Madhya Pradesh 912 917 895
Rajasthan 883 886 869
Bihar 933 935 906
Uttar Pradesh 899 904 879810
850
890
930
970
1010
Chha
tisg
arh
Ori
ssa
Utt
arak
hand
Jhar
khan
d
Mad
hya
Prad
esh
Raja
stha
n
Biha
r
Utt
ar P
rade
sh
Child
sex
rati
o
EAG States
Rural Urban
Fig. 5.18 Child sex ratio of EAG states, Rural-Urban

170
5.21 CHILD SEX RATIO OF MADHYA PRADESH AND NEIGHBOURING STATESStatement 5.63 gives an overview of the performance of Madhya Pradesh, across all three
segments for child sex ratio, when compared with its bordering states of Chhattisgarh,
Rajasthan, Maharashtra, Gujarat and Uttar Pradesh. Chhattisgarh is the best performing state
recording the highest child sex ratio in both rural (972) and urban (932). Maharashtra has fared
the worst in regard to rural child sex ratio (880) whereas Gujarat is the lowest ranked in urban
child sex ratio (852). Madhya Pradesh has secured the second rank both for rural child sex ratio
(917) and urban child sex ratio (895).
Statement 5.63Child sex ratio of neighbouring states : 2011
780
830
880
930
980
Chha
tisg
arh
Mad
hya
Prad
esh
Raja
stha
n
Mah
aras
htra
Guj
arat
Utt
ar P
rade
sh
Child
sex
rati
o
Neighbouring states
Rural Urban
Fig. 5.19 Child sex ratio of EAG states, Rural-Urban State/UTs Child sex ratioTotal Rural Urban
Chhattisgarh 964 972 932
Madhya Pradesh 912 917 895
Rajasthan 883 886 869
Maharashtra 883 880 888
Gujarat 886 906 852
Uttar Pradesh 899 904 879
5.22 RANKING OF DISTRICTS BY CHILD SEX RATIO, RURAL Statement 5.64 and Figure 5.20 depicts the ranking of the districts by child sex ratio for rural
Madhya Pradesh. It is seen that Alirajpur has progressed to rank 1 in 2011 vis-à-vis rank 5 in
2001. The second position is secured by Mandla which is an improvement from rank 3 secured
by the district in 2001. The worst two districts as per provisional 2011 figures are reported as
Bhind at rank 49 and Morena in rank 50.
5.23 RANKING OF DISTRICTS BY CHILD SEX RATIO, URBANFor child sex ratio in urban Madhya Pradesh, Dindori has secured rank 1, which has remained
unchanged since Census 2001 and Chhindwara has followed in second position which is an
improvement from rank 9 secured by the district in 2001. Two districts which have fared the
worst in terms of urban child sex ratio are reported as Gwalior at rank 49, which is a further
decline from its rank 48 in 2001, and Morena at rank 50 which is a drop from rank 49 secured
in 2001. Dindori is the only district whose rank remained unchanged from 2001 to 2011 since
it secured the top-most rank in both the years as shown in Statement 5.65 and Figure 5.21.

GENDER COMPOSITION (CHILD SEX RATIO)
PROVISIONAL POPULATION TOTALS 171
Statement 5.64Ranking of districts by child sex ratio, Rural : 2001 and 2011
Fig. 5.20 Child sex ratio in districts, ruralRank in
2011
District Name Child sex ratio Rank in
20012011 2001
Madhya Pradesh 917 939
1 Alirajpur 973 984 5
2 Mandla 970 988 3
3 Dindori 969 991 1
4 Balaghat 967 971 9
5 Seoni 959 985 4
6 Anuppur 952 991 2
7 Chhindwara 951 965 13
8 Betul 951 977 7
9 Shahdol 951 981 6
10 Umaria 950 962 15
11 Barwani 947 975 8
12 Katni 941 960 16
13 Khargone (West Nimar) 936 968 11
14 Jhabua 935 971 10
15 Khandwa (East Nimar) 934 948 20
16 Damoh 933 937 30
17 Ratlam 931 965 12
18 Raisen 930 939 26
19 Jabalpur 928 945 23
20 Harda 925 924 41
21 Burhanpur 924 939 27
22 Sagar 923 932 36
23 Vidisha 923 946 22
24 Mandsaur 923 946 21
25 Singrauli 922 963 14
26 Ujjain 921 950 18
27 Neemuch 920 935 33
28 Bhopal 919 916 44
29 Dhar 918 950 19
30 Rajgarh 918 942 24
31 Hoshangabad 917 932 37
32 Ashoknagar 917 935 34
33 Shajapur 913 937 31
34 Sidhi 912 954 17
35 Satna 910 935 32
36 Dewas 910 939 25
37 Panna 910 938 29
38 Guna 907 933 35
39 Narsimhapur 907 922 42
40 Sehore 905 928 40
41 Indore 900 929 39
42 Chhatarpur 898 920 43
43 Shivpuri 892 908 46
44 Tikamgarh 888 913 45
45 Sheopur 888 938 28
46 Rewa 885 930 38
47 Datia 851 875 47
48 Gwalior 836 865 48
49 Bhind 832 834 50
50 Morena 826 839 49
700 800 900 1,000 1,100
Alirajpur
Mandla
Dindori
Balaghat
Seoni
Anuppur
Chhindwara
Betul
Shahdol
Umaria
Barwani
Katni
Khargone (West …
Jhabua
Khandwa (East Nimar)
Damoh
Ratlam
Raisen
Jabalpur
Harda
Burhanpur
Sagar
Vidisha
Mandsaur
Singrauli
Ujjain
Neemuch
Bhopal
Dhar
Rajgarh
Hoshangabad
Ashoknagar
Shajapur
Sidhi
Satna
Dewas
Panna
Guna
Narsimhapur
Sehore
Indore
Chhattarpur
Shivpuri
Tikamgarh
Sheopur
Rewa
Datia
Gwalior
Bhind
Morena
Child Sex Ratio
Dis
tric
ts
2001 2011

172
Statement 5.65Ranking of districts by child sex ratio, urban : 2001 and 2011
700 750 800 850 900 950 1,000
Dindori
Chhindwara
Alirajpur
Betul
Ratlam
Sagar
Umaria
Balaghat
Shahdol
Vidisha
Damoh
Khandwa (East Nimar)
Jhabua
Mandla
Bhopal
Ujjain
Raisen
Mandsaur
Singrauli
Shajapur
Burhanpur
Sehore
Anuppur
Neemuch
Panna
Rajgarh
Seoni
Jabalpur
Harda
Dewas
Khargone (West Nimar)
Ashoknagar
Hoshangabad
Katni
Satna
Dhar
Sheopur
Indore
Barwani
Sidhi
Guna
Chhatarpur
Tikamgarh
Shivpuri
Rewa
Narsimhapur
Datia
Bhind
Gwalior
Morena
Chiild Sex Ratio
Dis
tric
ts
2001 2011
Rank in
2011
District Name Child sex ratio Rank in
20012011 2001
Madhya Pradesh 895 907
1 Dindori 981 962 1
2 Chhindwara 945 932 9
3 Alirajpur 940 951 2
4 Betul 938 922 22
5 Ratlam 932 931 10
6 Sagar 929 929 11
7 Umaria 922 938 5
8 Balaghat 920 941 4
9 Shahdol 920 914 33
10 Vidisha 919 929 12
11 Damoh 918 923 20
12 Khandwa (East Nimar) 917 935 7
13 Jhabua 917 921 24
14 Mandla 916 907 36
15 Bhopal 915 928 14
16 Ujjain 914 914 32
17 Raisen 914 924 18
18 Mandsaur 914 945 3
19 Singrauli 913 918 26
20 Shajapur 912 926 16
21 Burhanpur 911 924 19
22 Sehore 911 925 17
23 Anuppur 911 938 6
24 Neemuch 910 921 23
25 Panna 910 877 46
26 Rajgarh 907 917 27
27 Seoni 907 895 43
28 Jabalpur 906 916 29
29 Harda 900 929 13
30 Dewas 899 903 38
31 Khargone (West Nimar) 898 918 25
32 Ashoknagar 898 917 28
33 Hoshangabad 895 910 34
34 Katni 895 908 35
35 Satna 892 914 31
36 Dhar 890 901 41
37 Sheopur 889 880 45
38 Indore 888 897 42
39 Barwani 888 933 8
40 Sidhi 885 923 21
41 Guna 881 916 30
42 Chhatarpur 878 901 40
43 Tikamgarh 878 927 15
44 Shivpuri 872 901 39
45 Rewa 871 905 37
46 Narsimhapur 868 886 44
47 Datia 854 869 47
48 Bhind 844 827 50
49 Gwalior 828 843 48
50 Morena 822 830 49
Fig. 5.21 Child sex ratio in districts, urban

GENDER COMPOSITION (CHILD SEX RATIO)
PROVISIONAL POPULATION TOTALS 173
Change in rural child sex ratio : 1991-01 and 2001-11 Change in urban child sex ratio : 1991-01 and 2001-11
6
1
5
6 10
29
37
7
2
19
18
27
11
52 51
66
17
11
11
13
33
61
24
62
22
20
24
53
24
18
22
28
20
33
21
27
30
27
51
41
20
12
13
43
19
37
29
43
16
13
0
9
9
0
13
6
1
16
5
4
29
12
5
21
8
33
23
20
11
10
22
18
10
19
35
34
15
14
9
10
17
14
4
31
45
49
18
10
1911
13
38
16
15
27
11
13
29
15
13
1
7
7
8
6
5
5
4
1
5
86
0
7
2
5
11
12
11
4
1
10
7
11
19
7
4
22
4
1
10
11
8
1231
18
5
11
7
12
12
1318
25
20
2216
24
23
12
9
4
9
4
14
16
26
22
32
1
32 26
25
18
2
14
29
3
23
26
45
28
15
23
50
29
24
24
41
13
22
23
28
25
30
34
15
17
18
19
42
12
15
29
39
29
11
36
15
24
1991-2001
2001-2011
1991-2001
2001-2011
NUMBER OF FEMALES PER 1000 MALES
41 AND ABOVE
26 - 40
11 - 25
10 AND BELOW
DECREASE INCREASE
5 AND BELOW
6 - 10
11 AND ABOVE
0
NUMBER OF FEMALES PER 1000 MALES
31 AND ABOVE
21 - 30
11 - 20
10 AND BELOW
DECREASE INCREASE
5 AND BELOW
6 - 10
11 AND ABOVE

174
5.24 TOP AND BOTTOM FIVE DISTRICTS BY CHILD SEX RATIO, TOTAL, RURAL AND URBANStatement 5.66 provides an overview of the top/bottom five districts of the state in terms of
total child sex ratio. In the context of total child sex ratio, it has been observed that the top five
districts have reported figures higher than the state average of 912. Alirajpur has registered the
highest child sex ratio at 971 followed by Dindori (970) whereas the low ranked districts include
Morena (825) and Gwalior (832) in ascending order.
Statement 5.66Top and bottom five districts by child sex ratio, Total : 2011
Top five districts
District Division Child sex ratio
Alirajpur Indore 971
Dindori Shahdol 970
Mandla Jabalpur 965
Balaghat Jabalpur 961
Seoni Jabalpur 954
Bottom five districts
District Division Child sex ratio
Morena Chambal 825
Gwalior Gwalior 832
Bhind Chambal 835
Datia Gwalior 852
Rewa Rewa 883
The top five districts in terms of rural child sex ratio include Alirajpur (973) in first position
followed by Mandla (970), Dindori (969) is seen in middle position while Balaghat (967) and
Seoni (959) have secured the fourth and fifth positions respectively. The rural districts with the
lowest child sex ratio are Morena (826), Bhind (832), Gwalior (836), Datia (851) and Rewa (885)
as shown in Statement 5.67.Statement 5.67Top and bottom five districts by child sex ratio, Rural : 2011
Top five districts
District Division Child sex ratio
Alirajpur Indore 973
Mandla Jabalpur 970
Dindori Shahdol 969
Balaghat Jabalpur 967
Seoni Jabalpur 959
Bottom five districts
District Division Child sex ratio
Morena Chambal 826
Bhind Chambal 832
Gwalior Gwalior 836
Datia Gwalior 851
Rewa Rewa 885
Data for urban child sex ratio in Madhya Pradesh reveals that the best performing districts
include Dindori (981) in first position followed by Chhindwara (945), Alirajpur (940), Betul (938)
and Ratlam (932). The bottom five districts with lowest child sex ratio figures include Morena
(822), Gwalior (828), Bhind (844), Datia (854) and Narsimhapur (868) as shown in Statement
5.68.Statement 5.68Top and bottom five districts by child sex ratio, Urban : 2011
Top five districts
District Division Child sex ratio
Dindori Shahdol 981
Chhindwara Jabalpur 945
Alirajpur Indore 940
Betul Narmadapuram 938
Ratlam Ujjain 932
Bottom five districts
District Division Child sex ratio
Morena Chambal 822
Gwalior Gwalior 828
Bhind Chambal 844
Datia Gwalior 854
Narsimhapur Jabalpur 868

GENDER COMPOSITION (CHILD SEX RATIO)
PROVISIONAL POPULATION TOTALS 175
GUNAASHOKNAGAR
SAGARRAJGARH
RAISEN
CHHATARPUR
DAMOH
JABALPUR
PANNA
MORENA
SHEOPUR
BHIND
GWALIORDATIA
SHIVPURI
SATNA
REWA
SIDHI SINGRAULI
KATNI
UMARIA
SHAHDOL
ANUPPUR
MANDLA
DINDORI
BALAGHAT
HOSHANGABAD
NARSIMHAPUR
SEONICHHINDWARA
VIDISHA
BETUL
HARDAALIRAJPUR
JHABUA
DHAR
(WEST NIMAR)(EAST NIMAR)
INDOREDEWAS
UJJAINRATLAM
NEEMUCH
MANDSAUR
SHAJAPUR
SEHORE
TIKAMGARH
BARWANI
BURHANPUR
BHOPAL
KHARGONEKHANDWA 951
923
892
951967
898
936
930
918
959
910
970
933
934
910
923
907
885
910
917
905
888
921
918
913
922
826
969
923
947
888
951
931
907
928
917
941
832
912
950
920
836
952
900935
973
924
925
851
919
40 0 12040 80
KILOMETRES
MADHYA PRADESH
RA
J
A
S
T
H
A
NU T
TA
R
P RA
DE
SH
GU
JA
RA
T
M
AH
A RA
SH T
R A
CH
HA
TT
IS
GA
RH
INDIA
BOUNDARIES : - STATE..............................
DISTRICT.........................
DIVISION.........................
RURAL CHILD SEX RATIO 2011
NUMBER OF FEMALES PER 1000 MALES
951 AND ABOVE
926 - 950
901 - 925 State 917
876 - 900
875 AND BELOW
GUNAASHOKNAGAR
SAGARRAJGARH
RAISEN
CHHATARPUR
DAMOH
JABALPUR
PANNA
MORENA
SHEOPUR
BHIND
GWALIORDATIA
SHIVPURI
SATNA
REWA
SIDHI SINGRAULI
KATNI
UMARIASHAHDOL
ANUPPUR
MANDLA
DINDORI
BALAGHAT
HOSHANGABAD
NARSIMHAPUR
SEONICHHINDWARA
VIDISHA
BETUL
HARDAALIRAJPUR
JHABUA
DHAR
(WEST NIMAR)(EAST NIMAR)
INDORE DEWAS
UJJAINRATLAM
NEEMUCH
MANDSAUR
SHAJAPUR
SEHORE
TIKAMGARH
BARWANI
BURHANPUR
BHOPAL
KHARGONEKHANDWA
945
929
872
938920
878
898
914
890
907
892
916
918
917
899
919
881
871
911
910
895
889
914
907
912
913
822
981
914
888
878
920932
868
906
898
895
844
885
922
910
911
828
888917
911
940900
854
915
40 0 12040 80
KILOMETRES
MADHYA PRADESH
RA
J
A
S
T
H
A
NU T
TA
R
P RA
DE
SH
GU
JA
RA
T
M
AH
A RA
SH T
R A
CH
HA
TT
IS
GA
RH
INDIA
BOUNDARIES : - STATE..............................
DISTRICT.........................
DIVISION.........................
URBAN CHILD SEX RATIO 2011
NUMBER OF FEMALES PER 1000 MALES
926 AND ABOVE
901 - 925
876 - 900 State 895
875 AND BELOW

176
5.25 CHILD SEX RATIO IN TAHSILS OF MADHYA PRADESHThe top and bottom five tahsils in terms of child sex ratio for the rural areas can be studied
from Statement 5.69 It is seen that Kurai is the best performing tahsil with the highest child
sex ratio (1,008) followed by Katangi (1,000) in second position whereas the tahsils which have
fared the worst include Gormi (798) and Morena (804). It is observed that among the top five
tahsils in the rural areas, two belong to Balaghat district. Among the bottom five tahsils in rural
areas, two tahsils belong to Bhind district.
Statement 5.69Top and bottom five tahsils by child sex ratio, rural : 2011
Top five tahsilsTahsil District Child sex ratio
Kurai Seoni 1,008
Katangi Balaghat 1,000
Khairlanji Balaghat 984
Ghughari Mandla 982
Pandhurna Chhindwara 981
Bottom five tahsilsTahsil District Child sex ratio
Gormi Bhind 798
Morena Morena 804
Seondha Datia 811
Gohad Bhind 813
Gwalior Gwalior 823
The urban child sex ratio data for the tahsils of the state indicates that Athner (1,071) is in
first position followed by Harrai (1,055) in second place and on the other hand the low ranked
tahsils are Bhander (775) and Thikri (796). The top and bottom five tahsils in regard to the
urban sex ratio figures are as seen in Statement 5.70.
Statement 5.70Top and bottom five tahsils by child sex ratio, urban : 2011
Top five tahsilsTahsil District Child sex ratio
Athner Betul 1,071
Harrai Chhindwara 1,055
Jaisinghnagar Shahdol 1,034
Kotar Satna 1,031
Jabera Damoh 1,023
Bottom five tahsilsTahsil District Child sex ratio
Bhander Datia 775
Thikri Barwani 796
Khargapur Tikamgarh 800
Mehgaon Bhind 804
Ambah Morena 806
5.25.1 Distribution of tahsils in different ranges of child sex ratio, rural : 2001 and 2011
Statement 5.71 gives an overview of the number of tahsils in the rural areas and their
corresponding range of child sex ratio for 2001 and 2011. There is a slight decrease in the
absolute rural population from 8,443,744 to 8,132,745. For 2001, the maximum number of
tahsils (171) have reported a child sex ratio in the range 900-949 which houses 49.6 percent
of the rural population. Similarly in 2011 the maximum number of tahsils (202) have reported
child sex ratio figures in the range of 900-949 where 58.8 percent of the rural population
resides. The number of tahsils which have recorded sex ratio in the favourable range of above
1000 females per thousand males has shown a decrease from 12 in 2001 to 2 in 2011.

GENDER COMPOSITION (CHILD SEX RATIO)
PROVISIONAL POPULATION TOTALS 177
Statement 5.71Distribution of tahsils by ranges of child sex ratio for rural areas : 2001 and 2011
Note : The population figures for Census 2001 have been recast as per Census 2011 jurisdiction of the districts/tahsils.
Range of child sex ratio
2001 2011No.of tahsil Share of child population No.of tahsil Share of child population
Absolute Percent Absolute Percent
Total 342 8,443,744 100.0 342 813,2745 100.0
< 850 8 342,315 4.1 18 542,901 6.7
850-899 22 476,974 5.6 64 1,456,406 17.9
900-949 171 4,188,348 49.6 202 4,780,119 58.8
950-999 129 3,177,651 37.6 56 1,329,213 16.3
>1000 12 258,456 3.1 2 24,106 0.3
5.25.2 Distribution of tahsils in different ranges of child sex ratio, urban : 2001 and 2011
The distribution of the tahsils in the urban areas as per their corresponding child sex ratio
range is as shown in Statement 5.72 for 2001 and 2011. There has been an increase in tahsils
with urban population from 261 in 2001 to 282 in 2011 along with an increase in the urban
population from 2,338,740 in 2001 to 2,415,550 in 2011. In 2001, the maximum number of
tahsils (135) have reported child sex ratio in the range 900-949 which houses 59.7 percent of
the urban population. In 2011, the maximum number of tahsils (128) correspond to the child
sex ratio in the identical range of 900-949 where 50.2 percent of the urban population resides;
however there is a decrease in the number of tahsils from 135 in 2001 to 128 in 2011. There
has been a decrease of 2 tahsils from 2001 to 2011 with child sex ratio in the favourable range
of above 1000 females per thousand males.
Statement 5.72Distribution of tahsils by ranges of child sex ratio for urban areas : 2001 and 2011
Range of child sex ratio
2001 2011No.of tahsil Share of child population No.of tahsil Share of child population
Absolute Percent Absolute Percent
Total 261 2,338,470 100.0 282 2,415,550 100.0
< 850 11 213,326 9.1 27 278,249 11.5
850-899 71 583,901 25.0 89 813,619 33.7
900-949 135 1,395,829 59.7 128 1,212,481 50.2
950-999 34 128,397 5.5 30 99,308 4.1
>1000 10 17,017 0.7 8 11,893 0.5
Note : 1. The population figures for Census 2001 have been recast as per Census 2011 jurisdiction of the districts/tahsils.
2. Out of 342 tahsils of Census 2011, there is no urban population in 60 tahsils.
3. There were no urban population in 21 recast tahsils of Census 2001.
5.26 CHILD SEX RATIO IN URBAN AGGLOMERATIONS HAVING POPUALTION EQUAL TO OR GREATER THAN ONE MILLION The child sex ratio of the four UAs with more than one million population is shown in
Statement 5.73. Highest child sex ratio is observed in Bhopal UA (915) followed by Jabalpur
(903), Indore (887) and Gwalior (824) .

178
Statement 5.73Child sex ratio of U.As having population equal to or greater than one million : 2011
S.No. U.As Child sex ratio
1 Bhopal UA 915
2 Jabalpur UA 903
3 Indore UA 887
4 Gwalior UA 824
5.27 CHILD SEX RATIO IN URBAN AGGLOMERATIONS HAVING POPULATION EQUAL TO OR GREATER THAN ONE LAKH Statement 5.74 presents the child sex ratio of fourteen such UAs which have more than one
lakh population. Highest child sex ratio is observed in Chhindwara UA (945) whereas the
lowest child sex ratio is recorded in Gwalior UA (824).
Statement 5.74Child sex ratio of U.As having population equal to or greater than one lakh : 2011
S.No. Name of Urban Agglomeration Child sex ratio S.No. Name of Urban Agglomeration Child sex ratio
1 Chhindwara UA 945 8 Sehore UA 908
2 Itarsi UA 930 9 Jabalpur UA 903
3 Sagar UA 929 10 Khargone UA 896
4 Ratlam UA 922 11 Indore UA 887
5 Bhopal UA 915 12 Satna UA 873
6 Neemuch UA 915 13 Chhatarpur UA 855
7 Damoh UA 912 14 Gwalior UA 824
5.28 CHILD SEX RATIO IN CITIES HAVING POPULATION EQUAL TO OR GREATER THAN ONE LAKH Child sex ratio in the thirty two cities recording a population of more than one lakh is given in
Statement 5.75. Highest child sex ratio is seen in Chhindwara (M) of 946 whereas the lowest
child sex ratio is recorded in Morena (M) registering 807.
Statement 5.75Child sex ratio of cities having population equal to or greater than one lakh : 2011
S.No. Name of City District Child sex ratio S.No. Name of City District Child sex ratio
1 Chhindwara Chhindwara 946 11 Sehore Sehore 907
2 Sagar Sagar 924 12 Betul Betul 907
3 Ratlam Ratlam 922 13 Khargone Khargone (West Nimar) 906
4 Ujjain Ujjain 921 14 Seoni Seoni 905
5 Burhanpur Burhanpur 921 15 Khandwa Khandwa (East Nimar) 902
6 Bhopal Bhopal 917 16 Jabalpur Jabalpur 901
7 Singrauli Singrauli 915 17 Dewas Dewas 901
8 Damoh Damoh 915 18 Mandsaur Mandsaur 898
9 Neemuch Neemuch 914 19 Nagda Ujjain 893
10 Vidisha Vidisha 913 20 Murwara (Katni) Katni 892

GENDER COMPOSITION (CHILD SEX RATIO)
PROVISIONAL POPULATION TOTALS 179
S.No. Name of City District Child sex ratio S.No. Name of City District Child sex ratio
21 Indore Indore 886 27 Datia Datia 864
22 Pithampur Dhar 880 28 Chhatarpur Chhatarpur 859
23 Shivpuri Shivpuri 879 29 Rewa Rewa 846
24 Guna Guna 877 30 Bhind Bhind 838
25 Satna Satna 873 31 Gwalior Gwalior 827
26 Hoshangabad Hoshangabad 868 32 Morena Morena 807
5.29 CHILD SEX RATIO IN MUNICIPAL CORPORATIONS OF MADHYA PRADESHThe best performing municipal corporations in the state, which have registered the highest
child sex ratio figures include Sagar (924) followed by Ratlam (922) and Ujjain (921) whereas
the low ranked municipal corporations in ascending order are Gwalior (827), Rewa (846) and
Satna (873) as shown in Statement 5.76.
Statement 5.76Child sex ratio of Municipal Corporations : 2011
S.No. Municipal Corporation Child sex ratio S.No. Municipal Corporation Child sex ratio
1 Sagar 924 8 Jabalpur 901
2 Ratlam 922 9 Dewas 901
3 Ujjain 921 10 Katni 892
4 Burhanpur 921 11 Indore 886
5 Bhopal 917 12 Satna 873
6 Singrauli 915 13 Rewa 846
7 Khandwa (East Nimar) 902 14 Gwalior 827
5.30 TOP AND BOTTOM FIVE MUNICIPALITIES BY CHILD SEX RATIO HAVING POPULATION EQUAL TO OR GREATER THAN ONE LAKH The maximum child sex ratio is reported from Chhindwara (946), Damoh (915), Neemuch (914),
Vidisha (913) and Betul (907) among the municipalities having population equal to or greater
than one lakh in the state. The bottom five municipalities in ascending order are reported as
Morena (807), Bhind (838), Chhatarpur (859), Datia (864) and Hoshangabad (868) as shown in
Statement 5.77.
Statement 5.77Top and bottom five Municipalities by child sex ratio : 2011
Top five Municipalities
Municipality District Child sex ratio
Chhindwara Chhindwara 946
Damoh Damoh 915
Neemuch Neemuch 914
Vidisha Vidisha 913
Sehore Sehore 907
Bottom five Municipalities
Municipality District Child sex ratio
Morena Morena 807
Bhind Bhind 838
Chhatarpur Chhatarpur 859
Datia Datia 864
Hoshangabad Hoshangabad 868

180
5.31 DIVISION-WISE ANALYSIS OF CHILD SEX RATIOThe division wise child sex ratio can be studied from Statements 5.78 to 5.80 which lists the
total, rural and urban child sex ratio respectively. From the perspective of total child sex ratio,
Shahdol is the best performing division which reported a child sex ratio of 951 followed by
Jabalpur in second position recording 939 whereas the worst performing divisions include
Chambal reporting a figure of 840 and Gwalior registering 875.
A similar trend is observed in the context of rural Madhya Pradesh where Shahdol is the top
ranked division at 956 followed by Jabalpur in second place at 948 while the bottom two
divisions include Chambal at 840 and Gwalior registering 885 as shown in Statement 5.79.
The figures reported in the urban areas reveal that Shahdol division is in first position with child
sex ratio of 921 followed by Bhopal in second rank at 914 and on the other hand the worst
performing divisions are Chambal at 839 and Gwalior at 850 as shown in Statement 5.80.
Statement 5.78 Child sex ratio of divisions, Total : 2011
Division Child sex ratio
Shahdol 951
Jabalpur 939
Narmadapuram 930
Indore 923
Ujjain 918
Bhopal 917
Sagar 909
Rewa 902
Gwalior 875
Chambal 840
780
810
840
870
900
930
960
Shah
dol
Jaba
lpur
Nar
mad
apur
am
Indo
re
Ujja
in
Bhop
al
Saga
r
Rew
a
Gw
alio
r
Cham
bal
Child
sex
rat
io
Divisions
Fig. 5.22 Child sex ratio of divisions, Total
Statement 5.79Child sex ratio of divisions, Rural : 2011
Fig. 5.23 Child sex ratio of divisions, Rural Division Child sex ratio
Shahdol 956
Jabalpur 948
Narmadapuram 935
Indore 933
Ujjain 919
Bhopal 919
Sagar 910
Rewa 904
Gwalior 885
Chambal 840
780
810
840
870
900
930
960
Shah
dol
Jaba
lpur
Nar
mad
apur
am
Indo
re
Ujja
in
Bhop
al
Saga
r
Rew
a
Gw
alio
r
Cham
bal
Child
sex
rat
io
Divisions

GENDER COMPOSITION (CHILD SEX RATIO)
PROVISIONAL POPULATION TOTALS 181
Statement 5.80Child sex ratio of divisions, Urban : 2011
Division Child sex ratio
Shahdol 921
Bhopal 914
Ujjain 913
Narmadapuram 911
Jabalpur 910
Sagar 906
Indore 894
Rewa 889
Gwalior 850
Chambal 839
780
810
840
870
900
930
Shah
dol
Bhop
al
Ujja
in
Nar
mad
apur
am
Jaba
lpur
Saga
r
Indo
re
Rew
a
Gw
alio
r
Cham
bal
Child
sex
rat
io
Divisions
Fig. 5.24 Child sex ratio of divisions, Urban
5.32 DIVISION-WISE CHILD SEX RATIO OF DISTRICTSStatements 5.81 to 5.90 gives an overview of the performance of the districts across the
divisions of the state in terms of the rural and urban child sex ratio figures. For Chambal division,
Sheopur district has registered the highest rural (888) and urban (889) child sex ratio figures
whereas the lowest rural (826) and urban (822) child sex ratio figures are seen in Morena as
shwon in Statement 5.81 and Figure 5.25.
In Gwalior division, Ashoknagar is seen in top position in regard to both rural (917) and urban
(898) child sex ratio while the bottom ranked district is Gwalior which has reported lower rural
(836) and urban (828) figures as shown in Statement 5.82 and Figure 5.26.
Data from Sagar division reveals that Damoh (933) is the best performing district in terms of
rural child sex ratio while Tikamgarh (888) has fared the worst. The figures from the urban
areas indicate that Sagar (929) is in the top most position whereas Chhatarrpur (878) and
Tikamgarh (878) are seen in the bottom as shown in Statement 5.83 and Figure 5.27.
In the rural areas in Rewa division Singrauli (922) has reported the highest child sex ratio and
Rewa (885) is seen to record the least figures. The highest urban child sex ratio is observed
in Singrauli (913) and the minimum figures are reported from Rewa (871) as illustrated in
Statement 5.84 and Figure 5.28.
For Shahdol division, Dindori has registered the highest rural (969) and urban (981) child sex
ratio figures whereas Umaria (950) has reported the lowest rural child sex ratio and on the
other hand in the urban areas Anuppur (911) is seen in the bottom as depicted in Statement
5.85 and Figure 5.29.
In Ujjain division, the best performing district is Ratlam in both rural (931) and urban (932)
areas whereas Dewas has fared the worst in terms of rural (910) and urban (899) child sex ratio
as shown in Statement 5.86 and Figure 5.30.
Alirajpur has registered the highest rural (973) and urban (940) sex ratio figures in Indore
division. The least child sex ratio is observed in Indore (900) in the rural areas whereas for the
urban areas the low performing districts are Barwani (888) and Indore (888) as can be seen in
Statement 5.87 and Figure 5.31.

182
For Bhopal division, Raisen (930) has reported the highest child sex ratio in the rural areas and
the lowest is seen in Sehore (905). The best performing district in the urban areas is Vidisha
(919) whereas Sehore (911) has fared the worst as shown in Statement 5.88 and Figure 5.32.
In Narmadapuram division, Betul (951) is seen in first position in terms of rural child sex ratio
and Hoshangabad (917) is ranked at the bottom. In the urban areas, a similar patter is observed
with Betul (938) being the top ranked district and Hoshangabad (895) is seen in the lowest
position as depicted in Statement 5.89 and Figure 5.33.
Among the seven districts in Jabalpur division, Mandla (970) is seen in the first position in
terms of rural child sex ratio and Narsimhapur (907) is ranked at the bottom. In the urban areas,
Chhindwara (945) has reported the maximum child sex ratio figures whereas the minimum is
observed in Narsimhapur (868) as illustrated in Statement 5.90 and Figure 5.34.
Statement 5.81Division and district-wise rural and urban child sex ratio in Chambal division : 2011
800
820
840
860
880
900
920
Cham
bal
Div
isio
n
Sheo
pur
Bhin
d
Mor
ena
Division/District Total Rural Urban
Chambal Division 840 840 839
Sheopur 888 888 889
Bhind 835 832 844
Morena 825 826 822
Fig. 5.25 Child sex ratio of districts in Chambal division
800
820
840
860
880
900
920
Cham
bal
Div
isio
n
Sheo
pur
Bhin
d
Mor
ena
Child
Sex
rat
io
Districts
Rural Urban
800
820
840
860
880
900
920
Cham
bal
Div
isio
n
Sheo
pur
Bhin
d
Mor
ena
Child
Sex
rat
io
Districts
Rural Urban
800
820
840
860
880
900
920
Cham
bal
Div
isio
n
Sheo
pur
Bhin
d
Mor
ena
Child
Sex
rat
io
Districts
Rural Urban
Statement 5.82Division and district-wise rural and urban child sex ratio in Gwalior division : 2011
Division/District Total Rural Urban
Gwalior Division 875 885 850
Ashoknagar 914 917 898
Guna 901 907 881
Shivpuri 889 892 872
Datia 852 851 854
Gwalior 832 836 828
Fig. 5.26 Child sex ratio of districts in Gwalior division
800
820
840
860
880
900
920
Cham
bal
Div
isio
n
Sheo
pur
Bhin
d
Mor
ena
Child
Sex
rat
io
Districts
Rural Urban
800
820
840
860
880
900
920
Cham
bal
Div
isio
n
Sheo
pur
Bhin
d
Mor
ena
Child
Sex
rat
io
Districts
Rural Urban
800
820
840
860
880
900
920
Cham
bal
Div
isio
n
Sheo
pur
Bhin
d
Mor
ena
Child
Sex
rat
io
Districts
Rural Urban
820
840
860
880
900
920
Gw
alio
r D
ivis
ion
Ash
okna
gar
Gun
a
Shiv
puri
Dat
ia
Gw
alio
r

GENDER COMPOSITION (CHILD SEX RATIO)
PROVISIONAL POPULATION TOTALS 183
Statement 5.83Division and district-wise rural and urban child sex ratio in Sagar division : 2011
Division/District Total Rural Urban
Sagar Division 909 910 906
Damoh 931 933 918
Sagar 925 923 929
Panna 910 910 910
Chhatarpur 894 898 878
Tikamgarh 886 888 878
Fig. 5.27 Child sex ratio of districts in Sagar division
800
820
840
860
880
900
920
Cham
bal
Div
isio
n
Sheo
pur
Bhin
d
Mor
ena
Child
Sex
rat
io
Districts
Rural Urban
800
820
840
860
880
900
920
Cham
bal
Div
isio
n
Sheo
pur
Bhin
d
Mor
ena
Child
Sex
rat
io
Districts
Rural Urban
800
820
840
860
880
900
920
Cham
bal
Div
isio
n
Sheo
pur
Bhin
d
Mor
ena
Child
Sex
rat
io
Districts
Rural Urban
860
880
900
920
940
Saga
r D
ivis
ion
Dam
oh
Saga
r
Pann
a
Chha
tarp
ur
Tika
mga
rh
Statement 5.84Division and district-wise rural and urban child sex ratio in Rewa division : 2011
Division/District Total Rural Urban
Rewa Division 902 904 889
Singrauli 921 922 913
Sidhi 910 912 885
Satna 907 910 892
Rewa 883 885 871
Fig. 5.28 Child sex ratio of districts in Rewa division
800
820
840
860
880
900
920Ch
amba
l D
ivis
ion
Sheo
pur
Bhin
d
Mor
ena
Child
Sex
rat
io
Districts
Rural Urban
800
820
840
860
880
900
920Ch
amba
l D
ivis
ion
Sheo
pur
Bhin
d
Mor
ena
Child
Sex
rat
io
Districts
Rural Urban
800
820
840
860
880
900
920
Cham
bal
Div
isio
n
Sheo
pur
Bhin
d
Mor
ena
Child
Sex
rat
io
Districts
Rural Urban
840
860
880
900
920
940
960
Rew
a D
ivis
ion
Sing
raul
i
Sidh
i
Satn
a
Rew
aStatement 5.85Division and district-wise rural and urban child sex ratio in Shahdol division : 2011
Division/District Total Rural Urban
Shahdol Division 951 956 921
Dindori 970 969 981
Umaria 946 950 922
Shahdol 946 951 920
Anuppur 943 952 911
Fig. 5.29 Child sex ratio of districts in Shahdol division
800
820
840
860
880
900
920
Cham
bal
Div
isio
n
Sheo
pur
Bhin
d
Mor
ena
Child
Sex
rat
io
Districts
Rural Urban
800
820
840
860
880
900
920
Cham
bal
Div
isio
n
Sheo
pur
Bhin
d
Mor
ena
Child
Sex
rat
io
Districts
Rural Urban
800
820
840
860
880
900
920
Cham
bal
Div
isio
n
Sheo
pur
Bhin
d
Mor
ena
Child
Sex
rat
io
Districts
Rural Urban
880
900
920
940
960
980
1,000
1,020
Shah
dol
Div
isio
n
Din
dori
Um
aria
Shah
dol
Anu
ppur

184
Statement 5.86Division and district-wise rural and urban child sex ratio in Ujjain division : 2011
Division/District Total Rural Urban
Ujjain Division 918 919 913
Ratlam 931 931 932
Mandsaur 921 923 914
Ujjain 919 921 914
Neemuch 918 920 910
Shajapur 913 913 912
Dewas 907 910 899
Fig. 5.30 Child sex ratio of districts in Ujjain division
800
820
840
860
880
900
920
Cham
bal
Div
isio
n
Sheo
pur
Bhin
d
Mor
ena
Child
Sex
rat
io
Districts
Rural Urban
800
820
840
860
880
900
920
Cham
bal
Div
isio
n
Sheo
pur
Bhin
d
Mor
ena
Child
Sex
rat
io
Districts
Rural Urban
800
820
840
860
880
900
920
Cham
bal
Div
isio
n
Sheo
pur
Bhin
d
Mor
ena
Child
Sex
rat
io
Districts
Rural Urban
880
900
920
940
Ujja
in
Div
isio
n
Ratl
am
Man
dsau
r
Ujja
in
Nee
muc
h
Shaj
apur
Dew
as
Statement 5.87Division and district-wise rural and urban child sex ratio in Indore division : 2011
Division/District Total Rural Urban
Indore Division 923 933 894
Alirajpur 971 973 940
Barwani 940 947 888
Jhabua 934 935 917
Khargone (West Nimar) 931 936 898
Khandwa (East Nimar) 931 934 917
Burhanpur 921 924 911
Dhar 913 918 890
Indore 892 900 888
Fig. 5.31 Child sex ratio of districts in Indore division
800
820
840
860
880
900
920
Cham
bal
Div
isio
n
Sheo
pur
Bhin
d
Mor
ena
Child
Sex
rat
io
Districts
Rural Urban
800
820
840
860
880
900
920
Cham
bal
Div
isio
n
Sheo
pur
Bhin
d
Mor
ena
Child
Sex
rat
io
Districts
Rural Urban
800
820
840
860
880
900
920Ch
amba
l D
ivis
ion
Sheo
pur
Bhin
d
Mor
ena
Child
Sex
rat
io
Districts
Rural Urban
880
900
920
940
960
980
Indo
re
Div
isio
n
Alir
ajpu
r
Barw
ani
Jhab
ua
Khar
gone
(W
est …
Khan
dwa
(Eas
t …
Burh
anpu
r
Dha
r
Indo
re
Statement 5.88Division and district-wise rural and urban child sex ratio in Bhopal division : 2011
Division/District Total Rural Urban
Bhopal Division 917 919 914
Raisen 927 930 914
Vidisha 922 923 919
Rajgarh 916 918 907
Bhopal 916 919 915
Sehore 906 905 911
Fig. 5.32 Child sex ratio of districts in Bhopal division
800
820
840
860
880
900
920
Cham
bal
Div
isio
n
Sheo
pur
Bhin
d
Mor
ena
Child
Sex
rat
io
Districts
Rural Urban
800
820
840
860
880
900
920
Cham
bal
Div
isio
n
Sheo
pur
Bhin
d
Mor
ena
Child
Sex
rat
io
Districts
Rural Urban
800
820
840
860
880
900
920
Cham
bal
Div
isio
n
Sheo
pur
Bhin
d
Mor
ena
Child
Sex
rat
io
Districts
Rural Urban
880
900
920
940
960
Bhop
al
Div
isio
n
Rais
en
Vid
isha
Rajg
arh
Bhop
al
Seho
re
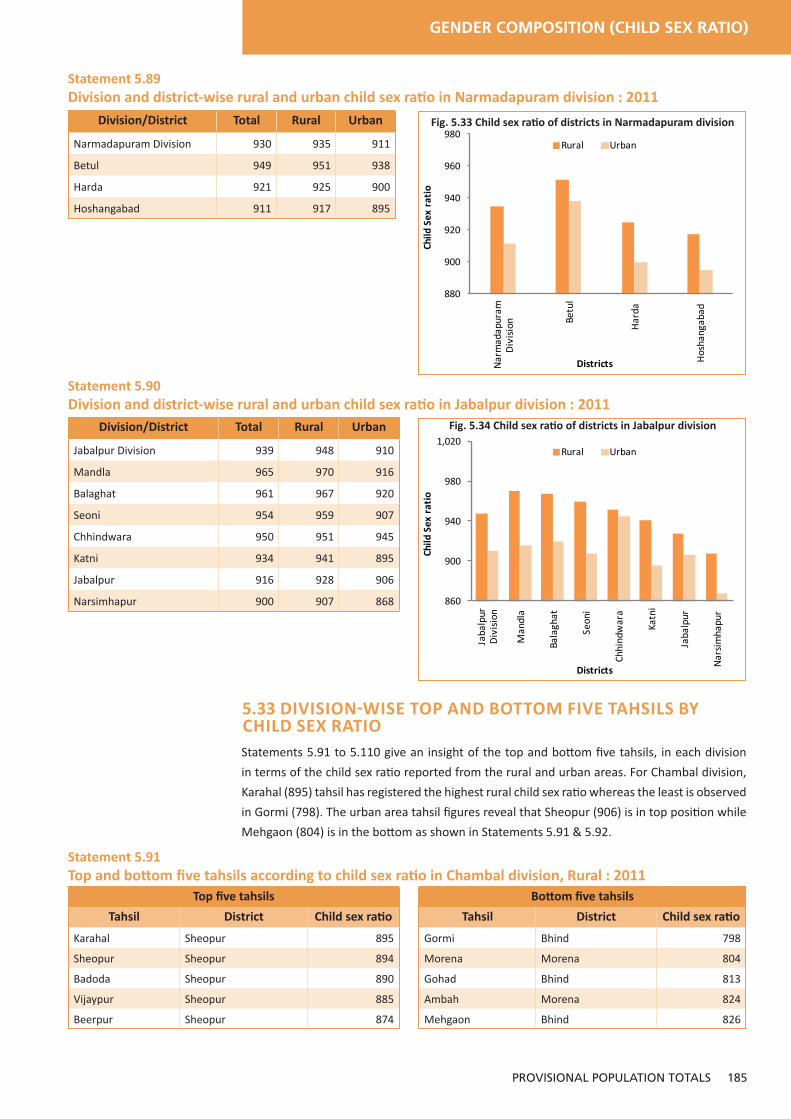
GENDER COMPOSITION (CHILD SEX RATIO)
PROVISIONAL POPULATION TOTALS 185
Statement 5.89Division and district-wise rural and urban child sex ratio in Narmadapuram division : 2011
Division/District Total Rural Urban
Narmadapuram Division 930 935 911
Betul 949 951 938
Harda 921 925 900
Hoshangabad 911 917 895
Fig. 5.33 Child sex ratio of districts in Narmadapuram division
880
900
920
940
960
980
Nar
mad
apur
am
Div
isio
n Betu
l
Har
da
Hos
hang
abad
800
820
840
860
880
900
920
Cham
bal
Div
isio
n
Sheo
pur
Bhin
d
Mor
ena
Child
Sex
rat
io
Districts
Rural Urban
800
820
840
860
880
900
920
Cham
bal
Div
isio
n
Sheo
pur
Bhin
d
Mor
ena
Child
Sex
rat
io
Districts
Rural Urban
800
820
840
860
880
900
920
Cham
bal
Div
isio
n
Sheo
pur
Bhin
d
Mor
ena
Child
Sex
rat
io
Districts
Rural Urban
Statement 5.90Division and district-wise rural and urban child sex ratio in Jabalpur division : 2011
Division/District Total Rural Urban
Jabalpur Division 939 948 910
Mandla 965 970 916
Balaghat 961 967 920
Seoni 954 959 907
Chhindwara 950 951 945
Katni 934 941 895
Jabalpur 916 928 906
Narsimhapur 900 907 868
Fig. 5.34 Child sex ratio of districts in Jabalpur division
860
900
940
980
1,020
Jaba
lpur
D
ivis
ion
Man
dla
Bala
ghat
Seon
i
Chhi
ndw
ara
Katn
i
Jaba
lpur
Nar
sim
hapu
r
800
820
840
860
880
900
920
Cham
bal
Div
isio
n
Sheo
pur
Bhin
d
Mor
ena
Child
Sex
rat
io
Districts
Rural Urban
800
820
840
860
880
900
920Ch
amba
l D
ivis
ion
Sheo
pur
Bhin
d
Mor
ena
Child
Sex
rat
io
Districts
Rural Urban
800
820
840
860
880
900
920
Cham
bal
Div
isio
n
Sheo
pur
Bhin
d
Mor
ena
Child
Sex
rat
io
Districts
Rural Urban
5.33 DIVISION-WISE TOP AND BOTTOM FIVE TAHSILS BY CHILD SEX RATIO Statements 5.91 to 5.110 give an insight of the top and bottom five tahsils, in each division
in terms of the child sex ratio reported from the rural and urban areas. For Chambal division,
Karahal (895) tahsil has registered the highest rural child sex ratio whereas the least is observed
in Gormi (798). The urban area tahsil figures reveal that Sheopur (906) is in top position while
Mehgaon (804) is in the bottom as shown in Statements 5.91 & 5.92.
Statement 5.91Top and bottom five tahsils according to child sex ratio in Chambal division, Rural : 2011
Top five tahsils
Tahsil District Child sex ratio
Karahal Sheopur 895
Sheopur Sheopur 894
Badoda Sheopur 890
Vijaypur Sheopur 885
Beerpur Sheopur 874
Bottom five tahsils
Tahsil District Child sex ratio
Gormi Bhind 798
Morena Morena 804
Gohad Bhind 813
Ambah Morena 824
Mehgaon Bhind 826

186
Statement 5.92Top and bottom five tahsils according to child sex ratio in Chambal division, Urban : 2011
Top five tahsils
Tahsil District Child sex ratio
Sheopur Sheopur 906
Mihona Bhind 905
Gormi Bhind 889
Badoda Sheopur 869
Porsa Morena 865
Bottom five tahsilsTahsil District Child sex ratio
Mehgaon Bhind 804
Ambah Morena 806
Morena Morena 807
Gohad Bhind 823
Kailaras Morena 830
A look at data from Gwalior division reveals that Raghogarh (925) and Mungaoli (925) are
the best performing tahsils in terms of rural child sex ratio while Seondha (811) is seen at the
bottom. In the urban areas, the highest child sex ratio is observed in Isagarh (935) whereas the
lowest is reported from Bhander (775) as illustrated in Statements 5.93 & 5.94.
Statement 5.93Top and bottom five tahsils according to child sex ratio in Gwalior division, Rural : 2011
Top five tahsils
Tahsil District Child sex ratio
Raghogarh Guna 925
Mungaoli Ashoknagar 925
Shadhora Ashoknagar 920
Chanderi Ashoknagar 920
Guna Guna 912
Bottom five tahsils
Tahsil District Child sex ratio
Seondha Datia 811
Gwalior Gwalior 823
Indergarh Datia 833
Bhander Datia 839
Chinour Gwalior 840
Statement 5.94Top and bottom five tahsils according to child sex ratio in Gwalior division, Urban : 2011
Top five tahsils
Tahsil District Child sex ratio
Isagarh Ashoknagar 935
Mungaoli Ashoknagar 907
Indergarh Datia 905
Chinour Gwalior 902
Kumbhraj Guna 901
Bottom five tahsils
Tahsil District Child sex ratio
Bhander Datia 775
Gwalior Gwalior 824
Narwar Shivpuri 828
Bhitarwar Gwalior 832
Karera Shivpuri 837
For Sagar division, in the rural areas Tendukheda (965) tahsil has reported the maximum child
sex ratio figures while the minimum is seen in Orchha (857). The highest urban child sex ratio
is reported from Jabera (1,023) and the lowest is in Khargapur (800) as depicted in Statements
5.95 & 5.96.
Statement 5.95Top and bottom five tahsils according to child sex ratio in Sagar division, Rural : 2011
Top five tahsils
Tahsil District Child sex ratio
Tendukheda Damoh 965
Hatta Damoh 947
Jabera Damoh 946
Patharia Damoh 940
Sagar Sagar 931
Bottom five tahsils
Tahsil District Child sex ratio
Orchha Tikamgarh 857
Prithvipur Tikamgarh 866
Niwari Tikamgarh 867
Palera Tikamgarh 875
Mohangarh Tikamgarh 875

GENDER COMPOSITION (CHILD SEX RATIO)
PROVISIONAL POPULATION TOTALS 187
Statement 5.96Top and bottom five tahsils according to child sex ratio in Sagar division, Urban : 2011
Top five tahsils
Tahsil District Child sex ratio
Jabera Damoh 1,023
Gaurihar Chhatarpur 975
Shahgarh Sagar 968
Banda Sagar 965
Amanganj Panna 962
Bottom five tahsils
Tahsil District Child sex ratio
Khargapur Tikamgarh 800
Laundi Chhatarpur 836
Baldeogarh Tikamgarh 843
Prithvipur Tikamgarh 845
Niwari Tikamgarh 852
Data from Rewa division shows that Kusmi (948) is in the top position in terms of rural child
sex ratio whereas Raipur-Karchuliyan (863) has fared the worst. In the urban areas, the tahsil
registering the highest child sex ratio figure is Kotar (1,031) and the lowest is seen in Chitrangi
(826) as shown in Statements 5.97 & 5.98.
Statement 5.97Top and bottom five tahsils according to child sex ratio in Rewa division, Rural : 2011
Top five tahsils
Tahsil District Child sex ratio
Kusmi Sidhi 948
Deosar Singrauli 931
Majhauli Sidhi 927
Rampur Baghelan Satna 927
Ramnagar Satna 926
Bottom five tahsils
Tahsil District Child sex ratio
Raipur-Karchuliyan Rewa 863
Huzur Rewa 869
Kotar Satna 873
Churhat Sidhi 876
Mangawan Rewa 876
Statement 5.98Top and bottom five tahsils according to child sex ratio in Rewa division, Urban : 2011
Top five tahsils
Tahsil District Child sex ratio
Kotar Satna 1,031
Unchahara Satna 986
Mangawan Rewa 968
Majhgawan Satna 967
Semaria Rewa 932
Bottom five tahsils
Tahsil District Child sex ratio
Chitrangi Singrauli 826
Gurh Rewa 830
Huzur Rewa 850
Nagod Satna 852
Naigarhi Rewa 855
For the rural areas of Shahdol division, Pali (973) has registered the highest child sex ratio while
the lowest is observed in Beohari (934). In the urban areas, the maximum figure is registered
in Jaisinghnagar (1,034) and the minimum is seen in Beohari (884) as depicted in Statements
5.99 & 5.100.
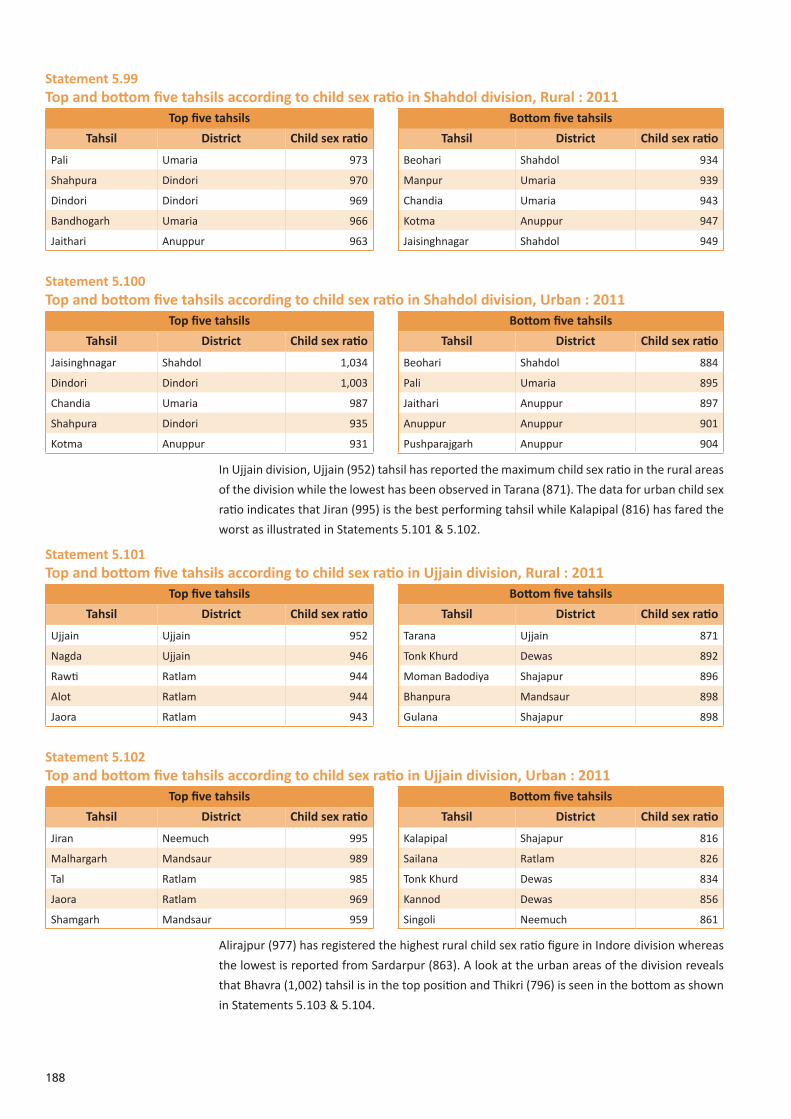
188
Statement 5.99Top and bottom five tahsils according to child sex ratio in Shahdol division, Rural : 2011
Top five tahsils
Tahsil District Child sex ratio
Pali Umaria 973
Shahpura Dindori 970
Dindori Dindori 969
Bandhogarh Umaria 966
Jaithari Anuppur 963
Bottom five tahsils
Tahsil District Child sex ratio
Beohari Shahdol 934
Manpur Umaria 939
Chandia Umaria 943
Kotma Anuppur 947
Jaisinghnagar Shahdol 949
Statement 5.100Top and bottom five tahsils according to child sex ratio in Shahdol division, Urban : 2011
Top five tahsils
Tahsil District Child sex ratio
Jaisinghnagar Shahdol 1,034
Dindori Dindori 1,003
Chandia Umaria 987
Shahpura Dindori 935
Kotma Anuppur 931
Bottom five tahsils
Tahsil District Child sex ratio
Beohari Shahdol 884
Pali Umaria 895
Jaithari Anuppur 897
Anuppur Anuppur 901
Pushparajgarh Anuppur 904
In Ujjain division, Ujjain (952) tahsil has reported the maximum child sex ratio in the rural areas
of the division while the lowest has been observed in Tarana (871). The data for urban child sex
ratio indicates that Jiran (995) is the best performing tahsil while Kalapipal (816) has fared the
worst as illustrated in Statements 5.101 & 5.102.
Statement 5.101Top and bottom five tahsils according to child sex ratio in Ujjain division, Rural : 2011
Top five tahsils
Tahsil District Child sex ratio
Ujjain Ujjain 952
Nagda Ujjain 946
Rawti Ratlam 944
Alot Ratlam 944
Jaora Ratlam 943
Bottom five tahsils
Tahsil District Child sex ratio
Tarana Ujjain 871
Tonk Khurd Dewas 892
Moman Badodiya Shajapur 896
Bhanpura Mandsaur 898
Gulana Shajapur 898
Statement 5.102Top and bottom five tahsils according to child sex ratio in Ujjain division, Urban : 2011
Top five tahsils
Tahsil District Child sex ratio
Jiran Neemuch 995
Malhargarh Mandsaur 989
Tal Ratlam 985
Jaora Ratlam 969
Shamgarh Mandsaur 959
Bottom five tahsils
Tahsil District Child sex ratio
Kalapipal Shajapur 816
Sailana Ratlam 826
Tonk Khurd Dewas 834
Kannod Dewas 856
Singoli Neemuch 861
Alirajpur (977) has registered the highest rural child sex ratio figure in Indore division whereas
the lowest is reported from Sardarpur (863). A look at the urban areas of the division reveals
that Bhavra (1,002) tahsil is in the top position and Thikri (796) is seen in the bottom as shown
in Statements 5.103 & 5.104.

GENDER COMPOSITION (CHILD SEX RATIO)
PROVISIONAL POPULATION TOTALS 189
Statement 5.103Top and bottom five tahsils according to child sex ratio in Indore division, Rural : 2011
Top five tahsils
Tahsil District Child sex ratio
Alirajpur Alirajpur 977
Jobat Alirajpur 971
Gandhwani Dhar 970
Pati Barwani 962
Varla Barwani 960
Bottom five tahsils
Tahsil District Child sex ratio
Sardarpur Dhar 863
Indore Indore 879
Sawer Indore 889
Badnawar Dhar 896
Hatod Indore 900
Statement 5.104Top and bottom five tahsils according to child sex ratio in Indore division, Urban : 2011
Top five tahsils
Tahsil District Child sex ratio
Bhavra Alirajpur 1,002
Meghnagar Jhabua 980
Punasa Khandwa (East Nimar) 971
Anjad Barwani 966
Harsud Khandwa (East Nimar) 955
Bottom five tahsils
Tahsil District Child sex ratio
Thikri Barwani 796
Sendhwa Barwani 850
Rajpur Barwani 872
Ranapur Jhabua 876
Depalpur Indore 877
In Bhopal division, the tahsil which has recorded the highest rural child sex ratio figure is
Begamganj (973) while the lowest is seen in Sehore (882) and Shyampur (882). In the urban
areas, Jirapur (962) has registered the highest child sex ratio and the minimum is reported from
Rehti (865) as depicted in Statements 5.105 & 5.106.
Statement 5.105Top and bottom five tahsils according to child sex ratio in Bhopal division, Rural : 2011
Top five tahsils
Tahsil District Child sex ratio
Begamganj Raisen 973
Rehti Sehore 956
Kurwai Vidisha 941
Sarangpur Rajgarh 937
Gairatganj Raisen 936
Bottom five tahsils
Tahsil District Child sex ratio
Shyampur Sehore 882
Sehore Sehore 882
Ashta Sehore 889
Biaora Rajgarh 902
Pachore Rajgarh 903
Statement 5.106Top and bottom five tahsils according to child sex ratio in Bhopal division, Urban : 2011
Top five tahsils
Tahsil District Child sex ratio
Jirapur Rajgarh 962
Kurwai Vidisha 951
Shamshabad Vidisha 949
Raisen Raisen 946
Gairatganj Raisen 943
Bottom five tahsils
District Tahsil Child sex ratio
Rehti Sehore 865
Rajgarh Rajgarh 868
Berasia Bhopal 882
Udaipura Raisen 883
Ichhawar Sehore 892
Ghoda Dongri (972) is seen as the best performing tahsil in terms of rural child sex ratio in
Narmadapuram division while Sohagpur (894) has fared the worst. The urban child sex ratio
figures indicate that Athner (1,071) has registered the highest figure and the lowest is observed
in Timarni (847) as shown in Statements 5.107 & 5.108.

190
Statement 5.107Top and bottom five tahsils according to child sex ratio in Narmadapuram division, Rural : 2011
Top five tahsils
Tahsil District Child sex ratio
Ghoda Dongri Betul 972
Amla Betul 962
Multai Betul 958
Athner Betul 957
Rehatgaon Harda 955
Bottom five tahsils
Tahsil District Child sex ratio
Sohagpur Hoshangabad 894
Timarni Harda 896
Babai Hoshangabad 905
Seoni-Malwa Hoshangabad 908
Hoshangabad Hoshangabad 910
Statement 5.108Top and bottom five tahsils according to child sex ratio in Narmadapuram division, Urban : 2011
Top five tahsils
Tahsil District Child sex ratio
Athner Betul 1,071
Bhainsdehi Betul 1,007
Khirkiya Harda 976
Amla Betul 951
Shahpur Betul 946
Bottom five tahsils
Tahsil District Child sex ratio
Timarni Harda 847
Dolariya Hoshangabad 868
Hoshangabad Hoshangabad 868
Pipariya Hoshangabad 869
Harda Harda 891
Lastly in Jabalpur division, Kurai (1,008) is seen in top position in terms of child sex ratio in the
rural areas and Tendukheda (877) is seen in the bottom. In the urban areas the highest child
sex ratio is reported from Harrai (1,055) and the lowest from Gadarwara (837) as illustrated in
Statements 5.109 & 5.110.
Statement 5.109Top and bottom five tahsils according to child sex ratio in Jabalpur division, Rural : 2011
Top five tahsils
Tahsil District Child sex ratio
Kurai Seoni 1,008
Katangi Balaghat 1,000
Khairlanji Balaghat 984
Ghughari Mandla 982
Pandhurna Chhindwara 981
Bottom five tahsils
Tahsil District Child sex ratio
Tendukheda Narsimhapur 877
Patan Jabalpur 883
Gotegaon Narsimhapur 886
Narsimhapur Narsimhapur 908
Kareli Narsimhapur 914
Statement 5.110Top and bottom five tahsils according to child sex ratio in Jabalpur division, Urban : 2011
Top five tahsils
Tahsil District Child sex ratio
Harrai Chhindwara 1,055
Barghat Seoni 975
Paraswada Balaghat 961
Parasia Chhindwara 957
Bichhiya Mandla 956
Bottom five tahsils
Tahsil District Child sex ratio
Gadarwara Narsimhapur 837
Ghansaur Seoni 847
Gotegaon Narsimhapur 861
Lakhnadon Seoni 862
Kundam Jabalpur 867

GENDER COMPOSITION (CHILD SEX RATIO)
PROVISIONAL POPULATION TOTALS 191
GUNAASHOKNAGAR
SAGARRAJGARH
RAISEN
CHHATARPUR
DAMOH
JABALPUR
PANNA
MORENA
SHEOPUR
BHIND
GWALIOR
DATIA
SHIVPURI
SATNA
REWA
SIDHI SINGRAULI
KATNI
UMARIA
SHAHDOL
ANUPPUR
MANDLA
DINDORI
BALAGHAT
HOSHANGABAD
NARSIMHAPUR
SEONICHHINDWARA
VIDISHA
BETUL
HARDA
ALIRAJPUR
JHABUA
DHAR
(WEST NIMAR)(EAST NIMAR)
INDORE DEWAS
UJJAINRATLAM
NEEMUCH
MANDSAUR
SHAJAPUR
SEHORE
TIKAMGARH
BARWANI
BURHANPUR
BHOPAL
KHARGONEKHANDWA
5
7
1
9
10
9
31
0
26
6
3
11
24
484
7
14
16
24
31
40
2
14
32
3
12
14
9
46
21
51
31
45
1527
30
43
40
43
24
80
8
10
2558
35
2
44
2022
40 0 12040 80
KILOMETRES
74 76 78 80 82
28
26
24
22
20
8278 807674
20
22
24
26
28
o o o o o
o
o
o
o
o
ooooo
o
o
o
o
oMADHYA PRADESH
RA
J
A
S
T
H
A
N U T
TA
R P R A
DE
SH
GU
JA
RA
T
M
AH
A RA
S H TR A
CH
HA
T
TI
SG
AR
H
INDIA
BOUNDARIES : - STATE.............................
DISTRICT.........................DIVISION.........................
GAP IN RURAL AND URBAN SEX RATIO 2011
GAP IN RURAL AND URBAN SEX RATIO
EAST OF GREENWICH
c Government of India copyright, 2011The state boundaries between Chhattisgarh and Madhya Pradesh have not been verified by the Government concerned.
INCREASE
51 AND ABOVE
31 - 50
11 - 30
10 AND BELOW
16 AND ABOVE
6 - 15
5 AND BELOW
0
DECREASE