Gender-based homophily in collaborations across a ...
69
Gender-based homophily in collaborations across a heterogeneous scholarly landscape Carole Lee Department of Philosophy University of Washington Metascience 2019 Symposium Stanford University September 5-8
Transcript of Gender-based homophily in collaborations across a ...

Gender-based homophily in collaborations across a
heterogeneous scholarly landscape
Carole LeeDepartment of PhilosophyUniversity of Washington
Metascience 2019 SymposiumStanford University
September 5-8

Joint work with:
Y. Samuel Wang
Business School
U Chicago
Elena Erosheva
Statistics; Center for Social Sciences and Statistics; Social Work
U Washington
Jevin West
Information School
U Washington
Carl Bergstrom
Biology
U Washington

Where do ideas come from?

Where do ideas come from?
Ideas come from people. . .

Where do ideas come from?
Different people have different forms of expertise.

Where do ideas come from?
We can create new ideas by combining folks with different forms of expertise into collaborative teams.

Where do ideas come from?
Collaborative teams are more likely than solo authors to create novel combinations of old ideas.
Combinations that are atypical and span a longer interdisciplinary distance have higher impact.
Uzzi, Brian, Satyam Mukherjee, Michael Stringer, & Ben Jones. "Atypical combinations and scientific impact." Science 342 (2013): 468-472. Larivière, Vincent, Stefanie Haustein, & Katy Börner. "Long-distance interdisciplinarity leads to higher scientific impact." Plos one 10 (2015): e0122565. Larivière, Vincent, Yves Gingras, Cassidy R. Sugimoto, and Andrew Tsou. "Team size matters: Collaboration and scientific impact since 1900." JASIST 66 (2015): 1323-1332.

How do teams self-assemble?
• Intellectual factors: expertise
• Instrumental factors: resources
• Social factors: respect, friendship, curiosity-seeking, fun
Katz, J. Sylvan, and Ben R. Martin. "What is research collaboration?." Research policy 26 (1997): 1-18.
Melin, Göran. "Pragmatism and self-organization: Research collaboration on the individual level." Research policy 29 (2000): 31-40.
Maglaughlin, Kelly L., and Diane H. Sonnenwald. "Factors that impact interdisciplinary scientific research collaboration: Focus on the natural sciences in academia." (2005).
Hara, Noriko, Paul Solomon, Seung-Lye Kim, and Diane H. Sonnenwald. "An emerging view of scientific collaboration: Scientists' perspectives on collaboration and factors that impact collaboration." Journal of the American Society for Information science and Technology 54 (2003): 952-965.

Collaboration involves social discretion
Does decreasing social distance increase collaboration?

• Homophily: Social similarly breeds connection.
• Gender homophily divides work environments, voluntary associations, and friendships.
McPherson, Miller, Lynn Smith-Lovin, and James M. Cook. "Birds of a feather: Homophily in social networks." Annual review of sociology 27 (2001): 415-444.
Kalleberg, Arne L., David Knoke, Peter V. Marsden, and Joe L. Spaeth, eds. Organizations in America. Sage, 1996.
McPherson, J. Miller, and Lynn Smith-Lovin. "Sex segregation in voluntary associations." American Sociological Review (1986): 61-79.
Ibarra, Herminia. "Homophily and differential returns: Sex differences in network structure and access in an advertising firm." Administrative science quarterly (1992): 422-447.
Ibarra, Herminia. "Paving an alternative route: Gender differences in managerial networks." Social psychology quarterly (1997): 91-102.
Collaborative teams and social distance

• Is there gender-based homophily in collaborations across the heterogeneous scholarly landscape at varying levels of granularity?
• Women are less likely to co-author and serve as first or last author
• Given professional advantages of collaboration, it’s important to understand how and under what conditions women collaborate
Question
Larivière, Vincent, Chaoqun Ni, Yves Gingras, Blaise Cronin, and Cassidy R. Sugimoto. "Bibliometrics: Global gender disparities in science." Nature News 504, no. 7479 (2013): 211.
West, Jevin D., Jennifer Jacquet, Molly M. King, Shelley J. Correll, and Carl T. Bergstrom. "The role of gender in scholarly authorship." PloS one 8, no. 7 (2013): e66212.

Data
• JSTOR, a repository of papers across the humanities, social sciences, and natural sciences
• We consider cited papers from 1960 onward
• 252,413 multi-author papers with 807,588 authorships (i.e., instances of co-authoring)

Hierarchical clustering
• Apply hierarchical implementation of the InfoMap network algorithm to the citation network on the JSTOR corpus
• This reveals the hierarchical structure of corpus through the efficient coding of random walks on the citation network
Rosvall, Martin, and Carl T. Bergstrom. "Maps of random walks on complex networks reveal community structure." Proceedings of the National Academy of Sciences 105, no. 4 (2008): 1118-1123.
Rosvall, Martin, and Carl T. Bergstrom. "Multilevel compression of random walks on networks reveals hierarchical organization in large integrated systems." PloS one 6, no. 4 (2011): e18209.

Hierarchical clustering
Status characteristics
Exchange networks
At the lowest level of clustering, each paper is grouped into one of 1,450 terminal fields which form the finest partition of the data.

Hierarchical clustering
Group interactions
Status characteristics
Exchange networks
Each higher clustering forms progressively coarser partitions of the documents by aggregating terminal fields into the 280 composite fields.

Hierarchical clustering
Sociology of communication
Group interactions Role performance Conversation Motive
Status characteristics
Exchange networks

Hierarchical clustering
Sociology
Sociology of family
Status, education, wages
Sociology of communication
Delinquency, deviance Religion Etc . . .
Group interactions Role performance Conversation Motive
Status characteristics
Exchange networks
At the top-level, we have 24 major fields.

Hierarchical clustering
Sociology
Sociology of family
Status, education, wages
Sociology of communication
Delinquency, deviance Religion Etc . . .
Group interactions Role performance Conversation Motive
Status characteristics
Exchange networks
Hierarchical structure has up to 6 levels.

Hierarchical clustering
Sociology
Sociology of family
Status, education, wages
Sociology of communication
Delinquency, deviance Religion Etc . . .
Group interactions Role performance Conversation Motive
Status characteristics
Exchange networks
At any level, papers in a common field are more connected via citations than to papers from neighboring fields.
Fields at finer levels of the hierarchy are more connected than fields at coarser levels.

Determining gender
• Gender inferred from first names (>95% certainty)
• 75.3% gender determined via Social Security records
• 12.6% determined via genderizeR (user profiles from social networks)
• 12.1% gender unknown and omitted from our analysis:
• 7.6% appear in neither data base
• 4.5% are used for males and females with > 5% certainty
• Rate of missingness compares favorably to previous studies
West, Jevin D., Jennifer Jacquet, Molly M. King, Shelley J. Correll, and Carl T. Bergstrom. "The role of gender in scholarly authorship." PloS one 8, no. 7 (2013): e66212.
Larivière, Vincent, Chaoqun Ni, Yves Gingras, Blaise Cronin, and Cassidy R. Sugimoto. "Bibliometrics: Global gender disparities in science." Nature News 504, no. 7479 (2013): 211.

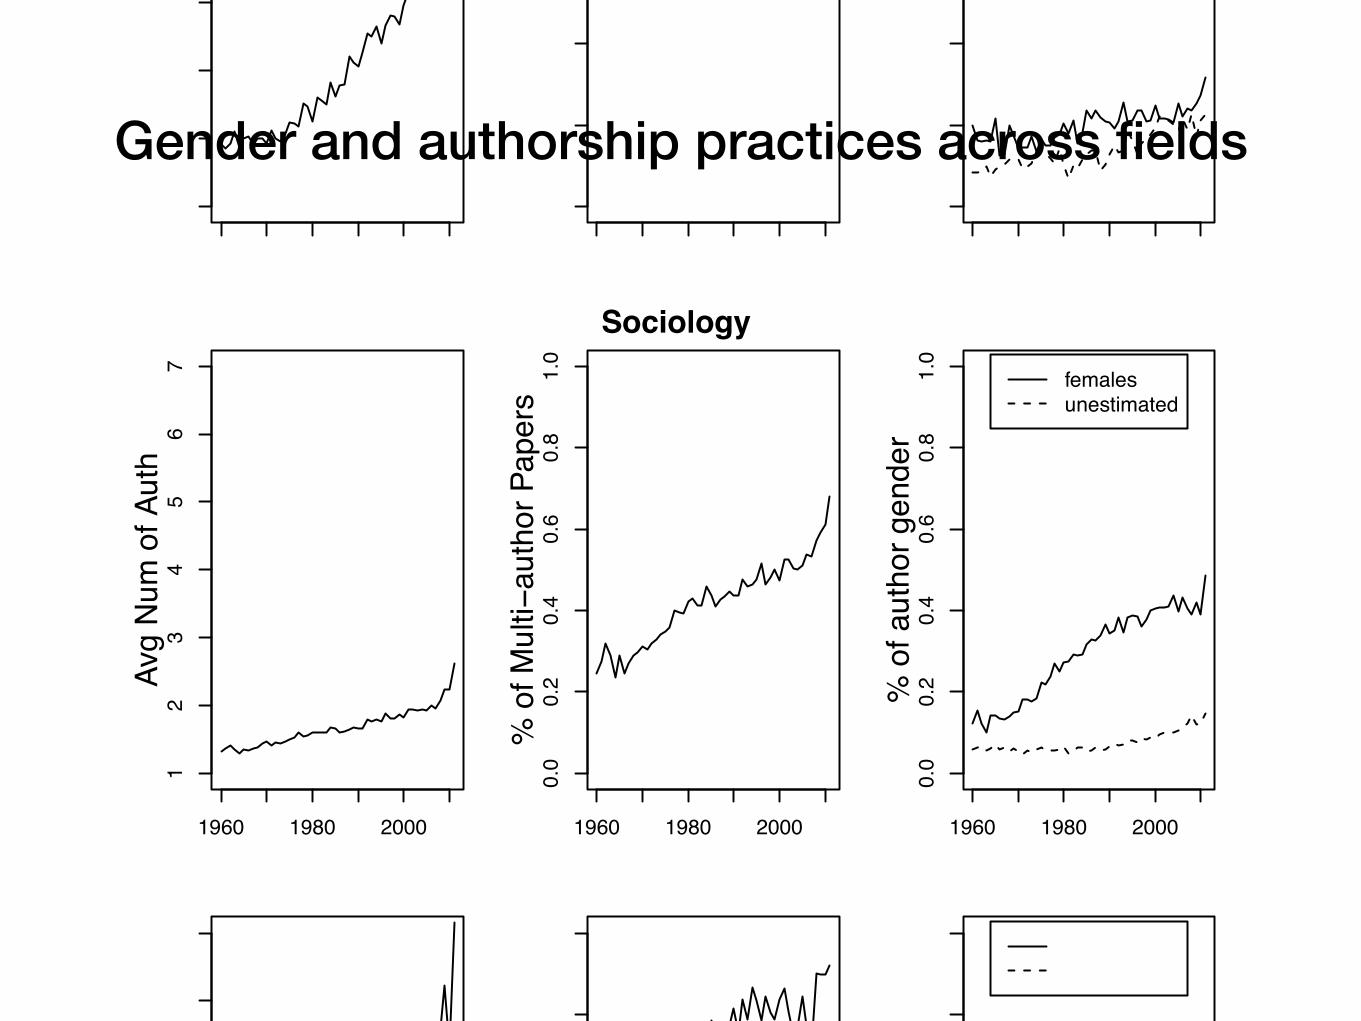
Gender and authorship practices across fields
1960 1980 2000
12
34
56
7Av
g N
um o
f Aut
h
1960 1980 2000
0.0
0.2
0.4
0.6
0.8
1.0
% o
f Mul
ti−au
thor
Pap
ers
1960 1980 2000
0.0
0.2
0.4
0.6
0.8
1.0
femalesunestimated
% o
f aut
hor g
ende
r
Demography
1960 1980 2000
12
34
56
7Av
g N
um o
f Aut
h
1960 1980 2000
0.0
0.2
0.4
0.6
0.8
1.0
% o
f Mul
ti−au
thor
Pap
ers
1960 1980 2000
0.0
0.2
0.4
0.6
0.8
1.0
femalesunestimated
% o
f aut
hor g
ende
r
Ecology and evolution
1960 1980 2000
12
34
56
7Av
g N
um o
f Aut
h
1960 1980 2000
0.0
0.2
0.4
0.6
0.8
1.0
% o
f Mul
ti−au
thor
Pap
ers
1960 1980 2000
0.0
0.2
0.4
0.6
0.8
1.0
femalesunestimated
% o
f aut
hor g
ende
rEconomics
6 of 22
621
622
623
624
625
626
627
628
629
630
631
632
633
634
635
636
637
638
639
640
641
642
643
644
645
646
647
648
649
650
651
652
653
654
655
656
657
658
659
660
661
662
663
664
665
666
667
668
669
670
671
672
673
674
675
676
677
678
679
680
681
682
683
684
685
686
687
688
689
690
691
692
693
694
695
696
697
698
699
700
701
702
703
704
705
706
707
708
709
710
711
712
713
714
715
716
717
718
719
720
721
722
723
724
725
726
727
728
729
730
731
732
733
734
735
736
737
738
739
740
741
742
743
744
Y. Samuel Wang, Carole J. Lee, Jevin D. West, Carl T. Bergstrom, Elena A. Erosheva
Gender and authorship practices across fields
1960 1980 2000
12
34
56
7Av
g N
um o
f Aut
h
1960 1980 2000
0.0
0.2
0.4
0.6
0.8
1.0
% o
f Mul
ti−au
thor
Pap
ers
1960 1980 2000
0.0
0.2
0.4
0.6
0.8
1.0
femalesunestimated
% o
f aut
hor g
ende
r
Radiation damage
1960 1980 2000
12
34
56
7Av
g N
um o
f Aut
h
1960 1980 2000
0.0
0.2
0.4
0.6
0.8
1.0
% o
f Mul
ti−au
thor
Pap
ers
1960 1980 2000
0.0
0.2
0.4
0.6
0.8
1.0
femalesunestimated
% o
f aut
hor g
ende
r
Sociology
1960 1980 2000
12
34
56
7Av
g N
um o
f Aut
h
1960 1980 2000
0.0
0.2
0.4
0.6
0.8
1.0
% o
f Mul
ti−au
thor
Pap
ers
1960 1980 2000
0.0
0.2
0.4
0.6
0.8
1.0
femalesunestimated
% o
f aut
hor g
ende
rVeterinary medicine
12 of 22
1365
1366
1367
1368
1369
1370
1371
1372
1373
1374
1375
1376
1377
1378
1379
1380
1381
1382
1383
1384
1385
1386
1387
1388
1389
1390
1391
1392
1393
1394
1395
1396
1397
1398
1399
1400
1401
1402
1403
1404
1405
1406
1407
1408
1409
1410
1411
1412
1413
1414
1415
1416
1417
1418
1419
1420
1421
1422
1423
1424
1425
1426
1427
1428
1429
1430
1431
1432
1433
1434
1435
1436
1437
1438
1439
1440
1441
1442
1443
1444
1445
1446
1447
1448
1449
1450
1451
1452
1453
1454
1455
1456
1457
1458
1459
1460
1461
1462
1463
1464
1465
1466
1467
1468
1469
1470
1471
1472
1473
1474
1475
1476
1477
1478
1479
1480
1481
1482
1483
1484
1485
1486
1487
1488
Y. Samuel Wang, Carole J. Lee, Jevin D. West, Carl T. Bergstrom, Elena A. Erosheva

Gender and authorship practices across fields
1960 1980 2000
12
34
56
7Av
g N
um o
f Aut
h
1960 1980 2000
0.0
0.2
0.4
0.6
0.8
1.0
% o
f Mul
ti−au
thor
Pap
ers
1960 1980 2000
0.0
0.2
0.4
0.6
0.8
1.0
femalesunestimated
% o
f aut
hor g
ende
r
Operations research
1960 1980 2000
12
34
56
7Av
g N
um o
f Aut
h
1960 1980 2000
0.0
0.2
0.4
0.6
0.8
1.0
% o
f Mul
ti−au
thor
Pap
ers
1960 1980 2000
0.0
0.2
0.4
0.6
0.8
1.0
femalesunestimated
% o
f aut
hor g
ende
r
Organizational and marketing
1960 1980 2000
12
34
56
7Av
g N
um o
f Aut
h
1960 1980 2000
0.0
0.2
0.4
0.6
0.8
1.0
% o
f Mul
ti−au
thor
Pap
ers
1960 1980 2000
0.0
0.2
0.4
0.6
0.8
1.0
femalesunestimated
% o
f aut
hor g
ende
r
Philosophy
Y. Samuel Wang, Carole J. Lee, Jevin D. West, Carl T. Bergstrom, Elena A. Erosheva
993
994
995
996
997
998
999
1000
1001
1002
1003
1004
1005
1006
1007
1008
1009
1010
1011
1012
1013
1014
1015
1016
1017
1018
1019
1020
1021
1022
1023
1024
1025
1026
1027
1028
1029
1030
1031
1032
1033
1034
1035
1036
1037
1038
1039
1040
1041
1042
1043
1044
1045
1046
1047
1048
1049
1050
1051
1052
1053
1054
1055
1056
1057
1058
1059
1060
1061
1062
1063
1064
1065
1066
1067
1068
1069
1070
1071
1072
1073
1074
1075
1076
1077
1078
1079
1080
1081
1082
1083
1084
1085
1086
1087
1088
1089
1090
1091
1092
1093
1094
1095
1096
1097
1098
1099
1100
1101
1102
1103
1104
1105
1106
1107
1108
1109
1110
1111
1112
1113
1114
1115
1116
9 of 22

Question
• Do males co-author with males (and females with females) more often than we would otherwise expect?
• We need to be careful about how we measure:
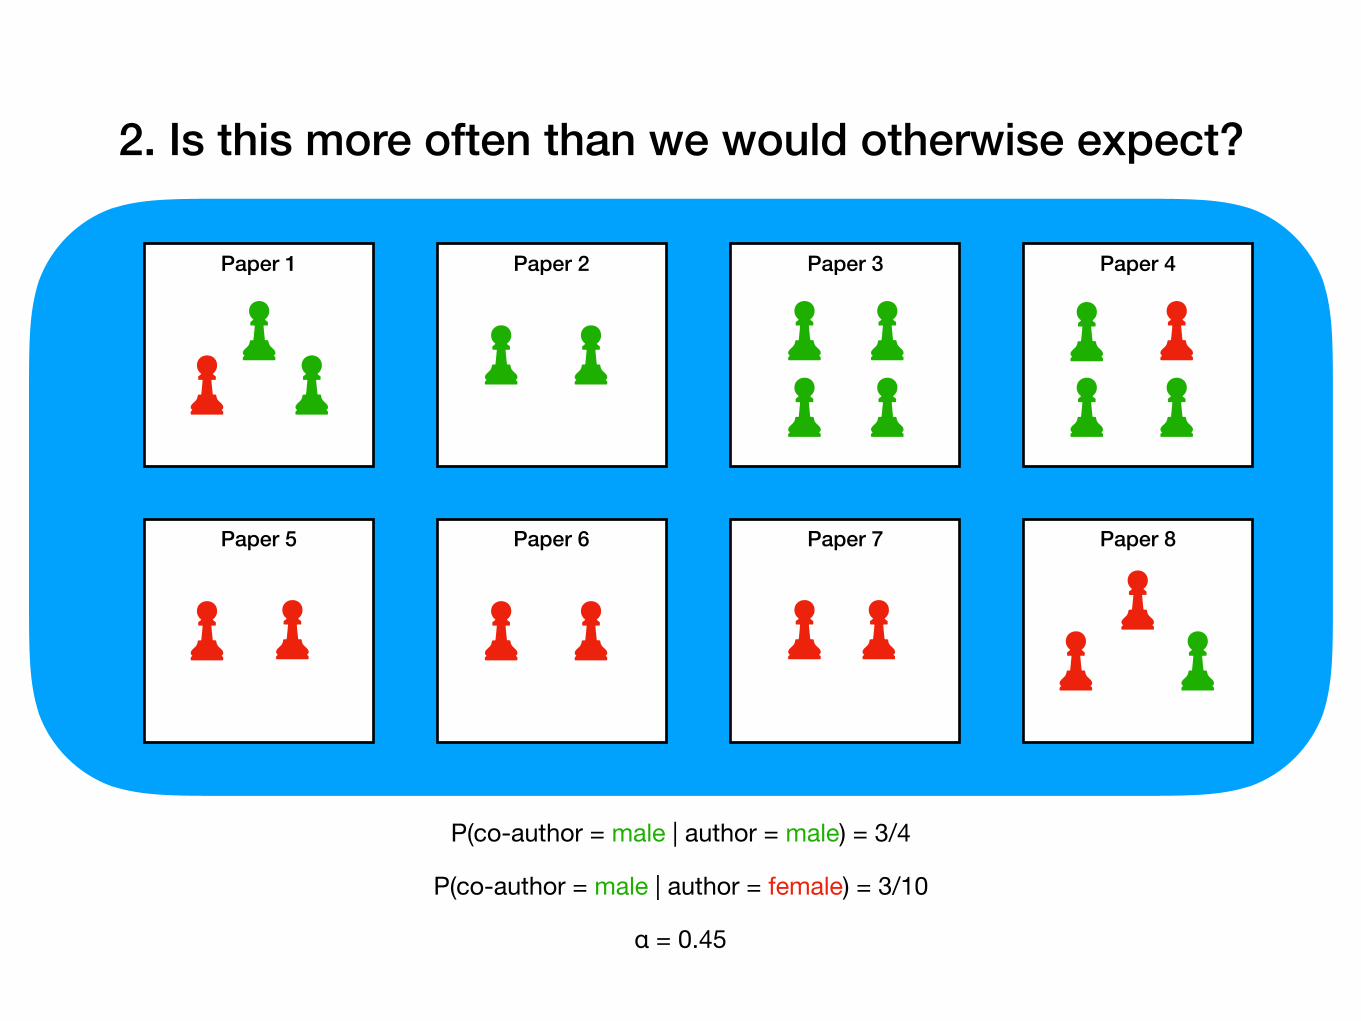
1. How often do males co-author w/ males (and females w/ females)?
2. Counterfactual: Is this more often than we would otherwise expect?
3. If yes, then we have behavioral homophily.

1. Tendency for same-gender authorships to co-author
• We measure homophily by computing the difference in risks:
• α = P(random co-author of random male is male) - P (random co-author of a random female is male)

1. Tendency for same-gender authorships to co-author
• We measure homophily by computing the difference in risks:
• α = P(random co-author of random male is male) - P (random co-author of a random female is male)
• This measure is equivalent to:
• Pearson correlation of gender indicators for random co-authorship pairs
• Wright’s F Coefficient of Inbreeding when all papers have two authors
• Newman’s network-based assortativity coefficient in an appropriately weighted network
Bergstrom, Theodore C. "The algebra of assortative encounters and the evolution of cooperation." International Game Theory Review 5, no. 03 (2003): 211-228.
Wright, Sewall. "The genetical structure of populations." Annals of eugenics 15, no. 1 (1949): 323-354.
Bergstrom, T., M. Bergstrom, M. King, J. Jacquet, J. West, and S. Correll. "A note on measuring gender homophily among scholarly authors." (2016).
Wang, Y. Samuel, and Elena A. Erosheva. "On the relationship between set-based and network-based measures of gender homophily in scholarly publications." arXiv preprint arXiv:1610.09026 (2016).
Newman, Mark EJ. "Mixing patterns in networks." Physical Review E 67, no. 2 (2003): 026126.

1. Tendency for same-gender authorships to co-author
Sociology
Sociology of family
Status, education, wages
Sociology of communication
Delinquency, deviance Religion Etc . . .
Group interactions Role performance Conversation Motive
Status characteristics
Exchange networks

1. Tendency for same-gender authorships to co-author
Sociology

1. Tendency for same-gender authorships to co-author
Sociology

1. Tendency for same-gender authorships to co-author
Paper 1
Paper 8Paper 7Paper 6Paper 5
Paper 2 Paper 3 Paper 4

1. Tendency for same-gender authorships to co-author
Paper 1
Paper 8Paper 7Paper 6Paper 5
Paper 2 Paper 3 Paper 4
femalemale

1. Tendency for same-gender authorships to co-author
P(co-author = male | author = male) = 3/4
P(co-author = male | author = female) = 3/10
α = 0.45
Paper 1
Paper 8Paper 7Paper 6Paper 5
Paper 2 Paper 3 Paper 4

Question
1. How often do males co-author w/ males (and females w/ females)?
2. Counterfactual: Is this more often than we would otherwise expect?
1. To do this, we must account for:
1. Structural Homophily
2. Compositional Homophily
P(co-author = male | author = male) = 3/4
P(co-author = male | author = female) = 3/10
α = 0.45
Paper 1
Paper 8Paper 7Paper 6Paper 5
Paper 2 Paper 3 Paper 4
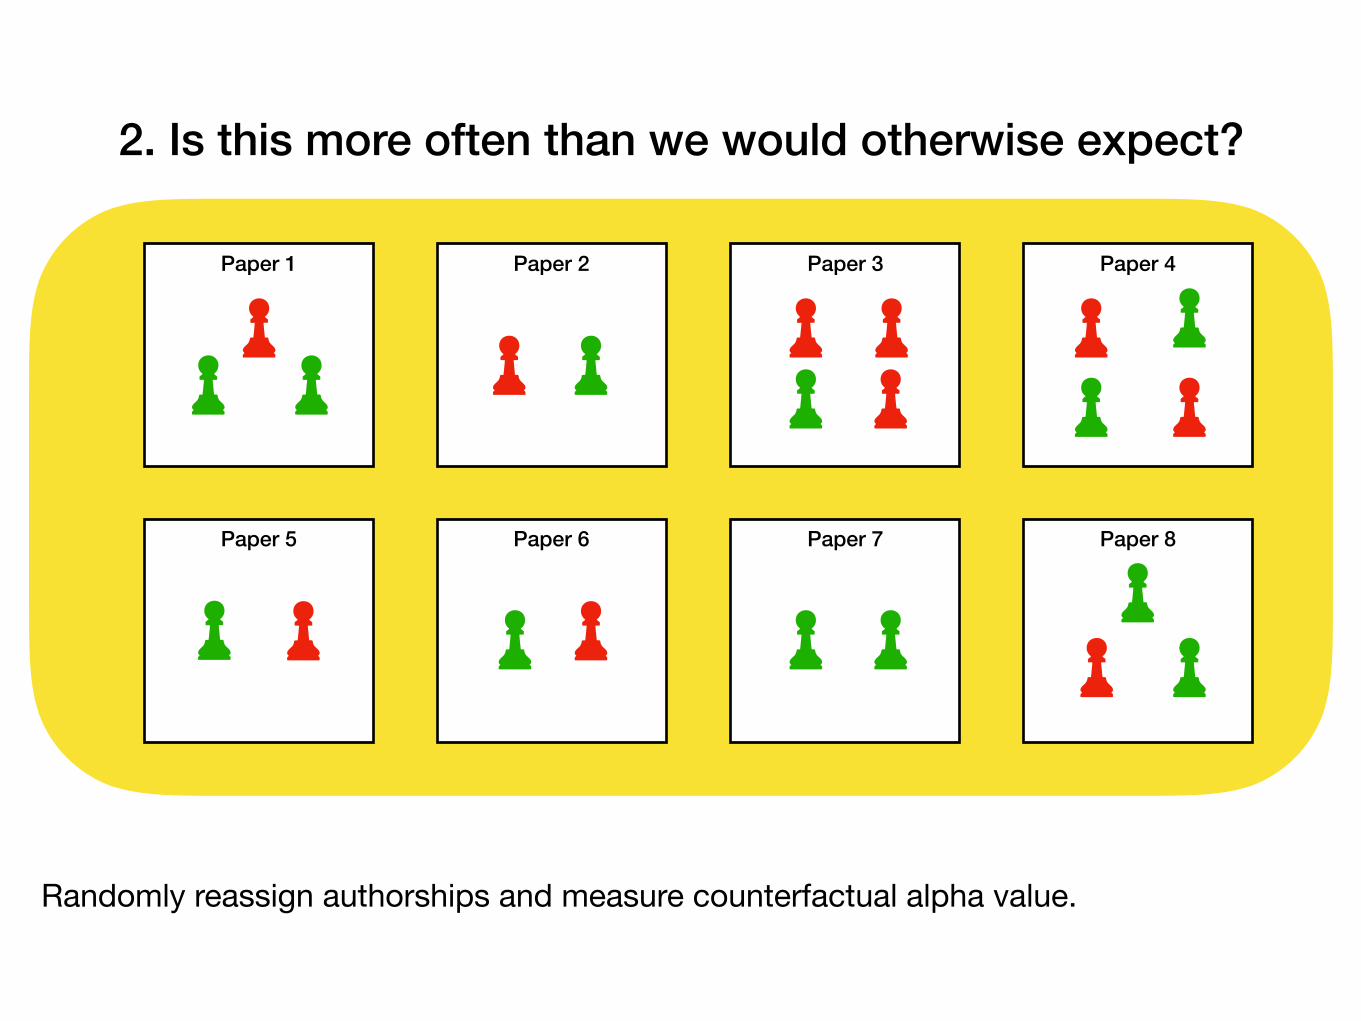
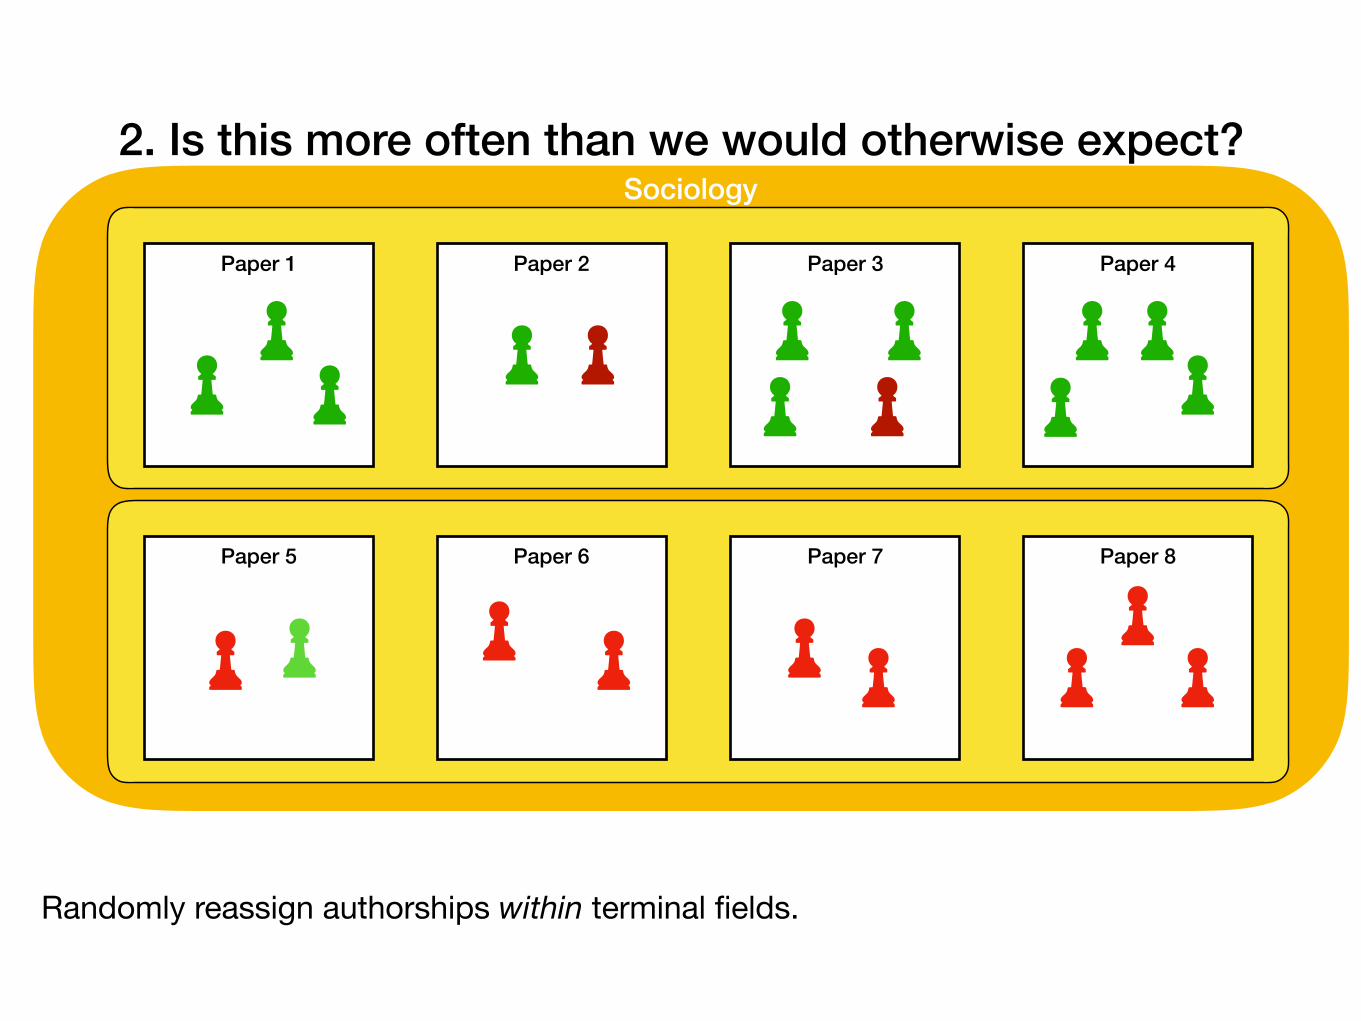
2. Is this more often than we would otherwise expect?

2. Is this more often than we would otherwise expect?
Paper 1
Paper 8Paper 7Paper 6Paper 5
Paper 2 Paper 3 Paper 4
Fix gender ratio, number of authorships, number of authorships per paper.

2. Is this more often than we would otherwise expect?
Paper 1
Paper 8Paper 7Paper 6Paper 5
Paper 2 Paper 3 Paper 4
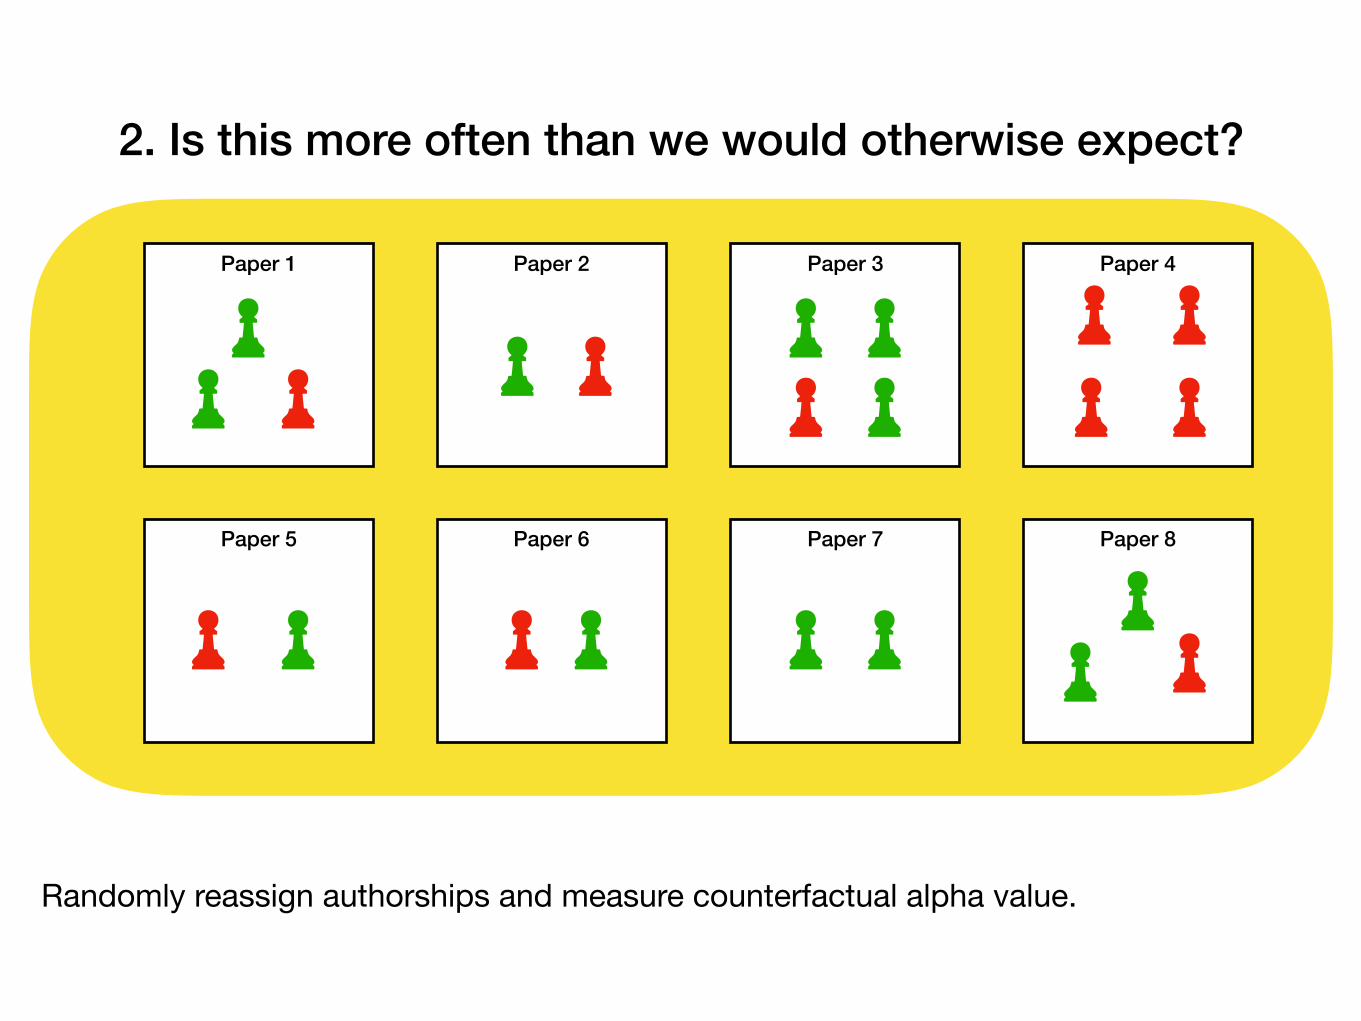
Randomly reassign authorships and measure counterfactual alpha value.
2. Is this more often than we would otherwise expect?
Paper 1
Paper 8Paper 7Paper 6Paper 5
Paper 2 Paper 3 Paper 4
Randomly reassign authorships and measure counterfactual alpha value.
2. Is this more often than we would otherwise expect?
Paper 1
Paper 8Paper 7Paper 6Paper 5
Paper 2 Paper 3 Paper 4
Randomly reassign authorships and measure counterfactual alpha value.

Measuring HomophilyDoc 1 Doc 2 Doc 3 Doc 4
Doc 5 Doc 6 Doc 7 Doc 8
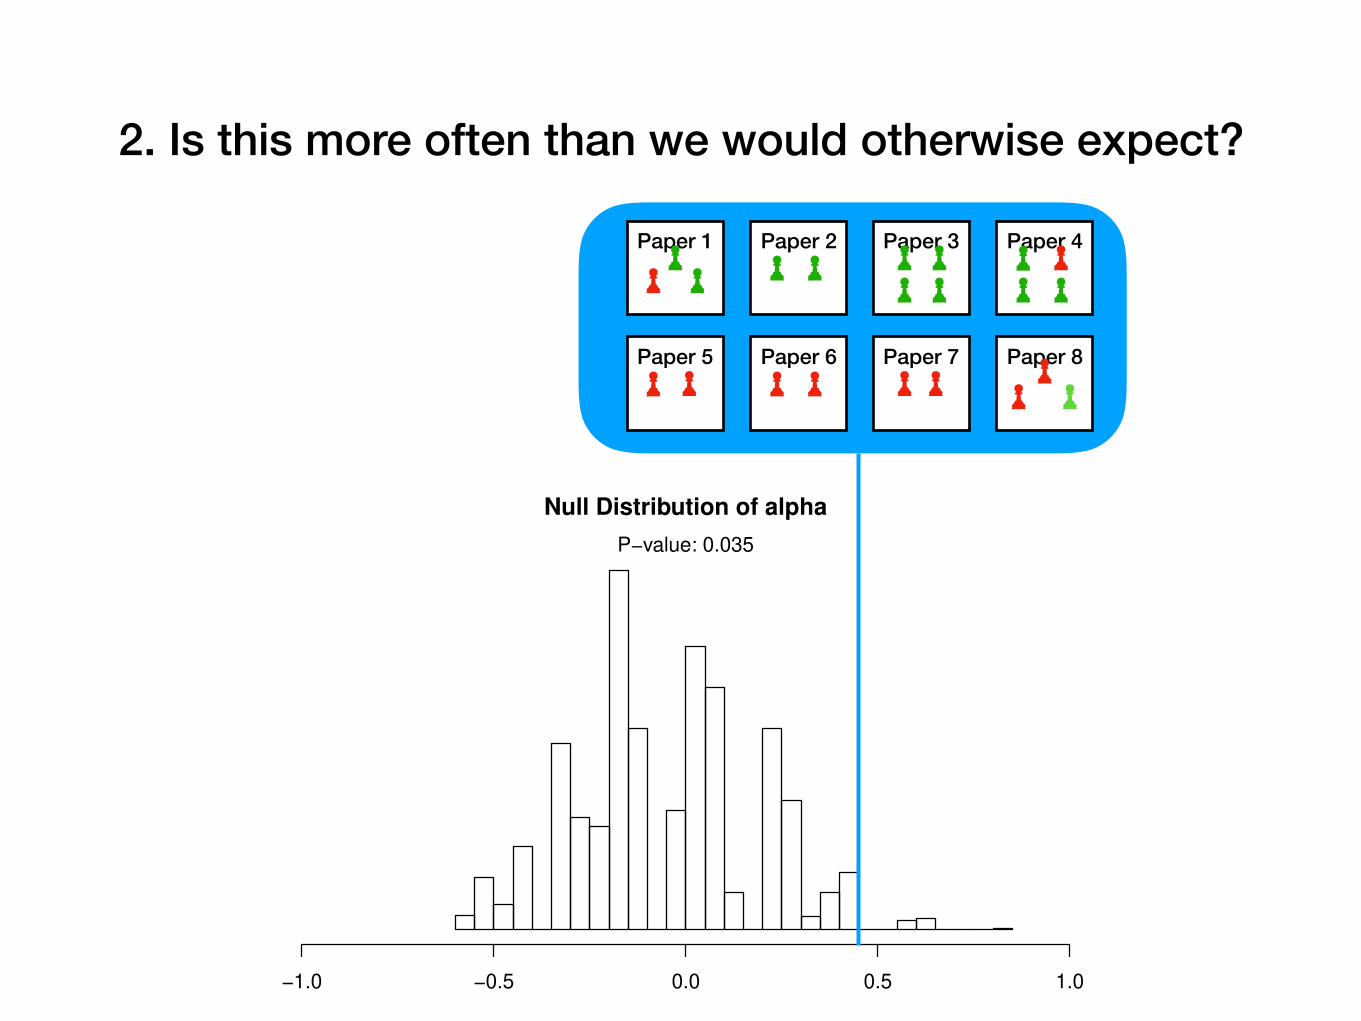
Null Distribution of alpha
alpha
−1.0 −0.5 0.0 0.5 1.0
P−value: 0.035
Y. Samuel Wang Homophily in Co-authorships 08/11/2019 9 / 17
2. Is this more often than we would otherwise expect?
Structural homophily = Deviation of alpha from zero due to structural aspects (gender ratio, number of authorships, number of authorships per paper)
Null Distribution of alpha
−1.0 −0.5 0.0 0.5 1.0
P−value: 0.035
2. Is this more often than we would otherwise expect?
Paper 1
Paper 8Paper 7Paper 6Paper 5
Paper 2 Paper 3 Paper 4

Null Distribution of alpha
−1.0 −0.5 0.0 0.5 1.0
P−value: 0.035
2. Is this more often than we would otherwise expect?
Paper 1
Paper 8Paper 7Paper 6Paper 5
Paper 2 Paper 3 Paper 4
p value = proportion of α values generated from the null distribution which are greater than or equal to the observed value of α.
Small p-value implies that the observed α is unlikely to occur.

Sociology
Sociology of family
Status, education, wages
Sociology of communication
Delinquency, deviance Religion Etc . . .
Group interactions Role performance Conversation Motive
Status characteristics
Exchange networks
2. Is this more often than we would otherwise expect?

Sociology
2. Is this more often than we would otherwise expect?

Sociology
Paper 1
Paper 8Paper 7Paper 6Paper 5
Paper 2 Paper 3 Paper 4
2. Is this more often than we would otherwise expect?

Sociology
Paper 1
Paper 8Paper 7Paper 6Paper 5
Paper 2 Paper 3 Paper 4
2. Is this more often than we would otherwise expect?
Each terminal field has different gender ratios, numbers of authorships, and numbers of authorships per paper.

Sociology
2. Is this more often than we would otherwise expect?
Fix gender ratio, number of authorships, number of authorships per paper within each terminal field.
Paper 1
Paper 8Paper 7Paper 6Paper 5
Paper 2 Paper 3 Paper 4

Sociology
Paper 1
Paper 8Paper 7Paper 6Paper 5
Paper 2 Paper 3 Paper 4
2. Is this more often than we would otherwise expect?
Randomly reassign authorships within terminal fields.
Sociology
Paper 1
Paper 8Paper 7Paper 6Paper 5
Paper 2 Paper 3 Paper 4
2. Is this more often than we would otherwise expect?
Randomly reassign authorships within terminal fields.

Compositional homophily = Deviation of alpha from the expected alpha under structural homophily that arises due to the tendency for authorships to co-author with those who are intellectually closer.
2. Is this more often than we would otherwise expect?
Compositional Homophily
Doc 1 Doc 2 Doc 3 Doc 4
Molecular Biology
Doc 5 Doc 6 Doc 7 Doc 8
Sociology
Null Distribution of alpha
alphaComp
−1.0 −0.5 0.0 0.5 1.0
P−value: 1
Y. Samuel Wang Homophily in Co-authorships 08/11/2019 11 / 18

Null Distribution of alpha
−1.0 −0.5 0.0 0.5 1.0
P−value: 1
Field
Paper 1
Paper 8Paper 7Paper 6Paper 5
Paper 2 Paper 3 Paper 4

Null Distribution of alpha
−1.0 −0.5 0.0 0.5 1.0
P−value: 1
Field
Paper 1
Paper 8Paper 7Paper 6Paper 5
Paper 2 Paper 3 Paper 4
Reversal due to gender imbalances and other structural differences across sub-populations:
• Simpson’s paradox (statistics)• Wahlund effect (population genetics)

• Generate counterfactuals:
• Assume authorships in the same terminal field are exchangeable
• Assume authorships in different terminal fields are less likely to swap and use citation flows to determine swap probabilities
• Use a Markov Chain Monte Carlo Metropolis Hastings sampler to generate counterfactuals
• 75,000 draws form null distribution after burn-in
• Compare counterfactual alpha values to observed alpha:
• Hypothesis test for all levels (terminal fields, composite fields, major fields)
• Use p-values adjusted by the Benjamini-Yuketieli procedure to control False Discovery Rate at 0.05
Testing procedure
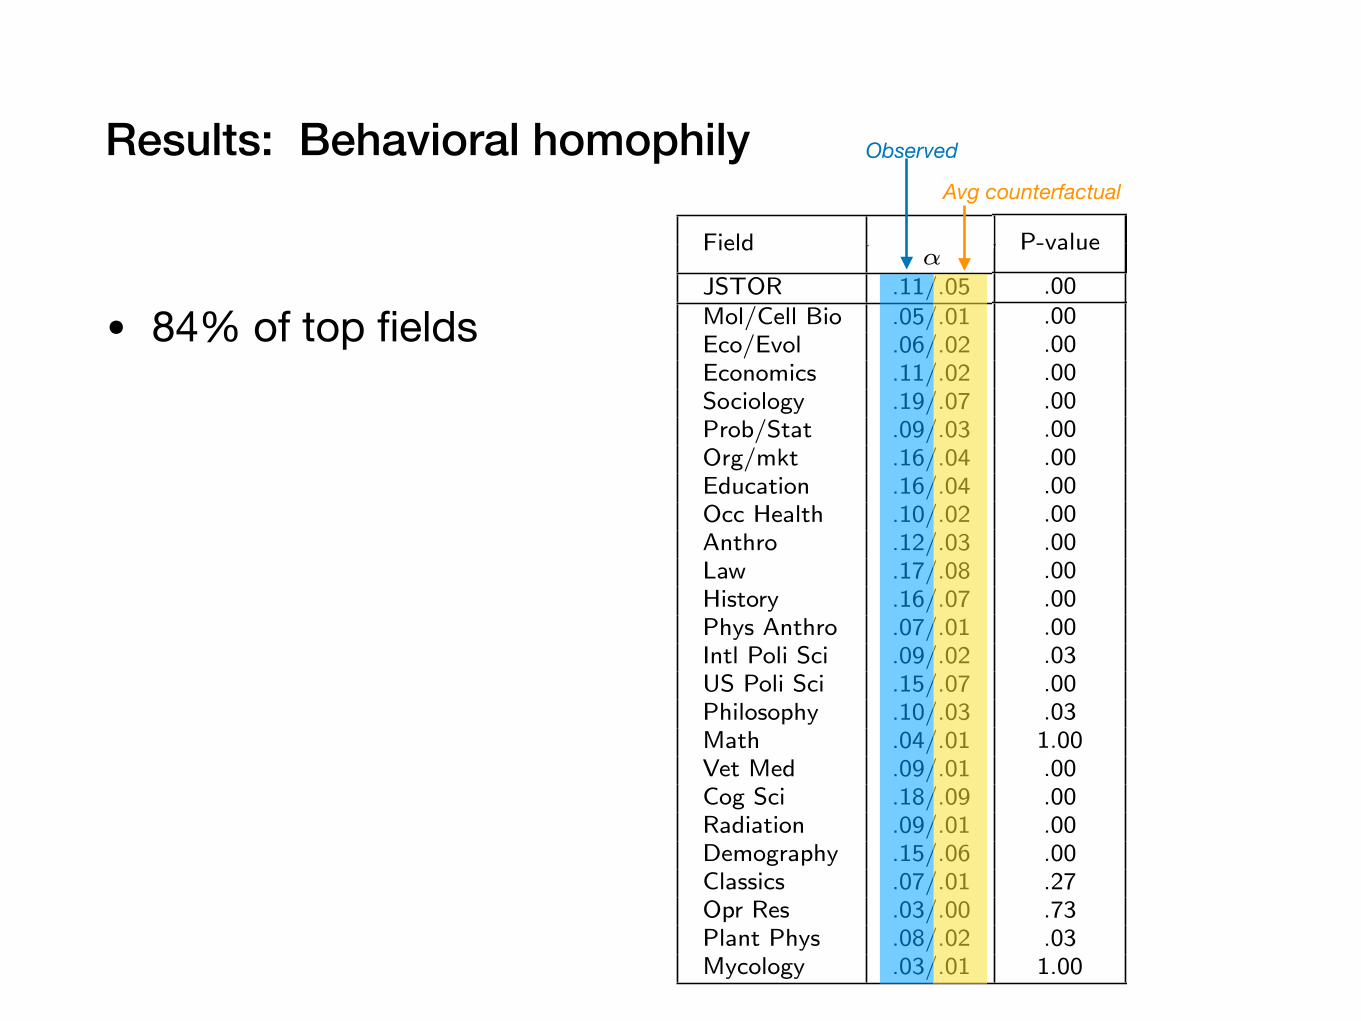
Results: Behavioral homophily
• 84% of top fields
Top Level Fields
FieldObs / Exp
P-valueSignificant / Total
↵ FM Term CompJSTOR .11/.05 38.6/41.1 .00 124/1450 82/280Mol/Cell Bio .05/.01 38.2/39.8 .00 29/178 19/44Eco/Evol .06/.02 31.9/33.3 .00 17/257 15/56Economics .11/.02 18.7/20.8 .00 9/136 11/28Sociology .19/.07 38.5/44.2 .00 13/94 12/21Prob/Stat .09/.03 26/27.8 .00 1/90 2/23Org/mkt .16/.04 29/33.2 .00 8/68 3/4Education .16/.04 41.2/47.2 .00 12/42 6/10Occ Health .10/.02 41.7/45.5 .00 12/24 1/1Anthro .12/.03 38.5/42 .00 5/63 2/8Law .17/.08 29.7/32.9 .00 0/98 1/16History .16/.07 32.9/36.5 .00 0/49 1/6Phys Anthro .07/.01 34.7/36.8 .00 1/32 2/10Intl Poli Sci .09/.02 27.3/29.1 .03 0/34 0/2US Poli Sci .15/.07 25.2/27.4 .00 2/37 1/6Philosophy .10/.03 18.7/20.3 .03 0/45 0/8Math .04/.01 14.3/14.7 1.00 0/46 0/9Vet Med .09/.01 38.3/41.6 .00 7/19 1/2Cog Sci .18/.09 35.7/39.4 .00 4/14 3/3Radiation .09/.01 34/36.8 .00 3/14 1/5Demography .15/.06 40.3/44.4 .00 0/20 1/2Classics .07/.01 38.7/41.2 .27 0/35 0/8Opr Res .03/.00 16.6/17.1 .73 0/18 0/4Plant Phys .08/.02 29.1/31 .03 1/21 0/3Mycology .03/.01 36.8/37.5 1.00 0/16 0/1
Y. Samuel Wang Homophily in Co-authorships 08/11/2019 16 / 18
Avg counterfactual
Observed

• 29% of composite fields
• 8% of terminal fields
Results: Behavioral homophilyTop Level Fields
FieldObs / Exp
P-valueSignificant / Total
↵ FM Term CompJSTOR .11/.05 38.6/41.1 .00 124/1450 82/280Mol/Cell Bio .05/.01 38.2/39.8 .00 29/178 19/44Eco/Evol .06/.02 31.9/33.3 .00 17/257 15/56Economics .11/.02 18.7/20.8 .00 9/136 11/28Sociology .19/.07 38.5/44.2 .00 13/94 12/21Prob/Stat .09/.03 26/27.8 .00 1/90 2/23Org/mkt .16/.04 29/33.2 .00 8/68 3/4Education .16/.04 41.2/47.2 .00 12/42 6/10Occ Health .10/.02 41.7/45.5 .00 12/24 1/1Anthro .12/.03 38.5/42 .00 5/63 2/8Law .17/.08 29.7/32.9 .00 0/98 1/16History .16/.07 32.9/36.5 .00 0/49 1/6Phys Anthro .07/.01 34.7/36.8 .00 1/32 2/10Intl Poli Sci .09/.02 27.3/29.1 .03 0/34 0/2US Poli Sci .15/.07 25.2/27.4 .00 2/37 1/6Philosophy .10/.03 18.7/20.3 .03 0/45 0/8Math .04/.01 14.3/14.7 1.00 0/46 0/9Vet Med .09/.01 38.3/41.6 .00 7/19 1/2Cog Sci .18/.09 35.7/39.4 .00 4/14 3/3Radiation .09/.01 34/36.8 .00 3/14 1/5Demography .15/.06 40.3/44.4 .00 0/20 1/2Classics .07/.01 38.7/41.2 .27 0/35 0/8Opr Res .03/.00 16.6/17.1 .73 0/18 0/4Plant Phys .08/.02 29.1/31 .03 1/21 0/3Mycology .03/.01 36.8/37.5 1.00 0/16 0/1
Y. Samuel Wang Homophily in Co-authorships 08/11/2019 16 / 18
Top Level Fields
FieldObs / Exp
P-valueSignificant / Total
↵ FM Term CompJSTOR .11/.05 38.6/41.1 .00 124/1450 82/280Mol/Cell Bio .05/.01 38.2/39.8 .00 29/178 19/44Eco/Evol .06/.02 31.9/33.3 .00 17/257 15/56Economics .11/.02 18.7/20.8 .00 9/136 11/28Sociology .19/.07 38.5/44.2 .00 13/94 12/21Prob/Stat .09/.03 26/27.8 .00 1/90 2/23Org/mkt .16/.04 29/33.2 .00 8/68 3/4Education .16/.04 41.2/47.2 .00 12/42 6/10Occ Health .10/.02 41.7/45.5 .00 12/24 1/1Anthro .12/.03 38.5/42 .00 5/63 2/8Law .17/.08 29.7/32.9 .00 0/98 1/16History .16/.07 32.9/36.5 .00 0/49 1/6Phys Anthro .07/.01 34.7/36.8 .00 1/32 2/10Intl Poli Sci .09/.02 27.3/29.1 .03 0/34 0/2US Poli Sci .15/.07 25.2/27.4 .00 2/37 1/6Philosophy .10/.03 18.7/20.3 .03 0/45 0/8Math .04/.01 14.3/14.7 1.00 0/46 0/9Vet Med .09/.01 38.3/41.6 .00 7/19 1/2Cog Sci .18/.09 35.7/39.4 .00 4/14 3/3Radiation .09/.01 34/36.8 .00 3/14 1/5Demography .15/.06 40.3/44.4 .00 0/20 1/2Classics .07/.01 38.7/41.2 .27 0/35 0/8Opr Res .03/.00 16.6/17.1 .73 0/18 0/4Plant Phys .08/.02 29.1/31 .03 1/21 0/3Mycology .03/.01 36.8/37.5 1.00 0/16 0/1
Y. Samuel Wang Homophily in Co-authorships 08/11/2019 16 / 18
• Trade-off between increasing testing power by aggregating data versus controlling for confounders by analyzing at a fine-grain level.

http://eigenfactor.org/projects/gender_homophily/
Visualization

How sensitive are our results to missing gender indicators?
• To evaluate, we impute gender for authorships under two scenarios:
• Low homophily: Impute each missing gender indicator at random according to the proportions of assigned genders in the authorship’s original terminal field. Assumes no behavioral homophily in the imputed data.
• High homophily: Impute each missing gender indicator at random according to the proportions of assigned gender in the original paper. If a paper contains only unassigned authorships, impute a single gender for all according to the proportions of assigned gender authorships for the terminal field. Assumes behavioral homophily since, by construction, papers with one or no assigned authorships are always gender homophilous.

• For each scenario, carry out 10 imputations and then repeat the entire sampling and testing procedures used for the main analysis.
• Original results:
• Top fields: 84%
• Composite fields: 28%
• Terminal fields: 8%
How sensitive are our results to missing gender indicators?
E. Sensitivity Analysis: Missing Gender Indicators. To evaluate how sensitive our main results are to the missing gender
indicators, we impute gender for authorships with missing gender indicators under two scenarios:
• Low homophily: Each authorship with a missing gender indicator is assigned a gender at random according to the
proportions of observed genders on its original terminal field. This procedure assumes that there is no behavioral
homophily in the imputed data because the imputed genders are conditionally independent given the terminal field. Thus,
it gives a reasonable lower bound on the homophily we might have observed given the full data.
• High homophily: Each authorship with a missing gender indicator is assigned a gender at random according to the
proportions of observed genders on its original paper. If the original paper contains only authorships with missing gender
indicators, we assign all authorships on the paper the same gender indicator which is drawn randomly according to the
proportions of observed genders for its original terminal field. Because papers with at most one assigned gender indicator
are homophilous by construction, this provides a reasonable upper bound on the homophily we might have observed
given the full data.
For each scenario, we carry out 10 imputations and then repeat the entire sampling and testing procedures used for the
main analysis. Table S8 gives the resulting percentages of terminal, composite, and top level fields with significant behavioral
homophily under the Benjamini-Yekutieli FDR procedure with – = .05 under the low and high homophily missing data
imputation scenarios. We observed that, on average, 7%, 25%, and 78% of terminal, composite, and top level fields exhibit
statistically significant respectively in the low homophily scenario; for the high homophily procedure the corresponding averages
are 54%, 82%, and 100%.
Table S8. Each column shows the percentage of fields which exhibit statistically significant homophily for each of the individual imputations
Terminal Composite TopMain Analysis 0.09 0.29 0.83Low Imputation 1 0.06 0.23 0.83Low Imputation 2 0.07 0.25 0.75Low Imputation 3 0.06 0.25 0.75Low Imputation 4 0.08 0.25 0.75Low Imputation 5 0.06 0.26 0.75Low Imputation 6 0.07 0.28 0.75Low Imputation 7 0.07 0.25 0.83Low Imputation 8 0.07 0.26 0.79Low Imputation 9 0.07 0.25 0.75Low Imputation 10 0.06 0.26 0.79Low Imputation Avg 0.07 0.25 0.78High Imputation 1 0.54 0.82 1.00High Imputation 2 0.53 0.82 1.00High Imputation 3 0.53 0.82 1.00High Imputation 4 0.53 0.82 1.00High Imputation 5 0.54 0.82 1.00High Imputation 6 0.53 0.81 1.00High Imputation 7 0.54 0.82 1.00High Imputation 8 0.54 0.83 1.00High Imputation 9 0.54 0.83 1.00High Imputation 10 0.54 0.82 1.00High Imputation Avg 0.54 0.82 1.00
Y. Samuel Wang, Carole J. Lee, Jevin D. West, Carl T. Bergstrom, Elena A. Erosheva
2481
2482
2483
2484
2485
2486
2487
2488
2489
2490
2491
2492
2493
2494
2495
2496
2497
2498
2499
2500
2501
2502
2503
2504
2505
2506
2507
2508
2509
2510
2511
2512
2513
2514
2515
2516
2517
2518
2519
2520
2521
2522
2523
2524
2525
2526
2527
2528
2529
2530
2531
2532
2533
2534
2535
2536
2537
2538
2539
2540
2541
2542
2543
2544
2545
2546
2547
2548
2549
2550
2551
2552
2553
2554
2555
2556
2557
2558
2559
2560
2561
2562
2563
2564
2565
2566
2567
2568
2569
2570
2571
2572
2573
2574
2575
2576
2577
2578
2579
2580
2581
2582
2583
2584
2585
2586
2587
2588
2589
2590
2591
2592
2593
2594
2595
2596
2597
2598
2599
2600
2601
2602
2603
2604
21 of 22

Secondary analysis
• Fit logistic regression for all terminal fields where the outcome is whether there is statistically significant behavioral homophily
• Result: behavioral homophily has a statistically significant positive association with the proportion of females and terminal field size
• In economics, behavioral homophily was also found to be more prevalent in sub-fields with a higher proportion of females
• Homophily: as representation of women increases, more likely that same-gender individuals who are sufficiently compatible along key dimensions become available as co-authors
• Caveat: Larger field size and balanced gender representation increase power of testing procedure (i.e., ability to detect behavioral gender homophily).
Boschini, Anne, and Anna Sjögren. "Is team formation gender neutral? Evidence from coauthorship patterns." Journal of Labor Economics 25, no. 2 (2007): 325-365.
Conclusion
• We detect behavioral gender homophily in 84% of top fields, 29% of composite fields, and 8% of terminal fields
• Since behavioral gender homophily is endemic to even some of the smallest intellectual communities, it might only be mitigated by changing the cultural norms and perceptions that drive behavioral gender homophily within intellectual communities

Future work: Strategic value of gender homophily?
• Short-term: does gender homophily increase retention, productivity, and impact of female authors?
• Stereotype threat: presence of other women in male-stereotyped domains enhances confidence, performance, and motivation
• Long-term: do gender homophilous co-authorships lead to gender-homophilous intellectual communities? If so, does increasing the ratio of women in an intellectual community decrease its value/impact, just as increasing the ratio of women in an occupation decreases its prestige?
Murphy, Mary C., Claude M. Steele, and James J. Gross. "Signaling threat: How situational cues affect women in math, science, and engineering settings." Psychological science 18, no. 10 (2007): 879-885.
Stout, Jane G., Nilanjana Dasgupta, Matthew Hunsinger, and Melissa A. McManus. "STEMing the tide: using ingroup experts to inoculate women's self-concept in science, technology, engineering, and mathematics (STEM)." Journal of personality and social psychology 100, no. 2 (2011): 255.
Goldin, Claudia. "A pollution theory of discrimination: male and female differences in occupations and earnings." In Human capital in history: The American record, pp. 313-348. University of Chicago Press, 2014.

Future work: Fine-tuning methods
• Temporal aspects: Gender representation changes over time. Incorporate temporal info into the null distribution.
• Disambiguating authors: In terminal fields with few female authors, we may overestimate structural and compositional homophily (and underestimate behavioral homophily) by allowing multiple female authorships corresponding to the same author to be reassigned to the same paper.
Thank you
• For early discussions:
• Jennifer Jacquet, Molly King, Shelley Correll, & Ted Bergstrom
• Funders:
• Royalty Research Fund Grant #A118374, Elena Erosheva (PI) and Carole Lee (co-PI)
• NSF Grant #1735194, Jevin West (co-PI)

For more information
• Link to paper: http://arxiv.org/abs/1909.01284
• Visualization: http://eigenfactor.org/projects/gender_homophily/
• Code for analysis and plots: https://github.com/ysamwang/genderHomophily
• Data: Under license by JSTOR to the authors. Requests for raw data should be made to JSTOR directly.

Size of each top level field
2. JSTOR Description
Table S1 shows the size of each of the 24 top level fields identified by the map equation. The values are calculated for all papers
published after 1959. Note that the table describes the data prior to the data cleaning procedure, so counts of authorships,
papers, terminal fields and composite fields shown here may di�er from those given in the main manuscript which refer to data
after the cleaning procedure. Specifically, Classics, Law, and Philosophy have entire terminal fields which are removed by the
cleaning procedure. Table S2 presents the structural characteristics of each top level field. For the multi-author columns, we
report the proportion amongst all authorships on a multi-author paper; e.g., all female authorships on multi-authored papers
divided by the total count of authorships on multi-authored papers. For the intraclass correlation (ICC) of individuals with
unimputed genders, we use the flAOV statistic from (1). This gives a measure of how unimputed authorships cluster by paper.
Anecdotally, unimputed authorships are often names which have been Romanized. Thus a high ICC may indicate homophily
by race or ethnicity.
Table S1. Size of each of the top level fields identified by the map equation hierarchical clustering
Authors Papers Terminal CompositeLabel (Count) (Count) Fields FieldsAnthropology 37588 30499 63 8Classical studies 10596 9061 37 8Cognitive science 15715 5553 14 3Demography 9653 5509 20 2Ecology and evolution 264853 116327 257 56Economics 95934 59096 136 28Education 40188 23065 42 10History 26449 24043 49 6Law 23974 19779 105 16Mathematics 18348 14125 46 9Molecular & Cell biology 382971 92528 178 44Mycology 7469 3679 16 1Operations research 13716 7780 18 4Organizational and marketing 34254 17963 68 4Philosophy 21738 19126 46 8Physical anthropology 29693 16703 32 10Plant physiology 9159 5436 21 3Political science - international 15283 11835 34 2Political science-US domestic 12581 7824 37 6Pollution and occupational health 50967 12359 24 1Probability and Statistics 37471 22094 90 23Radiation damage 14118 4215 14 5Sociology 57146 31662 94 21Veterinary medicine 17756 4796 19 2
Y. Samuel Wang, Carole J. Lee, Jevin D. West, Carl T. Bergstrom, Elena A. Erosheva
249
250
251
252
253
254
255
256
257
258
259
260
261
262
263
264
265
266
267
268
269
270
271
272
273
274
275
276
277
278
279
280
281
282
283
284
285
286
287
288
289
290
291
292
293
294
295
296
297
298
299
300
301
302
303
304
305
306
307
308
309
310
311
312
313
314
315
316
317
318
319
320
321
322
323
324
325
326
327
328
329
330
331
332
333
334
335
336
337
338
339
340
341
342
343
344
345
346
347
348
349
350
351
352
353
354
355
356
357
358
359
360
361
362
363
364
365
366
367
368
369
370
371
372
3 of 22
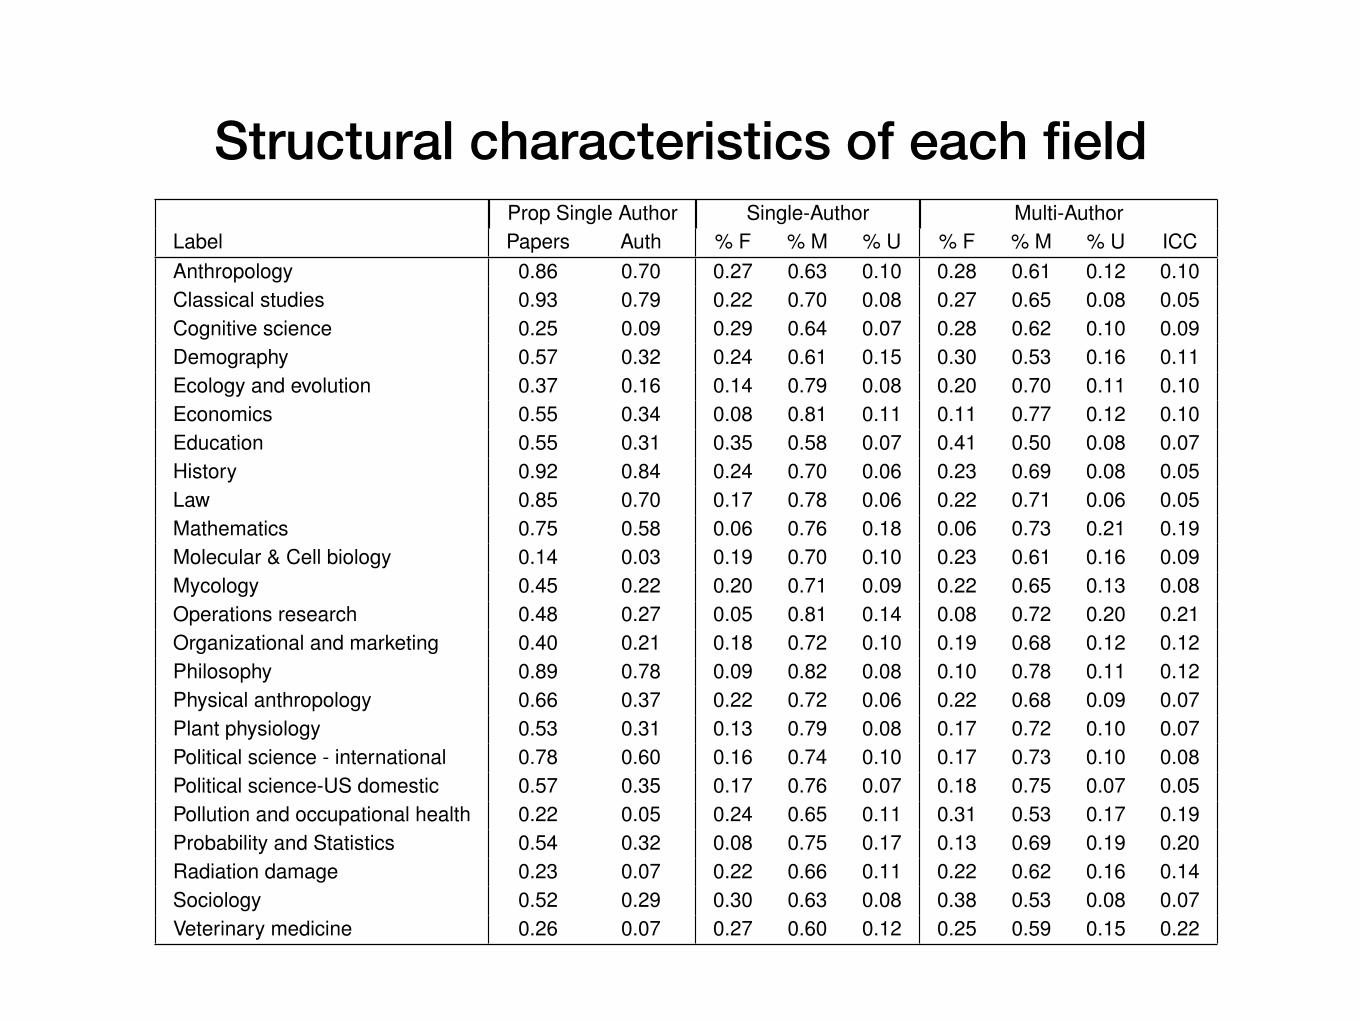
Structural characteristics of each field
Table S2. The structural characteristics of each top level field identified by the map equation hierarchical clustering. The “Prop Single-Author”columns display the proportion of papers (authorships) which are single-authored out of all papers (authorships). The “Single-author” (“Multi-Author”) column give the proportions of all authorships on single-authored (multi-authored) papers which were imputed a gender based onfirst name. F- Female; M- Male; U- Unimputed. The “ICC” column displays the intraclass correlation of unimputed authorships on multi-authorpapers.
Prop Single Author Single-Author Multi-AuthorLabel Papers Auth % F % M % U % F % M % U ICCAnthropology 0.86 0.70 0.27 0.63 0.10 0.28 0.61 0.12 0.10Classical studies 0.93 0.79 0.22 0.70 0.08 0.27 0.65 0.08 0.05Cognitive science 0.25 0.09 0.29 0.64 0.07 0.28 0.62 0.10 0.09Demography 0.57 0.32 0.24 0.61 0.15 0.30 0.53 0.16 0.11Ecology and evolution 0.37 0.16 0.14 0.79 0.08 0.20 0.70 0.11 0.10Economics 0.55 0.34 0.08 0.81 0.11 0.11 0.77 0.12 0.10Education 0.55 0.31 0.35 0.58 0.07 0.41 0.50 0.08 0.07History 0.92 0.84 0.24 0.70 0.06 0.23 0.69 0.08 0.05Law 0.85 0.70 0.17 0.78 0.06 0.22 0.71 0.06 0.05Mathematics 0.75 0.58 0.06 0.76 0.18 0.06 0.73 0.21 0.19Molecular & Cell biology 0.14 0.03 0.19 0.70 0.10 0.23 0.61 0.16 0.09Mycology 0.45 0.22 0.20 0.71 0.09 0.22 0.65 0.13 0.08Operations research 0.48 0.27 0.05 0.81 0.14 0.08 0.72 0.20 0.21Organizational and marketing 0.40 0.21 0.18 0.72 0.10 0.19 0.68 0.12 0.12Philosophy 0.89 0.78 0.09 0.82 0.08 0.10 0.78 0.11 0.12Physical anthropology 0.66 0.37 0.22 0.72 0.06 0.22 0.68 0.09 0.07Plant physiology 0.53 0.31 0.13 0.79 0.08 0.17 0.72 0.10 0.07Political science - international 0.78 0.60 0.16 0.74 0.10 0.17 0.73 0.10 0.08Political science-US domestic 0.57 0.35 0.17 0.76 0.07 0.18 0.75 0.07 0.05Pollution and occupational health 0.22 0.05 0.24 0.65 0.11 0.31 0.53 0.17 0.19Probability and Statistics 0.54 0.32 0.08 0.75 0.17 0.13 0.69 0.19 0.20Radiation damage 0.23 0.07 0.22 0.66 0.11 0.22 0.62 0.16 0.14Sociology 0.52 0.29 0.30 0.63 0.08 0.38 0.53 0.08 0.07Veterinary medicine 0.26 0.07 0.27 0.60 0.12 0.25 0.59 0.15 0.22
The plots below show how the following quantities have changed over time for each top level fields- average number of
authors per paper, proportion of papers with multiple authors, and the imputed gender proportions. The values are calculated
on the data before the data-cleaning procedure which removes authorship instances with unimputed genders.
4 of 22
373
374
375
376
377
378
379
380
381
382
383
384
385
386
387
388
389
390
391
392
393
394
395
396
397
398
399
400
401
402
403
404
405
406
407
408
409
410
411
412
413
414
415
416
417
418
419
420
421
422
423
424
425
426
427
428
429
430
431
432
433
434
435
436
437
438
439
440
441
442
443
444
445
446
447
448
449
450
451
452
453
454
455
456
457
458
459
460
461
462
463
464
465
466
467
468
469
470
471
472
473
474
475
476
477
478
479
480
481
482
483
484
485
486
487
488
489
490
491
492
493
494
495
496
Y. Samuel Wang, Carole J. Lee, Jevin D. West, Carl T. Bergstrom, Elena A. Erosheva

C. Calculating and adjusting P-values. In a sampled configuration, if a field only contains authorships of a single gender, – is
undefined. When calculating a p-value, we consider this as – = 1. This approach is conservative because it increases p-values,
but in practice has very little e�ect on our results.
In the main manuscript, we control the false discovery rate at .05 with the Benjamini-Yekutieli procedure (5) which allows
for arbitrary dependence of the p-values, but is more conservative than the Benjamini-Hochberg procedure (6), which only
allows for certain types of positive dependence. Table S5 replicates the last 3 columns of Table 1 of the main manuscript using
the Benjamini-Yekutieli procedure with an FDR of .005 as well as the Benjamini-Hochberg procedure with FDR rates of .05
and .005.
Table S5. Main results using different FDR procedures. “BY” indicated Benjamini-Yekutieli and “BH” indicates Benjamini-Hochberg.
BY; Rate = .005 BH; Rate = .005 BH; Rate = .05Field P-value Term Comp P-value Term Comp P-value Term CompJSTOR .00 68/1450 65/280 .00 114/1450 81/280 .00 261/1450 125/280Mol/Cell Bio .00 16/178 18/44 .00 28/178 19/44 .00 53/178 29/44Eco/Evol .00 7/257 13/56 .00 14/257 15/56 .00 43/257 25/56Economics .00 4/136 8/28 .00 8/136 11/28 .00 25/136 17/28Sociology .00 9/94 9/21 .00 12/94 12/21 .00 26/94 14/21Prob/Stat .00 0/90 1/23 .00 1/90 2/23 .00 7/90 7/23Org/mkt .00 5/68 3/4 .00 6/68 3/4 .00 15/68 3/4Education .00 6/42 4/10 .00 10/42 6/10 .00 17/42 6/10Occ Health .00 8/24 1/1 .00 12/24 1/1 .00 15/24 1/1Anthro .00 2/63 1/8 .00 5/63 2/8 .00 8/63 2/8Law .00 0/98 0/16 .00 0/98 1/16 .00 1/98 4/16History .00 0/49 0/6 .00 0/49 1/6 .00 1/49 1/6Phys Anthro .00 1/32 2/10 .00 1/32 2/10 .00 6/32 3/10Intl Poli Sci .03 0/34 0/2 .00 0/34 0/2 .00 3/34 0/2US Poli Sci .00 0/37 0/6 .00 2/37 1/6 .00 4/37 3/6Philosophy .03 0/45 0/8 .00 0/45 0/8 .00 5/45 0/8Math 1.00 0/46 0/9 .16 0/46 0/9 .16 2/46 0/9Vet Med .00 5/19 1/2 .00 7/19 1/2 .00 8/19 2/2Cog Sci .00 2/14 3/3 .00 4/14 3/3 .00 7/14 3/3Radiation .00 3/14 1/5 .00 3/14 1/5 .00 5/14 3/5Demography .00 0/20 0/2 .00 0/20 0/2 .00 3/20 2/2Classics .27 0/35 0/8 .03 0/35 0/8 .03 1/35 0/8Opr Res .73 0/18 0/4 .09 0/18 0/4 .09 1/18 0/4Plant Phys .03 0/21 0/3 .00 1/21 0/3 .00 4/21 0/3Mycology 1.00 0/16 0/1 .27 0/16 0/1 .27 1/16 0/1
Y. Samuel Wang, Carole J. Lee, Jevin D. West, Carl T. Bergstrom, Elena A. Erosheva
2233
2234
2235
2236
2237
2238
2239
2240
2241
2242
2243
2244
2245
2246
2247
2248
2249
2250
2251
2252
2253
2254
2255
2256
2257
2258
2259
2260
2261
2262
2263
2264
2265
2266
2267
2268
2269
2270
2271
2272
2273
2274
2275
2276
2277
2278
2279
2280
2281
2282
2283
2284
2285
2286
2287
2288
2289
2290
2291
2292
2293
2294
2295
2296
2297
2298
2299
2300
2301
2302
2303
2304
2305
2306
2307
2308
2309
2310
2311
2312
2313
2314
2315
2316
2317
2318
2319
2320
2321
2322
2323
2324
2325
2326
2327
2328
2329
2330
2331
2332
2333
2334
2335
2336
2337
2338
2339
2340
2341
2342
2343
2344
2345
2346
2347
2348
2349
2350
2351
2352
2353
2354
2355
2356
19 of 22
Readjust the Benjamini-Yekutieli procedure to control the false discovery rate at 0.005 instead of 0.05

Previous work
• Field-level:
• Economics: study of publications from cohort of 178 PhDs found women > 5x more likely than men to have female co-authors
• A study of 1,045,401 multi-authored papers finds gender homophily at what we’d characterize as the field level
• Sub-field studies:
• Economics: Study of 3,090 articles in the top three journals (1991-2002) found gender homophily at the sub-field level
McDowell, John M., and Janet Kiholm Smith. "The effect of gender-sorting on propensity to coauthor: Implications for academic promotion." Economic Inquiry 30, no. 1 (1992): 68-82.
AlShebli, Bedoor K., Talal Rahwan, and Wei Lee Woon. "The preeminence of ethnic diversity in scientific collaboration." Nature communications 9, no. 1 (2018): 5163.
Boschini, Anne, and Anna Sjögren. "Is team formation gender neutral? Evidence from coauthorship patterns." Journal of Labor Economics 25, no. 2 (2007): 325-365.

Structural versus compositional homophily
B. Comparison with Naive Approach. We can compare the expected value of – from the null distribution which accounts
for structural and compositional homophily (Eq. (2) in the main document) to the expected value of – from a naive null
distribution which only accounts for structural homophily. We construct a naive null distribution for each level l = 1, . . . , 6 in
the full hierarchical clustering by preserving all structure of (terminal or composite) fields with depth less than l, but treating
all fields of depth l as a terminal field. We then recalculate the swap probabilities pfa,fúa
given the citation flows, and then
run the sampler for 5,000 samples. We discard the first 1,000 as burn in and use the remaining 4,000 samples to calculate an
expected value and calculate p-values.
Columns labeled “Struct” provide the expected value of –, the expected number of female-male papers, the p-value for
behavioral homophily, and the number of significant composite fields under the null hypothesis of only structural (but not
compositional) homophily. Under only structural homophily, the expected – value is smaller than the expected – when also
preserving compositional homophily. In addition, the p-value decreases for all top-level fields when only considering structural
homophily. In many top-level fields, the number of composite fields with behavioral increases when only capturing structural
homophily and never decreases.
Table S4. Comparison of naive analysis only preserving structural homophily to main analysis.
– F M P-values Signif CompField Obs Exp Struct Obs Exp Struct Main Struct Main StructJSTOR .11 .05 .00 38.6 41.1 43.3 .00 .00 82/280 157/280Mol/Cell Bio .05 .01 .00 38.2 39.8 40.2 .00 .00 19/44 35/44Eco/Evol .06 .02 .00 31.9 33.3 34.0 .00 .00 15/56 33/56Economics .11 .02 .00 18.7 20.8 21.1 .00 .00 11/28 18/28Sociology .19 .07 .00 38.5 44.2 47.4 .00 .00 12/21 19/21Prob/Stat .09 .03 .00 26.0 27.8 28.6 .00 .00 2/23 12/23Org/mkt .16 .04 .00 29.0 33.2 34.7 .00 .00 3/4 4/4Education .16 .04 .00 41.2 47.2 49.2 .00 .00 6/10 9/10Occ Health .10 .02 .00 41.7 45.5 46.3 .00 .00 1/1 1/1Anthro .12 .03 .00 38.5 42.0 43.5 .00 .00 2/8 4/8Law .17 .08 .00 29.7 32.9 35.7 .00 .00 1/16 4/16History .16 .07 .00 32.9 36.5 39.1 .00 .00 1/6 2/6Phys Anthro .07 .01 .00 34.7 36.8 37.1 .00 .00 2/10 2/10Intl Poli Sci .09 .02 .00 27.3 29.1 29.8 .03 .00 0/2 1/2US Poli Sci .15 .07 .00 25.2 27.4 29.6 .00 .00 1/6 2/6Philosophy .10 .03 .00 18.7 20.3 20.8 .03 .00 0/8 0/8Math .04 .01 .00 14.3 14.7 14.9 1.00 .12 0/9 0/9Vet Med .09 .01 .00 38.3 41.6 42.0 .00 .00 1/2 2/2Cog Sci .18 .09 .00 35.7 39.4 43.3 .00 .00 3/3 3/3Radiation .09 .01 .00 34.0 36.8 37.3 .00 .00 1/5 4/5Demography .15 .06 .00 40.3 44.4 47.3 .00 .00 1/2 1/2Classics .07 .01 .00 38.7 41.2 41.7 .27 .01 0/8 0/8Opr Res .03 .00 .00 16.6 17.1 17.1 .73 .33 0/4 0/4Plant Phys .08 .02 .00 29.1 31.0 31.8 .03 .00 0/3 1/3Mycology .03 .01 .00 36.8 37.5 37.9 1.00 .60 0/1 0/1
18 of 22
2109
2110
2111
2112
2113
2114
2115
2116
2117
2118
2119
2120
2121
2122
2123
2124
2125
2126
2127
2128
2129
2130
2131
2132
2133
2134
2135
2136
2137
2138
2139
2140
2141
2142
2143
2144
2145
2146
2147
2148
2149
2150
2151
2152
2153
2154
2155
2156
2157
2158
2159
2160
2161
2162
2163
2164
2165
2166
2167
2168
2169
2170
2171
2172
2173
2174
2175
2176
2177
2178
2179
2180
2181
2182
2183
2184
2185
2186
2187
2188
2189
2190
2191
2192
2193
2194
2195
2196
2197
2198
2199
2200
2201
2202
2203
2204
2205
2206
2207
2208
2209
2210
2211
2212
2213
2214
2215
2216
2217
2218
2219
2220
2221
2222
2223
2224
2225
2226
2227
2228
2229
2230
2231
2232
Y. Samuel Wang, Carole J. Lee, Jevin D. West, Carl T. Bergstrom, Elena A. Erosheva

Data reduction due to unimputed gender
3. Data Cleaning Procedures
For the main analysis, we impute gender indicators for authorships with first names that are used for a single gender with at
least 95% frequency in either the U.S. Social Security records or in the genderizeR database. We consider the gender indicator
to be missing for authorships that either do not appear in those databases or are not used with at least 95% frequency for
one gender. We subsequenty remove authorships with unimputed genders from our main analysis. This removal results in
some articles which originally had multiple authors becoming single author papers, which are excluded from the analysis.
The following table shows the proportion of authorships and papers which are lost solely due to unimputed genders. The
denominator only includes papers which have multiple authors which were published from 1960-2012. The % unimputed
column is the % of authors for which we do not impute a gender indicator. The % Lost column is the % of authors (or papers)
which are lost after removing the authorships with unimputed gender indicators and then removing the resulting single author
papers. For authorships, this percentage includes the authorships with unimputed genders.
Table S3. Data reduction due to unimputed gender indicators
Prop Authors with Authors PapersLabel Unimputed Gender Remaining Prop Lost Remaining Prop LostAnthropology 0.12 9326 0.17 3466 0.15Classical studies 0.08 1976 0.11 610 0.09Cognitive science 0.10 12510 0.13 3814 0.07Demography 0.16 5069 0.22 1930 0.17Ecology and evolution 0.11 192091 0.13 66152 0.08Economics 0.12 51691 0.19 22178 0.15Education 0.08 24356 0.12 9396 0.09History 0.08 3699 0.12 1596 0.11Law 0.06 6526 0.10 2765 0.09Mathematics 0.21 5319 0.31 2459 0.25Molecular & Cell biology 0.16 303761 0.18 73357 0.07Mycology 0.13 4828 0.17 1759 0.11Operations research 0.20 7217 0.28 3025 0.21Organizational and marketing 0.12 22299 0.18 9137 0.13Philosophy 0.11 3897 0.18 1770 0.15Physical anthropology 0.09 16463 0.12 5175 0.07Plant physiology 0.10 5388 0.14 2287 0.10Political science - international 0.10 5128 0.16 2247 0.14Political science-US domestic 0.07 7269 0.11 3068 0.09Pollution and occupational health 0.17 39703 0.18 8845 0.06Probability and Statistics 0.19 18763 0.27 7600 0.21Radiation damage 0.16 10710 0.18 2902 0.09Sociology 0.08 35858 0.12 13600 0.09Veterinary medicine 0.15 13741 0.17 3275 0.06Total 0.14 807588 0.16 252413 0.11
Y. Samuel Wang, Carole J. Lee, Jevin D. West, Carl T. Bergstrom, Elena A. Erosheva
1489
1490
1491
1492
1493
1494
1495
1496
1497
1498
1499
1500
1501
1502
1503
1504
1505
1506
1507
1508
1509
1510
1511
1512
1513
1514
1515
1516
1517
1518
1519
1520
1521
1522
1523
1524
1525
1526
1527
1528
1529
1530
1531
1532
1533
1534
1535
1536
1537
1538
1539
1540
1541
1542
1543
1544
1545
1546
1547
1548
1549
1550
1551
1552
1553
1554
1555
1556
1557
1558
1559
1560
1561
1562
1563
1564
1565
1566
1567
1568
1569
1570
1571
1572
1573
1574
1575
1576
1577
1578
1579
1580
1581
1582
1583
1584
1585
1586
1587
1588
1589
1590
1591
1592
1593
1594
1595
1596
1597
1598
1599
1600
1601
1602
1603
1604
1605
1606
1607
1608
1609
1610
1611
1612
13 of 22