GENDER ASSESSMENT REPORT SUMMARY - europa.eu
81
GENDER ASSESSMENT REPORT SUMMARY Submitted to Quality Assurance Manager World Vision South Sudan By: Kenwill International Limited P. O BOX 27622, Kampala, Uganda 0782 446015 (Robert) E-mail: [email protected] E-mail: [email protected] [email protected] July 2015
Transcript of GENDER ASSESSMENT REPORT SUMMARY - europa.eu

GENDER ASSESSMENT REPORT SUMMARY
Submitted to
Quality Assurance Manager
World Vision South Sudan
By:
Kenwill International Limited
P. O BOX 27622, Kampala, Uganda
0782 446015 (Robert)
E-mail: [email protected]
E-mail: [email protected]
July 2015
Contents
Background .......................................................................................................................................................................... 3
1.1 Project Summary .................................................................................................................................................... 3
1.2 Purpose of Gender Assessment ......................................................................................................................... 3
1.3 Project Location and Areas Assessed ............................................................................................................... 3
1.4 Structure of the Report ........................................................................................................................................ 4
METHODOLOGY ............................................................................................................................................................ 4
2.1 Study Design ............................................................................................................................................................ 4
2.2 Process of Gender Assessment .......................................................................................................................... 4
2.3 Methods of Data Collection ................................................................................................................................ 4
2.4 Sampling and Sample Size ..................................................................................................................................... 5
2.5 Data Analysis ........................................................................................................................................................... 6
2.6 Validity and Reliability of Finding ........................................................................................................................ 6
2.7 Challenges Faced in the Assessment ................................................................................................................. 6
2.8 Limitation of the Assessment .............................................................................................................................. 6
Quantitative Findings ........................................................................................................................................................ 7
ANNEXES ......................................................................................................................................................................... 22
I. References ................................................................................................................................................................... 22
II. Gender Assessment Tools Used ............................................................................................................................... 22
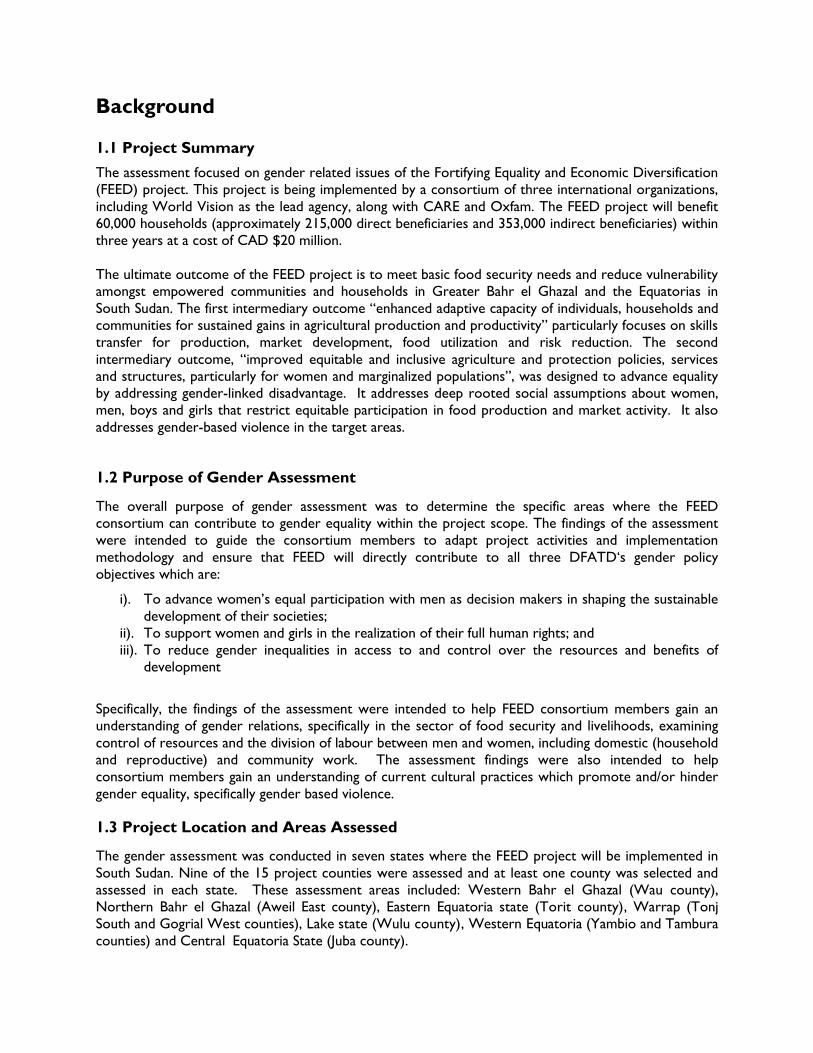
Background
1.1 Project Summary
The assessment focused on gender related issues of the Fortifying Equality and Economic Diversification
(FEED) project. This project is being implemented by a consortium of three international organizations,
including World Vision as the lead agency, along with CARE and Oxfam. The FEED project will benefit
60,000 households (approximately 215,000 direct beneficiaries and 353,000 indirect beneficiaries) within
three years at a cost of CAD $20 million.
The ultimate outcome of the FEED project is to meet basic food security needs and reduce vulnerability
amongst empowered communities and households in Greater Bahr el Ghazal and the Equatorias in
South Sudan. The first intermediary outcome “enhanced adaptive capacity of individuals, households and
communities for sustained gains in agricultural production and productivity” particularly focuses on skills
transfer for production, market development, food utilization and risk reduction. The second
intermediary outcome, “improved equitable and inclusive agriculture and protection policies, services
and structures, particularly for women and marginalized populations”, was designed to advance equality
by addressing gender-linked disadvantage. It addresses deep rooted social assumptions about women,
men, boys and girls that restrict equitable participation in food production and market activity. It also
addresses gender-based violence in the target areas.
1.2 Purpose of Gender Assessment
The overall purpose of gender assessment was to determine the specific areas where the FEED
consortium can contribute to gender equality within the project scope. The findings of the assessment
were intended to guide the consortium members to adapt project activities and implementation
methodology and ensure that FEED will directly contribute to all three DFATD‘s gender policy
objectives which are:
i). To advance women’s equal participation with men as decision makers in shaping the sustainable
development of their societies;
ii). To support women and girls in the realization of their full human rights; and
iii). To reduce gender inequalities in access to and control over the resources and benefits of
development
Specifically, the findings of the assessment were intended to help FEED consortium members gain an
understanding of gender relations, specifically in the sector of food security and livelihoods, examining
control of resources and the division of labour between men and women, including domestic (household
and reproductive) and community work. The assessment findings were also intended to help
consortium members gain an understanding of current cultural practices which promote and/or hinder
gender equality, specifically gender based violence.
1.3 Project Location and Areas Assessed
The gender assessment was conducted in seven states where the FEED project will be implemented in
South Sudan. Nine of the 15 project counties were assessed and at least one county was selected and
assessed in each state. These assessment areas included: Western Bahr el Ghazal (Wau county),
Northern Bahr el Ghazal (Aweil East county), Eastern Equatoria state (Torit county), Warrap (Tonj
South and Gogrial West counties), Lake state (Wulu county), Western Equatoria (Yambio and Tambura
counties) and Central Equatoria State (Juba county).
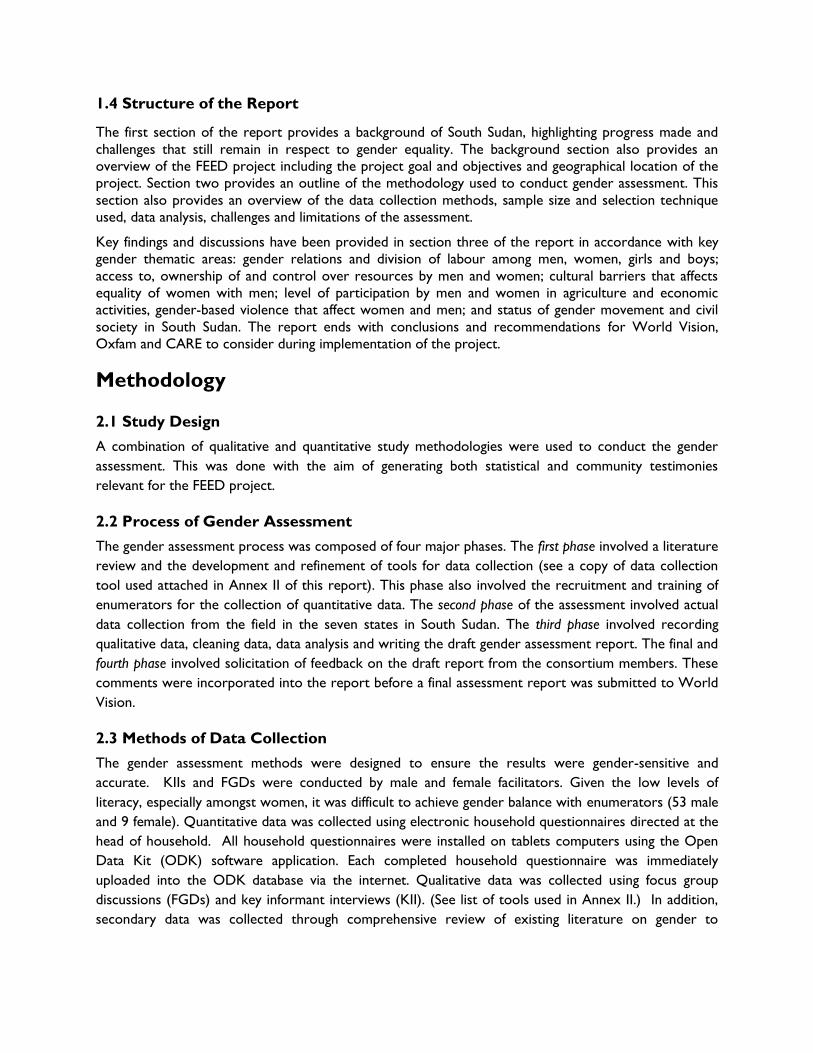
1.4 Structure of the Report
The first section of the report provides a background of South Sudan, highlighting progress made and
challenges that still remain in respect to gender equality. The background section also provides an
overview of the FEED project including the project goal and objectives and geographical location of the
project. Section two provides an outline of the methodology used to conduct gender assessment. This
section also provides an overview of the data collection methods, sample size and selection technique
used, data analysis, challenges and limitations of the assessment.
Key findings and discussions have been provided in section three of the report in accordance with key
gender thematic areas: gender relations and division of labour among men, women, girls and boys;
access to, ownership of and control over resources by men and women; cultural barriers that affects
equality of women with men; level of participation by men and women in agriculture and economic
activities, gender-based violence that affect women and men; and status of gender movement and civil
society in South Sudan. The report ends with conclusions and recommendations for World Vision,
Oxfam and CARE to consider during implementation of the project.
Methodology
2.1 Study Design
A combination of qualitative and quantitative study methodologies were used to conduct the gender
assessment. This was done with the aim of generating both statistical and community testimonies
relevant for the FEED project.
2.2 Process of Gender Assessment
The gender assessment process was composed of four major phases. The first phase involved a literature
review and the development and refinement of tools for data collection (see a copy of data collection
tool used attached in Annex II of this report). This phase also involved the recruitment and training of
enumerators for the collection of quantitative data. The second phase of the assessment involved actual
data collection from the field in the seven states in South Sudan. The third phase involved recording
qualitative data, cleaning data, data analysis and writing the draft gender assessment report. The final and
fourth phase involved solicitation of feedback on the draft report from the consortium members. These
comments were incorporated into the report before a final assessment report was submitted to World
Vision.
2.3 Methods of Data Collection
The gender assessment methods were designed to ensure the results were gender-sensitive and
accurate. KIIs and FGDs were conducted by male and female facilitators. Given the low levels of
literacy, especially amongst women, it was difficult to achieve gender balance with enumerators (53 male
and 9 female). Quantitative data was collected using electronic household questionnaires directed at the
head of household. All household questionnaires were installed on tablets computers using the Open
Data Kit (ODK) software application. Each completed household questionnaire was immediately
uploaded into the ODK database via the internet. Qualitative data was collected using focus group
discussions (FGDs) and key informant interviews (KII). (See list of tools used in Annex II.) In addition,
secondary data was collected through comprehensive review of existing literature on gender to

supplement on primary data collected from the field. A list of references reviewed is attached to this
report.
2.4 Sampling and Sample Size
A total of 637 respondents (259 male and 378 female) from seven states and nine counties participated
in the survey. A total of 9 women-only and 5men-only FGDs and 15 KIIs were held in all seven states to
ensure both men and women were given the space to independently discuss issues that affect them
without any interference. KIIs consisted of leading civil society actors and government officials especially
those from State Ministry of Agriculture and Ministry of Gender selected from four states. Participants
for both KIIs and FGDs were purposely selected based on sex, experience and roles they play in the
community and government at different level.
a) Quantitative Survey Sample determination
The quantitative survey sample size was determined using Cochran’s Z-formula of proportional
allocation given by; (no) = (N)/ [1 + N (e)2 ]; where:
n0=Sample size
N=Population (Number of households targeted by the project) =60,000 households
E=Margin of error =0.04 or 4%
Therefore using the Cochran Z-formula, the sample size (no) = (60,000)/ [1 + 60,000 * (0.04)2] was
619. The adjusted sample size at 90% expected response rate aimed at minimizing non-response
error was 687. Therefore 619 ≤ n ≤ 687 was considered to be satisfactory for this survey. The actual
sample of 637 respondents was within the above specified limits.
Using proportion to size allocation formula; nij=(ni∕N)*n the sample size of 687 was distributed to the
different states, counties and payams according to the target beneficiary household population. The
sample was composed of 59.3% women respondents and 40.7% male respondents from sampled
households. More women were targeted because they are the most marginalized and require to be
given space to participate in process like the gender assessment. Most gender concerns greatly affect
women rights and welfare.
b) Sampling of Survey Areas and Survey Respondents
The gender assessment covered all the seven states to be covered by FEED project. The same nine
counties surveyed in the FEED baseline were used in this study. Counties, payams, bomas and villages
were selected using simple random sampling without replacement. Therefore, nine counties were
sampled. In each payam, at least two bomas from which two villages in each were randomly selected.
While standing in the middle of a selected village and one compass direct was randomly selected. The
immediate household in the chosen compass direction marked the random start household. Men and
women in the chosen direction were interchangeably interviewed till required village sample was
realized.
The sampling approach was necessitated by limited information vital for use of simple random sampling.
The only information available for sampling was summary of households and individual population per
state, county, payam and bomas. The boma names were coded without limited information and the
villages were unknown. Even lists of households were also absent. The sampling approach was therefore
selected to address above challenges and yet ensure that the sampling process was random as possible.
2.5 Data Analysis
The analysis of data collected was done using qualitative and quantitative methodologies. Quantitative
data collected was downloaded from the ODK database and transferred into Microsoft Excel for the
purposes of cleaning and definition of variables assessed. Quantitative data was later transferred into
SPSS computer software for further analysis and generation of relevant tables and graphs. Qualitative
data was analyzed using content analysis following key thematic areas of the assessment. This involved
reducing and summarizing data with common trends while noting differences represented within the
data.
2.6 Validity and Reliability of Finding
The data collection instruments were pre-tested and adjusted before they were used to collect actual
data used for this assessment and enumerators were trained on how to use the various data collection
instruments. These enumerators were also trained on key research ethics to follow during data
collection. All these measures enhanced the quality and reliability of the data collected.
2.7 Challenges Faced in the Assessment
The assessment team faced the following challenges during the data collection:
Data collection in some states (Lakes and WBG) was disrupted by concerns of insecurity in
selected payams and bomas. This limited the ability of the assessment team to collect the
targeted sample size for both qualitative and quantitative data within the planned schedule. This
lowered the reliability of the data in those areas.
Inadequate coordination and mobilization of enumerators in some states, such as CEQ and EEQ.
This impacted the ability of the assessment team to collect the targeted sample size for both
qualitative and quantitative data.
Most primary data on gender was collected at state level and less at national level due to limited
time
The above challenges were addressed by the assessment team during data collection by undertaking a
number of strategies: 1) the original planned timeframe for data collection was extended to allow data
collection from states at a time of enhanced security; 2) the assessment team worked closely with the
field staff of partner organizations to enhance coordination and mobilization of respondents in different
states; 3) a comprehensive review of existing secondary literature for national level gender issues was
conducted to supplement data collected at state level.
2.8 Limitation of the Assessment
This gender assessment was only for seven states in South Sudan. The findings of this
assessment should not be generalized as a comprehensive gender assessment for the entirety of
South Sudan.

This gender assessment did not comprehensively cover gender issues related to education,
health and employment.
Most of the issues covered in the assessment focused on gender issues which men and women
experienced between 2005 and 2015. The assessment did not cover war or gender related
issues related to the pre-Comprehensive Peace Agreement period.
Quantitative Findings
Table 1: Reproductive activities - cooking for the family
Gender
Responsible
South Sudan State
Total
Central
Equatoria
Eastern
Equatoria Lakes
Northern Bahr
el Ghazal Warrap
Western Bahr
el Ghazal
Western
Equatoria
Men 0 3 1 0 1 2 3 10
.0% 2.8% 2.0% .0% .6% 6.1% 1.5% 1.6%
Women 41 95 39 26 129 26 181 537
91.1% 89.6% 78.0% 86.7% 78.7% 78.8% 89.6% 85.2%
Boys 0 0 1 0 2 0 4 7
.0% .0% 2.0% .0% 1.2% .0% 2.0% 1.1%
Girls 4 8 9 4 32 5 14 76
8.9% 7.5% 18.0% 13.3% 19.5% 15.2% 6.9% 12.1%
Total 45 106 50 30 164 33 202 630
100.0% 100.0% 100.0% 100.0% 100.0% 100.0% 100.0% 100.0%
Source: Primary data
Table 2: Reproductive activities - fetching water
Gender Responsible
South Sudan State
Total
Central
Equatoria
Eastern
Equatoria Lakes
Northern Bahr
el Ghazal Warrap
Western Bahr
el Ghazal
Western
Equatoria
Men 1 3 3 1 0 3 8 19
2.2% 2.8% 6.0% 3.2% .0% 9.7% 4.0% 3.0%
Women 33 93 31 23 98 15 132 425
73.3% 86.9% 62.0% 74.2% 59.4% 48.4% 66.0% 67.6%
Boys 1 0 2 2 9 8 14 36
2.2% .0% 4.0% 6.5% 5.5% 25.8% 7.0% 5.7%
Girls 10 11 14 5 58 5 46 149
22.2% 10.3% 28.0% 16.1% 35.2% 16.1% 23.0% 23.7%
Total 45 107 50 31 165 31 200 629
100.0% 100.0% 100.0% 100.0% 100.0% 100.0% 100.0% 100.0%
Source: Primary data
Table 3: Reproductive activities - collecting firewood Gender
Responsible
South Sudan State
Total Central
Equatoria Eastern
Equatoria Lakes Northern Bahr
el Ghazal Warrap Western Bahr
el Ghazal Western Equatoria
Men 2 2 6 3 18 15 11 57
4.4% 1.9% 12.0% 10.3% 11.1% 46.9% 5.5% 9.1%
Women 39 98 28 18 86 13 150 432
86.7% 91.6% 56.0% 62.1% 53.1% 40.6% 74.6% 69.0%
Boys 1 0 1 1 9 4 18 34
2.2% .0% 2.0% 3.4% 5.6% 12.5% 9.0% 5.4%
Girls 3 7 15 7 49 0 22 103
6.7% 6.5% 30.0% 24.1% 30.2% .0% 10.9% 16.5%
Total 45 107 50 29 162 32 201 626
100.0% 100.0% 100.0% 100.0% 100.0% 100.0% 100.0% 100.0%
Source: Primary data

Table 4: Reproductive activities – cultivating crops for home consumption
Gender Responsible
South Sudan State
Total Central
Equatoria Eastern
Equatoria Lakes Northern Bahr
el Ghazal Warrap Western Bahr
el Ghazal Western Equatoria
Men 23 77 36 22 120 15 136 429
56.1% 72.6% 72.0% 75.9% 72.7% 46.9% 68.0% 68.9%
Women 17 29 13 7 42 16 58 182
41.5% 27.4% 26.0% 24.1% 25.5% 50.0% 29.0% 29.2%
Boys 0 0 1 0 1 1 5 8
.0% .0% 2.0% .0% .6% 3.1% 2.5% 1.3%
Girls 1 0 0 0 2 0 1 4
2.4% .0% .0% .0% 1.2% .0% .5% .6%
Total 41 106 50 29 165 32 200 623
100.0% 100.0% 100.0% 100.0% 100.0% 100.0% 100.0% 100.0%
Source: Primary data
Table 5: Reproductive activities – construction of family house Gender
Responsible
South Sudan State
Total Central
Equatoria Eastern
Equatoria Lakes Northern Bahr
el Ghazal Warrap Western Bahr
el Ghazal Western Equatoria
Men 34 95 47 18 149 20 129 492
77.3% 88.8% 94.0% 60.0% 90.3% 62.5% 64.5% 78.3%
Women 8 12 3 12 10 6 58 109
18.2% 11.2% 6.0% 40.0% 6.1% 18.8% 29.0% 17.4%
Boys 1 0 0 0 3 6 8 18
2.3% .0% .0% .0% 1.8% 18.8% 4.0% 2.9%
Girls 1 0 0 0 3 0 5 9
2.3% .0% .0% .0% 1.8% .0% 2.5% 1.4%
Total 44 107 50 30 165 32 200 628
100.0% 100.0% 100.0% 100.0% 100.0% 100.0% 100.0% 100.0%
Source: Primary data
Table 6: Productive activities – cultivating crops for sale Gender
Responsible
South Sudan State
Total Central
Equatoria Eastern
Equatoria Lakes Northern Bahr
el Ghazal Warrap Western Bahr
el Ghazal Western Equatoria
Men 32 93 38 26 133 14 162 498
74.4% 86.9% 76.0% 86.7% 81.6% 43.8% 81.0% 79.7%
Women 11 14 12 4 29 18 36 124
25.6% 13.1% 24.0% 13.3% 17.8% 56.3% 18.0% 19.8%
Boys 0 0 0 0 1 0 1 2
.0% .0% .0% .0% .6% .0% .5% .3%
Girls 0 0 0 0 0 0 1 1
.0% .0% .0% .0% .0% .0% .5% .2%
Total 43 107 50 30 163 32 200 625
100.0% 100.0% 100.0% 100.0% 100.0% 100.0% 100.0% 100.0%
Source: Primary data
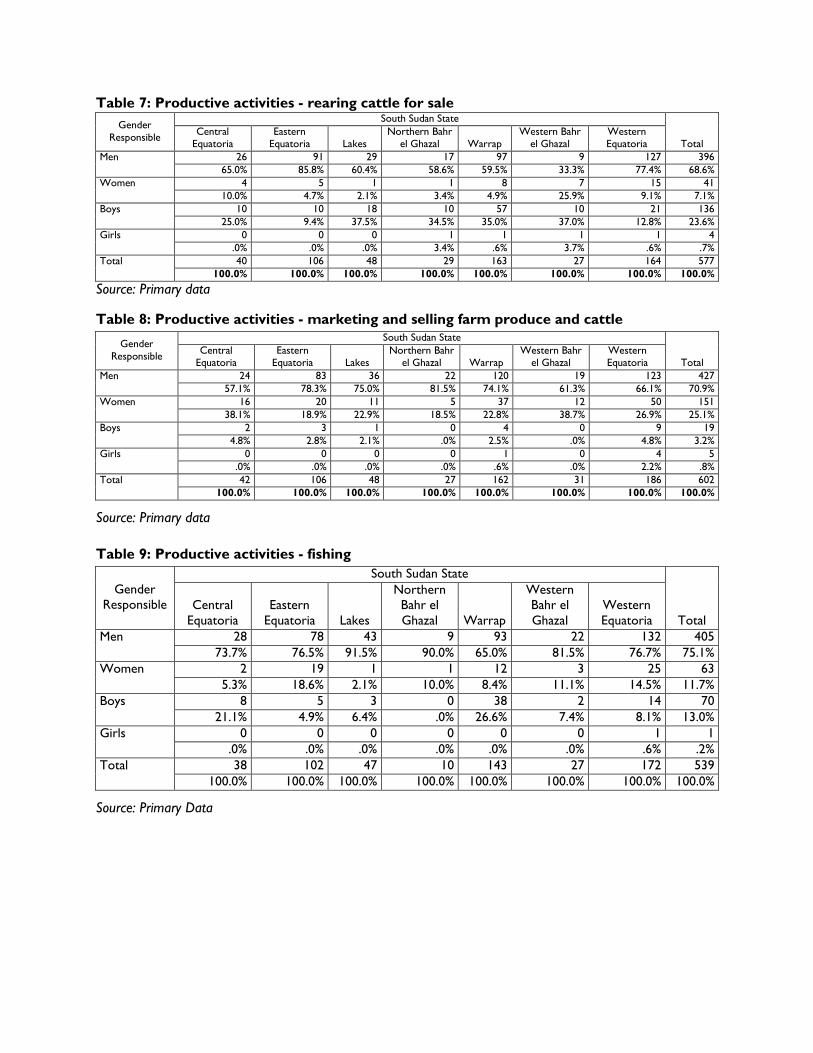
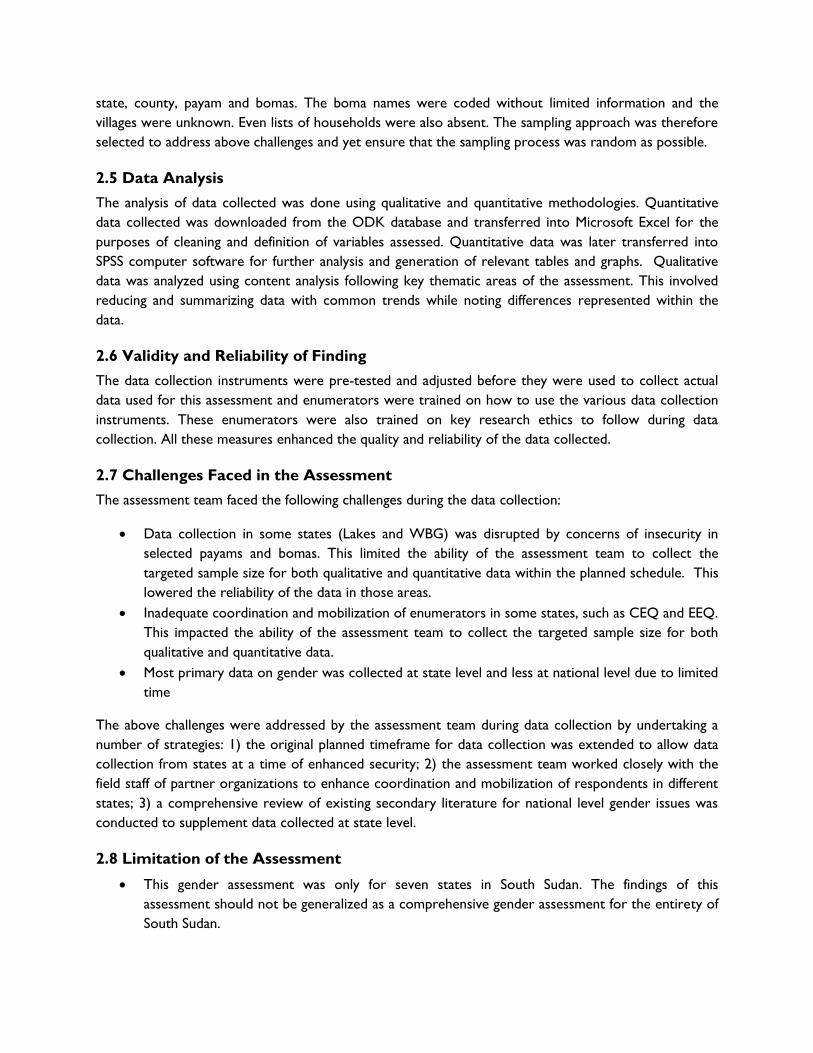
Table 7: Productive activities - rearing cattle for sale Gender
Responsible
South Sudan State
Total Central
Equatoria Eastern
Equatoria Lakes Northern Bahr
el Ghazal Warrap Western Bahr
el Ghazal Western Equatoria
Men 26 91 29 17 97 9 127 396
65.0% 85.8% 60.4% 58.6% 59.5% 33.3% 77.4% 68.6%
Women 4 5 1 1 8 7 15 41
10.0% 4.7% 2.1% 3.4% 4.9% 25.9% 9.1% 7.1%
Boys 10 10 18 10 57 10 21 136
25.0% 9.4% 37.5% 34.5% 35.0% 37.0% 12.8% 23.6%
Girls 0 0 0 1 1 1 1 4
.0% .0% .0% 3.4% .6% 3.7% .6% .7%
Total 40 106 48 29 163 27 164 577
100.0% 100.0% 100.0% 100.0% 100.0% 100.0% 100.0% 100.0%
Source: Primary data
Table 8: Productive activities - marketing and selling farm produce and cattle
Gender
Responsible
South Sudan State
Total Central
Equatoria Eastern
Equatoria Lakes Northern Bahr
el Ghazal Warrap Western Bahr
el Ghazal Western Equatoria
Men 24 83 36 22 120 19 123 427
57.1% 78.3% 75.0% 81.5% 74.1% 61.3% 66.1% 70.9%
Women 16 20 11 5 37 12 50 151
38.1% 18.9% 22.9% 18.5% 22.8% 38.7% 26.9% 25.1%
Boys 2 3 1 0 4 0 9 19
4.8% 2.8% 2.1% .0% 2.5% .0% 4.8% 3.2%
Girls 0 0 0 0 1 0 4 5
.0% .0% .0% .0% .6% .0% 2.2% .8%
Total 42 106 48 27 162 31 186 602
100.0% 100.0% 100.0% 100.0% 100.0% 100.0% 100.0% 100.0%
Source: Primary data
Table 9: Productive activities - fishing
Gender
Responsible
South Sudan State
Total
Central
Equatoria
Eastern
Equatoria Lakes
Northern
Bahr el
Ghazal Warrap
Western
Bahr el
Ghazal
Western
Equatoria
Men 28 78 43 9 93 22 132 405
73.7% 76.5% 91.5% 90.0% 65.0% 81.5% 76.7% 75.1%
Women 2 19 1 1 12 3 25 63
5.3% 18.6% 2.1% 10.0% 8.4% 11.1% 14.5% 11.7%
Boys 8 5 3 0 38 2 14 70
21.1% 4.9% 6.4% .0% 26.6% 7.4% 8.1% 13.0%
Girls 0 0 0 0 0 0 1 1
.0% .0% .0% .0% .0% .0% .6% .2%
Total 38 102 47 10 143 27 172 539
100.0% 100.0% 100.0% 100.0% 100.0% 100.0% 100.0% 100.0%
Source: Primary Data
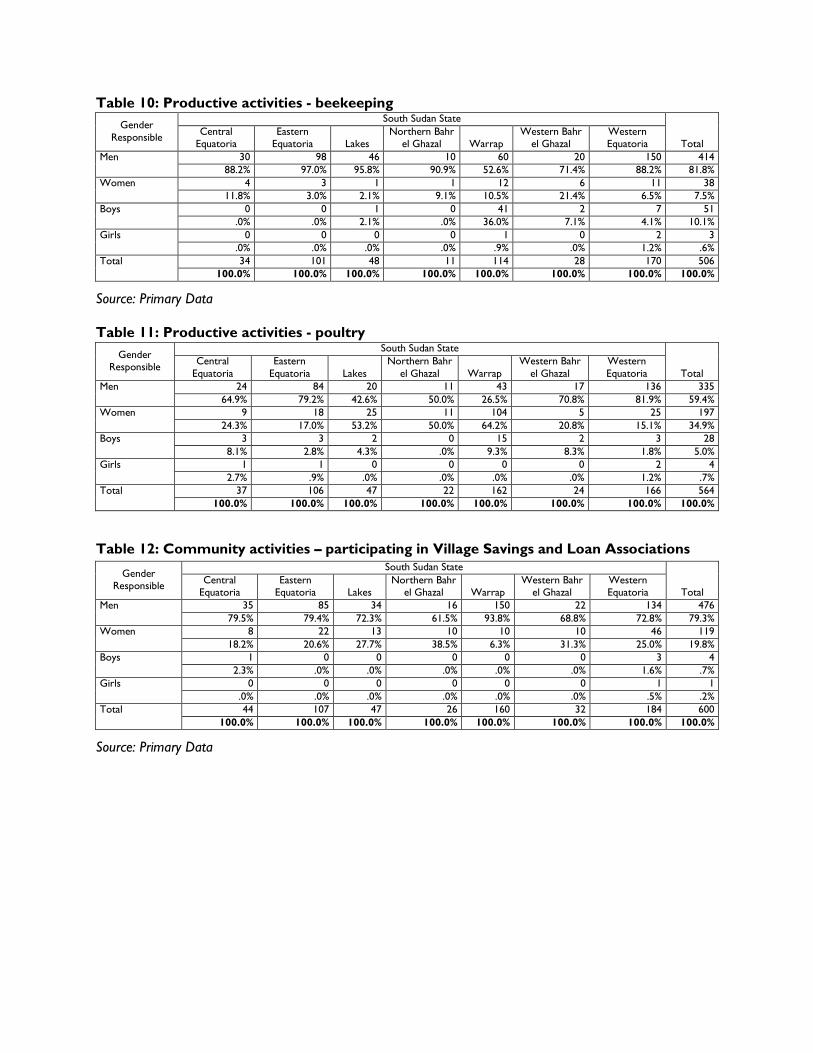
Table 10: Productive activities - beekeeping Gender
Responsible
South Sudan State
Total Central
Equatoria Eastern
Equatoria Lakes Northern Bahr
el Ghazal Warrap Western Bahr
el Ghazal Western Equatoria
Men 30 98 46 10 60 20 150 414
88.2% 97.0% 95.8% 90.9% 52.6% 71.4% 88.2% 81.8%
Women 4 3 1 1 12 6 11 38
11.8% 3.0% 2.1% 9.1% 10.5% 21.4% 6.5% 7.5%
Boys 0 0 1 0 41 2 7 51
.0% .0% 2.1% .0% 36.0% 7.1% 4.1% 10.1%
Girls 0 0 0 0 1 0 2 3
.0% .0% .0% .0% .9% .0% 1.2% .6%
Total 34 101 48 11 114 28 170 506
100.0% 100.0% 100.0% 100.0% 100.0% 100.0% 100.0% 100.0%
Source: Primary Data
Table 11: Productive activities - poultry
Gender Responsible
South Sudan State
Total
Central
Equatoria
Eastern
Equatoria Lakes
Northern Bahr
el Ghazal Warrap
Western Bahr
el Ghazal
Western
Equatoria
Men 24 84 20 11 43 17 136 335
64.9% 79.2% 42.6% 50.0% 26.5% 70.8% 81.9% 59.4%
Women 9 18 25 11 104 5 25 197
24.3% 17.0% 53.2% 50.0% 64.2% 20.8% 15.1% 34.9%
Boys 3 3 2 0 15 2 3 28
8.1% 2.8% 4.3% .0% 9.3% 8.3% 1.8% 5.0%
Girls 1 1 0 0 0 0 2 4
2.7% .9% .0% .0% .0% .0% 1.2% .7%
Total 37 106 47 22 162 24 166 564
100.0% 100.0% 100.0% 100.0% 100.0% 100.0% 100.0% 100.0%
Table 12: Community activities – participating in Village Savings and Loan Associations
Gender Responsible
South Sudan State
Total Central
Equatoria Eastern
Equatoria Lakes Northern Bahr
el Ghazal Warrap Western Bahr
el Ghazal Western Equatoria
Men 35 85 34 16 150 22 134 476
79.5% 79.4% 72.3% 61.5% 93.8% 68.8% 72.8% 79.3%
Women 8 22 13 10 10 10 46 119
18.2% 20.6% 27.7% 38.5% 6.3% 31.3% 25.0% 19.8%
Boys 1 0 0 0 0 0 3 4
2.3% .0% .0% .0% .0% .0% 1.6% .7%
Girls 0 0 0 0 0 0 1 1
.0% .0% .0% .0% .0% .0% .5% .2%
Total 44 107 47 26 160 32 184 600
100.0% 100.0% 100.0% 100.0% 100.0% 100.0% 100.0% 100.0%
Source: Primary Data

Table 13: Community activities - taking leadership positions in community, church and mosque
Gender Responsible
South Sudan State
Total Central
Equatoria Eastern
Equatoria Lakes Northern Bahr
el Ghazal Warrap Western Bahr
el Ghazal Western Equatoria
Men 38 92 36 22 155 22 158 523
86.4% 86.0% 75.0% 81.5% 94.5% 66.7% 78.6% 83.8%
Women 4 15 12 5 8 10 39 93
9.1% 14.0% 25.0% 18.5% 4.9% 30.3% 19.4% 14.9%
Boys 2 0 0 0 1 1 3 7
4.5% .0% .0% .0% .6% 3.0% 1.5% 1.1%
Girls 0 0 0 0 0 0 1 1
.0% .0% .0% .0% .0% .0% .5% .2%
Total 44 107 48 27 164 33 201 624
100.0% 100.0% 100.0% 100.0% 100.0% 100.0% 100.0% 100.0%
Source: Primary Data
Table 14: Men and women’s access to land
Gender
Responsible
South Sudan State
Total Central
Equatoria Eastern
Equatoria Lakes Northern Bahr
el Ghazal Warrap Western Bahr
el Ghazal Western Equatoria
Men 40 101 49 26 144 19 184 563
90.9% 94.4% 100.0% 83.9% 88.9% 55.9% 90.6% 89.4%
Women 2 5 0 5 15 7 17 51
4.5% 4.7% .0% 16.1% 9.3% 20.6% 8.4% 8.1%
Boys 2 1 0 0 3 7 2 15
4.5% .9% .0% .0% 1.9% 20.6% 1.0% 2.4%
Girls 0 0 0 0 0 1 0 1
.0% .0% .0% .0% .0% 2.9% .0% .2%
Total 44 107 49 31 162 34 203 630
100.0% 100.0% 100.0% 100.0% 100.0% 100.0% 100.0% 100.0%
Source: Primary data
Table 15: Men and women’s control over assets - Land
Gender
South Sudan State
Total
Central
Equatoria
Eastern
Equatoria Lakes
Northern Bahr
el Ghazal Warrap
Western Bahr
el Ghazal
Western
Equatoria
Men 38 103 49 26 147 13 175 551
90.5% 95.4% 98.0% 83.9% 89.1% 41.9% 86.2% 87.5%
Women 2 5 1 4 18 7 28 65
4.8% 4.6% 2.0% 12.9% 10.9% 22.6% 13.8% 10.3%
Boys 2 0 0 1 0 10 0 13
4.8% .0% .0% 3.2% .0% 32.3% .0% 2.1%
Girls 0 0 0 0 0 1 0 1
.0% .0% .0% .0% .0% 3.2% .0% .2%
Total 42 108 50 31 165 31 203 630
100.0% 100.0% 100.0% 100.0% 100.0% 100.0% 100.0% 100.0%
Source: Primary Data
Table 16: Men and women’s cccess to education
Gender
South Sudan State
Total Central
Equatoria Eastern
Equatoria Lakes Northern Bahr
el Ghazal Warrap Western Bahr
el Ghazal Western Equatoria
Men 19 78 39 13 79 10 129 367
44.2% 72.9% 79.6% 43.3% 50.3% 29.4% 65.2% 59.4%
Women 3 5 1 2 11 5 12 39
7.0% 4.7% 2.0% 6.7% 7.0% 14.7% 6.1% 6.3%
Boys 17 18 8 13 63 16 42 177
39.5% 16.8% 16.3% 43.3% 40.1% 47.1% 21.2% 28.6%
Girls 4 6 1 2 4 3 15 35
9.3% 5.6% 2.0% 6.7% 2.5% 8.8% 7.6% 5.7%
Total 43 107 49 30 157 34 198 618
100.0% 100.0% 100.0% 100.0% 100.0% 100.0% 100.0% 100.0%
Source: Primary data
Table 17: Men and women’s access to credit/loans
Gender
South Sudan State
Total
Central
Equatoria
Eastern
Equatoria Lakes
Northern Bahr
el Ghazal Warrap
Western Bahr
el Ghazal
Western
Equatoria
Men 24 78 39 18 119 15 146 439
57.1% 72.9% 81.3% 66.7% 81.0% 45.5% 78.9% 74.5%
Women 17 28 9 9 27 15 36 141
40.5% 26.2% 18.8% 33.3% 18.4% 45.5% 19.5% 23.9%
Boys 1 0 0 0 1 3 2 7
2.4% .0% .0% .0% .7% 9.1% 1.1% 1.2%
Girls 0 1 0 0 0 0 1 2
.0% .9% .0% .0% .0% .0% .5% .3%
Total 42 107 48 27 147 33 185 589
100.0% 100.0% 100.0% 100.0% 100.0% 100.0% 100.0% 100.0%
Source: Primary data
Table 18: Men’s and women’s farm income
Gender
South Sudan State
Total Central
Equatoria Eastern
Equatoria Lakes Northern Bahr
el Ghazal Warrap Western Bahr
el Ghazal Western Equatoria
Men 32 91 47 20 122 15 127 454
78.0% 85.8% 95.9% 80.0% 76.3% 46.9% 68.3% 75.8%
Women 8 14 2 5 36 13 56 134
19.5% 13.2% 4.1% 20.0% 22.5% 40.6% 30.1% 22.4%
Boys 1 1 0 0 1 3 2 8
2.4% .9% .0% .0% .6% 9.4% 1.1% 1.3%
Girls 0 0 0 0 1 1 1 3
.0% .0% .0% .0% .6% 3.1% .5% .5%
Total 41 106 49 25 160 32 186 599
100.0% 100.0% 100.0% 100.0% 100.0% 100.0% 100.0% 100.0%
Source: Primary Data

Table 19: Men and women’s access to agricultural extension services
Gender
South Sudan State
Total Central
Equatoria Eastern
Equatoria Lakes Northern Bahr
el Ghazal Warrap Western Bahr
el Ghazal Western Equatoria
Men 35 98 40 19 145 18 173 528
83.3% 92.5% 85.1% 79.2% 90.6% 58.1% 93.5% 88.7%
Women 4 8 6 5 10 13 12 58
9.5% 7.5% 12.8% 20.8% 6.3% 41.9% 6.5% 9.7%
Boys 2 0 1 0 5 0 0 8
4.8% .0% 2.1% .0% 3.1% .0% .0% 1.3%
Girls 1 0 0 0 0 0 0 1
2.4% .0% .0% .0% .0% .0% .0% .2%
Total 42 106 47 24 160 31 185 595
100.0% 100.0% 100.0% 100.0% 100.0% 100.0% 100.0% 100.0%
Source: Primary Data
Table 20: Men and women’s control over household assets
(Such as bicycles/motorbikes and radios)
Gender
South Sudan State
Total Central
Equatoria Eastern
Equatoria Lakes Northern Bahr
el Ghazal Warrap Western Bahr
el Ghazal Western Equatoria
Men 32 68 25 19 121 20 175 460
82.1% 63.6% 50.0% 67.9% 73.3% 66.7% 90.7% 75.2%
Women 2 35 25 8 39 4 14 127
5.1% 32.7% 50.0% 28.6% 23.6% 13.3% 7.3% 20.8%
Boys 5 4 0 0 5 5 4 23
12.8% 3.7% .0% .0% 3.0% 16.7% 2.1% 3.8%
Girls 0 0 0 1 0 1 0 2
.0% .0% .0% 3.6% .0% 3.3% .0% .3%
Total 39 107 50 28 165 30 193 612
100.0% 100.0% 100.0% 100.0% 100.0% 100.0% 100.0% 100.0%
Source: Primary Data
Table 21: Perception that limited access to agricultural credit is a barrier to women’s and
girls’ participation in agriculture and economic activities
Level of Agreeing
South Sudan State
Total Central
Equatoria Eastern
Equatoria Lakes Northern Bahr
el Ghazal Warrap Western Bahr
el Ghazal Western Equatoria
Highly disagree 3 2 4 4 24 4 7 48
7.3% 1.9% 8.3% 13.8% 15.0% 12.1% 3.5% 7.8%
Disagree 5 5 11 7 23 9 37 97
12.2% 4.7% 22.9% 24.1% 14.4% 27.3% 18.7% 15.8%
Neutral 4 4 5 4 18 8 29 72
9.8% 3.8% 10.4% 13.8% 11.3% 24.2% 14.6% 11.7%
Agree 13 55 20 13 53 6 92 252
31.7% 51.9% 41.7% 44.8% 33.1% 18.2% 46.5% 41.0%
Highly agree 16 40 8 1 42 6 33 146
39.0% 37.7% 16.7% 3.4% 26.3% 18.2% 16.7% 23.7%
Total 41 106 48 29 160 33 198 615
100.0% 100.0% 100.0% 100.0% 100.0% 100.0% 100.0% 100.0%
Source: Primary Data
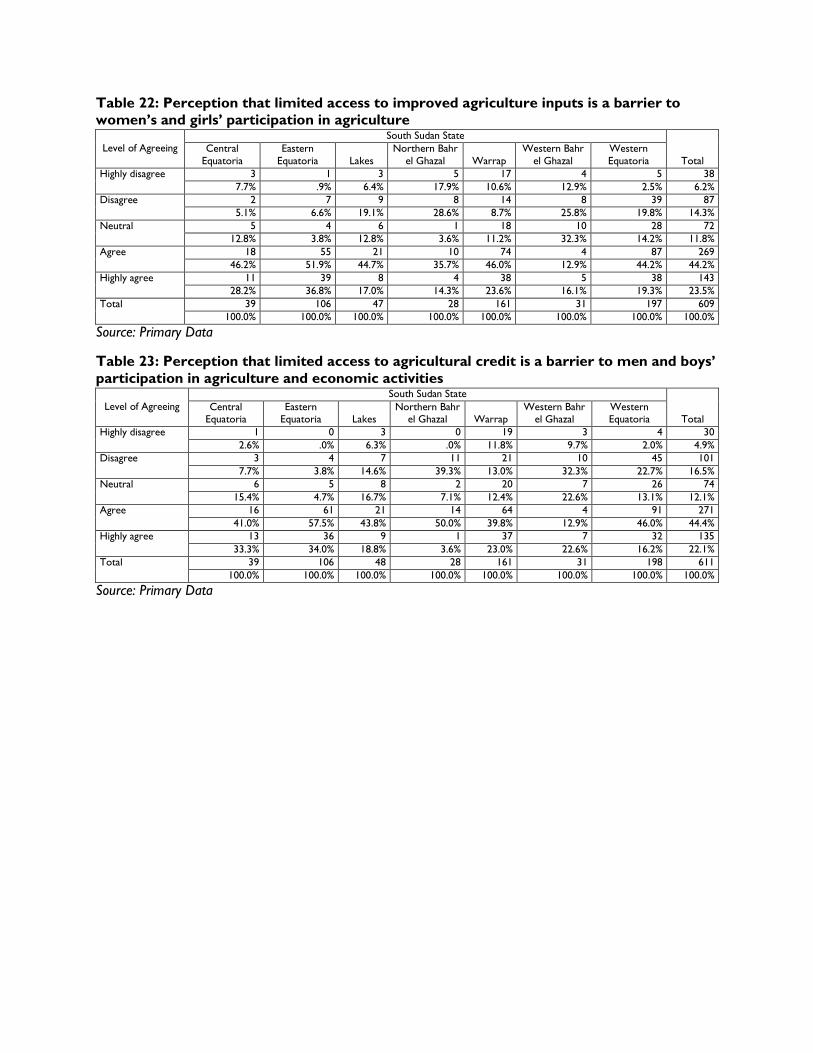
Table 22: Perception that limited access to improved agriculture inputs is a barrier to
women’s and girls’ participation in agriculture
Level of Agreeing
South Sudan State
Total
Central
Equatoria
Eastern
Equatoria Lakes
Northern Bahr
el Ghazal Warrap
Western Bahr
el Ghazal
Western
Equatoria
Highly disagree 3 1 3 5 17 4 5 38
7.7% .9% 6.4% 17.9% 10.6% 12.9% 2.5% 6.2%
Disagree 2 7 9 8 14 8 39 87
5.1% 6.6% 19.1% 28.6% 8.7% 25.8% 19.8% 14.3%
Neutral 5 4 6 1 18 10 28 72
12.8% 3.8% 12.8% 3.6% 11.2% 32.3% 14.2% 11.8%
Agree 18 55 21 10 74 4 87 269
46.2% 51.9% 44.7% 35.7% 46.0% 12.9% 44.2% 44.2%
Highly agree 11 39 8 4 38 5 38 143
28.2% 36.8% 17.0% 14.3% 23.6% 16.1% 19.3% 23.5%
Total 39 106 47 28 161 31 197 609
100.0% 100.0% 100.0% 100.0% 100.0% 100.0% 100.0% 100.0%
Source: Primary Data
Table 23: Perception that limited access to agricultural credit is a barrier to men and boys’
participation in agriculture and economic activities
Level of Agreeing
South Sudan State
Total Central
Equatoria Eastern
Equatoria Lakes Northern Bahr
el Ghazal Warrap Western Bahr
el Ghazal Western Equatoria
Highly disagree 1 0 3 0 19 3 4 30
2.6% .0% 6.3% .0% 11.8% 9.7% 2.0% 4.9%
Disagree 3 4 7 11 21 10 45 101
7.7% 3.8% 14.6% 39.3% 13.0% 32.3% 22.7% 16.5%
Neutral 6 5 8 2 20 7 26 74
15.4% 4.7% 16.7% 7.1% 12.4% 22.6% 13.1% 12.1%
Agree 16 61 21 14 64 4 91 271
41.0% 57.5% 43.8% 50.0% 39.8% 12.9% 46.0% 44.4%
Highly agree 13 36 9 1 37 7 32 135
33.3% 34.0% 18.8% 3.6% 23.0% 22.6% 16.2% 22.1%
Total 39 106 48 28 161 31 198 611
100.0% 100.0% 100.0% 100.0% 100.0% 100.0% 100.0% 100.0%
Source: Primary Data
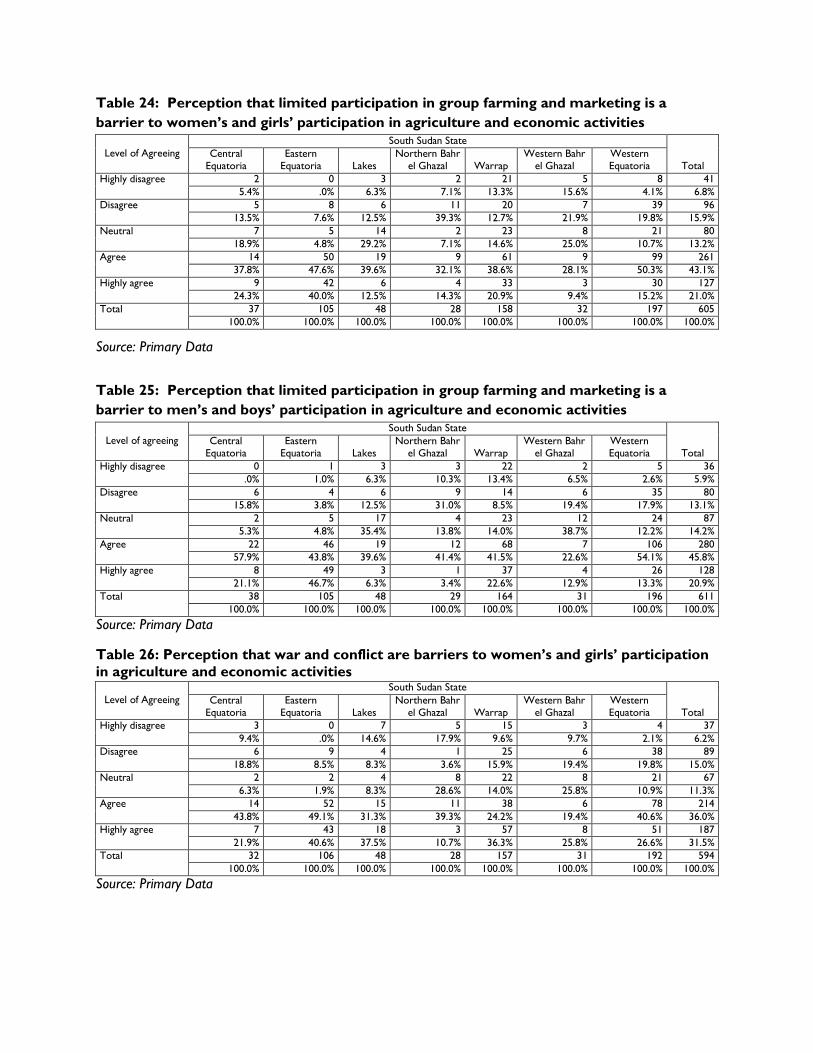
Table 24: Perception that limited participation in group farming and marketing is a
barrier to women’s and girls’ participation in agriculture and economic activities
Level of Agreeing
South Sudan State
Total Central
Equatoria Eastern
Equatoria Lakes Northern Bahr
el Ghazal Warrap Western Bahr
el Ghazal Western Equatoria
Highly disagree 2 0 3 2 21 5 8 41
5.4% .0% 6.3% 7.1% 13.3% 15.6% 4.1% 6.8%
Disagree 5 8 6 11 20 7 39 96
13.5% 7.6% 12.5% 39.3% 12.7% 21.9% 19.8% 15.9%
Neutral 7 5 14 2 23 8 21 80
18.9% 4.8% 29.2% 7.1% 14.6% 25.0% 10.7% 13.2%
Agree 14 50 19 9 61 9 99 261
37.8% 47.6% 39.6% 32.1% 38.6% 28.1% 50.3% 43.1%
Highly agree 9 42 6 4 33 3 30 127
24.3% 40.0% 12.5% 14.3% 20.9% 9.4% 15.2% 21.0%
Total 37 105 48 28 158 32 197 605
100.0% 100.0% 100.0% 100.0% 100.0% 100.0% 100.0% 100.0%
Source: Primary Data
Table 25: Perception that limited participation in group farming and marketing is a
barrier to men’s and boys’ participation in agriculture and economic activities
Level of agreeing
South Sudan State
Total Central
Equatoria Eastern
Equatoria Lakes Northern Bahr
el Ghazal Warrap Western Bahr
el Ghazal Western Equatoria
Highly disagree 0 1 3 3 22 2 5 36
.0% 1.0% 6.3% 10.3% 13.4% 6.5% 2.6% 5.9%
Disagree 6 4 6 9 14 6 35 80
15.8% 3.8% 12.5% 31.0% 8.5% 19.4% 17.9% 13.1%
Neutral 2 5 17 4 23 12 24 87
5.3% 4.8% 35.4% 13.8% 14.0% 38.7% 12.2% 14.2%
Agree 22 46 19 12 68 7 106 280
57.9% 43.8% 39.6% 41.4% 41.5% 22.6% 54.1% 45.8%
Highly agree 8 49 3 1 37 4 26 128
21.1% 46.7% 6.3% 3.4% 22.6% 12.9% 13.3% 20.9%
Total 38 105 48 29 164 31 196 611
100.0% 100.0% 100.0% 100.0% 100.0% 100.0% 100.0% 100.0%
Source: Primary Data
Table 26: Perception that war and conflict are barriers to women’s and girls’ participation
in agriculture and economic activities
Level of Agreeing
South Sudan State
Total Central
Equatoria Eastern
Equatoria Lakes Northern Bahr
el Ghazal Warrap Western Bahr
el Ghazal Western Equatoria
Highly disagree 3 0 7 5 15 3 4 37
9.4% .0% 14.6% 17.9% 9.6% 9.7% 2.1% 6.2%
Disagree 6 9 4 1 25 6 38 89
18.8% 8.5% 8.3% 3.6% 15.9% 19.4% 19.8% 15.0%
Neutral 2 2 4 8 22 8 21 67
6.3% 1.9% 8.3% 28.6% 14.0% 25.8% 10.9% 11.3%
Agree 14 52 15 11 38 6 78 214
43.8% 49.1% 31.3% 39.3% 24.2% 19.4% 40.6% 36.0%
Highly agree 7 43 18 3 57 8 51 187
21.9% 40.6% 37.5% 10.7% 36.3% 25.8% 26.6% 31.5%
Total 32 106 48 28 157 31 192 594
100.0% 100.0% 100.0% 100.0% 100.0% 100.0% 100.0% 100.0%
Source: Primary Data
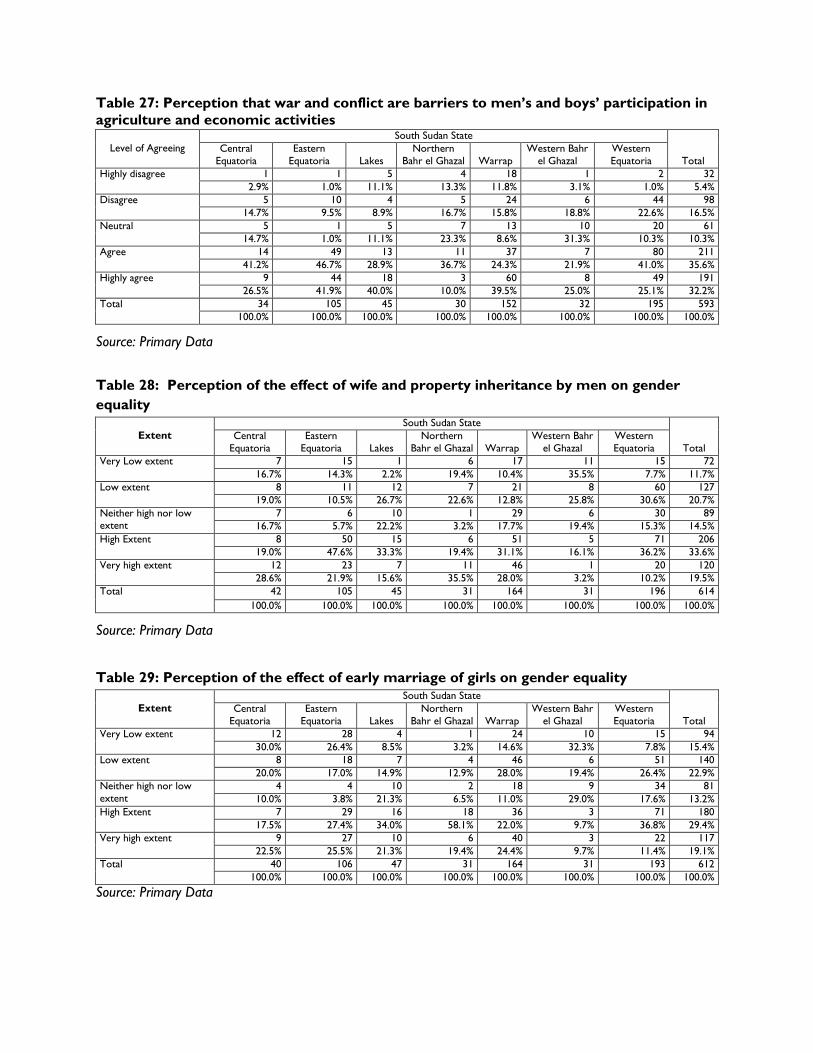
Table 27: Perception that war and conflict are barriers to men’s and boys’ participation in
agriculture and economic activities
Level of Agreeing
South Sudan State
Total
Central
Equatoria
Eastern
Equatoria Lakes
Northern
Bahr el Ghazal Warrap
Western Bahr
el Ghazal
Western
Equatoria
Highly disagree 1 1 5 4 18 1 2 32
2.9% 1.0% 11.1% 13.3% 11.8% 3.1% 1.0% 5.4%
Disagree 5 10 4 5 24 6 44 98
14.7% 9.5% 8.9% 16.7% 15.8% 18.8% 22.6% 16.5%
Neutral 5 1 5 7 13 10 20 61
14.7% 1.0% 11.1% 23.3% 8.6% 31.3% 10.3% 10.3%
Agree 14 49 13 11 37 7 80 211
41.2% 46.7% 28.9% 36.7% 24.3% 21.9% 41.0% 35.6%
Highly agree 9 44 18 3 60 8 49 191
26.5% 41.9% 40.0% 10.0% 39.5% 25.0% 25.1% 32.2%
Total 34 105 45 30 152 32 195 593
100.0% 100.0% 100.0% 100.0% 100.0% 100.0% 100.0% 100.0%
Source: Primary Data
Table 28: Perception of the effect of wife and property inheritance by men on gender
equality
Extent
South Sudan State
Total
Central
Equatoria
Eastern
Equatoria Lakes
Northern
Bahr el Ghazal Warrap
Western Bahr
el Ghazal
Western
Equatoria
Very Low extent 7 15 1 6 17 11 15 72
16.7% 14.3% 2.2% 19.4% 10.4% 35.5% 7.7% 11.7%
Low extent 8 11 12 7 21 8 60 127
19.0% 10.5% 26.7% 22.6% 12.8% 25.8% 30.6% 20.7%
Neither high nor low extent
7 6 10 1 29 6 30 89
16.7% 5.7% 22.2% 3.2% 17.7% 19.4% 15.3% 14.5%
High Extent 8 50 15 6 51 5 71 206
19.0% 47.6% 33.3% 19.4% 31.1% 16.1% 36.2% 33.6%
Very high extent 12 23 7 11 46 1 20 120
28.6% 21.9% 15.6% 35.5% 28.0% 3.2% 10.2% 19.5%
Total 42 105 45 31 164 31 196 614
100.0% 100.0% 100.0% 100.0% 100.0% 100.0% 100.0% 100.0%
Source: Primary Data
Table 29: Perception of the effect of early marriage of girls on gender equality
Extent
South Sudan State
Total
Central
Equatoria
Eastern
Equatoria Lakes
Northern
Bahr el Ghazal Warrap
Western Bahr
el Ghazal
Western
Equatoria
Very Low extent 12 28 4 1 24 10 15 94
30.0% 26.4% 8.5% 3.2% 14.6% 32.3% 7.8% 15.4%
Low extent 8 18 7 4 46 6 51 140
20.0% 17.0% 14.9% 12.9% 28.0% 19.4% 26.4% 22.9%
Neither high nor low
extent
4 4 10 2 18 9 34 81
10.0% 3.8% 21.3% 6.5% 11.0% 29.0% 17.6% 13.2%
High Extent 7 29 16 18 36 3 71 180
17.5% 27.4% 34.0% 58.1% 22.0% 9.7% 36.8% 29.4%
Very high extent 9 27 10 6 40 3 22 117
22.5% 25.5% 21.3% 19.4% 24.4% 9.7% 11.4% 19.1%
Total 40 106 47 31 164 31 193 612
100.0% 100.0% 100.0% 100.0% 100.0% 100.0% 100.0% 100.0%
Source: Primary Data

Table 30: Perception of the effect of women’s limited involvement in decision making on
gender equality
Extent
South Sudan State
Total
Central
Equatoria
Eastern
Equatoria Lakes
Northern
Bahr el Ghazal Warrap
Western Bahr
el Ghazal
Western
Equatoria
Very Low extent 11 29 3 4 43 9 19 118
28.9% 27.6% 6.5% 13.8% 26.4% 30.0% 9.8% 19.5%
Low extent 12 25 14 15 48 10 62 186
31.6% 23.8% 30.4% 51.7% 29.4% 33.3% 32.1% 30.8%
Neither high nor low extent
2 4 6 1 24 8 34 79
5.3% 3.8% 13.0% 3.4% 14.7% 26.7% 17.6% 13.1%
High Extent 7 30 18 3 25 1 59 143
18.4% 28.6% 39.1% 10.3% 15.3% 3.3% 30.6% 23.7%
Very high extent 6 17 5 6 23 2 19 78
15.8% 16.2% 10.9% 20.7% 14.1% 6.7% 9.8% 12.9%
Total 38 105 46 29 163 30 193 604
100.0% 100.0% 100.0% 100.0% 100.0% 100.0% 100.0% 100.0%
Source: Primary Data
Table 31: Perception of the impact of dowry on gender equality
Extent
South Sudan State
Total Central
Equatoria Eastern
Equatoria Lakes Northern
Bahr el Ghazal Warrap Western Bahr
el Ghazal Western Equatoria
Very Low extent 3 22 0 3 20 7 15 70
8.8% 22.0% .0% 10.3% 13.2% 24.1% 8.1% 12.3%
Low extent 5 10 8 11 16 8 52 110
14.7% 10.0% 20.5% 37.9% 10.5% 27.6% 28.0% 19.3%
Neither high nor low extent
3 5 8 1 34 6 56 113
8.8% 5.0% 20.5% 3.4% 22.4% 20.7% 30.1% 19.9%
High Extent 16 42 14 4 30 3 48 157
47.1% 42.0% 35.9% 13.8% 19.7% 10.3% 25.8% 27.6%
1Very high extent 7 21 9 10 52 5 15 119
20.6% 21.0% 23.1% 34.5% 34.2% 17.2% 8.1% 20.9%
Total 34 100 39 29 152 29 186 569
100.0% 100.0% 100.0% 100.0% 100.0% 100.0% 100.0% 100.0%
Source: Primary Data
Table 32: Perception that women’s and girls’ restricted mobility affects gender equality
Extent
South Sudan State
Total
Central
Equatoria
Eastern
Equatoria Lakes
Northern
Bahr el Ghazal Warrap
Western Bahr
el Ghazal
Western
Equatoria
Very Low extent 8 26 4 3 29 2 19 91
24.2% 25.5% 10.3% 11.1% 19.2% 7.1% 10.3% 16.1%
Low extent 4 25 3 5 29 11 65 142
12.1% 24.5% 7.7% 18.5% 19.2% 39.3% 35.3% 25.2%
Neither high nor low extent
4 9 7 1 15 11 37 84
12.1% 8.8% 17.9% 3.7% 9.9% 39.3% 20.1% 14.9%
High Extent 14 29 14 9 24 2 48 140
42.4% 28.4% 35.9% 33.3% 15.9% 7.1% 26.1% 24.8%
Very high extent 3 13 11 9 54 2 15 107
9.1% 12.7% 28.2% 33.3% 35.8% 7.1% 8.2% 19.0%
Total 33 102 39 27 151 28 184 564
100.0% 100.0% 100.0% 100.0% 100.0% 100.0% 100.0% 100.0%
Source: Primary Data
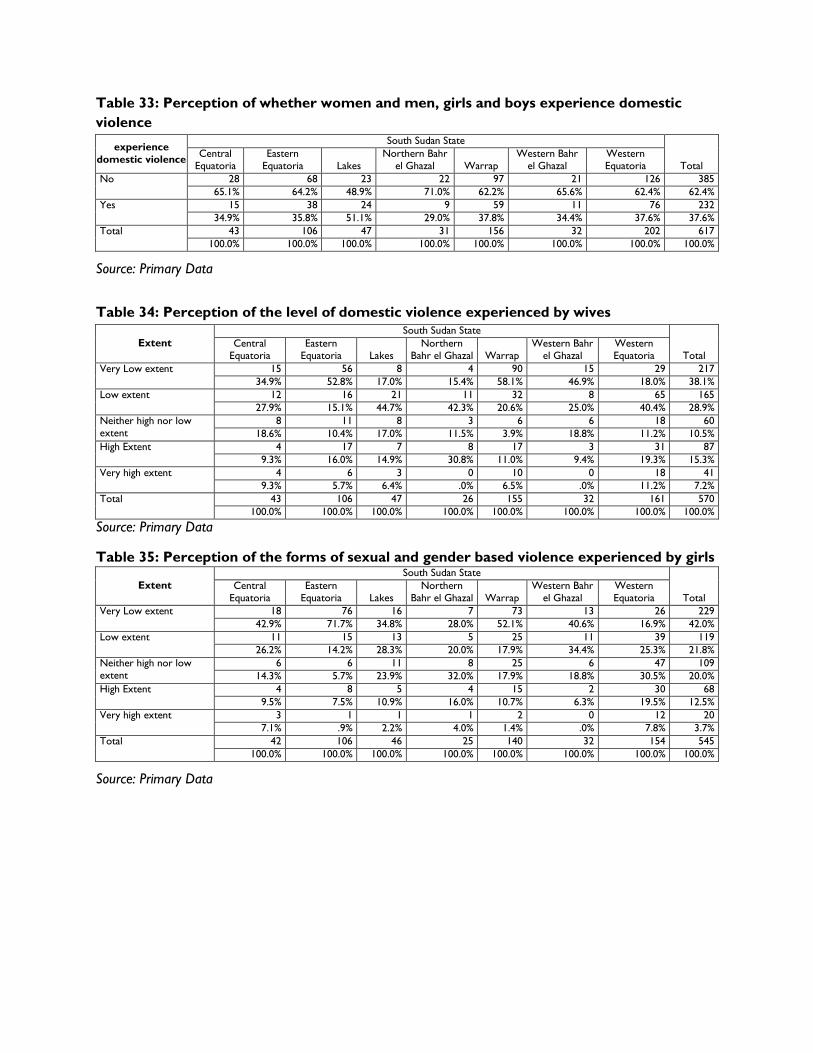
Table 33: Perception of whether women and men, girls and boys experience domestic
violence
experience
domestic violence
South Sudan State
Total Central
Equatoria Eastern
Equatoria Lakes Northern Bahr
el Ghazal Warrap Western Bahr
el Ghazal Western Equatoria
No 28 68 23 22 97 21 126 385
65.1% 64.2% 48.9% 71.0% 62.2% 65.6% 62.4% 62.4%
Yes 15 38 24 9 59 11 76 232
34.9% 35.8% 51.1% 29.0% 37.8% 34.4% 37.6% 37.6%
Total 43 106 47 31 156 32 202 617
100.0% 100.0% 100.0% 100.0% 100.0% 100.0% 100.0% 100.0%
Source: Primary Data
Table 34: Perception of the level of domestic violence experienced by wives
Extent
South Sudan State
Total Central
Equatoria Eastern
Equatoria Lakes Northern
Bahr el Ghazal Warrap Western Bahr
el Ghazal Western Equatoria
Very Low extent 15 56 8 4 90 15 29 217
34.9% 52.8% 17.0% 15.4% 58.1% 46.9% 18.0% 38.1%
Low extent 12 16 21 11 32 8 65 165
27.9% 15.1% 44.7% 42.3% 20.6% 25.0% 40.4% 28.9%
Neither high nor low extent
8 11 8 3 6 6 18 60
18.6% 10.4% 17.0% 11.5% 3.9% 18.8% 11.2% 10.5%
High Extent 4 17 7 8 17 3 31 87
9.3% 16.0% 14.9% 30.8% 11.0% 9.4% 19.3% 15.3%
Very high extent 4 6 3 0 10 0 18 41
9.3% 5.7% 6.4% .0% 6.5% .0% 11.2% 7.2%
Total 43 106 47 26 155 32 161 570
100.0% 100.0% 100.0% 100.0% 100.0% 100.0% 100.0% 100.0%
Source: Primary Data
Table 35: Perception of the forms of sexual and gender based violence experienced by girls
Extent
South Sudan State
Total Central
Equatoria Eastern
Equatoria Lakes Northern
Bahr el Ghazal Warrap Western Bahr
el Ghazal Western Equatoria
Very Low extent 18 76 16 7 73 13 26 229
42.9% 71.7% 34.8% 28.0% 52.1% 40.6% 16.9% 42.0%
Low extent 11 15 13 5 25 11 39 119
26.2% 14.2% 28.3% 20.0% 17.9% 34.4% 25.3% 21.8%
Neither high nor low extent
6 6 11 8 25 6 47 109
14.3% 5.7% 23.9% 32.0% 17.9% 18.8% 30.5% 20.0%
High Extent 4 8 5 4 15 2 30 68
9.5% 7.5% 10.9% 16.0% 10.7% 6.3% 19.5% 12.5%
Very high extent 3 1 1 1 2 0 12 20
7.1% .9% 2.2% 4.0% 1.4% .0% 7.8% 3.7%
Total 42 106 46 25 140 32 154 545
100.0% 100.0% 100.0% 100.0% 100.0% 100.0% 100.0% 100.0%
Source: Primary Data
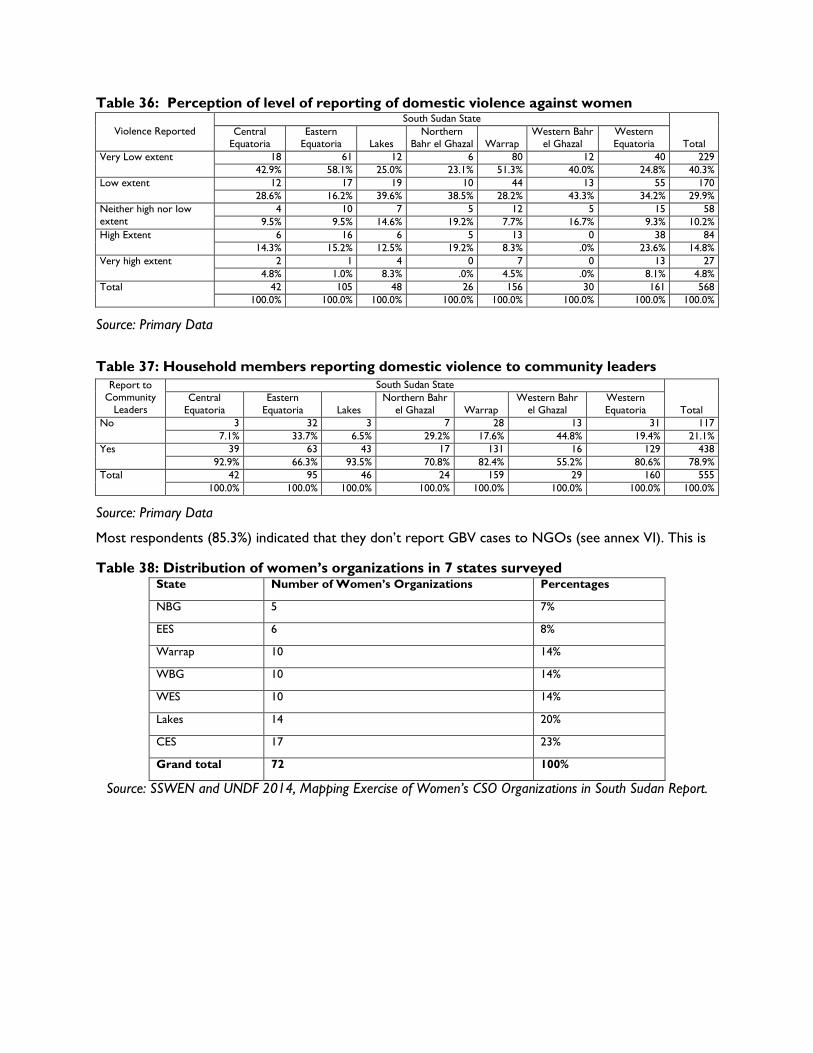
Table 36: Perception of level of reporting of domestic violence against women
Violence Reported
South Sudan State
Total Central
Equatoria Eastern
Equatoria Lakes Northern
Bahr el Ghazal Warrap Western Bahr
el Ghazal Western Equatoria
Very Low extent 18 61 12 6 80 12 40 229
42.9% 58.1% 25.0% 23.1% 51.3% 40.0% 24.8% 40.3%
Low extent 12 17 19 10 44 13 55 170
28.6% 16.2% 39.6% 38.5% 28.2% 43.3% 34.2% 29.9%
Neither high nor low extent
4 10 7 5 12 5 15 58
9.5% 9.5% 14.6% 19.2% 7.7% 16.7% 9.3% 10.2%
High Extent 6 16 6 5 13 0 38 84
14.3% 15.2% 12.5% 19.2% 8.3% .0% 23.6% 14.8%
Very high extent 2 1 4 0 7 0 13 27
4.8% 1.0% 8.3% .0% 4.5% .0% 8.1% 4.8%
Total 42 105 48 26 156 30 161 568
100.0% 100.0% 100.0% 100.0% 100.0% 100.0% 100.0% 100.0%
Source: Primary Data
Table 37: Household members reporting domestic violence to community leaders
Report to Community
Leaders
South Sudan State
Total
Central
Equatoria
Eastern
Equatoria Lakes
Northern Bahr
el Ghazal Warrap
Western Bahr
el Ghazal
Western
Equatoria
No 3 32 3 7 28 13 31 117
7.1% 33.7% 6.5% 29.2% 17.6% 44.8% 19.4% 21.1%
Yes 39 63 43 17 131 16 129 438
92.9% 66.3% 93.5% 70.8% 82.4% 55.2% 80.6% 78.9%
Total 42 95 46 24 159 29 160 555
100.0% 100.0% 100.0% 100.0% 100.0% 100.0% 100.0% 100.0%
Source: Primary Data
Most respondents (85.3%) indicated that they don’t report GBV cases to NGOs (see annex VI). This is
Table 38: Distribution of women’s organizations in 7 states surveyed State Number of Women’s Organizations Percentages
NBG 5 7%
EES 6 8%
Warrap 10 14%
WBG 10 14%
WES 10 14%
Lakes 14 20%
CES 17 23%
Grand total 72 100%
Source: SSWEN and UNDF 2014, Mapping Exercise of Women’s CSO Organizations in South Sudan Report.
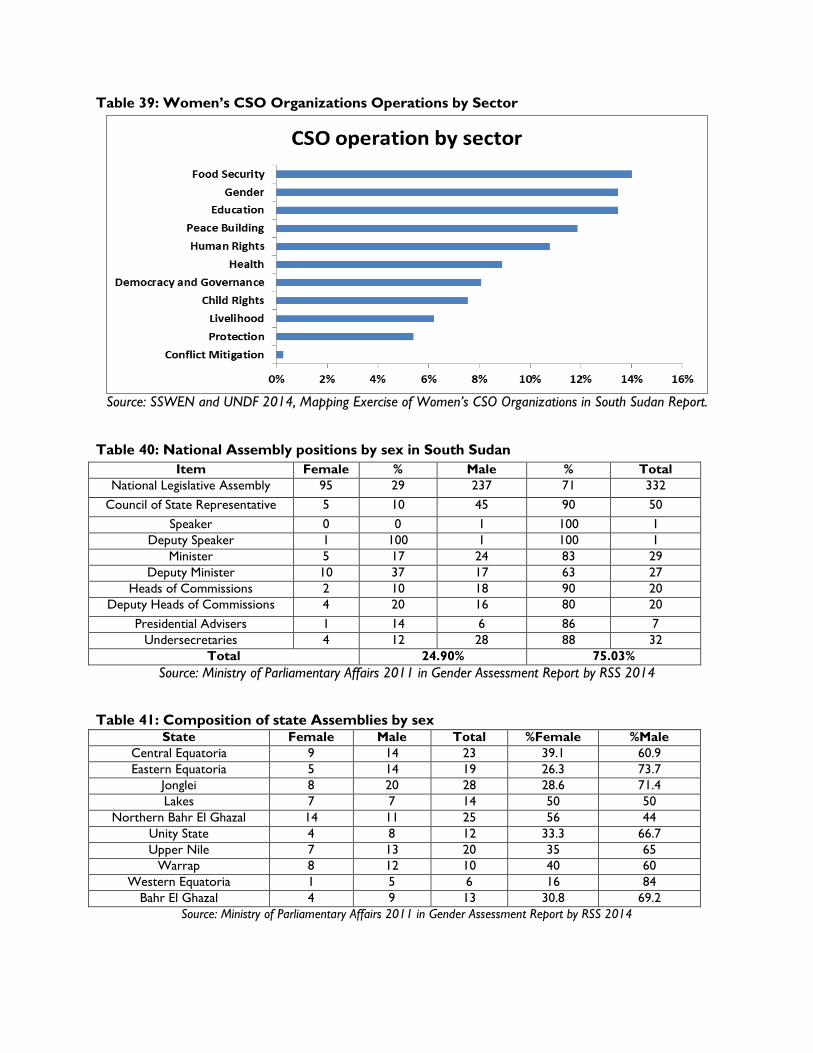
Table 39: Women’s CSO Organizations Operations by Sector
Source: SSWEN and UNDF 2014, Mapping Exercise of Women’s CSO Organizations in South Sudan Report.
Table 40: National Assembly positions by sex in South Sudan
Item Female % Male % Total
National Legislative Assembly 95 29 237 71 332
Council of State Representative 5 10 45 90 50
Speaker 0 0 1 100 1
Deputy Speaker 1 100 1 100 1
Minister 5 17 24 83 29
Deputy Minister 10 37 17 63 27
Heads of Commissions 2 10 18 90 20
Deputy Heads of Commissions 4 20 16 80 20
Presidential Advisers 1 14 6 86 7
Undersecretaries 4 12 28 88 32
Total 24.90% 75.03%
Source: Ministry of Parliamentary Affairs 2011 in Gender Assessment Report by RSS 2014
Table 41: Composition of state Assemblies by sex State Female Male Total %Female %Male
Central Equatoria 9 14 23 39.1 60.9
Eastern Equatoria 5 14 19 26.3 73.7
Jonglei 8 20 28 28.6 71.4
Lakes 7 7 14 50 50
Northern Bahr El Ghazal 14 11 25 56 44
Unity State 4 8 12 33.3 66.7
Upper Nile 7 13 20 35 65
Warrap 8 12 10 40 60
Western Equatoria 1 5 6 16 84
Bahr El Ghazal 4 9 13 30.8 69.2
Source: Ministry of Parliamentary Affairs 2011 in Gender Assessment Report by RSS 2014

Table 42: Constraints of Women’s Organization’s in South Sudan CSO Constraints %
Weak Government support 1%
Lack of motivation 1%
Staff turnover 1%
Cultural rigidities 2%
Communication barrier 3%
High iliteracy levels 4%
Road inaccessibility 4%
Insecurity 6%
Low staff capacity 7%
Transport 35%
Funding 37%
Grand Total 100%
Source: SSWEN and UNDF 2014, Mapping Exercise of Women’s CSO Organizations in South Sudan Report.
Table 43: Key agriculture and economic enterprises by gender
State Women Men Both Men and Women
WES Brewing local alcohol, vegetables,
goats rearing
Apiary production (bee keeping),
fishing, coffee,
Cassava, maize, sorghum and millet
crop cultivation
EES Retail shops through village
savings in urban areas,
Vegetables growing, cattle, Cassava, maize, sorghum and millet
crop cultivation
WBG Operating small enterprises
(restaurants, local brew clothes
and beauty salons)
Business in produce (cassava flour) and
growing of pineapples
Growing of pineapples and sell of
produce
CE Large scale farming by women
farmer groups
Vegetables growing, cattle Vegetables and fruits growing
NBG Poultry and sorghum and maize
farming
Cattle and growing of sorghum and
maize
Animal keeping (cows, goats, sheep
and poultry)
Warrap Group businesses- crafts (beads,
bed sheets and bags), individual
retail business
Farming and rearing cows, sheep and
goats
Cattle and retail businesses
Lakes
.

Annexes
I. References
References.doc
II. Gender Assessment Tools Used
Gender Assessment Questionnaire Used - SS.doc
FGD tool for Gender.doc
Guide for Key Informant.doc
1
GENDER ASSESSMENT REPORT
Submitted to
Quality Assurance Manager
World Vision South Sudan
By:
Kenwill International Limited
P. O BOX 27622, Kampala, Uganda
0782 446015 (Robert)
E-mail: [email protected]
E-mail: [email protected]
July 2015

2 | P a g e
TABLE OF CONTENTS List of tables ........................................................................................................................................................................ 3
List of Pictures ....................................................................................................... Error! Bookmark not defined.
AFFIRMATION .................................................................................................................................................................. 5
ACKNOWLEDGEMENTS .............................................................................................................................................. 6
ABBREVIATIONS .............................................................................................................................................................. 7
GLOSSARY ......................................................................................................................................................................... 8
EXECUTIVE SUMMARY .................................................................................................................................................. 9
Key Findings and Recommendations ........................................................................................................................ 9
CHAPTER 1: BACKGROUND AND PURPOSE .................................................................................................... 12
1.1 Background ............................................................................................................................................................ 12
1.2 Description of FEED Project ............................................................................................................................. 14
1.3 Purpose of Gender Assessment ....................................................................................................................... 15
1.4 Project Location and Areas Assessed ............................................................................................................. 16
1.5 Structure of the Report ...................................................................................................................................... 16
CHAPTER 2: METHODOLOGY ................................................................................................................................. 17
2.1 Study design ........................................................................................................................................................... 17
2.2 Process of gender assessment ........................................................................................................................... 17
2.3 Methods of data collection used ....................................................................................................................... 17
2.4 Sampling and sample size .................................................................................................................................... 17
2.5 Data analysis .......................................................................................................................................................... 18
2.6 Validity and reliability of study findings ........................................................................................................... 19
2.7 Challenges faced in the Assessment ................................................................................................................ 19
2.8 Limitation of the Assessment ............................................................................................................................ 19
CHAPTER 3: GENDER ASSESSMENT FINDINGS ................................................................................................. 20
3.1 Socio-economic characteristics of respondents ........................................................................................... 20
3.2 Gender Relations and Division of Labour ...................................................................................................... 20
3.2.1 Reproductive Roles ...................................................................................................................................... 20
3.2.2 Productive Roles ........................................................................................................................................... 22
3.2.3 Community Roles ......................................................................................................................................... 24
3.3 Level of Participation of Men and Women in Agriculture ......................................................................... 25
3.3.1 Use of Technology in Agricultural Production ...................................................................................... 29
3.4 Level of Participation of Men and Women in Economic Activity ............................................................. 30
3.4.1 Features of Economic Activity................................................................................................................... 30
3.4.2 Agricultural Commodities .......................................................................................................................... 34
3.4.3 Use of Technology in Economic Activity ................................................................................................ 35
3.5 Opportunities for Participation in Agriculture and Economic Development ........................................ 36
3.6 Barriers to Participation in Agriculture and Economic Development ................................................... 37
3.7 The Gender Movement and Civil Society in South Sudan ......................................................................... 37
3.7.1 Key Actors, Size and Geographical Spread ............................................................................................ 37
3 | P a g e
3.7.3 Key Thematic Focus for Actors within the Gender Movement ....................................................... 38
3.7.4 Progress of the Gender Movement ......................................................................................................... 39
3.7. 5 Challenges of the Gender Movement .................................................................................................... 41
3.8 Access to, Ownership of and Control Over Resources ........................................................................... 44
3.9 Gender Based Violence ...................................................................................................................................... 46
3.9.1 Existence of GBV .......................................................................................................................................... 46
3.9.2 Forms of GBV ............................................................................................................................................... 47
3.9.3 Level of Reporting of Domestic Violence .............................................................................................. 51
3.10 Gender-related Project Implementation Risks ........................................................................................... 53
CHAPTER 4: CONCLUSIONS AND RECOMMENDATIONS .......................................................................... 54
4.1. Conclusion ............................................................................................................................................................... 54
4.2 Recommendations ................................................................................................................................................ 55
ANNEXES .............................................................................................................. Error! Bookmark not defined.
I. References ................................................................................................................................................................... 58
II. Gender Assessment Tools Used ............................................................................................................................... 58
III. List of South Sudan’s Women CSO Organizations in 7 States Surveyed .......................................................... 58
IV. Field Notes for Focus Group Discussions and Key Informants ............................................................................ 59
V. Cross Tabulation Data Set ....................................................................................................................................... 59
List of Tables
Table 1 - Summary of Reproductive Roles ................................................................................................................ 21
Table 2 - Summary of Productive Roles ..................................................................................................................... 22
Table 3 - Summary of Community Roles ................................................................................................................... 24
Table 4: Men and Women’s Access to Agricultural Extension Services ............................................................ 26
Table 5: Productive Activities - Fishing....................................................................................................................... 27
Table 6: Productive Activities - Beekeeping .............................................................................................................. 28
Table 7: Productive Activities - Marketing and Sell Farm Produce and Cattle ................................................. 31
Table 8: Community Activities - Membership in Village Savings and Loan Associations ............................... 32
Table 9: Productive Activities - Crop Cultivation for Sale .................................................................................... 34
Table 10: Productive Activities - Looking after Cattle for Sale ............................................................................ 35
Table 11 - Summary of Barriers to Participation in Agriculture and Economic Development ..................... 37
Table 12: Distribution of Women’s Organizations in Seven States Surveyed .................................................. 38
Table 9: National Assembly and Decision Making Positions by Sex in South Sudan ....................................... 40
4 | P a g e
Table 10: Composition of South Sudan State Assemblies by Sex ........................................................................ 40
Table 12: Control over Land ........................................................................................................................................ 44
Table 13: Control over Farm Income ......................................................................................................................... 46
Table 14: Whether Women and Men, Girls and Boys Experience Domestic Violence ................................. 46
Table 15: Domestic Violence Experienced by Women .......................................................................................... 47
Table 16: Reporting of Domestic Violence by Women ....................................................................................... 51
Table 17: Household Members and Reporting Domestic Violence Cases to Community Leaders ............ 52
5 | P a g e
AFFIRMATION
Except as acknowledged by the references in this report to other authors and publications, the report
and research described herein consists of our own work undertaken to advance learning as part of the
requirements of the FEED monitoring , evaluation and accountability system.
The primary qualitative and quantitative data collected throughout the evaluation process remain the
property of the communities described in this report and must be used only with their consent.
Robert Waswaga
Team Leader
Kenwill International Limited
July, 2015
6 | P a g e
ACKNOWLEDGEMENTS
The gender assessment in seven states in South Sudan would not have been possible without support
and cooperation of a number of people and organizations. Kenwill International Limited gratefully
acknowledges the valuable contributions of many individuals whose time, expertise and ideas made this
assignment possible.
We would like to thank the entire research team members for the cooperation and hard work during
design of data collection tools, data collection and report writing period. Special thanks also go to staff
of World Vision, CARE and Oxfam at national and state levels for providing technical, financial and
logistical support during field preparation and data collection. We are also grateful to Mr. Vincent
Wanyama, Phillip Agor, Ms Alana Mascoll, Mr. Eric Nimungu, Mr. Garang Alewo and the staff in
Maluakon, Ms Madeleine Bilonda and all the World Vision staff in Kuajok. A special thank you to the
enumerators for the valuable research assistance provided during data collection of gender assessment
and our respondents in the surveyed states.
7 | P a g e
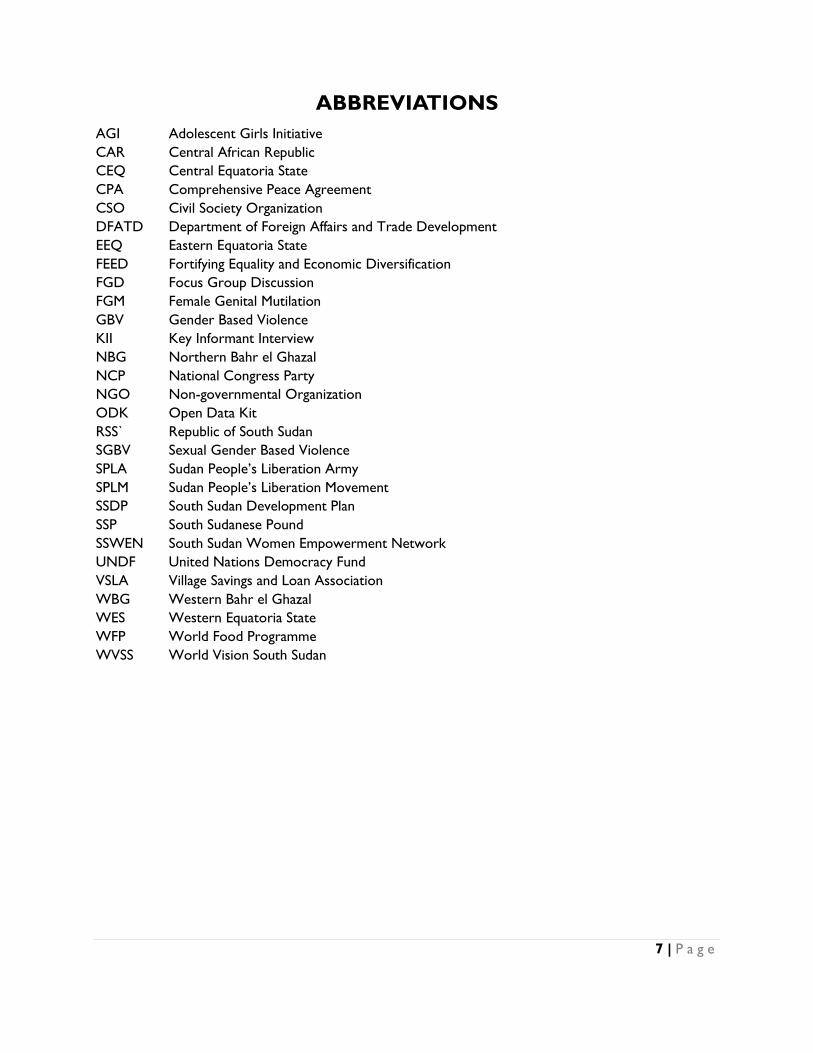
ABBREVIATIONS
AGI Adolescent Girls Initiative
CAR Central African Republic
CEQ Central Equatoria State
CPA Comprehensive Peace Agreement
CSO Civil Society Organization
DFATD Department of Foreign Affairs and Trade Development
EEQ Eastern Equatoria State
FEED Fortifying Equality and Economic Diversification
FGD Focus Group Discussion
FGM Female Genital Mutilation
GBV Gender Based Violence
KII Key Informant Interview
NBG Northern Bahr el Ghazal
NCP National Congress Party
NGO Non-governmental Organization
ODK Open Data Kit
RSS` Republic of South Sudan
SGBV Sexual Gender Based Violence
SPLA Sudan People’s Liberation Army
SPLM Sudan People’s Liberation Movement
SSDP South Sudan Development Plan
SSP South Sudanese Pound
SSWEN South Sudan Women Empowerment Network
UNDF United Nations Democracy Fund
VSLA Village Savings and Loan Association
WBG Western Bahr el Ghazal
WES Western Equatoria State
WFP World Food Programme
WVSS World Vision South Sudan

8 | P a g e
GLOSSARY
Gender: Gender refers to the socially constructed characteristics of women and men – such as norms,
roles and relationships of and between groups of women and men. It varies from society to society and
can be changed. (World Health Organization)
Reproductive activities: Activities performed by men, women, girls and boys at home for daily
survival and well-being of the family e.g. food preparation, caring for children, looking after home,
washing dishes, cleaning, crop cultivation for home consumption etc… (CDRN, 2006)
Productive activities: Activities performed by men, women, girls and boys outside the home with a
purpose of generating resources/income needed for home use e.g. farm activities, livestock rearing,
trade, working in paid jobs etc… (Ibid)
Community activities: Activities performed by men, women, girls and boys which involve other
community members for the well-being and survival of the wider community e.g. participation in political
activities such as local council meetings, project activities, religious activities, funerals, discos, games
etc… (Ibid)
Resources: All supplies, goods, information and technologies that men, women, boys and girls use or
participate in for the purpose of survival or income generation for their households. (Author)
Access to resources: Regarding who among men, women, girls and boys has the authority and ability
to use supplies or participate in activities to generate income for their households. (CDRN, 2006)
Control of resources: Regarding who determines when, where and how resources are managed
amongst men, women, girls and boys. (Ibid)
Ownership of resources: Regarding those who among men, women, girls and boys have the right to
leverage, barter or sell financial and productive assets (Ibid)
Violence against Women: = Any act of gender-based violence that results in, or is likely to result in,
physical, sexual or psychological harm or suffering to women, including threats of such acts, coercion or
arbitrary deprivations of liberty, whether occurring in public or in private life. (UN Declaration on the
Elimination of Violence against Women)
Gender-based Violence: Violence that occurs as a result of the normative role expectations
associated with each gender, along with the unequal power relationships between the two genders,
within the context of a specific society (Bloom 2008, p14).
Gender/Women’s Movement: The combined efforts of South Sudanese advocates who seek to
address the deficiencies that women and girls face, with particular efforts towards advancing their rights,
developing leadership, transforming political arenas and increasing accountability. (Adapted from UN
Women)
9 | P a g e
EXECUTIVE SUMMARY
South Sudan recently attained its independence from Sudan in 2011. The long period of war and conflict
left most socio-economic and political systems of the country devastated. Although the current
government of South Sudan has put in place various laws and policies, institutions and development
projects to rehabilitate the country, many socio-economic challenges remain unattended. It is worth
noting that many socio-economic challenges remain unaddressed, and in particular, women continue to
experience insecurity, marginalization, discrimination, human rights abuses and gender-based violence1.)
The ultimate outcome of the project is to meet basic food security needs and reduce vulnerability
amongst empowered communities and households in Greater Bahr el Ghazal and the Equatorias in
South Sudan and the project intends to benefit 215,144 people (135,645 female and 79,499 male). The
purpose of the gender assessment was therefore to determine the specific areas where FEED can
contribute to gender equity within the project scope. Both qualitative and quantitative methodologies
were used to conduct the gender assessment. A total of 637 respondents (259 males and 378 females)
participated in the assessment at the household level in seven states of Western Bahr el Ghazal,
Northern Bahr el Ghazal, Eastern Equatoria, Warrap, Lakes, Western Equatoria, and Central Equatoria.
A total of 14 focus group discussions and 15 key informant interviews were held and were
supplemented by a review of the existing literature on gender-related issues.
Key Findings and Recommendations
a) Gender relations and division of labour:
Reproductive Roles: Women and girls performed most of the reproductive roles in the
household (cooking, bathing children, washing, cleaning, fetching water and collecting firewood).
Productive Roles: Men performed productive roles (crop cultivation for sale, cattle rearing,
marketing, fishing, beekeeping, poultry production and participation in savings groups). Women,
however, contribute significantly to productive activity, for example, in the form of post-harvest
handling. The assessment found that men and boys had more access, ownership and control of
most productive resources such as land, livestock, farm income, education, and extension
services. They also had ownership of household property, such as bicycles and radios.
Community Roles: Community engagement, in the form of participation in community meetings,
leadership in community structures and groups and community construction works were
performed predominantly by men.
Recommendation: Raise awareness amongst men, women and community leaders about the benefits of
incorporating gender equality into community initiatives and livelihood activities.
b) Participation of Men and Women in Agricultural Production
The FEED project seeks to improve agricultural production and productivity for women and men
through a variety of interventions.
Access to agriculture extension services: Access to agriculture extension services for both women and men
from within the community, state and non-state actors was found low in all states surveyed. Most male
and female farmers use traditional knowledge and skills in crop and livestock production.
1 Institute of Sudd Institute Research for Peace in the Special report dated 28th January 2014

10 | P a g e
Recommendation: Provide agriculture extension services appropriate to both men and women
involved in crop cultivation and livestock production; support the establishment of Farmers’ Field
Schools to act as demonstration sites in different counties to promote practical learning of agricultural
production; support the training of selected government agriculture extension workers in gender and
modern farming methods and technologies.
Participation in post-harvest handling: The assessment found that women performed post-harvest handling
at the household level. Most women, however, use outdated methods that reduce the quality of
produce and consequently, the income realized from sale of farm produce. There are few storage
facilities for agriculture produce and thus, both men and women will typically sell their farm produce
immediately after harvest. Recommendations: Support practical agricultural training of both women
and men appropriate methods of post handling techniques for key enterprises, especially in crop
production. Encourage households and farmers groups to construct storage facilities using locally-
available materials.
Level of access to agriculture inputs and technology: The assessment found limited access by both men and
women to agriculture inputs in all states surveyed. There was low use of modern technology in
agriculture production and other economic activities by both men and women. Male and female farmers
in target areas cannot afford farming inputs on their own without external support. There are few shops
in villages that sell agriculture inputs. Recommendations: Procure and distribute relevant agricultural
inputs to male and female farmers relevant for crop production such as seeds, hoes, ‘pangas’, axes, ox
ploughs, tarpaulin for drying of crops. Procure and distribute improved breeds of crop varieties (cassava
stems, maize seeds), animals and poultry, support women and men to start small-scale seed banks
where they can deposit seeds after harvest and withdraw these seeds during the planting season.
Consult female and male farmers to select their own preferred and user-friendly technologies before
procurement and distribution of agricultural inputs.
c) Participation of Men and Women in Economic Activity
Income and Savings: Across all seven states surveyed, the assessment found that a higher percentage of
men (70.9%) and boys (3.2%) market and sell farm produce compared to women (25.1%) and girls
(0.8%).
Men are involved in marketing of high income generating agriculture and economic activities,
such as cattle rearing, cultivation of crops for sale, poultry, fishing, beekeeping, charcoal burning
and farm produce.
Women preferred marketing low income generating agriculture and economic activities, such as
growing and sale of vegetables.
Village Savings and Loans Associations have higher male membership (79.3%) than female
(19.8%)
Recommendation: Support training of women and men in marketing of their agriculture products;
regular and up to date market information to male and female farmers on prevailing prices for different
farm produce or enterprises (maize, cassava, groundnuts, sorghum, millet, vegetables, groundnuts,
honey, mango and pineapple). Support and encourage women in communities to participate and take
leadership position in savings groups and farmers association
d) Opportunities and Barriers to Participation in Agriculture and Economic Development
11 | P a g e
Opportunities: The assessment found that there is a large market for agriculture products, especially food
crops, but that only 65% of men and 57.% of women utilize the available markets. Qualitative findings
further indicated that both male and female casual labourers were available for hire to support farm
production. The relatively stable security conditions in some counties also present an opportunity for
agriculture production and marketing.
Barriers: The barriers to agricultural production and economic activity include illiteracy, inadequate
farming and business management skills, over dependence on rain in agriculture production, limited
access to credit, limited access to improved inputs of farming, and low participation in group farming and
marketing.
e) The Gender Movement and Civil Society in South Sudan
There are state and non-state actors spearheading the gender movement in South Sudan.
Opportunities in the Gender Movement: The Transitional Constitution 2011 and gender policy has
created opportunity for increased women participation in policy and decision-making.
Challenges in the Gender Movement: However, coordination, funding, transport and capacity of
staff remain key major challenges of gender activists in South Sudan. Gender gaps still exist in
national and state policies and laws. There is limited enforcement of gender policies and laws
and community members are not aware of them.
Recommendation: Support and strengthen existing women’s CSO and networks at state and national
levels to continue to advance gender equality. These should be done by supporting activists to lobby
government to implement existing gender related laws and to enact new gender laws. Support CSO
activists to regularly monitor and report abuses and violations of women and girls’ rights. Support
training of CSOs and government leaders on gender issues.
f) Equitable Ownership of Productive Resources and Participation
One of the aims of the FEED project is to increase women’s access to productive assets and land rights.
Productive Resources: Limited access, ownership and control of land by women is due to local
cultural beliefs and practices in different states which in turn limits women’s participation in
productive activities. Property ownership by both men and women is a constitutional right in
the Transitional Constitution, 2011. Most findings showed that across the seven states surveyed
that household assets are mostly owned by men (63.4%).
Participation in Leadership: The assessment found limited participation of women in leadership and
decision-making at the boma, payam, county, state and national levels. This was partly due to
low levels of education and low levels of confidence among women. The unequal gender division
of labour between men and women places a burden on women to complete domestic tasks,
while also limiting women’s opportunity to participate in the leadership of community activities.
Recommendation: Support awareness creation of men and women and local leaders including those in
government about the benefits of gender equality in improving community livelihoods. Encourage and
support women’s participation and leadership in farmers groups.
g) Gender Based Violence in South Sudan
The assessment found widespread cases of domestic violence, especially physical assault of women by
their husbands, sexual assault of underage girls and early marriage of girls under the age of 18 years.
The assessment also found high reporting of domestic violence to the community leaders (Boma chiefs
12 | P a g e
and headman) and clan heads; but low reporting to police, local NGOs and religious leaders. However,
most community and clan leaders that handle domestic violence cases are men that have limited
understanding of gender issues. Recommendation: Support sensitization meetings of men and women
as well as local leaders at the village level to enhance understanding of the dangers of domestic violence
and to appreciate the need to respect and promote rights and equality of men and women. Support
female and male activists and civil society groups to regularly monitor and report cases of gender based
violence to local community leaders, such as boma and payam chiefs. Support local CSOs to lobby for
inclusion of women in arbitration meetings for domestic violence cases reported at the village level.
h) Gender-related Project Implementation Risks
The assessment team identified gender-related risks that might impede the successful implementation of
the FEED project. The major risk identified by most respondents in the assessment was fear of the
resurgence of war and conflict. Some respondents were also unsure if the FEED project would benefit
them. This is due to the limited impact of previous projects implemented in their community by various
organizations.
Anticipated Results of Women’s Empowerment: Most respondents (51.1%) agreed that women’s
empowerment had a low level association with risks of separation or divorce (initiated by
husbands). Most respondents (50.9%) also agreed that women’s empowerment presents a
limited risk that it might reduce the opportunity for marriage of women and girls in the
community. The likelihood of the occurrence of all the above risks was rated low by most
respondents across all seven states surveyed.
Recommendation: Provide project related information to state-level government officials on periodical
basis. This will enhance understanding and increase support by government of project implementation
processes. Involve communities in periodical review of the project performance.
CHAPTER 1: BACKGROUND AND PURPOSE
This section of the report provides an overview of South Sudan, description of the project that was
assessed, objectives of the gender assessment, states that were assessed and layout of this report.
1.1 Background
In 2012, the World Bank estimated the total population of South Sudan at 10.8 million (RSS, 2014).
Women constitute a majority (52%) of the population (CARE, not dated). The average household size is
6 (5th Sudan Population and Housing Census (2008). The country has over 100 ethnic groups with the

13 | P a g e
Dinka and Nuer groups being most dominant. Most nationals are Christians but other religious groups
exist. Oil and gas exploration is the major economic activity and source of revenue for government’s
expenditure. Agriculture production is very low and mostly done for subsistence purposes (Ibid).
South Sudan experienced more than three decades (1955-1972 and 1983-2005) of civil war which left
the socio-economic and political systems of the country devastated and forced millions of South
Sudanese nationals to flee and stay as refugees in the neighboring countries for many years. Southern
Sudanese and Nuba women and children were uniquely victimized, exposed to gender-based violence
and forced into slavery during the lengthy wars. The signing of the Comprehensive Peace Agreement
(CPA) in 2005 between the Sudanese Peoples Liberation Movement (SPLM) and the National Congress
Party (NCP), the ruling party in Sudan at the time, ushered in a new era of peace, jubilation and hope for
the development of the country (Ibid).
Since 2005, the SPLM government in power has made progress towards socio-economic and political
transformation and development of the country, including enacting and adopting the Transitional
Constitution 2011. This constitution provides a national regulatory framework for all affairs of the
country, including the Bill of Rights and affirmative action that provide for 25% representation of women
in executive and legislature arms of government. The government has also enacted various laws and
policies such as the Child Act 2008, and the National Gender Policy 2013 that among other things,
promote gender equality and streamline processes. A Ministry of Gender, Child and Social Welfare was
also established to oversee and promote gender equality (Ibid). These actions have increased women’s
presence and participation in different government institutions, something which was new within the
context.
The government has also made some progress in the economic empowerment of women. The
government has put in place legal and policy frameworks supportive of women and men’s participation
in various economic activities. The government has for instance, formulated the Land Act 2008,
Agriculture Strategy, National Cooperative Strategy and South Sudan Development Plan to promote the
economic empowerment of women (Ibid). These policies and laws, if implemented and/or enforced will
make a significant contribution to addressing gender inequalities, through increasing the participation,
access, ownership and control of productive resources by women in communities.
In partnership with international development agencies, the Government of South Sudan (GoSS) has
supported the implementation of projects geared at the economic empowerment of women, for
example the FARM Project and the WFP local purchase program. The government is also building the
capacity of women in terms of adult literacy, poultry farming, entrepreneurship, computer literacy,
tailoring, and handicraft through the established Women Empowerment Centers in selected states of
Lakes, Western Equatoria and Jonglei. The Government has also initiated Adolescent Girls Initiative
(AGI) to support female school-dropouts in business management skills in three (3) States of Eastern,
Central Equatoria and Western Bahr el Ghazal (Ibid).
While the government has made some progress to promote gender equality, many gender related
challenges and gaps still remain. There are still widespread early marriages and other forms of gender-
based violence in South Sudan (IRIN 2013, CARE, n.d, Edward, 2014, RSS 2014, Isis-WICCE, 2011).
According to the 2006 Sudan Household Health Survey, close to half (48 percent) of all South Sudanese
14 | P a g e
girls between the ages of 15 and 19 are married (HRW 2013). Domestic violence in the form of wife
battering, abduction of women and children during cattle raiding, rape, sexual assault, wife inheritance,
forced and child marriages are commonplace (RSS, 2014). Such ongoing issues stem from the lack of
access to justice, limited women’s voice in decision-making and the denial of rights of women and girls
to own property and participate in economic activities. Insecurity in rural areas perpetuates incidences
of rape, abduction of women and children, disease and deprivation of human dignity of women (Ibid).
The long periods of civil war provided an abundance of small arm weapons that were frequently used to
intimidate or force girls into early marriage and sex (Edward, 2014). It should be noted that there is no
specification of the minimal legal age for marriage in the Transitional Constitution 2011 (Ibid).
There is a high illiteracy rate among women in South Sudan and this limits their participation in politics
and other public affairs of the country (Edward, 2014). Education rates are low with only 27% of the
adult population literate: 40% of men over 15 years of age are literate compared to 16% of women over
15 years. UNICEF estimates that 70% of children aged 6-17 years have never set foot in school (CARE,
not dated). Female enrolment in primary school stood at 40.1% compared to 59.9% for boys in 2010.
Female enrolment into secondary schools was only 29% compared to 71% for males in 2010. Similarly,
female enrolment at the university level was only 18% compared to 82% for males in 2010. The
pastoralist communities in Lakes and Northern Bahr El Ghazal have the lowest female enrolment rates
at all levels of education (RSS, 2014). In addition, there is limited awareness and appreciation of
education of the girl child by communities. Cultural practices and domestic chores continue to restrict
girls’ access to school. Furthermore, most schools lack supportive facilities for girls during their
menstrual cycle, a situation that contributes to girls withdrawing from school prior to graduation. Isis-
WICCE, 2011)
The government has made progress in the provision of women-focussed health services. Through the
Ministry of Health, it has built and equipped ten antenatal clinics, eight laboratories, five maternity wards,
five monitoring and evaluation facilities, four community resource centers, three blood banks and two
teaching institutions in South Sudan (RSS, 2014). The government has also trained 500 staff in midwifery,
nursing, blood safety, universal precautions and infection control and pharmaceutical management (Ibid).
However, access to better health services remains a challenge to the average South Sudanese woman.
South Sudan has the highest maternal mortality rate in the world (2,054 per 100,000). (Care, n.d). One
in seven women will die from childbirth or pregnancy related complications. Infant mortality rates are
also extremely high, with 75 children per 1,000 dying before their first birthday, affecting more male
than female infants (CARE, not dated). The rate of child mortality is one of the highest in the world at
150/1000; under-five mortality rate is at 250/1000, meaning that one out of every four children born is
likely to die before reaching the age of five. Contraceptive use is as low as 4.7% and family planning and
child spacing are not considered (RSS, 2014). There are poor and few health care facilities and a
shortage of specialized mother and child health workers including nurses and mid wives. This is made
worse by lack of information on safe motherhood and access by rural women to child health services
(Ibid).
1.2 Description of FEED Project
The assessment focused on gender related issues of the Fortifying Equality and Economic Diversification
(FEED) project. This project is being implemented by a consortium of three international organizations,

15 | P a g e
including World Vision as the lead agency, along with CARE and Oxfam. The FEED project will benefit
60,000 households (approximately 215,000 direct beneficiaries and 353,000 indirect beneficiaries) within
three years at a cost of CAD $20 million.
The ultimate outcome of the FEED project is to meet basic food security needs and reduce vulnerability
amongst empowered communities and households in Greater Bahr el Ghazal and the Equatorias in
South Sudan. The first intermediary outcome “enhanced adaptive capacity of individuals, households and
communities for sustained gains in agricultural production and productivity” particularly focuses on skills
transfer for production, market development, food utilization and risk reduction. The second
intermediary outcome, “improved equitable and inclusive agriculture and protection policies, services
and structures, particularly for women and marginalized populations”, was designed to advance equality
by addressing gender-linked disadvantage. It addresses deep rooted social assumptions about women,
men, boys and girls that restrict equitable participation in food production and market activity. It also
addresses gender-based violence in the target areas.
The design of the FEED project was based on the premise that women and girls face key challenges in
South Sudan, particularly with regard to agriculture. As per the Transitional Constitution 2011, women
have equal rights to participate in socio-economic development processes like men (including the
fundamental right to access safe and nutritious food), however these rights are currently not fully
enjoyed in South Sudan. There are millions of people who suffer from limited access to services and
resources, particularly women. The inequitable divisions of labour at the household level and patriarchal
decision-making processes have negatively impacted agricultural production, women’s participation in
leadership capacities, peace processes and economic spaces. Women have less access to land and fewer
resources for conservation agriculture, post-harvest production and improved food utilization despite
the fact that women form 80% of the food production labor in South Sudan2. In addition, capacity
building efforts have historically ignored women’s triple burden of reproductive, productive and
community responsibilities. They have also ignored the differences between men and women’s physical
strength and women’s lower literacy levels. Women have lesser control of assets and more limited
access to vocational training or financial institutions to take advantage of market realities. Men are also
faced with unique security challenges related to conflict over cattle and grazing land.
1.3 Purpose of Gender Assessment
The overall purpose of gender assessment was to determine the specific areas where the FEED
consortium can contribute to gender equality within the project scope. The findings of the assessment
were intended to guide the consortium members to adapt project activities and implementation
methodology and ensure that FEED will directly contribute to all three DFATD‘s gender policy
objectives which are:
i). To advance women’s equal participation with men as decision makers in shaping the sustainable
development of their societies;
ii). To support women and girls in the realization of their full human rights; and
iii). To reduce gender inequalities in access to and control over the resources and benefits of
development
2 South Sudan: An Infrastructure Action Plan - A Program for Sustained Strong Economic Growth, African Development Bank, 2013.

16 | P a g e
Specifically, the findings of the assessment were intended to help FEED consortium members gain an
understanding of gender relations, specifically in the sector of food security and livelihoods, examining
control of resources and the division of labour between men and women, including domestic (household
and reproductive) and community work. The assessment findings were also intended to help
consortium members gain an understanding of current cultural practices which promote and/or hinder
gender equality, specifically gender based violence.
1.4 Project Location and Areas Assessed
The gender assessment was conducted in seven states where the FEED project will be implemented in
South Sudan. Nine of the 15 project counties were assessed and at least one county was selected and
assessed in each state. These assessment areas included: Western Bahr el Ghazal (Wau county),
Northern Bahr el Ghazal (Aweil East county), Eastern Equatoria state (Torit county), Warrap (Tonj
South and Gogrial West counties), Lake state (Wulu county), Western Equatoria (Yambio and Tambura
counties) and Central Equatoria State (Juba county).
1.5 Structure of the Report
The first section of the report provides a background of South Sudan, highlighting progress made and
challenges that still remain in respect to gender equality. The background section also provides an
overview of the FEED project including the project goal and objectives and geographical location of the
project. Section two provides an outline of the methodology used to conduct gender assessment. This
section also provides an overview of the data collection methods, sample size and selection technique
used, data analysis, challenges and limitations of the assessment.
Key findings and discussions have been provided in section three of the report in accordance with key
gender thematic areas: gender relations and division of labour among men, women, girls and boys;
access to, ownership of and control over resources by men and women; cultural barriers that affects
equality of women with men; level of participation by men and women in agriculture and economic
activities, gender-based violence that affect women and men; and status of gender movement and civil
society in South Sudan. The report ends with conclusions and recommendations for World Vision,
Oxfam and CARE to consider during implementation of the project.

17 | P a g e
CHAPTER 2: METHODOLOGY
2.1 Study Design
A combination of qualitative and quantitative study methodologies were used to conduct the gender
assessment. This was done with the aim of generating both statistical and community testimonies
relevant for the FEED project.
2.2 Process of Gender Assessment
The gender assessment process was composed of four major phases. The first phase involved a literature
review and the development and refinement of tools for data collection (see a copy of data collection
tool used attached in Annex II of this report). This phase also involved the recruitment and training of
enumerators for the collection of quantitative data. The second phase of the assessment involved actual
data collection from the field in the seven states in South Sudan. The third phase involved recording
qualitative data, cleaning data, data analysis and writing the draft gender assessment report. The final and
fourth phase involved solicitation of feedback on the draft report from the consortium members. These
comments were incorporated into the report before a final assessment report was submitted to World
Vision.
2.3 Methods of Data Collection
The gender assessment methods were designed to ensure the results were gender-sensitive and
accurate. KIIs and FGDs were conducted by male and female facilitators. Given the low levels of
literacy, especially amongst women, it was difficult to achieve gender balance with enumerators (53 male
and 9 female). Quantitative data was collected using electronic household questionnaires directed at the
head of household. All household questionnaires were installed on tablets computers using the Open
Data Kit (ODK) software application. Each completed household questionnaire was immediately
uploaded into the ODK database via the internet. Qualitative data was collected using focus group
discussions (FGDs) and key informant interviews (KII). (See list of tools used in Annex II.) In addition,
secondary data was collected through comprehensive review of existing literature on gender to
supplement on primary data collected from the field. A list of references reviewed is attached to this
report.
2.4 Sampling and Sample Size
A total of 637 respondents (259 male and 378 female) from seven states and nine counties participated
in the survey. A total of 9 women-only and 5men-only FGDs and 15 KIIs were held in all seven states to
ensure both men and women were given the space to independently discuss issues that affect them
without any interference. KIIs consisted of leading civil society actors and government officials especially
those from State Ministry of Agriculture and Ministry of Gender selected from four states. Participants
for both KIIs and FGDs were purposely selected based on sex, experience and roles they play in the
community and government at different level.
a) Quantitative Survey Sample determination

18 | P a g e
The quantitative survey sample size was determined using Cochran’s Z-formula of proportional
allocation given by; (no) = (N)/ [1 + N (e)2 ]; where:
n0=Sample size
N=Population (Number of households targeted by the project) =60,000 households
E=Margin of error =0.04 or 4%
Therefore using the Cochran Z-formula, the sample size (no) = (60,000)/ [1 + 60,000 * (0.04)2] was
619. The adjusted sample size at 90% expected response rate aimed at minimizing non-response
error was 687. Therefore 619 ≤ n ≤ 687 was considered to be satisfactory for this survey. The actual
sample of 637 respondents was within the above specified limits.
Using proportion to size allocation formula; nij=(ni∕N)*n the sample size of 687 was distributed to the
different states, counties and payams according to the target beneficiary household population. The
sample was composed of 59.3% women respondents and 40.7% male respondents from sampled
households. More women were targeted because they are the most marginalized and require to be
given space to participate in process like the gender assessment. Most gender concerns greatly affect
women rights and welfare.
b) Sampling of Survey Areas and Survey Respondents
The gender assessment covered all the seven states to be covered by FEED project. The same nine
counties surveyed in the FEED baseline were used in this study. Counties, payams, bomas and villages
were selected using simple random sampling without replacement. Therefore, nine counties were
sampled. In each payam, at least two bomas from which two villages in each were randomly selected.
While standing in the middle of a selected village and one compass direct was randomly selected. The
immediate household in the chosen compass direction marked the random start household. Men and
women in the chosen direction were interchangeably interviewed till required village sample was
realized.
The sampling approach was necessitated by limited information vital for use of simple random sampling.
The only information available for sampling was summary of households and individual population per
state, county, payam and bomas. The boma names were coded without limited information and the
villages were unknown. Even lists of households were also absent. The sampling approach was therefore
selected to address above challenges and yet ensure that the sampling process was random as possible.
2.5 Data Analysis
The analysis of data collected was done using qualitative and quantitative methodologies. Quantitative
data collected was downloaded from the ODK database and transferred into Microsoft Excel for the
purposes of cleaning and definition of variables assessed. Quantitative data was later transferred into
SPSS computer software for further analysis and generation of relevant tables and graphs. Qualitative
data was analyzed using content analysis following key thematic areas of the assessment. This involved
reducing and summarizing data with common trends while noting differences represented within the
data.
19 | P a g e
2.6 Validity and Reliability of Finding
The data collection instruments were pre-tested and adjusted before they were used to collect actual
data used for this assessment and enumerators were trained on how to use the various data collection
instruments. These enumerators were also trained on key research ethics to follow during data
collection. All these measures enhanced the quality and reliability of the data collected.
2.7 Challenges Faced in the Assessment
The assessment team faced the following challenges during the data collection:
Data collection in some states (Lakes and WBG) was disrupted by concerns of insecurity in
selected payams and bomas. This limited the ability of the assessment team to collect the
targeted sample size for both qualitative and quantitative data within the planned schedule. This
lowered the reliability of the data in those areas.
Inadequate coordination and mobilization of enumerators in some states, such as CEQ and EEQ.
This impacted the ability of the assessment team to collect the targeted sample size for both
qualitative and quantitative data.
Most primary data on gender was collected at state level and less at national level due to limited
time
The above challenges were addressed by the assessment team during data collection by undertaking a
number of strategies: 1) the original planned timeframe for data collection was extended to allow data
collection from states at a time of enhanced security; 2) the assessment team worked closely with the
field staff of partner organizations to enhance coordination and mobilization of respondents in different
states; 3) a comprehensive review of existing secondary literature for national level gender issues was
conducted to supplement data collected at state level.
2.8 Limitation of the Assessment
This gender assessment was only for seven states in South Sudan. The findings of this
assessment should not be generalized as a comprehensive gender assessment for the entirety of
South Sudan.
This gender assessment did not comprehensively cover gender issues related to education,
health and employment.
Most of the issues covered in the assessment focused on gender issues which men and women
experienced between 2005 and 2015. The assessment did not cover war or gender related
issues related to the pre-Comprehensive Peace Agreement period.
20 | P a g e
CHAPTER 3: GENDER ASSESSMENT FINDINGS
This section of the report presents key findings from the seven selected states. The findings have been
presented in accordance with the identified key thematic areas.
3.1 Socio-economic Characteristics of Respondents
The assessment team consulted a range of men and women with varied socioeconomic and
demographic backgrounds, with regard to sex, marital status, education level and major source of
livelihood.
A total of 637 respondents participated in the household survey. The percentage of female participation
(59.3) in the gender assessment was higher than male participation (40.7%) largely due to the assessment
design, which sought to target 60% women and 40% men. The difference between planned and actual
respondents was negligible. There was a slightly higher percentage of male-headed households 49.3%
compared to 48.7% female-headed households, while 2% were child-headed households below 18 years
of age).
The greatest number of households assessed were in Western Equatoria (32.0%) followed by Warrap
(25.9%), Eastern Equatoria (17.0%), Lakes (7.8%) and Central Equatoria (7.1%). Only 5.3% and 4.9% of
the respondents from WBG and NBG states respectively participated in the assessment.
Overall, the level of education attainment for most head of households surveyed was found to be very
low. In all states surveyed, almost a third of female heads of households (31.2%) and more than a
quarter (25.2%) of male heads of households had not completed primary school. Furthermore, out of
637 head of households surveyed, 42.5% (adult females 48.7% and adult males 37.3%) had no formal
education at all. This percent was even higher in Lakes (74.0%), NBG (71.0%) and Warrap (70.9%). Only
13.5% heads of household surveyed (12.7% adult females and 13.7% adult males) were found to have
completed primary level of schooling. The percent of head of households found to have completed the
South Sudan Certificate of Education was only 4.9% (2.6% adult females and 7.3% adult males).
Most respondents (67.7%) that participated in the assessment were from the World Vision project
areas, followed by 17.0% and 15.4% from CARE and Oxfam respectively. This is reflective of the relative
distribution of beneficiaries amongst consortium members.
3.2 Gender Relations and Division of Labour
3.2.1 Reproductive Roles
Overall, both qualitative and quantitative assessment data found unequal division of labour among men
and women, and boys and girls in the seven states surveyed. The variation of division of task by state
illustrates that these roles are socially constructed and that there is long-term potential to reshape and
reassign them.
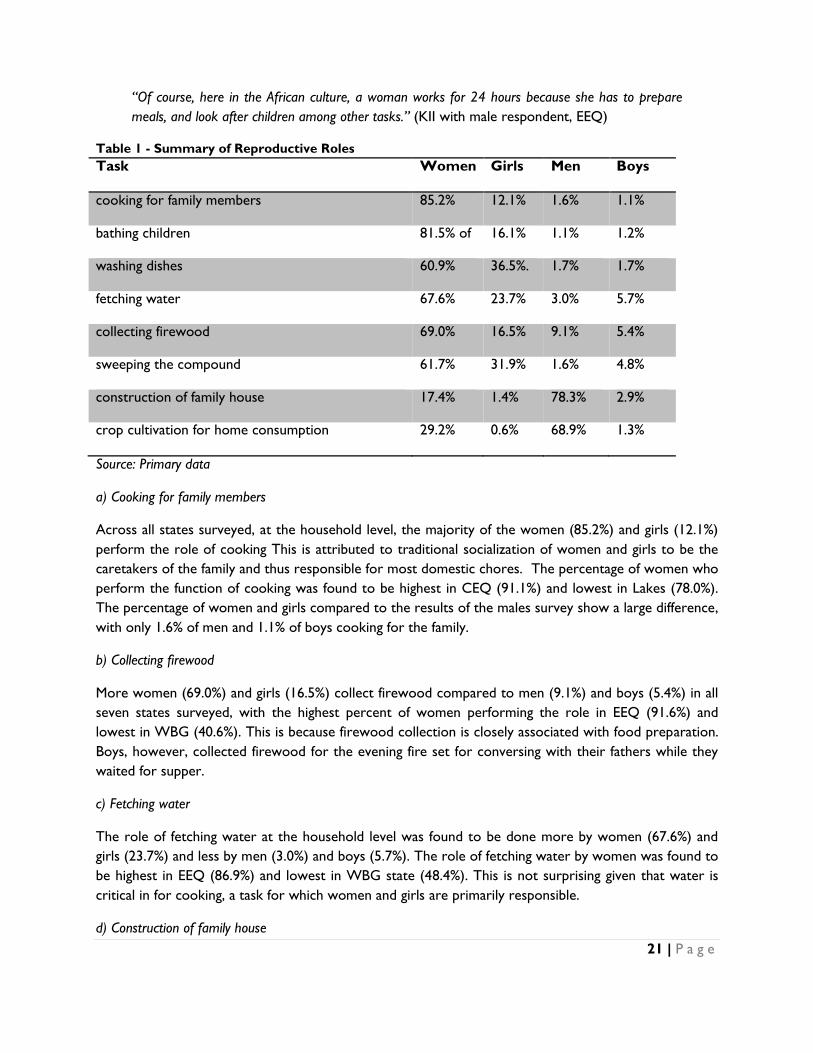
21 | P a g e
“Of course, here in the African culture, a woman works for 24 hours because she has to prepare
meals, and look after children among other tasks.” (KII with male respondent, EEQ)
Table 1 - Summary of Reproductive Roles
Task Women Girls Men Boys
cooking for family members 85.2% 12.1% 1.6% 1.1%
bathing children 81.5% of 16.1% 1.1% 1.2%
washing dishes 60.9% 36.5%. 1.7% 1.7%
fetching water 67.6% 23.7% 3.0% 5.7%
collecting firewood 69.0% 16.5% 9.1% 5.4%
sweeping the compound 61.7% 31.9% 1.6% 4.8%
construction of family house 17.4% 1.4% 78.3% 2.9%
crop cultivation for home consumption 29.2% 0.6% 68.9% 1.3%
Source: Primary data
a) Cooking for family members
Across all states surveyed, at the household level, the majority of the women (85.2%) and girls (12.1%)
perform the role of cooking This is attributed to traditional socialization of women and girls to be the
caretakers of the family and thus responsible for most domestic chores. The percentage of women who
perform the function of cooking was found to be highest in CEQ (91.1%) and lowest in Lakes (78.0%).
The percentage of women and girls compared to the results of the males survey show a large difference,
with only 1.6% of men and 1.1% of boys cooking for the family.
b) Collecting firewood
More women (69.0%) and girls (16.5%) collect firewood compared to men (9.1%) and boys (5.4%) in all
seven states surveyed, with the highest percent of women performing the role in EEQ (91.6%) and
lowest in WBG (40.6%). This is because firewood collection is closely associated with food preparation.
Boys, however, collected firewood for the evening fire set for conversing with their fathers while they
waited for supper.
c) Fetching water
The role of fetching water at the household level was found to be done more by women (67.6%) and
girls (23.7%) and less by men (3.0%) and boys (5.7%). The role of fetching water by women was found to
be highest in EEQ (86.9%) and lowest in WBG state (48.4%). This is not surprising given that water is
critical in for cooking, a task for which women and girls are primarily responsible.
d) Construction of family house

22 | P a g e
The assessment found a high percent of men (78.3%) and boys (2.9%) performing the role of
construction of the family house. This percent was higher compared to only 17.4% of women and 1.4%
of girls do who the same activity. Across seven states, the percent of men that construct homes was
highest in Lakes (94.0%) and lowest in NBG (60.0%).
Findings from the FGDs and KII in NBG revealed that n it is preferred that women thatch roofs because
they are neater as explained in this FGD quotation “Among the Dinka, women are expected to cut grass and
also thatch because they are believed to be artistic and make the huts look beautiful with their touch” (FGD
with women in NBG). In Eastern Equatoria however, the role of house construction is shared between
men and women. On the contrary, women in CEQ said that men alone build houses; as one woman put
it “here it is an abomination for a woman to climb on top of the house- she will be labeled a wizard. Even when
her husband dies, she is expected to get a husband figure from her in laws” (FGD with women, CEQ).
e) Cattle grazing
In states with pastoral communities, such as NBG, young boys are responsible for cattle grazing in the
field. On the whole, women dominate the reproductive roles as summarized by some voices below;
“…Boys don’t do too much work at home except fetching water and sitting by the fire in the evening with their
fathers…” (KII with female respondent, WES)
f) Crop cultivation for home consumption
In all seven states surveyed, there was a high percent of men (68.9%) and boys (1.3%) cultivating crops
for home consumption. This percent was high compared to only 29.2% of women and 0.6% of girls who
do the same activity. Across seven states surveyed, the highest percentage was in in NBG state (75.9%)
and lowest in WBG state (46.9%).
The young girls and boys are socially oriented at home or in the community to perform the above roles
at an early age. Boys may also have few household responsibilities because they have greater access for
formal education. By the time they grow up most of them do not find any problem in performing the
above reproductive roles.
3.2.2 Productive Roles
Overall, the assessment found that men perform more productive activities than women across all
states surveyed. Traditionally income generating activities and activities occurring outside the
households are conducted by men. There were however, some variations in the performance of
productive roles among men and women, girls and boys in all states surveyed. The key findings are
indicated below.
Table 2 - Summary of Productive Roles
Summary of Productive Roles
Performed by women
and girls
Performed by men and
boys
performed by
women, men, girls
and boys

23 | P a g e
Brewing local alcohol raising and selling cattle Quarrying stone
Cultivating and selling
vegetables on a small scale
Hunting and selling meat
from wild animals
sale of grass for roofing
grass thatched houses
Making and selling crafts Producing and selling honey
cultivating and selling
cassava, maize,
pineapples, millet,
sorghum and groundnuts
Baking bread making bricks
Sale of charcoal selling firewood and burning
charcoal
Source: Primary data
a) Productive activities performed by women and girls
Women typically perform productive activities, such as brewing local alcohol, selling vegetables on a
small scale, making and selling of crafts and baking bread. In two locations, NBG and Warrap, women
were found actively engaged in tea business. Since most women are restricted by their husbands from
engaging in businesses that take them far away from their households, most of these economic activities
do not require women to move far from their households. They are also closely aligned with women’s
reproductive roles of feeding and caring for the entire family.
“Women brew local alcohol and sell it in the local community, sell agricultural produce such as
simsim, maize and cassava flour as well as rice. During the dry season, some women are involved in
fishing for income generation purposes” (FGD with women, WES).
b) Productive activities mostly carried out by men and boys
Qualitative findings from most states revealed that many men hunt and sell the meat of wild animals as
one of their key economic activities. They are also involved in beekeeping and the sale of honey. A large
portion of the men surveyed reported being involved in multiple activities as illustrated by the following
quote:
Men also do participate in cultivation of crops such as groundnuts, maize, rice and simsim…
sometime involved in growing of onions, millet, sorghum and cassava. …Men are the only ones
involved in beekeeping and harvesting of honey from forests, hunting of wild animals for sale and
rearing of chicken, pineapples and oranges. Men are involved in beekeeping because this activity is
difficult and women cannot easily manage it. Men are also involved in charcoal burning, sale of
firewood, providing paid casual labour to others and stone quarrying, making bricks as well as
hunting of wild animals for sale”. Some men also go to the border of South Sudan with Central
African Republic to buy and trade in palm oil (FGD with men, WES).
FGDs with both men and women indicated that it is difficult for women and girls to engage in the above
quoted activities as they were characterized as risky.
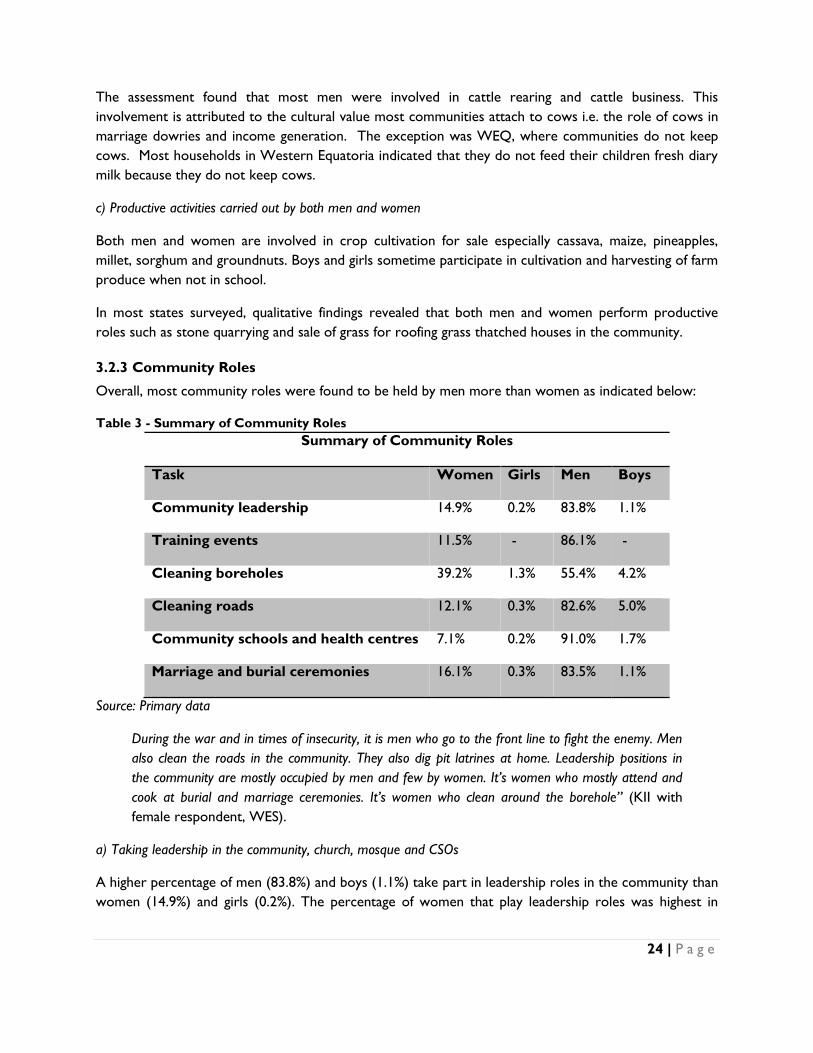
24 | P a g e
The assessment found that most men were involved in cattle rearing and cattle business. This
involvement is attributed to the cultural value most communities attach to cows i.e. the role of cows in
marriage dowries and income generation. The exception was WEQ, where communities do not keep
cows. Most households in Western Equatoria indicated that they do not feed their children fresh diary
milk because they do not keep cows.
c) Productive activities carried out by both men and women
Both men and women are involved in crop cultivation for sale especially cassava, maize, pineapples,
millet, sorghum and groundnuts. Boys and girls sometime participate in cultivation and harvesting of farm
produce when not in school.
In most states surveyed, qualitative findings revealed that both men and women perform productive
roles such as stone quarrying and sale of grass for roofing grass thatched houses in the community.
3.2.3 Community Roles
Overall, most community roles were found to be held by men more than women as indicated below:
Table 3 - Summary of Community Roles
Summary of Community Roles
Task Women Girls Men Boys
Community leadership 14.9% 0.2% 83.8% 1.1%
Training events 11.5% - 86.1% -
Cleaning boreholes 39.2% 1.3% 55.4% 4.2%
Cleaning roads 12.1% 0.3% 82.6% 5.0%
Community schools and health centres 7.1% 0.2% 91.0% 1.7%
Marriage and burial ceremonies 16.1% 0.3% 83.5% 1.1%
Source: Primary data
During the war and in times of insecurity, it is men who go to the front line to fight the enemy. Men
also clean the roads in the community. They also dig pit latrines at home. Leadership positions in
the community are mostly occupied by men and few by women. It’s women who mostly attend and
cook at burial and marriage ceremonies. It’s women who clean around the borehole” (KII with
female respondent, WES).
a) Taking leadership in the community, church, mosque and CSOs
A higher percentage of men (83.8%) and boys (1.1%) take part in leadership roles in the community than
women (14.9%) and girls (0.2%). The percentage of women that play leadership roles was highest in
25 | P a g e
WBG state (30.3%) and lowest in Warrap state (4.9%). This implies that there is still a limited female
presence and voice in decision making arenas in all states surveyed.
Most qualitative findings showed that men are highly engaged in community development-related
activities, such as village meetings, community events, participation in elections and leadership positions.
In all states surveyed, the number of men observed as boma and payam chiefs and headmen was higher
than that of women. Though a few women polled in the FGDs indicated that they participate in
leadership of their community and groups, none of them reported knowing any female boma chiefs. As
such, there is limited female representation in decision-making processes at community level.
b) Training events for community members
The assessment found that a higher percentage of men (86.1%) are involved in training and sensitization
events for community members compared to women (11.5%). Most women are responsible for
domestic chores within the home and thus, have limited time to participate in such events. Culturally
women are taught to believe that participation in sensitization and training events is for men.
c) Construction and maintenance of community schools and health centres
Schools and health centres construction and maintenance is performed primarily by men (91.0%) and
boys (1.7%) with women (7.1%) and girls (0.2%) participating only occasionally. Qualitative findings
confirmed this finding and indicated that construction and maintenance work involves heavy lifting which
women will struggle to manage.
d) Marriage and burial ceremonies
Participation of women and men in social events, such as marriages and burial ceremonies, was
also found to be uneven. Quantitative investigation revealed that marriage and burials were
conducted mostly by men (83.5%) and boys (1.1%) then by women (16.1%) and girls (0.3%) across
the seven states surveyed. Qualitative findings however, showed that women who attend
ceremonies take responsibility for chores, such as cooking, fetching water, collecting firewood,
decorating and cleaning the compound. There is one exception… “it’s men who mostly dig the
grave when someone dies in the community KII with female respondent, WES).
3.3 Level of Participation of Men and Women in Agriculture
The FEED project seeks to promote equitable participation in agricultural production. The following
section examines women, men, boys’ and girls’ participation in extension services, post-harvest handling,
fishing, poultry production, beekeeping and goat rearing.
Access to agriculture extension services
Activity 1.1.1 of the FEED project is to provide extension services and essential inputs. As shown in the
table below, the assessment found that overall a higher percentage of men (88.7%) than women (9.7%)
have access to agriculture extension services. Access to agriculture extension services by women was
found highest in WBG state (41.9%) and lowest in WEQ (6.5%). The above finding implied that women
do not engage in improved agricultural practices.

26 | P a g e
Table 4: Men and Women’s Access to Agricultural Extension Services
Gender
South Sudan State
Total
Central
Equatoria
Eastern
Equatoria Lakes
Northern
Bahr el
Ghazal Warrap
Western
Bahr el
Ghazal
Western
Equatoria
Men 35 98 40 19 145 18 173 528
83.3% 92.5% 85.1% 79.2% 90.6% 58.1% 93.5% 88.7%
Women 4 8 6 5 10 13 12 58
9.5% 7.5% 12.8% 20.8% 6.3% 41.9% 6.5% 9.7%
Boys 2 0 1 0 5 0 0 8
4.8% .0% 2.1% .0% 3.1% .0% .0% 1.3%
Girls 1 0 0 0 0 0 0 1
2.4% .0% .0% .0% .0% .0% .0% .2%
Total 42 106 47 24 160 31 185 595
100.0% 100.0% 100.0% 100.0% 100.0% 100.0% 100.0% 100.0%
Source: Primary Data
Extension services are limited due to the lack of trained extension workers at the state level.
Consultation with County Agricultural Department and State Ministry of Agriculture representatives
revealed that extension workers have been recruited but not adequately trained.
Post-harvest handling
Activity 1.1.2 of the FEED project is to improve post-harvest handling techniques. Overall, the
assessment found a higher percentage of women (66.3%) perform post-harvest handling of farm produce
than men (30.6%). There is however a higher percentage of boys (2.3%) involved in post handling issues
while the percentage of girls (0.8%) remained very low for this activity. Across the seven states
surveyed, the percentage of women involved in post handling issues was highest in Lakes (91.8%) and
lowest in WBG (31.0%). Most qualitative findings also showed that post-harvest handling of farm
produce is predominantly done by women and girls while men typically plough and plant these crops.
This division of labour increases the burden on women and girls as they are also responsible for other
domestic chores, as expressed by a key informant that “women are the ones who weed, plant seeds, fence
the garden to protect it from the animals and are the ones to dry and keep farm produce in the granary” (Male
KII, NBG).
After harvesting, however, most men and women indicated that they immediately sell their farm
produce because they do not have storage facilities. There were few men and women who indicated
that they own and use tarpaulin when drying their produce. In addition, most women indicated that
their produce kept at home is normally attacked by pests and diseases. This reduces the quality and
subsequently the market value of their produce.
“Farmers still use traditional ways of harvesting, drying and storage of crops. Most farmers sell their
crops immediately after harvesting because they don’t have stores to keep them for long period
27 | P a g e
despite our advice to them to do so. Farmers also don’t have pesticides to keep their produce free
from being attacked by insects while in store” (KII with male respondent, WES).
Staple food production
The assessment found high participation of both men and women in staple food production. On a scale
of very high to very low, 51.7% of respondents indicated that there is high participation of women in
staple food production in all states surveyed. Similarly, 49.7% of respondents indicated that men had high
participation in staple food production. This could be attributed to the division of labour in which
women take part in both reproductive and productive roles such as meal preparation and post-harvest
handling.
Small animals
Participation in small animal management, such as goats and sheep, varied between men and women.
Many respondents (44.5%) indicated that there is a very high participation of men in small animal
management activities. Most respondents (56.1%) also indicated that there is a very low participation of
women in similar activities. These small animals generate significant income which is mostly accessed by
men and less by women.
Levels of poultry production were even lower. Most respondents (26.1%) indicated very low
participation of women (26.1%) and men (25.6%) in poultry. The assessment found a higher percentage
of men (58.1%) than women (34.9%) who own poultry. The percentage of women who own poultry was
highest in Warrap state (67.5%) and lowest in Central Equatoria (7.7%).
Qualitative findings revealed that most women and girls perform the role of raising small animals and
poultry at home. It was clear however, that men have ownership and control. This is succinctly
expressed by a female participant in a FGD in Central Equatoria that, “even if you buy the chicken using
your money, it belongs to your husband…even if your husband is working in a government office, he is still in
control of everything in the home because he married you.”
Fishing
The assessment found that a higher percentage of men (75.1%) and boys (13.0%) were involved in fishing
activities compared to women (11.7%) and girls (0.2%) across the seven states surveyed. Participation of
men in fishing was highest in Lakes which stood at 91.5% and the lowest in Warrap (65.0%). The
participation of women in fishing was found to be the highest in EEQ (18.6%), followed by WES (14.5%)
where women only fish in dry season when the volume of water in the rivers has reduced. It was
lowest in Lakes (2.1%) as Table 5 shows below.
Table 5: Productive Activities - Fishing
Gender
Responsible
South Sudan State
Total
Central
Equatoria
Eastern
Equatoria Lakes
Northern
Bahr el
Ghazal Warrap
Western
Bahr el
Ghazal
Western
Equatoria
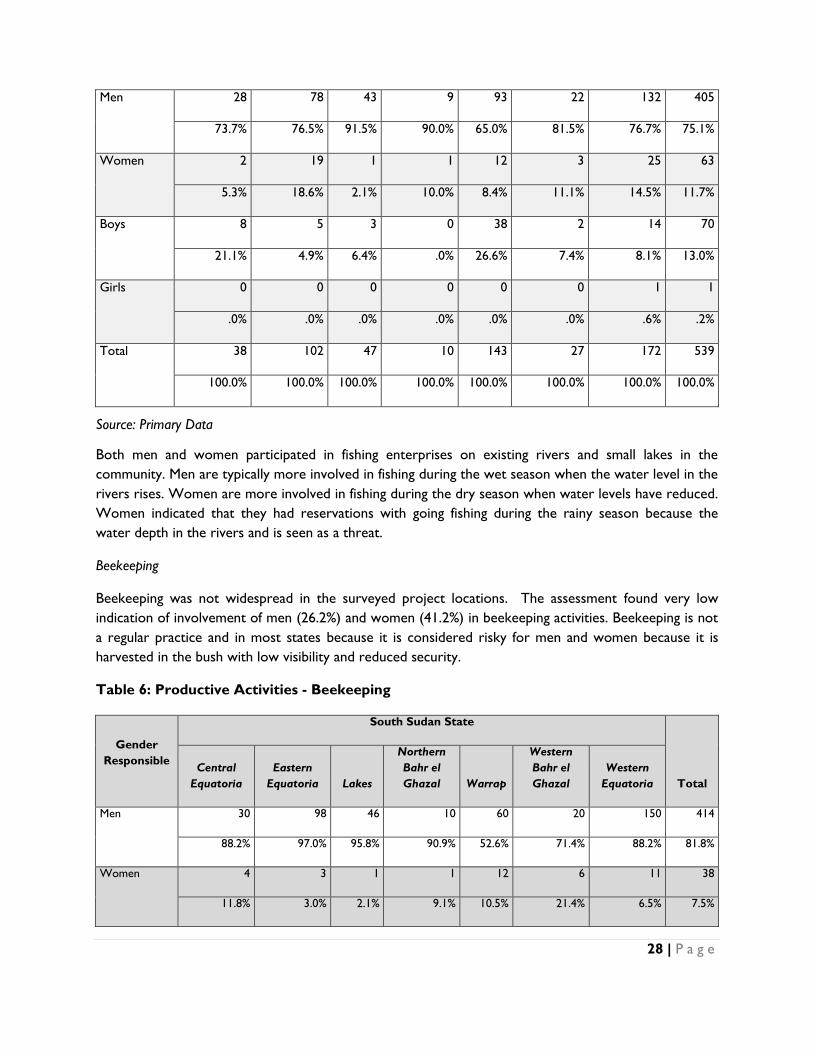
28 | P a g e
Men 28 78 43 9 93 22 132 405
73.7% 76.5% 91.5% 90.0% 65.0% 81.5% 76.7% 75.1%
Women 2 19 1 1 12 3 25 63
5.3% 18.6% 2.1% 10.0% 8.4% 11.1% 14.5% 11.7%
Boys 8 5 3 0 38 2 14 70
21.1% 4.9% 6.4% .0% 26.6% 7.4% 8.1% 13.0%
Girls 0 0 0 0 0 0 1 1
.0% .0% .0% .0% .0% .0% .6% .2%
Total 38 102 47 10 143 27 172 539
100.0% 100.0% 100.0% 100.0% 100.0% 100.0% 100.0% 100.0%
Source: Primary Data
Both men and women participated in fishing enterprises on existing rivers and small lakes in the
community. Men are typically more involved in fishing during the wet season when the water level in the
rivers rises. Women are more involved in fishing during the dry season when water levels have reduced.
Women indicated that they had reservations with going fishing during the rainy season because the
water depth in the rivers and is seen as a threat.
Beekeeping
Beekeeping was not widespread in the surveyed project locations. The assessment found very low
indication of involvement of men (26.2%) and women (41.2%) in beekeeping activities. Beekeeping is not
a regular practice and in most states because it is considered risky for men and women because it is
harvested in the bush with low visibility and reduced security.
Table 6: Productive Activities - Beekeeping
Gender
Responsible
South Sudan State
Total
Central
Equatoria
Eastern
Equatoria Lakes
Northern
Bahr el
Ghazal Warrap
Western
Bahr el
Ghazal
Western
Equatoria
Men 30 98 46 10 60 20 150 414
88.2% 97.0% 95.8% 90.9% 52.6% 71.4% 88.2% 81.8%
Women 4 3 1 1 12 6 11 38
11.8% 3.0% 2.1% 9.1% 10.5% 21.4% 6.5% 7.5%

29 | P a g e
Boys 0 0 1 0 41 2 7 51
.0% .0% 2.1% .0% 36.0% 7.1% 4.1% 10.1%
Girls 0 0 0 0 1 0 2 3
.0% .0% .0% .0% .9% .0% 1.2% .6%
Total 34 101 48 11 114 28 170 506
100.0% 100.0% 100.0% 100.0% 100.0% 100.0% 100.0% 100.0%
Source: Primary Data
Agro-forestry
Overall, the assessment found very low integration of agro-forestry in farming by both women and men
in all states surveyed. Using a five-point scale of very high to very low, 69.4% of respondents indicated
that there is very low integration of women in agro-forestry. Similarly, 59.7% of respondents indicated
that there was very low integration of men. Limited integration of agro-forestry in farming by men and
women was due to limited awareness and knowledge by both men and women on the importance of
agro-forestry in agriculture and environmental conservation.
3.3.1 Use of Technology in Agricultural Production
Use of technology
Respondents agreed that use of rudimentary tools in agriculture production by women (43.5%) and men
(42.5%) limits expansion of their farm size and productivity. Most qualitative findings indicated that both
men and women use traditional and rudimentary tools of production, such as hoes which are a primary
tool used by both women and men on farms. There is limited access to and ownership of a sufficient
number of hoes, pangas, axes and rakes as reported by both men and women. The lack of improved
technology limits the ability of male and female farmers to expand the of size of their farms.
“Most equipment and tools that farmers use in ploughing includes hoes and pangas. Most farmers
don’t have money to acquire good farming implements. Some can’t even afford to buy a hoe. The
only shop where farmers can buy farm implements is Torit town which is far away and the prices of
hoes and pangas are high some farmers cannot afford them” (FGD with women, EEQ).
Most parts of WEQ state are forested with big trees. Undertaking crop cultivation requires cutting
some of these trees down and uprooting their stems to enable effective ploughing and planting. It is
difficult for women and men to prepare land without tools such as axes, powered saws and pangas to
cut these trees which limits their farm sizes and volume of production.
In most parts of NBG, where raising cattle is a dominant activity, agriculturalists suffer with animals
destroying their crops. To protect their garden from animals especially cows, goats and sheep, farmers
have to fence the gardens with sticks. This is a tedious task that limits the size of gardens and is
expected to be constructed by wives.
30 | P a g e
Despite the fact that some parts of South Sudan are dry, small scale irrigation is not a common practice
in crop production or animal husbandry. Most respondents indicated that there is dependence on rain
by women (76.1%) and men (77%) respectively in agriculture production. This is because most men and
women lack relevant skills and equipment which they can use to support small-scale irrigation farming
during the dry season.
Tractors
In all states surveyed, tractors were not used widely. The majority of respondents (85.9%) indicated
that there is very low usage of tractors by women in agriculture production. Similarly 77.0% agreed that
men have very low usage of tractors. Tractors are expensive to acquire by both men and women and
thus, still non-existent in some counties. In some counties where tractors exist, men and women cannot
afford to meet the cost of tractor hire without external support or subsidy.
Hoes and malodas
Overall, the assessment found high usage of hoes and malodas by both men and women across all states
surveyed. Most respondents (68.7%) indicated that there is very high usage of hoes and malodas by men
with slightly less usage by women (64.6%). Hoes and malodas are less expensive to buy and are thus
more accessible. There are also international development organizations that occasionally distribute
hoes to communities. Incidentally, the use of hoes in crop cultivation limits the potential expansion of
agricultural volume and potential produce sold by men and women.
Animal traction
When asked about the use of animal traction, most respondents (78.6%) indicated there is very low
usage by women. Likewise, 70.1% of respondents indicated that men have very low usage.
Acquisition of animal traction equipment and animals is expensive. In some states such as WEQ, where
cattle ownership is lower, most men and women do not use cattle for animal traction. Men and women
in other states lack the skills to use animal traction in crop cultivation.
Use of fertilizers and pesticides
Most respondents (75.7%) indicated there is very low usage of organic fertilizers and pesticides by
women in agriculture production. This percentage was slightly higher than the respondents (65.6%) who
indicated low usage of organic fertilizers and pesticides by men in agriculture production. The above
findings imply that there is low production volume harvested. Most women and men indicated that they
do not know how to control pests and diseases that attack their crops in the garden and in the store.
3.4 Level of Participation of Men and Women in Economic Activity
3.4.1 Features of Economic Activity
Marketing and sale of farm produce
Activity1.2.1of FEED is to increase and equalize male and female farmers’ access to market systems.
Overall, the assessment found a higher percentage of men (70.9%) and boys (3.2%) market and sell farm
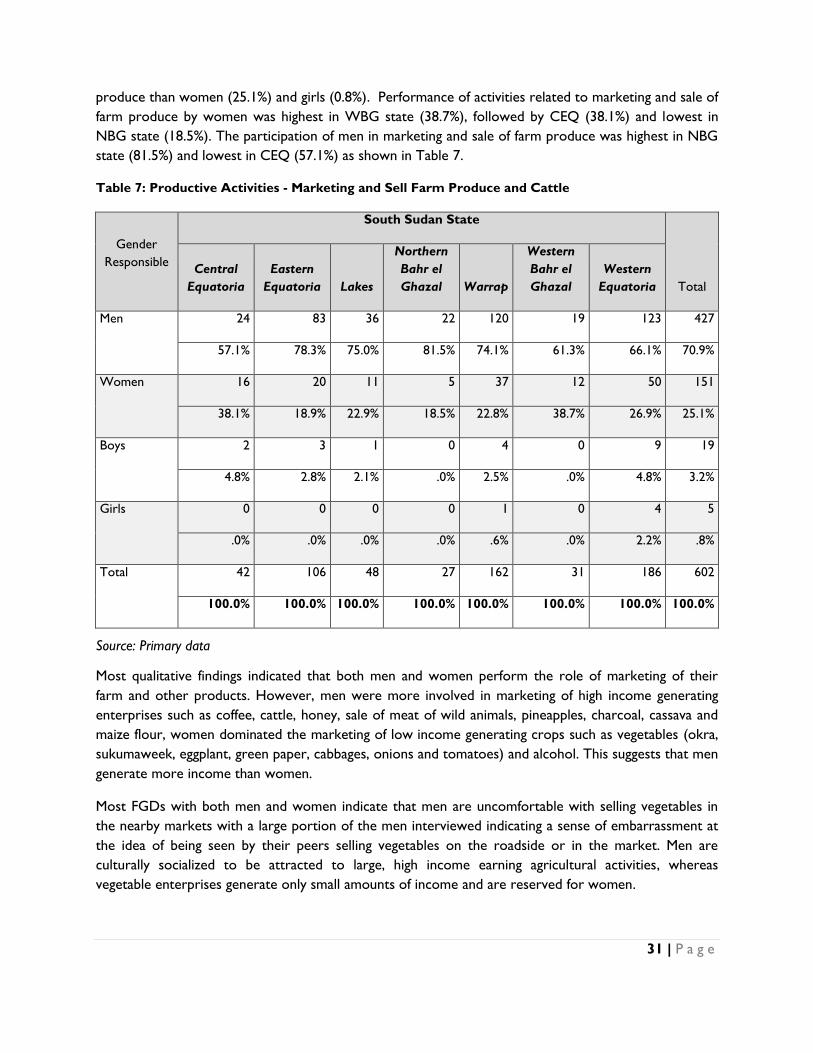
31 | P a g e
produce than women (25.1%) and girls (0.8%). Performance of activities related to marketing and sale of
farm produce by women was highest in WBG state (38.7%), followed by CEQ (38.1%) and lowest in
NBG state (18.5%). The participation of men in marketing and sale of farm produce was highest in NBG
state (81.5%) and lowest in CEQ (57.1%) as shown in Table 7.
Table 7: Productive Activities - Marketing and Sell Farm Produce and Cattle
Gender
Responsible
South Sudan State
Total
Central
Equatoria
Eastern
Equatoria Lakes
Northern
Bahr el
Ghazal Warrap
Western
Bahr el
Ghazal
Western
Equatoria
Men 24 83 36 22 120 19 123 427
57.1% 78.3% 75.0% 81.5% 74.1% 61.3% 66.1% 70.9%
Women 16 20 11 5 37 12 50 151
38.1% 18.9% 22.9% 18.5% 22.8% 38.7% 26.9% 25.1%
Boys 2 3 1 0 4 0 9 19
4.8% 2.8% 2.1% .0% 2.5% .0% 4.8% 3.2%
Girls 0 0 0 0 1 0 4 5
.0% .0% .0% .0% .6% .0% 2.2% .8%
Total 42 106 48 27 162 31 186 602
100.0% 100.0% 100.0% 100.0% 100.0% 100.0% 100.0% 100.0%
Source: Primary data
Most qualitative findings indicated that both men and women perform the role of marketing of their
farm and other products. However, men were more involved in marketing of high income generating
enterprises such as coffee, cattle, honey, sale of meat of wild animals, pineapples, charcoal, cassava and
maize flour, women dominated the marketing of low income generating crops such as vegetables (okra,
sukumaweek, eggplant, green paper, cabbages, onions and tomatoes) and alcohol. This suggests that men
generate more income than women.
Most FGDs with both men and women indicate that men are uncomfortable with selling vegetables in
the nearby markets with a large portion of the men interviewed indicating a sense of embarrassment at
the idea of being seen by their peers selling vegetables on the roadside or in the market. Men are
culturally socialized to be attracted to large, high income earning agricultural activities, whereas
vegetable enterprises generate only small amounts of income and are reserved for women.
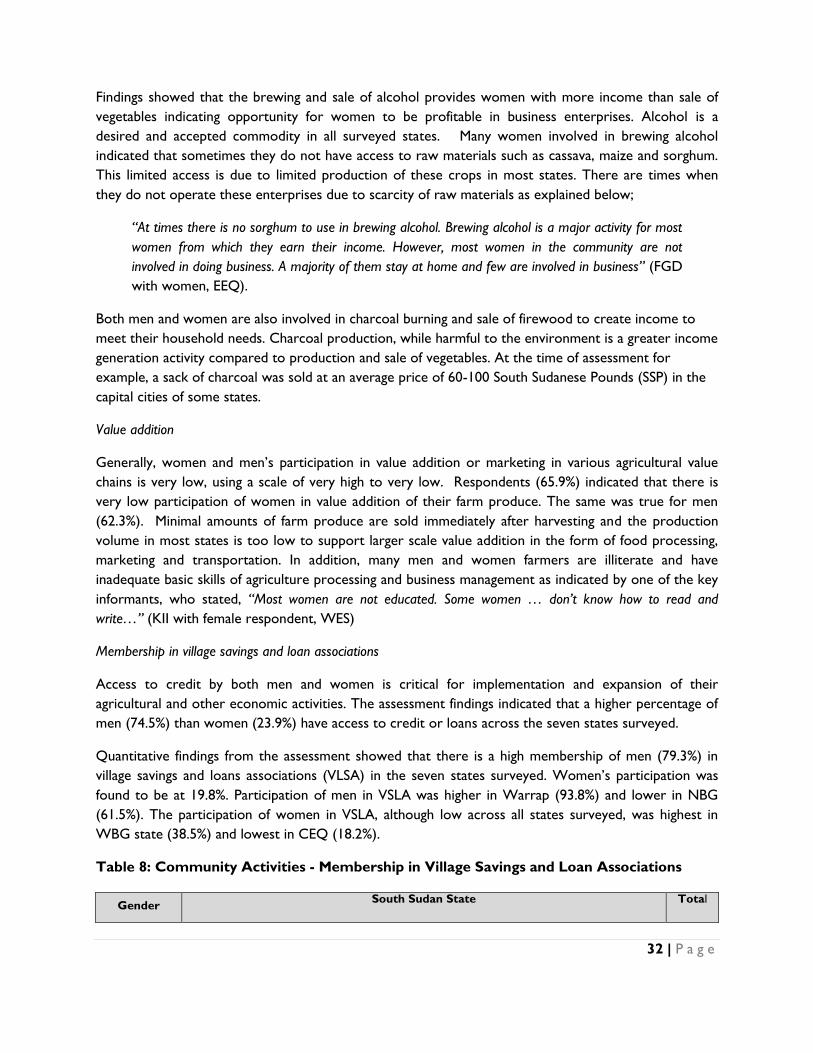
32 | P a g e
Findings showed that the brewing and sale of alcohol provides women with more income than sale of
vegetables indicating opportunity for women to be profitable in business enterprises. Alcohol is a
desired and accepted commodity in all surveyed states. Many women involved in brewing alcohol
indicated that sometimes they do not have access to raw materials such as cassava, maize and sorghum.
This limited access is due to limited production of these crops in most states. There are times when
they do not operate these enterprises due to scarcity of raw materials as explained below;
“At times there is no sorghum to use in brewing alcohol. Brewing alcohol is a major activity for most
women from which they earn their income. However, most women in the community are not
involved in doing business. A majority of them stay at home and few are involved in business” (FGD
with women, EEQ).
Both men and women are also involved in charcoal burning and sale of firewood to create income to
meet their household needs. Charcoal production, while harmful to the environment is a greater income
generation activity compared to production and sale of vegetables. At the time of assessment for
example, a sack of charcoal was sold at an average price of 60-100 South Sudanese Pounds (SSP) in the
capital cities of some states.
Value addition
Generally, women and men’s participation in value addition or marketing in various agricultural value
chains is very low, using a scale of very high to very low. Respondents (65.9%) indicated that there is
very low participation of women in value addition of their farm produce. The same was true for men
(62.3%). Minimal amounts of farm produce are sold immediately after harvesting and the production
volume in most states is too low to support larger scale value addition in the form of food processing,
marketing and transportation. In addition, many men and women farmers are illiterate and have
inadequate basic skills of agriculture processing and business management as indicated by one of the key
informants, who stated, “Most women are not educated. Some women … don’t know how to read and
write…” (KII with female respondent, WES)
Membership in village savings and loan associations
Access to credit by both men and women is critical for implementation and expansion of their
agricultural and other economic activities. The assessment findings indicated that a higher percentage of
men (74.5%) than women (23.9%) have access to credit or loans across the seven states surveyed.
Quantitative findings from the assessment showed that there is a high membership of men (79.3%) in
village savings and loans associations (VLSA) in the seven states surveyed. Women’s participation was
found to be at 19.8%. Participation of men in VSLA was higher in Warrap (93.8%) and lower in NBG
(61.5%). The participation of women in VSLA, although low across all states surveyed, was highest in
WBG state (38.5%) and lowest in CEQ (18.2%).
Table 8: Community Activities - Membership in Village Savings and Loan Associations
Gender South Sudan State Total

33 | P a g e
Responsible
Central
Equatoria
Eastern
Equatoria Lakes
Northern
Bahr el
Ghazal Warrap
Western
Bahr el
Ghazal
Western
Equatoria
Men 35 85 34 16 150 22 134 476
79.5% 79.4% 72.3% 61.5% 93.8% 68.8% 72.8% 79.3%
Women 8 22 13 10 10 10 46 119
18.2% 20.6% 27.7% 38.5% 6.3% 31.3% 25.0% 19.8%
Boys 1 0 0 0 0 0 3 4
2.3% .0% .0% .0% .0% .0% 1.6% .7%
Girls 0 0 0 0 0 0 1 1
.0% .0% .0% .0% .0% .0% .5% .2%
Total 44 107 47 26 160 32 184 600
100.0% 100.0% 100.0% 100.0% 100.0% 100.0% 100.0% 100.0%
Source: Primary Data
Employment opportunities
Activity 1.2.3 in the FEED project is to increase the employability of vulnerable women, youth and men.
Through the assessment men were found to have a high percent (88.1%) of access to employment
opportunities, while women had 9.8%. The lower rate of female access is due to the control that men
have over women’s mobility. Assessment findings indicated that there is a high percentage of men
(86.3%) who have control over employment of their wives outside the households across all states
surveyed, with only 10.8% of women found to have control over which employment opportunity they
can access. Only 10.8% of women were found with control over employment opportunities which they
can access. Limited access and control over employment opportunities limits women’s access to income,
information and leadership.
Farmers associations On a scale of very low to very high, most respondents (64.1%) indicated that there is
very low participation of women in farmers’ associations, such as producer groups and cooperatives.
This was due to the limited existence of farmers’ associations and the weak institutional capacity of
existing farmers’ associations to mobilize farmers. This was substantiated through qualitative inquiry.
The participation of women in farmer associations and cooperatives was highest in Western Equatoria
(31.4%) followed by WBG state (22.6%). Most of farmer groups were concentrated in urban and peri-
urban areas. Access and participation in cooperatives and farmers by most communities in rural areas
was low.
On a related note, most respondents (70.6%) indicated that there is very low participation of women in
collective bulking and sale of farm produce. Similarly, respondents (56.8%) indicated that there is low
participation of men in collective bulking and sale of farm produce across the seven states surveyed.
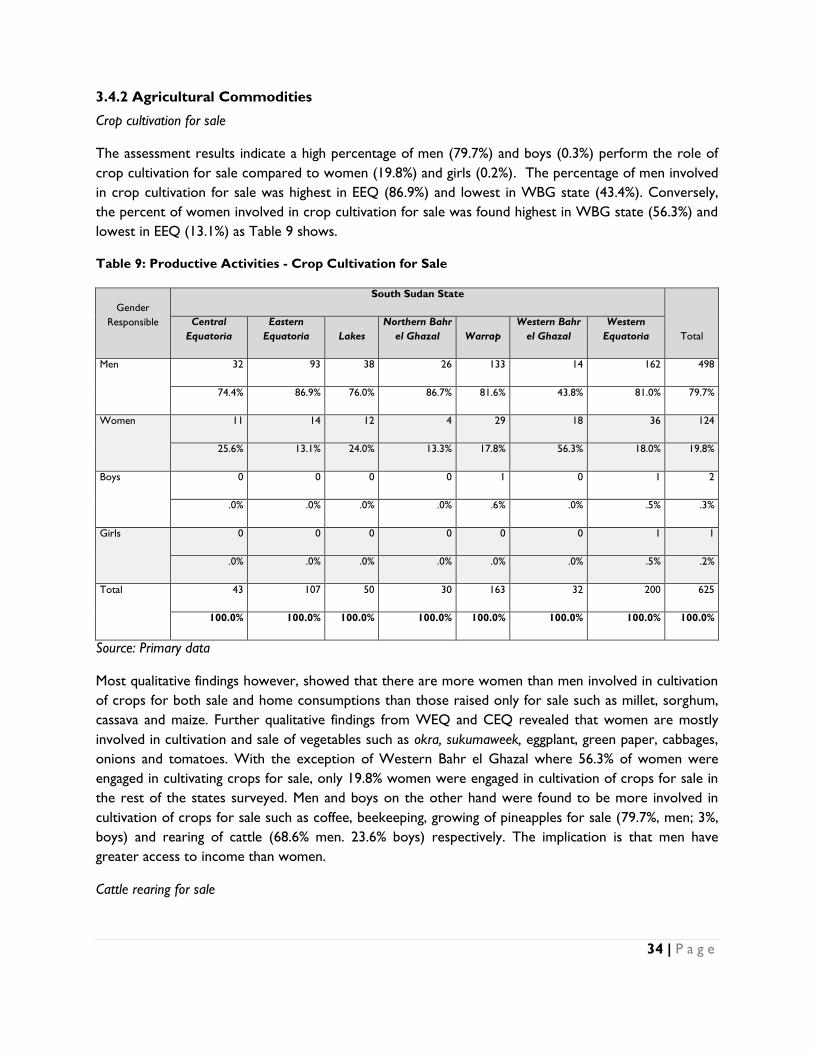
34 | P a g e
3.4.2 Agricultural Commodities
Crop cultivation for sale
The assessment results indicate a high percentage of men (79.7%) and boys (0.3%) perform the role of
crop cultivation for sale compared to women (19.8%) and girls (0.2%). The percentage of men involved
in crop cultivation for sale was highest in EEQ (86.9%) and lowest in WBG state (43.4%). Conversely,
the percent of women involved in crop cultivation for sale was found highest in WBG state (56.3%) and
lowest in EEQ (13.1%) as Table 9 shows.
Table 9: Productive Activities - Crop Cultivation for Sale
Gender
Responsible
South Sudan State
Total
Central
Equatoria
Eastern
Equatoria Lakes
Northern Bahr
el Ghazal Warrap
Western Bahr
el Ghazal
Western
Equatoria
Men 32 93 38 26 133 14 162 498
74.4% 86.9% 76.0% 86.7% 81.6% 43.8% 81.0% 79.7%
Women 11 14 12 4 29 18 36 124
25.6% 13.1% 24.0% 13.3% 17.8% 56.3% 18.0% 19.8%
Boys 0 0 0 0 1 0 1 2
.0% .0% .0% .0% .6% .0% .5% .3%
Girls 0 0 0 0 0 0 1 1
.0% .0% .0% .0% .0% .0% .5% .2%
Total 43 107 50 30 163 32 200 625
100.0% 100.0% 100.0% 100.0% 100.0% 100.0% 100.0% 100.0%
Source: Primary data
Most qualitative findings however, showed that there are more women than men involved in cultivation
of crops for both sale and home consumptions than those raised only for sale such as millet, sorghum,
cassava and maize. Further qualitative findings from WEQ and CEQ revealed that women are mostly
involved in cultivation and sale of vegetables such as okra, sukumaweek, eggplant, green paper, cabbages,
onions and tomatoes. With the exception of Western Bahr el Ghazal where 56.3% of women were
engaged in cultivating crops for sale, only 19.8% women were engaged in cultivation of crops for sale in
the rest of the states surveyed. Men and boys on the other hand were found to be more involved in
cultivation of crops for sale such as coffee, beekeeping, growing of pineapples for sale (79.7%, men; 3%,
boys) and rearing of cattle (68.6% men. 23.6% boys) respectively. The implication is that men have
greater access to income than women.
Cattle rearing for sale
35 | P a g e
The assessment found a higher percentage of men (68.6%) and boys (23.6%) than women (7.1%) and
girls (0.7%) that mostly perform the role of cattle rearing for income generation purposes. The role of
cattle rearing by men was performed highest in EES (85.8%) and lowest in WBG state (33.3%). In
comparison, the percent of women found rearing cattle was highest in WBG state (25.9%) and lowest in
Lakes state (2.1%).
Table 10: Productive Activities - Looking after Cattle for Sale
Gender
Responsible
South Sudan State
Total
Central
Equatoria
Eastern
Equatoria Lakes
Northern
Bahr el
Ghazal Warrap
Western Bahr
el Ghazal
Western
Equatoria
Men 26 91 29 17 97 9 127 396
65.0% 85.8% 60.4% 58.6% 59.5% 33.3% 77.4% 68.6%
Women 4 5 1 1 8 7 15 41
10.0% 4.7% 2.1% 3.4% 4.9% 25.9% 9.1% 7.1%
Boys 10 10 18 10 57 10 21 136
25.0% 9.4% 37.5% 34.5% 35.0% 37.0% 12.8% 23.6%
Girls 0 0 0 1 1 1 1 4
.0% .0% .0% 3.4% .6% 3.7% .6% .7%
Total 40 106 48 29 163 27 164 577
100.0% 100.0% 100.0% 100.0% 100.0% 100.0% 100.0% 100.0%
Source: Primary data
3.4.3 Use of Technology in Economic Activity
Bicycle
Overall, the assessment found very low usage of bicycles by women and high usage of bicycles by men
for personal mobility or transportation of materials. Most respondents (63.0%) indicated that there is
very low usage of bicycles by women in agriculture and other economic activities in all states surveyed.
Alternatively, 57.8% of the respondents indicated that there is high usage of bicycles by men in all states
surveyed. In all states surveyed men have high access to and control over income, much more so than
women. Most of them therefore use this income to buy a bicycle for use in agriculture production and
other economic activities. This was expressed in a FDG as “… few women have access to bicycles because
these are few in the community. There are few men and women in the community that own bicycles” (FGD
with women, WES).
Radio
36 | P a g e
The assessment findings indicated that there is high usage of radios by men and very low by women
across all states surveyed. Nearly half of the respondents (46.4%) indicated that there is high usage of
radios by men in all states surveyed. In comparison, 64.7% indicated that there is very low usage of
radios by women in agriculture and other economic activities. Women are also busy with domestic
chores and have less time to listen to radio. Men therefore have more access to agriculture and
economic related information than women.
“Properties such as radios (-) all family members have access to it. But in most cases, it is men who
listen to the radio than the women because women are always busy with household work. However,
women who have gone to school tend to listen more to radios than those who have not gone to
school. Women who stay at home only listen to the radio when their men are not at home” (FGD
with men, EEQ). “Women have access to radio but in the community there are few people that
own radios. The few radios in the community are owned by men…” (FGD with women, WES)
Energy saving stoves
The assessment found very low usage of energy saving stoves by both men (53.3%) and women(47.0%)
in agriculture and economic activities. Most men and women lack the technical ability to construct and
use energy saving stoves in cooking or for sale.
3.5 Opportunities for Participation in Agriculture and Economic Development
The assessment found various opportunities supportive of agriculture production and marketing. Both
quantitative and qualitative findings indicated that the climate in South Sudan is favorable for agriculture
production and that the vast untapped fertile land in most states as an opportunity for agriculture
production. There is a huge market for agriculture products, but only 65% of men and 57.3% of women
were found utilizing the available markets.
Qualitative findings further indicated that there is enough labour of both men and women that can be
hired to support farm production. The relatively stable security conditions in some counties suggest this
is an opportune time for initiating agriculture production and marketing. The central, western and
southern parts of South Sudan are relatively peaceful and conducive for crop cultivation and animal
husbandry. In addition, there are many international development agencies and donors, such as World
Vision, Oxfam, CARE, DFATD, USAID and WFP that are supportive of agriculture in local communities.
“We have enough fertile land that can support crop cultivation. There are local seeds which we can
use in planting especially for maize, cassava and millet. There is relatively stable rainfall that can
support crop cultivation. (FGD with men, WES)
The presence of emerging towns and trading centres in most states also provides a good opportunity
for marketing different goods and services by men and women. Findings further showed that brewing
and sale of alcohol provides women with more income than sale of vegetables. The assessment found
similar opportunities supportive of both female and male participation in agriculture and economic
activities. However, men were found with a higher percentage of utilization of existing opportunities
than women.
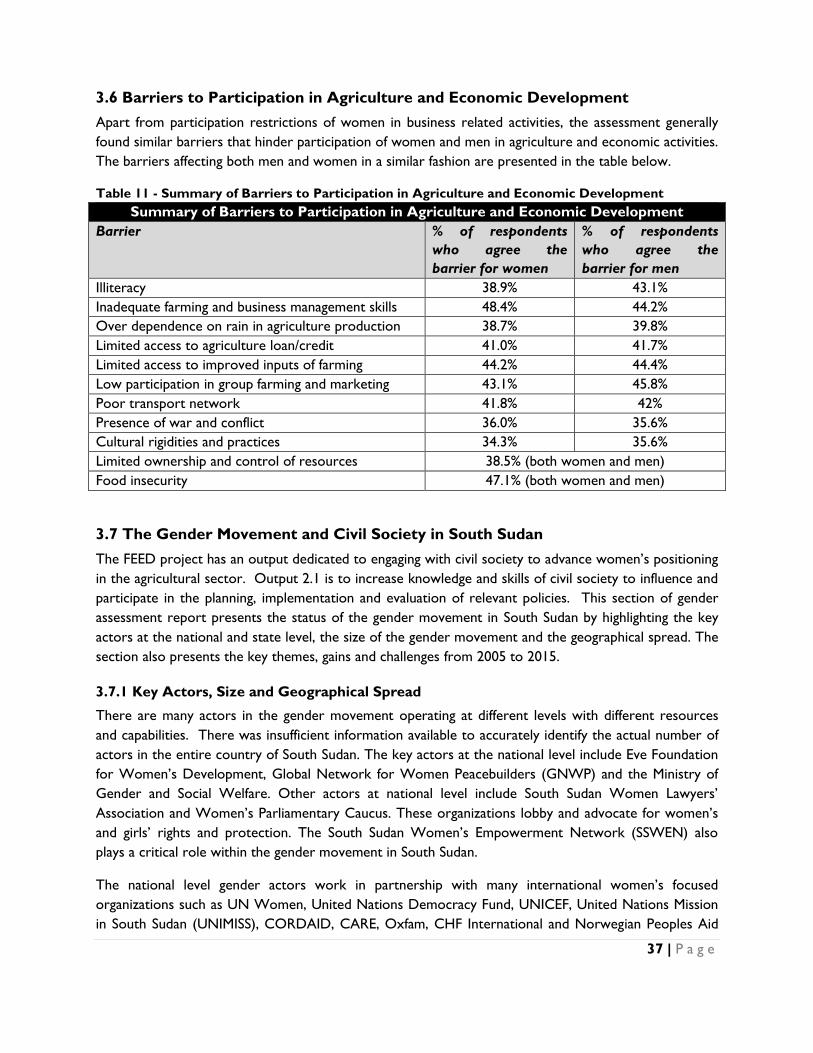
37 | P a g e
3.6 Barriers to Participation in Agriculture and Economic Development
Apart from participation restrictions of women in business related activities, the assessment generally
found similar barriers that hinder participation of women and men in agriculture and economic activities.
The barriers affecting both men and women in a similar fashion are presented in the table below.
Table 11 - Summary of Barriers to Participation in Agriculture and Economic Development
Summary of Barriers to Participation in Agriculture and Economic Development
Barrier % of respondents
who agree the
barrier for women
% of respondents
who agree the
barrier for men
Illiteracy 38.9% 43.1%
Inadequate farming and business management skills 48.4% 44.2%
Over dependence on rain in agriculture production 38.7% 39.8%
Limited access to agriculture loan/credit 41.0% 41.7%
Limited access to improved inputs of farming 44.2% 44.4%
Low participation in group farming and marketing 43.1% 45.8%
Poor transport network 41.8% 42%
Presence of war and conflict 36.0% 35.6%
Cultural rigidities and practices 34.3% 35.6%
Limited ownership and control of resources 38.5% (both women and men)
Food insecurity 47.1% (both women and men)
3.7 The Gender Movement and Civil Society in South Sudan
The FEED project has an output dedicated to engaging with civil society to advance women’s positioning
in the agricultural sector. Output 2.1 is to increase knowledge and skills of civil society to influence and
participate in the planning, implementation and evaluation of relevant policies. This section of gender
assessment report presents the status of the gender movement in South Sudan by highlighting the key
actors at the national and state level, the size of the gender movement and the geographical spread. The
section also presents the key themes, gains and challenges from 2005 to 2015.
3.7.1 Key Actors, Size and Geographical Spread
There are many actors in the gender movement operating at different levels with different resources
and capabilities. There was insufficient information available to accurately identify the actual number of
actors in the entire country of South Sudan. The key actors at the national level include Eve Foundation
for Women’s Development, Global Network for Women Peacebuilders (GNWP) and the Ministry of
Gender and Social Welfare. Other actors at national level include South Sudan Women Lawyers’
Association and Women’s Parliamentary Caucus. These organizations lobby and advocate for women’s
and girls’ rights and protection. The South Sudan Women’s Empowerment Network (SSWEN) also
plays a critical role within the gender movement in South Sudan.
The national level gender actors work in partnership with many international women’s focused
organizations such as UN Women, United Nations Democracy Fund, UNICEF, United Nations Mission
in South Sudan (UNIMISS), CORDAID, CARE, Oxfam, CHF International and Norwegian Peoples Aid
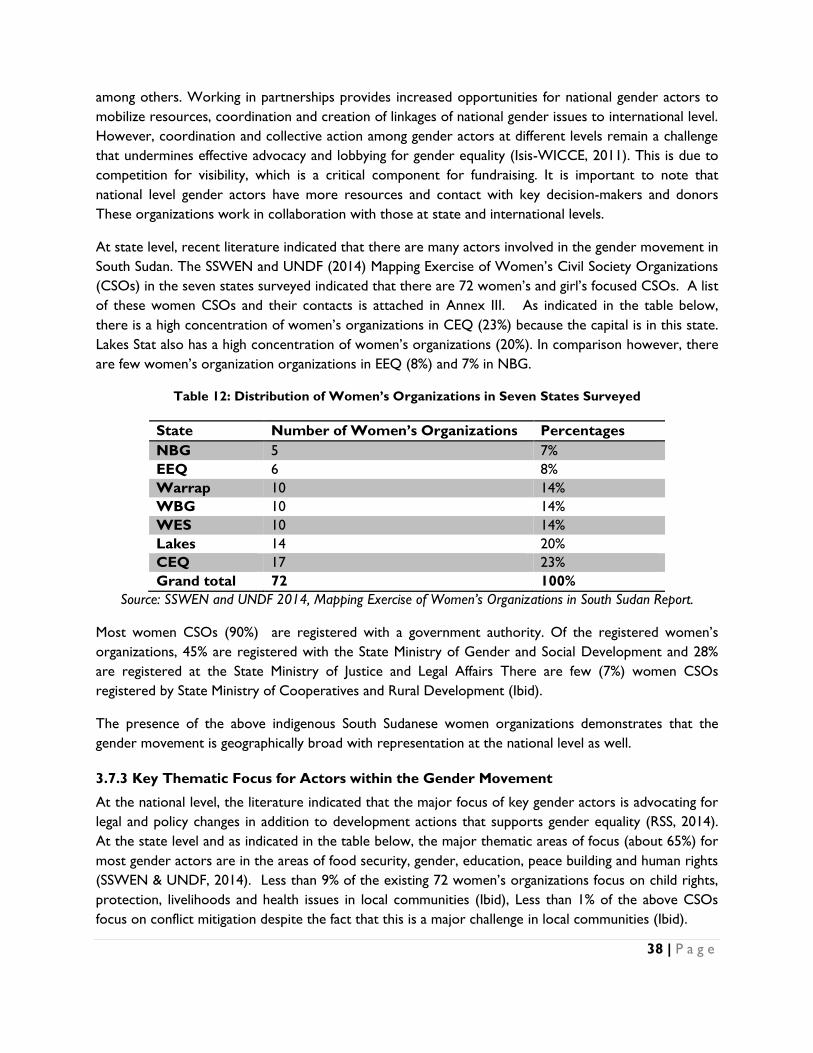
38 | P a g e
among others. Working in partnerships provides increased opportunities for national gender actors to
mobilize resources, coordination and creation of linkages of national gender issues to international level.
However, coordination and collective action among gender actors at different levels remain a challenge
that undermines effective advocacy and lobbying for gender equality (Isis-WICCE, 2011). This is due to
competition for visibility, which is a critical component for fundraising. It is important to note that
national level gender actors have more resources and contact with key decision-makers and donors
These organizations work in collaboration with those at state and international levels.
At state level, recent literature indicated that there are many actors involved in the gender movement in
South Sudan. The SSWEN and UNDF (2014) Mapping Exercise of Women’s Civil Society Organizations
(CSOs) in the seven states surveyed indicated that there are 72 women’s and girl’s focused CSOs. A list
of these women CSOs and their contacts is attached in Annex III. As indicated in the table below,
there is a high concentration of women’s organizations in CEQ (23%) because the capital is in this state.
Lakes Stat also has a high concentration of women’s organizations (20%). In comparison however, there
are few women’s organization organizations in EEQ (8%) and 7% in NBG.
Table 12: Distribution of Women’s Organizations in Seven States Surveyed
State Number of Women’s Organizations Percentages
NBG 5 7%
EEQ 6 8%
Warrap 10 14%
WBG 10 14%
WES 10 14%
Lakes 14 20%
CEQ 17 23%
Grand total 72 100%
Source: SSWEN and UNDF 2014, Mapping Exercise of Women’s Organizations in South Sudan Report.
Most women CSOs (90%) are registered with a government authority. Of the registered women’s
organizations, 45% are registered with the State Ministry of Gender and Social Development and 28%
are registered at the State Ministry of Justice and Legal Affairs There are few (7%) women CSOs
registered by State Ministry of Cooperatives and Rural Development (Ibid).
The presence of the above indigenous South Sudanese women organizations demonstrates that the
gender movement is geographically broad with representation at the national level as well.
3.7.3 Key Thematic Focus for Actors within the Gender Movement
At the national level, the literature indicated that the major focus of key gender actors is advocating for
legal and policy changes in addition to development actions that supports gender equality (RSS, 2014).
At the state level and as indicated in the table below, the major thematic areas of focus (about 65%) for
most gender actors are in the areas of food security, gender, education, peace building and human rights
(SSWEN & UNDF, 2014). Less than 9% of the existing 72 women’s organizations focus on child rights,
protection, livelihoods and health issues in local communities (Ibid), Less than 1% of the above CSOs
focus on conflict mitigation despite the fact that this is a major challenge in local communities (Ibid).

39 | P a g e
3.7.4 Progress of the Gender Movement
Since the signing of the CPA in 2005 and independence of South Sudan from Sudan in 2011, the gender
movement has made significant gains at the legal, institutional and programme levels. The table below
outlines a summary of the progress and challenges experienced from 2005 to 2015 in South Sudan’s
gender movement.
Summary of Gains and Challenges
Gains Challenges
Adoption of Transitional Constitution 2011 Delays in Ratification of Key Conventions
Increased Space in Political Sphere Limited Awareness
Establishment of Gender institutions Discrimination
National Gender Policy Inability to Implement Existing Policies
South Sudan Development Plan Persistence of Practice through Customary Law
Adoption of the Transitional Constitution 2011
In 2011, the Government of South Sudan adopted the Transition Constitution including the Bill of Rights
which guarantees the equality of men and women in different spheres of life. In particular, Article 16 of
the Bill of Rights stipulates a number of women’s rights, which are critical for promoting gender equality
and addressing historical gender inequalities:
(1)Women shall be accorded full and equal dignity of the person with men; (2)women shall have the
right to equal pay for equal work and other related benefits with men; (3)women shall have the right
to participate equally with men in public life; (4)all levels of government shall: (a) promote women
participation in public life and their representation in the legislative and executive organs by at least
twenty-five per cent (25%) as an affirmative action to redress imbalances created by history, customs,
and traditions; (b) enact laws to combat harmful customs and traditions which undermine the dignity
and status of women; and (c) provide maternity and child care and medical care for pregnant and
lactating women. (5) Women shall have the right to own property and share in the estates of their
deceased husbands together with any surviving legal heir of the deceased (Transitional Constitution for
Republic South Sudan 2011).
It is hoped that once the above constitutional provisions are commonly practiced it will address the
gender inequalities resulting from injustices that are rooted in the history and the traditional
cultures of different ethnic groups in the country.
Increased space for women participation in politics and decision making processes
Since independence in 2011, the government of South Sudan opened the political space for women’s
participation and representation in governance and to influence key government. The constitution
provides for 25% quota for women representation in legislative and executive bodies. As a result of
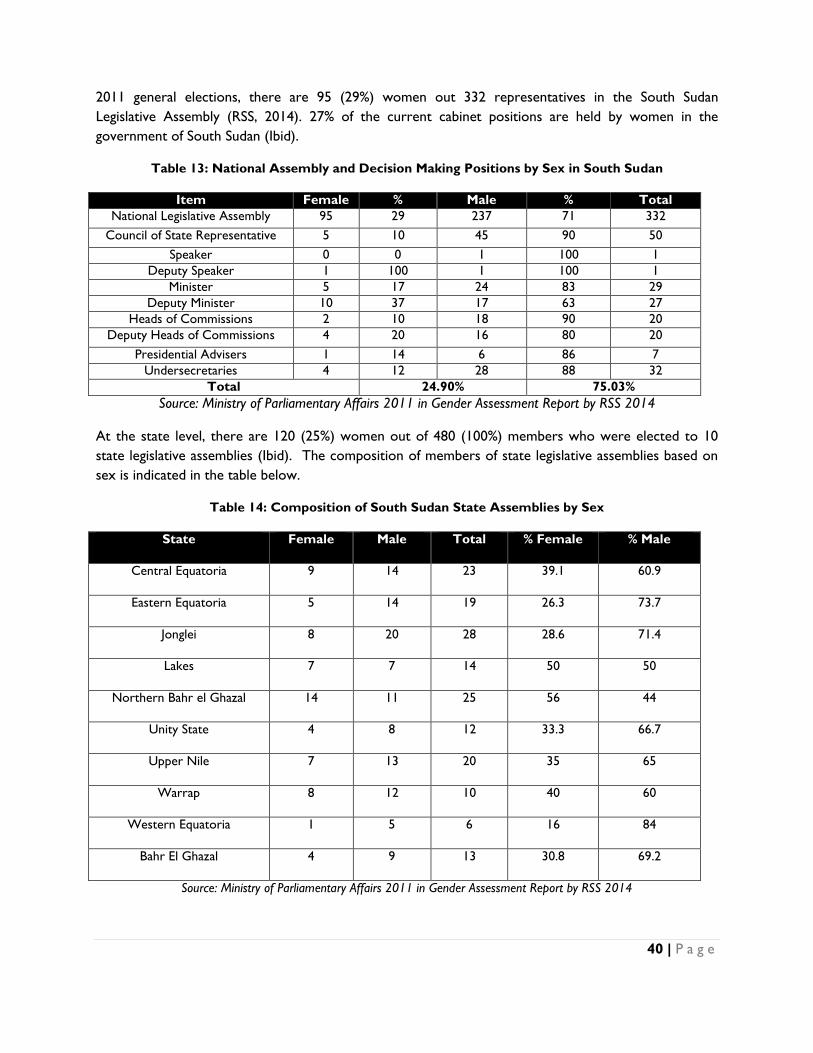
40 | P a g e
2011 general elections, there are 95 (29%) women out 332 representatives in the South Sudan
Legislative Assembly (RSS, 2014). 27% of the current cabinet positions are held by women in the
government of South Sudan (Ibid).
Table 13: National Assembly and Decision Making Positions by Sex in South Sudan
Item Female % Male % Total
National Legislative Assembly 95 29 237 71 332
Council of State Representative 5 10 45 90 50
Speaker 0 0 1 100 1
Deputy Speaker 1 100 1 100 1
Minister 5 17 24 83 29
Deputy Minister 10 37 17 63 27
Heads of Commissions 2 10 18 90 20
Deputy Heads of Commissions 4 20 16 80 20
Presidential Advisers 1 14 6 86 7
Undersecretaries 4 12 28 88 32
Total 24.90% 75.03%
Source: Ministry of Parliamentary Affairs 2011 in Gender Assessment Report by RSS 2014
At the state level, there are 120 (25%) women out of 480 (100%) members who were elected to 10
state legislative assemblies (Ibid). The composition of members of state legislative assemblies based on
sex is indicated in the table below.
Table 14: Composition of South Sudan State Assemblies by Sex
State Female Male Total % Female % Male
Central Equatoria 9 14 23 39.1 60.9
Eastern Equatoria 5 14 19 26.3 73.7
Jonglei 8 20 28 28.6 71.4
Lakes 7 7 14 50 50
Northern Bahr el Ghazal 14 11 25 56 44
Unity State 4 8 12 33.3 66.7
Upper Nile 7 13 20 35 65
Warrap 8 12 10 40 60
Western Equatoria 1 5 6 16 84
Bahr El Ghazal 4 9 13 30.8 69.2
Source: Ministry of Parliamentary Affairs 2011 in Gender Assessment Report by RSS 2014
41 | P a g e
Affirmative action has increased the number of women in government institutions, introduced changes
in institutional culture and led to the emergence of the centrality of women and gender issues in national
debates (Edward, 2014). However, the government’s primary gender equity goals are related to the
numerical representation of women in various political institutions rather than on addressing GBV issues
that hinder the equality of women and men (Edward, 2014). Given that 75% of representatives are male
in government institutions, the limited presence of women limits amplification of their voice within these
state institutions.
Establishment of government’s gender-based institutions
The government of South Sudan in 2006 established the Ministry of Gender, Child and Social Welfare to
spearhead gender mainstreaming across government ministries, policies, programmes and budgets. The
government has also established the Office of the Presidential Advisor on gender and human rights. The
Specialized Parliamentary Committee on Gender and Social Welfare and the Women Parliamentary
Caucus were also established by the government in the same period to champion gender equality (RSS,
2014). All these institutional mechanisms provide opportunity/entry points for advancing gender equality
and women rights at national and at state level.
Formulation of national gender policy
South Sudan’s government through the Ministry of Gender, Child and Social Welfare formulated a
comprehensive National Gender Policy (NGP) in 2013 (RSS, 2014). The gender policy objectives
strongly advocates for gender mainstreaming and women’s empowerment in South Sudan. The existence
of this policy provides a good entry point for gender activists at different levels to lobby and advocate
for the strengthening of gender equality in the country.
Formulation of South Sudan Development Plan
Since independence in 2011, the government formulated and implemented a three year South Sudan
Development Plan (SSDP) 2011-13. Another SSDP was formulated that covers the current period of
2014- 2016. SSDP is a national development framework through which plans and policies are meant to
address the plight of poor and vulnerable groups, with a particular focus on women and children. (RSS,
2014). The SSDP provides an opportunity for gender activists and women’s representatives in
government to participate and influence the government to adopt gender sensitive action plans.
3.7. 5 Challenges of the Gender Movement
Delays in ratification of international convention on gender and human rights
Since coming into power in 2011, the current government expressed urgency to ratify existing
international and regional human rights conventions; however, this has not been accomplished (Lacy and
Friedrike, 2013). The government of South Sudan has not ratified the Convention on the Elimination of
All Forms of Discrimination against Women (CEDAW) - a landmark international agreement that
affirms principles of fundamental human rights and equality for women around the world nor the
Protocol to the African Charter on Human and Peoples’ Rights on the Rights of Women in Africa,
known as the Maputo Protocol, which is critical to enhancing the protection and promotion of women

42 | P a g e
and girls’ rights in South Sudan (Ibid). This therefore limits gender activists to lobby and advocate for
gender equality in South Sudan.
Limited awareness of existing gender policies and plans
Many women and men and leaders in various government institutions in South Sudan are not aware of
existing gender related policies and laws. Therefore, the majority still rely on customary laws to
adjudicate gender related issues which in most cases favours men (IRIN, 2013). A limited awareness of
existing gender related laws and policies limits the ability of women and activists to demand the law’s
enforcement by duty bearers.
Discrimination of employment of women in armed forces
There is poor retention, promotion and recruitment of women in the security sector including the
South Sudan Liberation Army (SPLA), the South Sudan National Police Service (NSSPS) and other
correctional and organized forces in South Sudan (RSS, 2014). This kind of discrimination of women
limits their participation and voice within government institutions.
Inadequate implementation of existing gender policies and plans
There is still limited capacity of the government to implement the gender related policies and plans
contained in the Transitional Constitution 2011, National Gender Policy 2013 and South Sudan
Development Plan 2011-13 and 2014-16. The Ministry of Gender, Child and Social Welfare doesn’t have
required human and financial resources necessary to implement gender related actions contained in
gender policy and SSDP (Lacy and Friedrike, 2013, RSS, 2014, Edwards, 2014). The Gender ministry
receives the smallest budgetary allocation from the government (Lacy and Friedrike, 2013, Edwards,
2014). In 2011 for instance, the Gender ministry received only $2.5 million or 8.7 million SSP which was
insufficient to implement gender related action plans (Lacy and Friedrike, 2013). There are also few
personnel within government institutions who are trained and dedicated to promote gender equality
and women’s empowerment (RSS, 2014). Consequently, there are many gender-oriented policies in
South Sudan that are not implemented, and others are still in draft form (Edward, 2014). The following
is a list of policies that are not implemented and thus hinder women and men from promoting gender
mainstreaming:.
Article 15 in the Transitional Constitution 2011 further provides for the right of men and
women to marry opposite sex but does not define the minimum age for marriage. This
therefore perpetuates early marriages of young girls and boys in community (Ibid).
Article 16 (5) provides for inheritance rights of widows after death of their husbands but the
government is yet to enforce this constitutional provision in order to protect property the
rights of women and girls (Ibid).
Article 29 of the Transitional Constitution 2011 provides for girls’ right to education, however,
implementation of this provision has not been effective. Schools are located far from homes of
communities and girls have to walk long distances which make them vulnerable. Boarding
schools for girls that provide a safe learning environment are not widely available. Additionally,
43 | P a g e
girls do not go to school because there is no compulsory education for all girls and boys in the
country. The school environment is not safe and supportive of education of the girls and those
living with disability (Ibid).
Article 16 (4c) of the Transitional Constitution of South Sudan calls upon government to
provide maternity and child care and medical care for pregnant and lactating women. However,
the government lacks the resources and training to implement this broadly and effectively.
(Ibid).
The Transitional Constitution and the Land Act provide for right of women to acquire property
and land for economic development and to right to inherit property from their husbands such as
land. These legal provisions are not yet exercised (IRIN, 2013).
The gaps in formulation and enforcement of the above laws and policies limit effective promotion of
gender equality of men and women in South Sudan.
Persistence of harmful practices through customary law
There are many gender gaps within the Transitional Constitution 2011. Article 15 of the Transitional
Constitution 2011 prescribes a legal system of marriage and family based on existing traditional
customary law. However the persistence of customary law perpetuates gender inequalities and violation
of human rights of women and girls (Lacy and Friedrike, 2013). For example, customary law in some
states ‘often dictates that a girl who is raped should marry the perpetrator; it keeps her respectability
while bride wealth provides redress to her family (Ibid). This highlights the need for a review of the
formal and customary legal system to protect the rights of women as espoused in international law
(Ibid). Under customary law, patriarchy and GBV are perpetuated given that control related to marriage
and family remains in the hands of men. Women and girls do not have the right to choose how many
children to have or the ability to divorce and retain custody of their children. Some girls are given to
some men as compensation after the death of their wives as part of customary law in some communities
(SSWEN, not dated)3. Article 15 also perpetuates polygamous marriages that exacerbate women and
girls suffering.
3 See, South Sudan Women’s Empowerment Network (SSWEN), Communique from the ‘Know Your Rights’ In the Transitional Constitution
Workshop - Internet - http://www.sswen-rss.org/pdf/WBG_Communique.pdf; South Sudan Women’s Empowerment Network
(SSWEN), July 2012, Comminique from the People of Eastern Equatoria State - Internet -http://www.sswen-rss.org/pdf/EE_Communique.pdf;
South Sudan Women’s Empowerment Network (SSWEN), Communiqué from the women of Rumbeck, Lakes State, Internet,
http://www.sswen-rss.org/pdf/Lakes_Communique.pdf
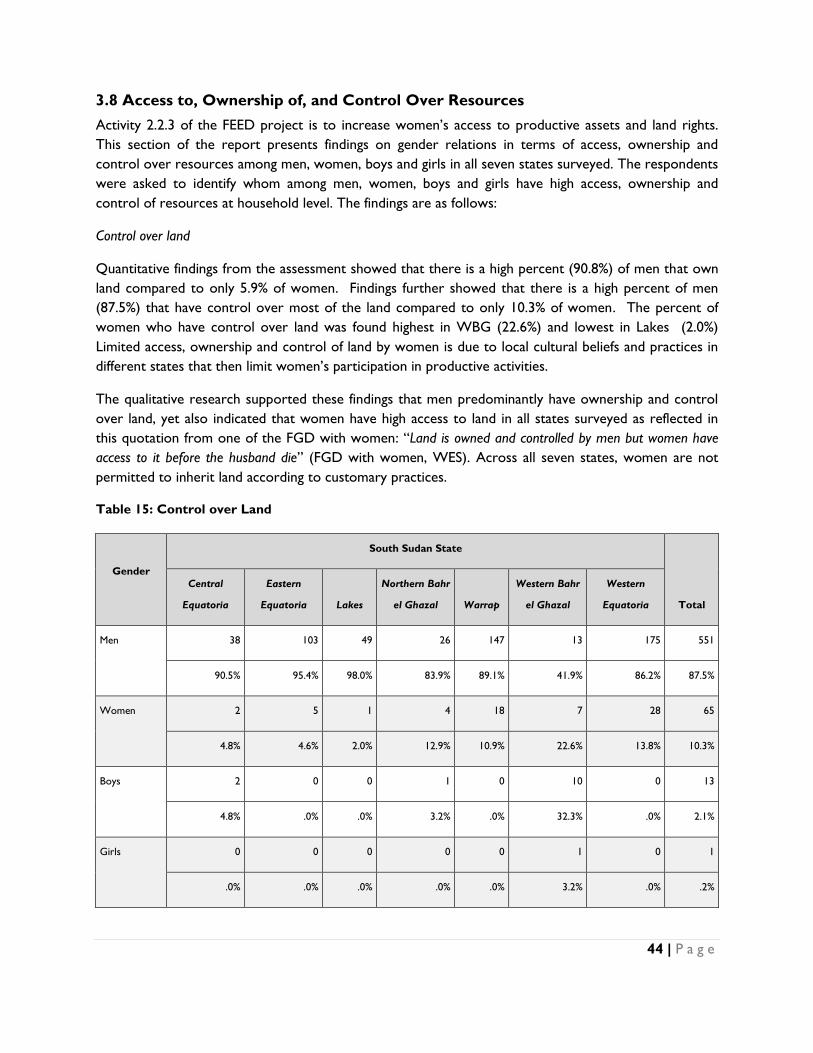
44 | P a g e
3.8 Access to, Ownership of, and Control Over Resources
Activity 2.2.3 of the FEED project is to increase women’s access to productive assets and land rights.
This section of the report presents findings on gender relations in terms of access, ownership and
control over resources among men, women, boys and girls in all seven states surveyed. The respondents
were asked to identify whom among men, women, boys and girls have high access, ownership and
control of resources at household level. The findings are as follows:
Control over land
Quantitative findings from the assessment showed that there is a high percent (90.8%) of men that own
land compared to only 5.9% of women. Findings further showed that there is a high percent of men
(87.5%) that have control over most of the land compared to only 10.3% of women. The percent of
women who have control over land was found highest in WBG (22.6%) and lowest in Lakes (2.0%)
Limited access, ownership and control of land by women is due to local cultural beliefs and practices in
different states that then limit women’s participation in productive activities.
The qualitative research supported these findings that men predominantly have ownership and control
over land, yet also indicated that women have high access to land in all states surveyed as reflected in
this quotation from one of the FGD with women: “Land is owned and controlled by men but women have
access to it before the husband die” (FGD with women, WES). Across all seven states, women are not
permitted to inherit land according to customary practices.
Table 15: Control over Land
Gender
South Sudan State
Total
Central
Equatoria
Eastern
Equatoria Lakes
Northern Bahr
el Ghazal Warrap
Western Bahr
el Ghazal
Western
Equatoria
Men 38 103 49 26 147 13 175 551
90.5% 95.4% 98.0% 83.9% 89.1% 41.9% 86.2% 87.5%
Women 2 5 1 4 18 7 28 65
4.8% 4.6% 2.0% 12.9% 10.9% 22.6% 13.8% 10.3%
Boys 2 0 0 1 0 10 0 13
4.8% .0% .0% 3.2% .0% 32.3% .0% 2.1%
Girls 0 0 0 0 0 1 0 1
.0% .0% .0% .0% .0% 3.2% .0% .2%
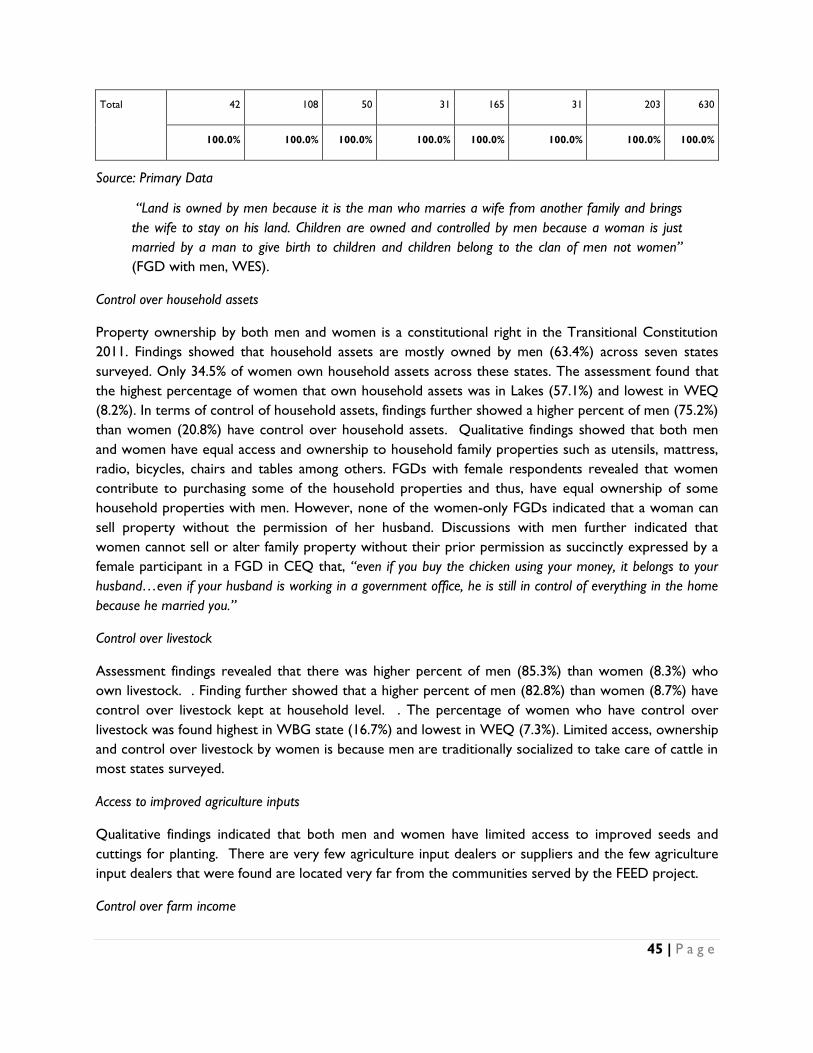
45 | P a g e
Total 42 108 50 31 165 31 203 630
100.0% 100.0% 100.0% 100.0% 100.0% 100.0% 100.0% 100.0%
Source: Primary Data
“Land is owned by men because it is the man who marries a wife from another family and brings
the wife to stay on his land. Children are owned and controlled by men because a woman is just
married by a man to give birth to children and children belong to the clan of men not women”
(FGD with men, WES).
Control over household assets
Property ownership by both men and women is a constitutional right in the Transitional Constitution
2011. Findings showed that household assets are mostly owned by men (63.4%) across seven states
surveyed. Only 34.5% of women own household assets across these states. The assessment found that
the highest percentage of women that own household assets was in Lakes (57.1%) and lowest in WEQ
(8.2%). In terms of control of household assets, findings further showed a higher percent of men (75.2%)
than women (20.8%) have control over household assets. Qualitative findings showed that both men
and women have equal access and ownership to household family properties such as utensils, mattress,
radio, bicycles, chairs and tables among others. FGDs with female respondents revealed that women
contribute to purchasing some of the household properties and thus, have equal ownership of some
household properties with men. However, none of the women-only FGDs indicated that a woman can
sell property without the permission of her husband. Discussions with men further indicated that
women cannot sell or alter family property without their prior permission as succinctly expressed by a
female participant in a FGD in CEQ that, “even if you buy the chicken using your money, it belongs to your
husband…even if your husband is working in a government office, he is still in control of everything in the home
because he married you.”
Control over livestock
Assessment findings revealed that there was higher percent of men (85.3%) than women (8.3%) who
own livestock. . Finding further showed that a higher percent of men (82.8%) than women (8.7%) have
control over livestock kept at household level. . The percentage of women who have control over
livestock was found highest in WBG state (16.7%) and lowest in WEQ (7.3%). Limited access, ownership
and control over livestock by women is because men are traditionally socialized to take care of cattle in
most states surveyed.
Access to improved agriculture inputs
Qualitative findings indicated that both men and women have limited access to improved seeds and
cuttings for planting. There are very few agriculture input dealers or suppliers and the few agriculture
input dealers that were found are located very far from the communities served by the FEED project.
Control over farm income

46 | P a g e
Access, ownership and control over farm income refers to who receives the proceeds from the sale of
farm produce and who has the authority and ability to determine how income is used. Findings
indicated that a higher percent of men (75.8%) in comparison to women (22.4%) have control over farm
income across the seven states surveyed. The percent of women found with control over farm income
were found highest in WBG state (40.6%) and lowest in Lakes state (4.1%).
Table 16: Control over Farm Income
Access, ownership and control over resources Men Women Boys Girls Total
Control over farm income 75.8% 22.4% 1.3% 0.5% 100%
Source: Primary Data
Qualitative findings indicated that there are variations in access to ownership and control of farm
income by men and women generated at the household level and across different states surveyed. In
some households, FGDs with men and women revealed that both men and women have equal access to
income generated from sale of their farm produce. In other households however, the findings showed
that it is only men who have access to income generated from the sale of farm produce. In some
households, women give all their income generated from sale of farm produce to their husbands. But
most men do not share details of their income with their wives at home. However, some FGDs with
women indicated that there are some women who do not declare their incomes to their husband which
was also indicated by most respondents as a significant contributor to incidents of domestic violence.
3.9 Gender Based Violence
3.9.1 Existence of GBV
Activity 2.3.1 of the FEED project is to increase opportunities for women, men, girls and boys to
participate in GBV prevention and responses. In this section, respondents were asked whether their
household members experience GBV. Most quantitative findings indicated that there is no GBV (62.4%)
in all seven states surveyed. Only 37.6% indicated that there is GBV. However, all qualitative findings
(FGDs with men and women and KIIs) and literature reviewed revealed the existence of rampant GBV
cases in all the states. The difference in results may have an outcome of higher comfort levels discussing
sensitive issues in FGDs compared to one-on-one household surveys.
Table 17: Whether Women and Men, Girls and Boys Experience Domestic Violence
experience
domestic violence
South Sudan State
Total
Central
Equatoria
Eastern
Equatoria Lakes
Northern Bahr
el Ghazal Warrap
Western Bahr
el Ghazal
Western
Equatoria
No 28 68 23 22 97 21 126 385
65.1% 64.2% 48.9% 71.0% 62.2% 65.6% 62.4% 62.4%
Yes 15 38 24 9 59 11 76 232

47 | P a g e
34.9% 35.8% 51.1% 29.0% 37.8% 34.4% 37.6% 37.6%
Total 43 106 47 31 156 32 202 617
100.0% 100.0% 100.0% 100.0% 100.0% 100.0% 100.0% 100.0%
Source: Primary Data
3.9.2 Forms of GBV
Given the extreme sensitivity of the subject matter, respondents were asked to assess the extent to
which they agree with selected key GBV cases experienced by men and women, girls and boys at
household and community levels. The rating scale used by respondents to assess each form of GBV
included: very low extent, low extent, neither low nor high extent, high extent and very high extent.
The findings indicated the following:
a) Physical violence
Women and men indicated a low extent of physical violence by their spouse, with 67% of respondents
indicating a low and very low extent of wife battering by husbands. Similarly, most respondents (71%)
indicated there is low and very low battering of men by their wives. In case of any domestic conflict or
disagreement, the extent to which men are denied food by their wives was indicated low by most
respondents (70.7%).
Table 18: Domestic Violence Experienced by Women
Extent
South Sudan State
Total
Central
Equatoria
Eastern
Equatoria Lakes
Northern
Bahr el
Ghazal Warrap
Western
Bahr el
Ghazal
Western
Equatoria
Very Low extent 15 56 8 4 90 15 29 217
34.9% 52.8% 17.0% 15.4% 58.1% 46.9% 18.0% 38.1%
Low extent 12 16 21 11 32 8 65 165
27.9% 15.1% 44.7% 42.3% 20.6% 25.0% 40.4% 28.9%
Neither high nor low
extent
8 11 8 3 6 6 18 60
18.6% 10.4% 17.0% 11.5% 3.9% 18.8% 11.2% 10.5%
High Extent 4 17 7 8 17 3 31 87
9.3% 16.0% 14.9% 30.8% 11.0% 9.4% 19.3% 15.3%
Very high extent 4 6 3 0 10 0 18 41
9.3% 5.7% 6.4% .0% 6.5% .0% 11.2% 7.2%
Total 43 106 47 26 155 32 161 570

48 | P a g e
Extent
South Sudan State
Total
Central
Equatoria
Eastern
Equatoria Lakes
Northern
Bahr el
Ghazal Warrap
Western
Bahr el
Ghazal
Western
Equatoria
Very Low extent 15 56 8 4 90 15 29 217
34.9% 52.8% 17.0% 15.4% 58.1% 46.9% 18.0% 38.1%
Low extent 12 16 21 11 32 8 65 165
27.9% 15.1% 44.7% 42.3% 20.6% 25.0% 40.4% 28.9%
Neither high nor low
extent
8 11 8 3 6 6 18 60
18.6% 10.4% 17.0% 11.5% 3.9% 18.8% 11.2% 10.5%
High Extent 4 17 7 8 17 3 31 87
9.3% 16.0% 14.9% 30.8% 11.0% 9.4% 19.3% 15.3%
Very high extent 4 6 3 0 10 0 18 41
9.3% 5.7% 6.4% .0% 6.5% .0% 11.2% 7.2%
Total 43 106 47 26 155 32 161 570
100.0% 100.0% 100.0% 100.0% 100.0% 100.0% 100.0% 100.0%
Source: Primary Data
Most qualitative findings however, indicated that domestic violence is significant across South Sudan. The
most common form of GBV found being experienced was beating of women by their husbands.
Discussion with most KIIs and single-sexed FGDs that “domestic violence is very common especially beating
of women (KII male, Eastern Equatoria). A FGD in NBG further suggested a high prevalence of GBV:
“A man beating his wife is not news among the Dinka, I have a permanent scar in my head [look at
it] because my husband beat me and cut me with a ‘panga’. I miraculously survived; I knew I was
going to die. He was not punished because I am his wife” (FGD with men, NBG).
Most Dinka women in NBG indicated that, a man is justified to discipline his wife by beating if she does
the following;
goes out of the home without his knowledge
beats her son
does not care for the home or any other property (and in particular the cows)
slaughters a chicken without his permission
talks to another man or does anything that will be interpreted as disobedience
In WBG, NBG, Warrap and CEQ men and women identified the major causes of physical assault as 1)
over consumption of alcohol by men and 2) marriage of an additional wife. In Awiel East, NBG, men
argued that:
49 | P a g e
A husband is like a teacher who has a right to correct a student and the student should respect and
listen to the teacher. If you tell a woman to do something correctly and she becomes stubborn you
need to use some force (FGD participant in Awiel East, NBG).
Payment of dowry is another cause of sexual and domestic violence found in some states. In some states
dowry is very expensive. For example a dowry of 30 cows at the cost of $500 a cow is not uncommon.
Because the man incurs a cost to pay dowry, a woman can be considered a possession or prisoner to
the husband with limited mobility or freedom to leave the marriage. (IRIN, 2013).The respondents
reported that, when a man pays bride price, he also purchases the right to manage her as property and
can do what he wants with her wants including disciplining her by beating. This is illustrated in the
following quote:
“The payment of dowry has also accelerated gender based violence in most communities. The men
who beat us indicate that they paid a lot of money for the dowry. They say I bought you from your
family and now you are entitled to this and not entitled to the other” (FGD with women, WES).
b) Psychological violence
One of the indicators used to measure psychological violence was use of abusive language during
domestic conflict or disagreement. When surveyed, most respondents (53.4%) indicated that women
experience abusive language during domestic disagreements or conflicts with their husbands. The extent
to which men experience abusive language from their wives during domestic conflicts was indicated low
by most respondents (57%). However, in practice qualitative findings indicated that men and women
tend to abuse each other especially after consuming alcohol.
c) Sexual violence
The extent to which women experience marital rape was indicated low by most respondents (71.5%),
however, this percentage might not depict reality. The concept of marital rape was not easily
understood because most women believe that men have a right to sex any time they want. In some
states such as WEQ, findings from FGDs with women indicated that there is a high level of marital rape.
“There is also marital rape. When our husbands get drunk, some of them want sex from us by force. If you
refuse, they beat us” (FGD with women, WES)
The extent to which young girls experience sexual violence was indicated as low by most respondents
(63.8%). In addition, most respondents (67.5%) indicated low levels of incest (sex with immediate
relatives). Most respondents (67.7%) further indicated that there is low exposure of young girls to early
sex and also low exposure to sex by young boys (71%). Contrary to the above quantitative findings,
most qualitative findings indicated that there are rampant marriages of young girls and boys before the
age of 18 years which exposes boys and girls to early sex. In addition, in most communities, the age of
marriage and sex is mostly defined by first menstruation cycle and not by numerical age.
Most qualitative findings further indicated that there are many cases of sexual assault of young girls
below 15 years of age by older men in local communities. Children are sent to collect firewood, fetch
water and occasionally cultivate crops by themselves in distant locations which put underage children,
especially young girls, at risk as men take advantage of the thick forest and bushes.
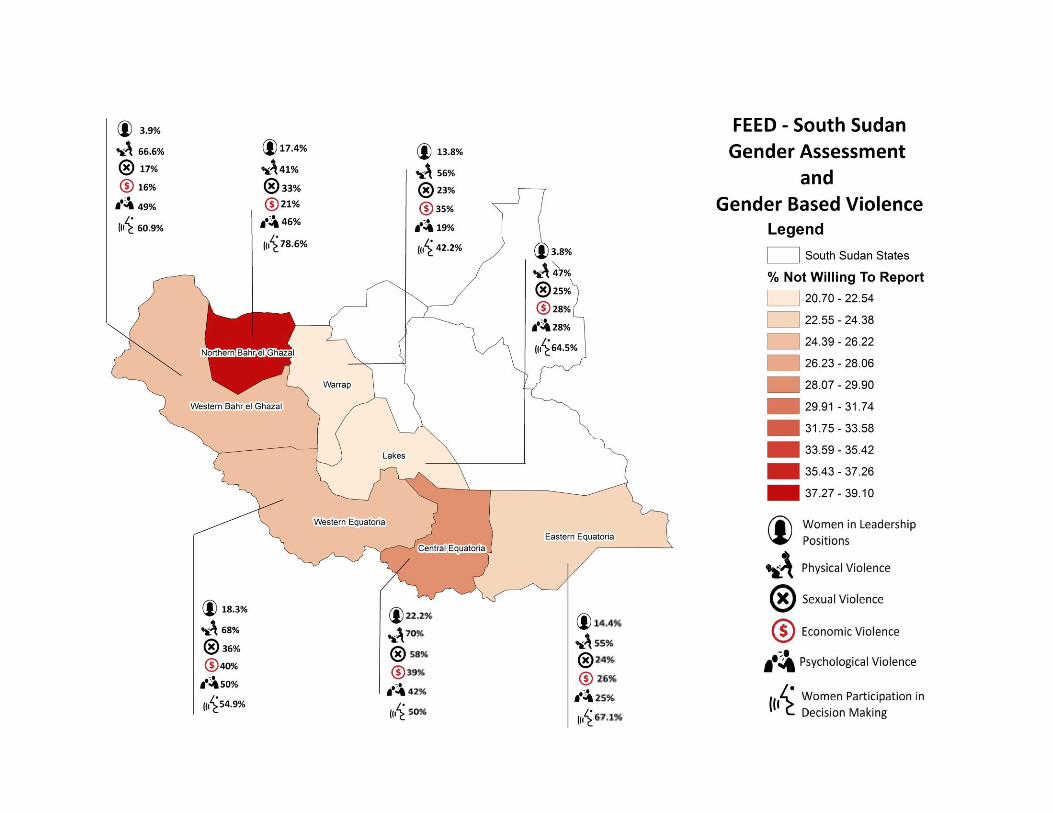
50

51
3.9.3 Level of Reporting of Domestic Violence
This section presents findings on the level of reporting of different forms of GBV experienced by
women, men, girls and boys in the seven states assessed. Respondents were asked to assess the extent
to which they report selected GBV cases which men and women, girls and boys experience at
household and community levels. The rating scale used by respondents to rate levels of reporting of
each form of GBV included: very low extent, low extent, neither low nor high extent, high extent and
very high extent.
The extent to which women and men, boys and girls report GBV cases to relevant authorities was
found low across all seven states surveyed. Most respondents (56.5%) indicated that there are low
levels of girls reporting sexual violence experienced at home or in their community. Most respondent
(70.2%) also indicated that there is low reporting of wife battering. Qualitative findings indicated that
sexuality issues are sacred and not openly discussed in public, even though women and girls experience
sexual and domestic violence, they keep these to themselves. In addition, most social and government
institutions that handle sexual and domestic violence cases were found to be male dominated.
Table 19: Reporting of Domestic Violence by Women
Violence Reported
South Sudan State
Total
Central
Equatoria
Eastern
Equatoria Lakes
Northern
Bahr el
Ghazal Warrap
Western
Bahr el
Ghazal
Western
Equatoria
Very Low extent 18 61 12 6 80 12 40 229
42.9% 58.1% 25.0% 23.1% 51.3% 40.0% 24.8% 40.3%
Low extent 12 17 19 10 44 13 55 170
28.6% 16.2% 39.6% 38.5% 28.2% 43.3% 34.2% 29.9%
Neither high nor low
extent
4 10 7 5 12 5 15 58
9.5% 9.5% 14.6% 19.2% 7.7% 16.7% 9.3% 10.2%
High Extent 6 16 6 5 13 0 38 84
14.3% 15.2% 12.5% 19.2% 8.3% .0% 23.6% 14.8%
Very high extent 2 1 4 0 7 0 13 27
4.8% 1.0% 8.3% .0% 4.5% .0% 8.1% 4.8%
Total 42 105 48 26 156 30 161 568
100.0% 100.0% 100.0% 100.0% 100.0% 100.0% 100.0% 100.0%
Source: Primary Data
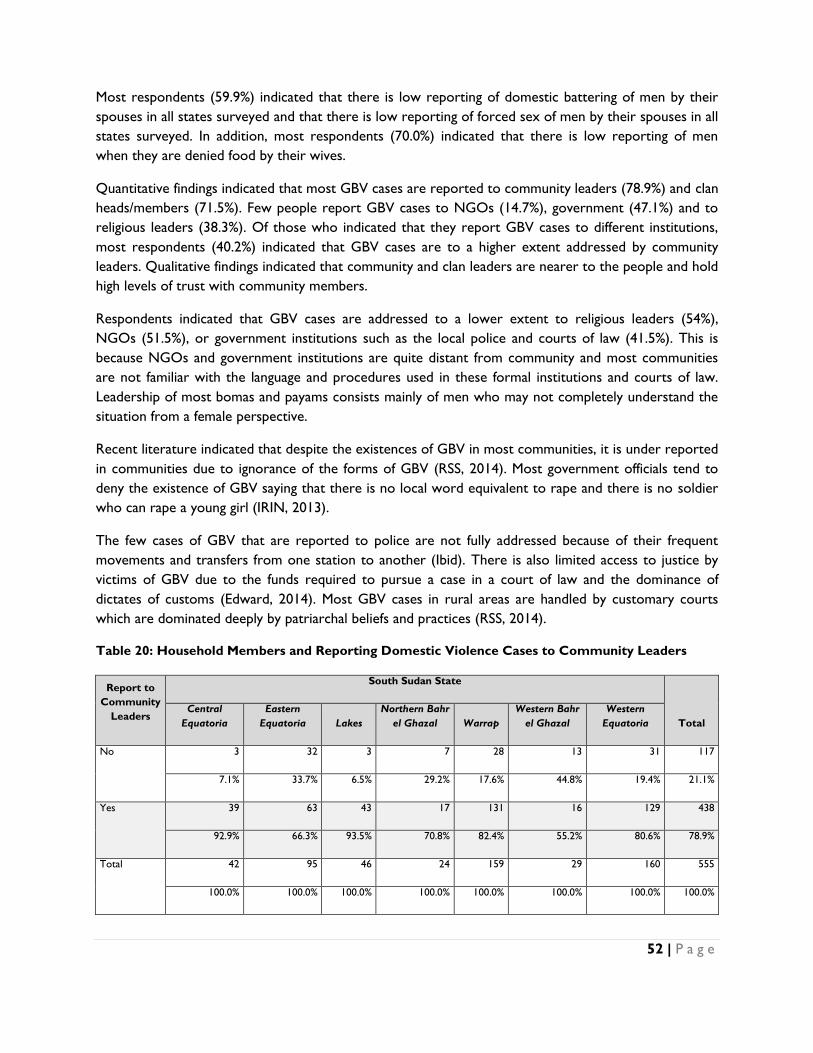
52 | P a g e
Most respondents (59.9%) indicated that there is low reporting of domestic battering of men by their
spouses in all states surveyed and that there is low reporting of forced sex of men by their spouses in all
states surveyed. In addition, most respondents (70.0%) indicated that there is low reporting of men
when they are denied food by their wives.
Quantitative findings indicated that most GBV cases are reported to community leaders (78.9%) and clan
heads/members (71.5%). Few people report GBV cases to NGOs (14.7%), government (47.1%) and to
religious leaders (38.3%). Of those who indicated that they report GBV cases to different institutions,
most respondents (40.2%) indicated that GBV cases are to a higher extent addressed by community
leaders. Qualitative findings indicated that community and clan leaders are nearer to the people and hold
high levels of trust with community members.
Respondents indicated that GBV cases are addressed to a lower extent to religious leaders (54%),
NGOs (51.5%), or government institutions such as the local police and courts of law (41.5%). This is
because NGOs and government institutions are quite distant from community and most communities
are not familiar with the language and procedures used in these formal institutions and courts of law.
Leadership of most bomas and payams consists mainly of men who may not completely understand the
situation from a female perspective.
Recent literature indicated that despite the existences of GBV in most communities, it is under reported
in communities due to ignorance of the forms of GBV (RSS, 2014). Most government officials tend to
deny the existence of GBV saying that there is no local word equivalent to rape and there is no soldier
who can rape a young girl (IRIN, 2013).
The few cases of GBV that are reported to police are not fully addressed because of their frequent
movements and transfers from one station to another (Ibid). There is also limited access to justice by
victims of GBV due to the funds required to pursue a case in a court of law and the dominance of
dictates of customs (Edward, 2014). Most GBV cases in rural areas are handled by customary courts
which are dominated deeply by patriarchal beliefs and practices (RSS, 2014).
Table 20: Household Members and Reporting Domestic Violence Cases to Community Leaders
Report to
Community
Leaders
South Sudan State
Total
Central
Equatoria
Eastern
Equatoria Lakes
Northern Bahr
el Ghazal Warrap
Western Bahr
el Ghazal
Western
Equatoria
No 3 32 3 7 28 13 31 117
7.1% 33.7% 6.5% 29.2% 17.6% 44.8% 19.4% 21.1%
Yes 39 63 43 17 131 16 129 438
92.9% 66.3% 93.5% 70.8% 82.4% 55.2% 80.6% 78.9%
Total 42 95 46 24 159 29 160 555
100.0% 100.0% 100.0% 100.0% 100.0% 100.0% 100.0% 100.0%

53 | P a g e
Source: Primary Data
3.10 Gender-related Project Implementation Risks
Both key informants and FGD with respondents welcomed and showed enthusiasm to participate and
support implementation of project activities. Most activities in the project are aligned with priority issues
of the community such as reduced domestic violence and participation of women in income generation
activities. It will be critical during project implementation to take advantage of community and local
leaders support to accelerate project implementation.
The major risk identified by most respondents was fear of resurgence of war and conflict in most states
as discussed by one of the respondents: “the main risk here is insecurity but not women’s empowerment
activities. What women and men’s need is to provide them with more sensitization and involving them in
agricultural activities” (KII male, WES). If such risk occurs during implementation, respondents indicated
that this would paralyze project implementation.
A significant percentage of respondents (51.1%) agreed that women’s empowerment is associated with
risks such as separation and divorce. Respondents (50.9%) also agreed that women’s empowerment
also might reduce the opportunity for marriage of women and girls in the community. On a scale of
very low to very high, the largest grouping of respondents (46.2%) believed that empowerment projects
had a low likelihood to lead to condemnation and discrimination of women activists in the community.
It should be noted that the likelihood of occurrence of all the above risks was rated low by the majority
of respondents across all seven states surveyed.
Some respondents were unsure if the FEED project will benefit them, due to limited impact of previous
projects implemented in their community by various organizations. Such suspicions might therefore limit
participation of these stakeholders during implementation of project activities.
54 | P a g e
CHAPTER 4: CONCLUSIONS AND RECOMMENDATIONS
The main objective of the gender assessment was to determine the specific areas in which the FEED
consortium can contribute to gender equality within the project scope. In light of project scope and
above findings, below are the main conclusions and recommendations based on key issues that emerged
from the gender assessment.
4.1. Conclusion
The findings from the assessment showed that gender relations in South Sudan favor men more than
women which is manifested through unequal gender division of labor, access to and control over
productive resources such as land, cows, agricultural inputs and income from sale of farm produce.
Indeed, men have more access, ownership and control of key productive resources such as land, income
generated from sale of farm produce, bicycles, radios, and household property. Unequal gender
relations also explain men’s high participation in community development activities compared to women
in all states surveyed. The unfair social construction of gender roles favours domination and control of
decision making spheres, leadership and resources ownership and allocation in the hands of men. There
is still a strong entrenchment of the patriarchal system in the socio-economic and political spheres of life
in South Sudan. Men virtually determine and control everything including what women should do, what
they can eat and where they can go. Because women spend the majority of their time and effort
completing reproductive tasks, women’s and girl’s access to education, participation in income
generation and contribution to community development activities was found to be limited.
The assessment found high participation of men in high income generating agriculture and economic
activities such as cattle rearing, cultivation of crops for sale, poultry, fishing, beekeeping, charcoal
burning, wood works and marketing of farm produce. The assessment found high participation of
women in low income generating agriculture and economic activities such as growing and sale of
vegetables and post-harvest handling.
While women and men have different experiences in agriculture, the assessment found some common
barriers that hinder men and women’s participation in agriculture and economic activities, including: high
levels of illiteracy, use of rudimentary tools in production, overdependence on rain in agricultural
production, inadequate farming and business management skills and limited access to agricultural
financing, limited access to improved farming inputs, low participation in group farming and marketing,
poor transportation networks, food insecurity and conflict. Restrictions placed on women by their
husbands were also found as a key barrier that hinders their participation in economic activities. These
barriers limit men and women’s resilience and coping abilities.
The following practices limited equality of men and women in all seven states:
preference to educate boys
male property ownership
wife inheritance
routine physical assault of women
physical assault of men by women
early marriage of girls
55 | P a g e
bride price payments
restricted mobility of wives
limited involvement of women in decision-making and economic activity
dietary restrictions of women
There were variations in qualitative and quantitative findings in regard to GBV. Most quantitative findings
indicated that GBV is low, however, all qualitative findings and recent literature revealed how
widespread the problem of GBV is. The variance between quantitative and qualitative results could be
attributed to the sensitivity of the issue and respondents’ comfort level with discussing the issue in
groups. The most prevalent forms of GBV found in all states were battery (husbands against wives),
sexual assault and early marriage of young girls. A combination of factors, such as the effects of long
term civil war, payment of dowry, polygamous marriages, alcoholism and an entrenched patriarchal
system in all states were found to perpetuate the problem in all states surveyed. Generally, reporting of
GBV was low. Victims generally report to community leaders and clan head, rather than to NGOs,
government or religious leaders. This is because of the proximity between community members and
their clan leaders. Access to the formal justice system by many victims of GBV was also low because
many women are illiterate. There are also no referral centres for rehabilitation of GBV victims. The
continued occurrence of GBV affects the health and psychological wellness of women.
There is positive reception of the FEED project by community members and state government leaders.
Communities showed enthusiasm to support and participate in the implementation of the FEED project
activities. Communities in different states however, expressed negative sentiments arising from
insecurity as a threat to their participation in agriculture and economic activities. Based on their
experience with previous projects, some respondents doubted whether or not FEED would have any
visible impact at the grass roots level.
There are state and non-state actors spearheading the gender movement in South Sudan. These actors
are evenly distributed across all states however, the major actors are more concentrated at the national
level rather than the state level. The adoption of the Bill of Rights and affirmative action, National
Gender Policy 2013 and 25% representation of women in the executive and legislative arms of
government and establishment of Ministry of Gender, Child and Social Welfare have brought many
women into the policy and decision-making arenas. However, coordination, funding, transportation and
capacity of staff remain major challenges for gender activists in South Sudan. There are also many gender
gaps in most existing national and state policies and laws, and most gender policies and laws are not
implemented. In most communities in the project area, men and women were not aware of such
policies.
4.2 Recommendations
a) To enhance access to agriculture extension services it is recommended that the consortium:
Support provision of agriculture extension services to both men and women farmers in rural
communities. This will increase volume of agriculture production and incomes of female and
male farmers. Agriculture extension services for women should focus on improving productivity
and the adoption of new technologies in agriculture production related to poultry, goat rearing,
56 | P a g e
fishing, vegetables, maize, cassava, sorghum, groundnuts, pineapples, potatoes etc. The focus for
men should be on cattle rearing, fishing and beekeeping.
Support training of selected government agriculture extension workers in gender and modern
farming methods and technologies. This will ensure sustainability of the project outputs.
b) To enhance access to agriculture inputs, it is recommended that the consortium:
Procure and distribute relevant agricultural inputs to male and female farmers relevant for crop
production, such as seeds, hoes, ‘pangas’, axes, ox ploughs and tarpaulins for drying of crops.
Both men and women should be first consulted on their preferred appropriate agriculture
inputs. Provision of such inputs should however, be conditioned to certain gender commitments
which farmers need to fulfill before inputs are delivered to them. Some of these conditions
include:
o commitment by male and female beneficiaries to educate girls
o stopping and reporting incidences of domestic violence
o ending the practice of early marriage and marriage of girls who have not finished school
Procure and distribute improved breeds of crop varieties (such as cassava stems, maize seeds),
animals and poultry to both men and women. This will enhance productivity and income of
farmers.
c) To enhance post-harvest handling, it is recommended that the consortium:
Support practical training of women and men in appropriate methods of post-harvest handling
techniques especially in crop production (maize, cassava, groundnuts, sorghum, millet,
vegetables, etc…).
Encourage the involvement of men in post-harvest handling activities, such as carrying heavy
sacks of farm produce daily from inside to outside the house for sun-drying. The project can
give incentives (agriculture inputs, such as seeds, hoes, etc…) to men who participate in post-
harvest handling. This will reduce women’s domestic chores of women.
Encourage each female and male heads of households in the FEED project to construct facilities
using local materials for part harvest storage. This will help them to stockpile their farm produce
when prices are low and sell them later when prices have increased.
d) To promote processing of agriculture produce, it is recommended that the consortium:
Support practical agricultural training of both women and men in basic processing and packaging of
selected agriculture enterprises, such as crops (maize, cassava, groundnuts, sorghum, millet, vegetables,
groundnuts etc.), honey, mango and pineapple. This will help men and women to earn higher income
from economic activities in which they are already involved.
e) To improve access to markets, it is recommended to the consortium members to:
Support training of women and men farmers in marketing and basic business management skills
relevant for agriculture and other economic activities.
Provide regular and up to date market information to male and female farmers on prices for
different farm produce (maize, cassava, groundnuts, sorghum, millet, vegetables, groundnuts,
honey, mango and pineapple). This can be done through weekly/monthly meetings with farmers
and through in collaboration with local FM radio stations which can assist in provision of weekly
marketing information to farmers.
f) To enhance female and male participation in community groups, it is recommended to the
consortium members to:

57 | P a g e
Form new village savings and loans groups, farmers associations, producer groups, cooperatives,
collective marketing and business groups in targeted bomas where they do not already exist.
Support and strengthen existing groups, in particular by encouraging the participation of women.
Support sensitization of women of the importance of group farming, collective bulking (storage)
and marketing.
Train leaders of women- focused civil society groups on basic institutional aspects, such as
leadership and management of their groups. This will enhance sustainability of women’s groups
focused on savings and farming.
Procure and distribute relevant agricultural inputs (seeds, hoes, pangas, axes and ox ploughs) to
farmers’ groups and Farmer Field Schools to support them in training other farmers.
g) To reduce gender-based domestic violence, it is recommended that the consortium:
Support sensitization meetings of men and women as well as local leaders at the boma level to
understand the dangers of domestic violence and to appreciate the need to respect and
promote rights and equality of men and women.
Select and support women and men activists as well as civil society groups to regularly monitor
and report cases of GBV to local community leaders. These activists should also be encouraged
to report GBV cases to local security agencies, such as police. The project can support these
activists/monitors with bicycles, small stationery for recording and telephone gadget and air time
for making telephone calls.
Support local CSOs to lobby for inclusion of women in arbitration meetings for domestic
violence cases reported at village level. This will reduce male domination in these meetings and
increase female voice against unfair judgment of GBV cases.
Involve both men and women from the same households in agriculture and economic activities
and encourage them to share information regarding farm income and planning how to use the
income generated. This would reduce GBV related conflicts at the household level.
Support CSOs to demand for increased women access to formal justice from the courts of law
as opposed to customary law in communities.
Support the government’s legal and justice institutions, especially police and judiciary, through
gender training and provisions of gender information to enable them to effectively handle gender
sensitive issues in the courts of law.
h) To strengthen the involvement of women in leadership and decision-making, it is
recommended to the consortium members to:
Raise awareness of the benefits of gender equality in improving community livelihoods. This
awareness should target payam and boma chiefs, headmen and some state government officials
who are in a position to help shift gender inequality in the community.
Support and encourage women in communities to participate and take a leadership position in
savings groups and farmers association.
Organize and provide annual awards that recognize contribution made by outstanding women
leaders in the local community in order to encourage other women and girls to take up
leadership.
i) To promote sustainable use of natural resource, it is recommended to the consortium team
to:
Support training of men and women in community in the construction and use of energy saving
cooking stoves for domestic use. This will reduce time spent by women and girls in cooking and
simultaneously conserve existing forests.

58 | P a g e
j) Gender Movement and Civil Society in South Sudan: In case resources allow, it is
recommended that the consortium:
Support CSO advocacy for increased women’s representatives in national and international
peace events.
Support the establishment and/or strengthening of women’s organizations alliances/networks at
state and national levels to enhance coordination, learning, collective voice and actions on
gender equality.
Support CSOs to lobby for the protection of women’s peace activists and women’s rights
defenders in communities.
Support CSO activists to regularly monitor and report women’s and girls’ rights violations and
abuses.
Support training of women CSOs and government leaders on gender issues.
Support legal and policy advocacy campaigns by local CSO activists to influence government to
implement existing gender related laws and to ratify CEDAW and Maputo Protocols and to
enact new gender laws such as:
o a law that puts the age of marriage at 18 years;
o a law that prohibits negative customary practices such as forced marriages of young girls
and early marriage of young girls;
o a law that provides for equal rights to divorce to a man and a woman; and
o a law that provides equal custody rights of the children between a wife and husband
ANNEXES
I. References
References.doc
II. Gender Assessment Tools Used
Gender Assessment Questionnaire Used - SS.doc
FGD tool for Gender.doc
Guide for Key Informant.doc
III. List of South Sudan’s Women CSO Organizations in 7 States Surveyed
List of Women CSOs in SS - May 2014.doc

59 | P a g e
IV. Field Notes for Focus Group Discussions and Key Informants
Field Notes - Eastern Equatoria.doc
notes from Warrap state.docx
Fleld notes Northern Bahr el Ghazal.doc
Enumerators and FGD participants.xlsx
Field Notes Gender - Western Equatoria.doc
Notes from WAU state.docx
FGD_notes from Gogrial Warrap State.docx
V. Cross Tabulation Data Set
Gender Cross Tabulation - SS.doc
VI. Gender Assessment Tools Used
FEED Annex - Quantitative Results.doc