Gender and Contemporary British Politics Pippa Norris ... and... · Gender and Contemporary British...
23
1 Gender and Contemporary British Politics Pippa Norris Chapter 4 for British Politics Today ed. Colin Hay (Cambridge, Polity Press 2001) “In nuclear physics, the critical mass is the minimum amount of a given fissile material necessary to achieve a self-sustaining fission chain reaction under stated conditions. Its size depends on several factors, including the kind of fissile material used, its concentration and purity, and the design of the surrounding reaction system. A small amount of uranium-235, say 0.45 kg (1 pound), cannot undergo a chain reaction and is thus termed a subcritical mass; this is because, on average, the neutrons released by a fission are likely to leave the assembly without striking another nucleus and causing it to fission. If more uranium-235 is added to the assemblage, the chances that one of the released neutrons will cause another fission are increased, since the escaping neutrons must traverse more uranium nuclei and the chances are greater that one of them will bump into another nucleus and split it. At the point at which one of the neutrons produced by a fission will on average create another fission, critical mass has been achieved, and a chain reaction and thus an atomic explosion will result.” (Encyclopedia Brittanica) Critical mass theory, derived from nuclear physics, suggests that nuclear reaction can be a contained process. Beyond a certain point, however, when enough uranium is assembled, there will be an irreversible meltdown, or unstoppable chain reaction of nuclear fission multiplying upon itself, producing an impact far beyond the quantity of the original material. When applied to social science, the theory of critical mass suggests that the nature of group interactions depend upon size. When a group remains a distinct minority within a larger society, its members will seek to adapt to their surroundings, conforming to the predominant rules of the game. In many ways this is analogous to Noelle-Neuman’s (1984) spiral of silence theory about the expression of dissonant views. But once the group reaches a certain size, critical mass theory suggests that there will be a qualitative change in the nature of group interactions, as the minority starts to assert itself and thereby transform the institutional culture, norms and values. Rosabeth Moss Kanter (1977) applied this account to gender relations in industrial corporations, identifying four categories. Uniform groups contain only men or women. Skewed groups contain a large imbalance of men or women, up to about 15 per cent of the minority group. Titled groups contain about 15-40 percent of the opposite sex. Lastly, balanced groups contain 40-50 percent of each sex. This theory can be applied to the position of women in public office. Drude Dahlerup (1988) and Jill M. Bystydenski (1992) have argued that if women and men politicians differ in their underlying values, policy priorities and legislative styles, then when parliaments shift from skewed to tilted, or even balanced, groups there will be a transformation in the institutional culture, political discourse, and policy agenda. The expectations are implicit in Clare Short’s claims: “As more women come into the Commons, the culture will change, the agenda of politics will broaden, and the institution itself will be transformed.” (Quoted in McDougal 1998). This theory suggests that in the past, we would expect few
Transcript of Gender and Contemporary British Politics Pippa Norris ... and... · Gender and Contemporary British...
1
Gender and Contemporary British Politics
Pippa Norris
Chapter 4 for British Politics Today ed. Colin Hay (Cambridge, Polity Press 2001)
“In nuclear physics, the critical mass is the minimum amount of a given fissile material necessary to achieve a self-sustaining fission chain reaction under stated conditions. Its size depends on several factors, including the kind of fissile material used, its concentration and purity, and the design of the surrounding reaction system. A small amount of uranium-235, say 0.45 kg (1 pound), cannot undergo a chain reaction and is thus termed a subcritical mass; this is because, on average, the neutrons released by a fission are likely to leave the assembly without striking another nucleus and causing it to fission. If more uranium-235 is added to the assemblage, the chances that one of the released neutrons will cause another fission are increased, since the escaping neutrons must traverse more uranium nuclei and the chances are greater that one of them will bump into another nucleus and split it. At the point at which one of the neutrons produced by a fission will on average create another fission, critical mass has been achieved, and a chain reaction and thus an atomic explosion will result.” (Encyclopedia Brittanica)
Critical mass theory, derived from nuclear physics, suggests that nuclear reaction can be a
contained process. Beyond a certain point, however, when enough uranium is assembled, there will
be an irreversible meltdown, or unstoppable chain reaction of nuclear fission multiplying upon itself,
producing an impact far beyond the quantity of the original material.
When applied to social science, the theory of critical mass suggests that the nature of group
interactions depend upon size. When a group remains a distinct minority within a larger society, its
members will seek to adapt to their surroundings, conforming to the predominant rules of the game.
In many ways this is analogous to Noelle-Neuman’s (1984) spiral of silence theory about the
expression of dissonant views. But once the group reaches a certain size, critical mass theory suggests
that there will be a qualitative change in the nature of group interactions, as the minority starts to
assert itself and thereby transform the institutional culture, norms and values. Rosabeth Moss Kanter
(1977) applied this account to gender relations in industrial corporations, identifying four categories.
Uniform groups contain only men or women. Skewed groups contain a large imbalance of men or
women, up to about 15 per cent of the minority group. Titled groups contain about 15-40 percent of
the opposite sex. Lastly, balanced groups contain 40-50 percent of each sex.
This theory can be applied to the position of women in public office. Drude Dahlerup
(1988) and Jill M. Bystydenski (1992) have argued that if women and men politicians differ in their
underlying values, policy priorities and legislative styles, then when parliaments shift from skewed to
tilted, or even balanced, groups there will be a transformation in the institutional culture, political
discourse, and policy agenda. The expectations are implicit in Clare Short’s claims: “As more women
come into the Commons, the culture will change, the agenda of politics will broaden, and the institution itself will be
transformed.” (Quoted in McDougal 1998). This theory suggests that in the past, we would expect few
2
substantive differences between women and men MPs at Westminster, since, until recently, there
have been so few female representatives. Previous research on parliamentary candidates and MPs in
the 1992 election found that when compared with men within each party, women were slightly more
supportive of feminist and leftwing values, expressed stronger concern about social policy issues, and
gave higher priority to constituency casework. Yet in all cases the gender gap was modest, and overall
party rather than gender proved the strongest predictor of values and attitudes (Norris and
Lovenduski 1995; Norris 1996).
Has this situation changed by the entry of a new cohort of women politicians? The 1997
British general election, where the proportion of women MPs doubled overnight from 9.2 to 18.2
percent of the Commons, provides a test case for critical mass theory. Much of the popular rhetoric
supporting the introduction of gender quotas has stressed that, although there is a clear case to be
made on the grounds of equity alone, in addition the entry of more women into Westminster would
help to change the mainstream policy agenda, and the ‘public school/boys club’ atmosphere of
Commons debate. A popular argument in favour of positive discrimination for women was that the
new intake of female members would raise different types of concerns in the Commons, as well as in
the Scottish Parliament, the Welsh Assembly and the European parliament (see the discussion in
Brooks, Eagle and Short 1990; Perrigo 1996; Phillips 1995; Short 1996; MacDougal 1998).
Yet although there has been much popular controversy about the impact of the new intake
of women politicians, so far there has been little previous systematic research on this topic in Britain.
The theory of a critical mass depends upon the existence of underlying differences in the values,
attitudes and behaviour of the groups concerned. If women and men MPs are similar in these
regards, then even if women gradually became the majority at Westminster, British parliamentary
politics will continue in familiar ways. The public face of politics will change more than the political
culture. Critical mass theory can only operate if female politicians differ significantly from men, for
example if they give greater priority to public spending on education rather than defence, or if they
raise more parliamentary questions about childcare rather than foreign policy, or if they pay more
attention to constituency service rather than parliamentary debate. While some studies demonstrate
that women do make a distinct contribution to the policy agenda in legislatures elsewhere, such as in
North America, Western Europe and Scandinavia, the evidence remains under debate (see for
example, discussions in Thomas 1994; Karvonen and Selle 1996; Tremblay 1998).
This study analyzes the entry of the new cohort of Labour women in the 1997 general
election to see whether they have the potential to make a difference to the substantive policy agenda
at Westminster. In particular this study draws on the 1997 British Representation Study to examine
whether women and men MPs differ within each party in two dimensions: their underlying values
and their parliamentary activities. Part I describes the dramatic growth in women’s representation in
3
public office in the 1990s. Part II briefly summarizes the main causes of this development, focusing
upon changes in the gender gap in the electorate and the adoption of positive discrimination policies
in Labour party recruitment procedures. Part III examines the consequences of the entry of more
women at Westminster, comparing their values and legislative activities. The conclusion considers
whether the evidence supports critical mass theory and the broader implications of the findings for
understanding women’s role in public life.
The Growth of Women in Public Office in Britain
Recent years have seen remarkable progress in the representation of women in British
politics. By the end of the twentieth century the British political elite has started to reflect the
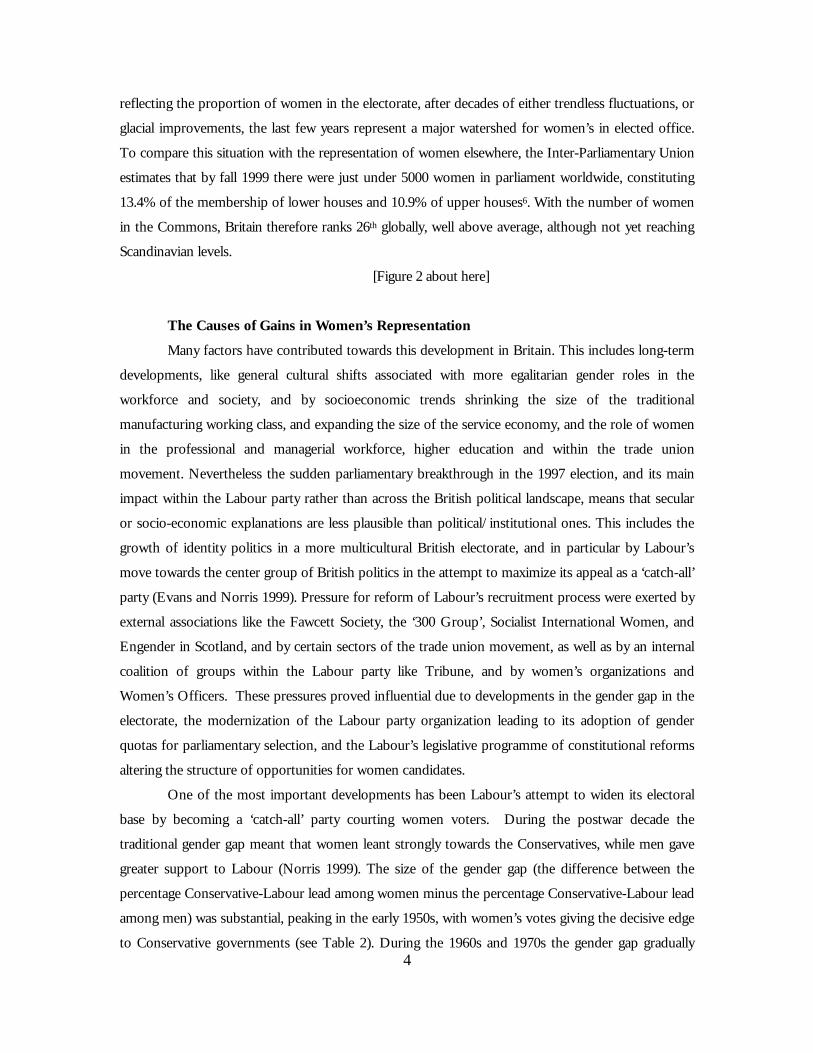
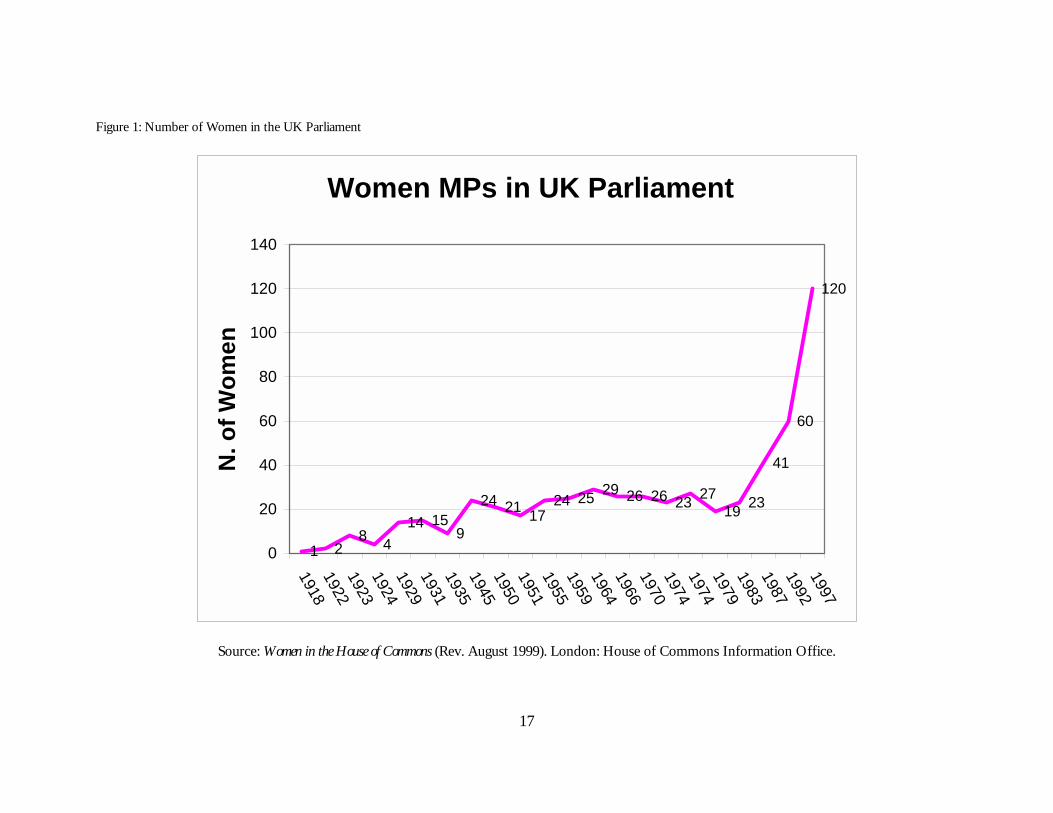
diversity of British society. From 1918 (when women were first allowed to stand for election to the
House of Commons) to 1983, less than 5% of MPs were women (see Figure 1). The situation started
to change in 1987, when the proportion of women grew to 6.3%, rising to 9.2% in 1992. Following
Labour’s landslide victory on 1st May 1997, the line rocketed up the chart from 60 to 120 women MPs,
or 18.2%, including 101 in the Labour party. To summarize developments in another way, half of all
the women who have ever been elected to the British House of Commons are currently in
parliament. Women are one third of the current1 Blair government, including five Cabinet Ministers,
twenty-three Ministers or Undersecretaries outside of Cabinet, and two whips in the House of
Commons as well as one in the House of Lords. Moreover the appointments are not confined to the
‘traditional’ ministries like education or health: Margaret Beckett is President of the Council and Leader
of the House of Commons, Ann Taylor is Chief Whip and Parliamentary Secretary to the Treasury,
after a long spell in Northern Ireland, Mo Mowlam is now Minister for the Cabinet Office, Clare Short
is Secretary of State for International Development, and Baroness Jay is Leader of the Lords as well as
Minister for Women2. Betty Boothroyd is Speaker of the House of Commons.
(Figure 1 about here)
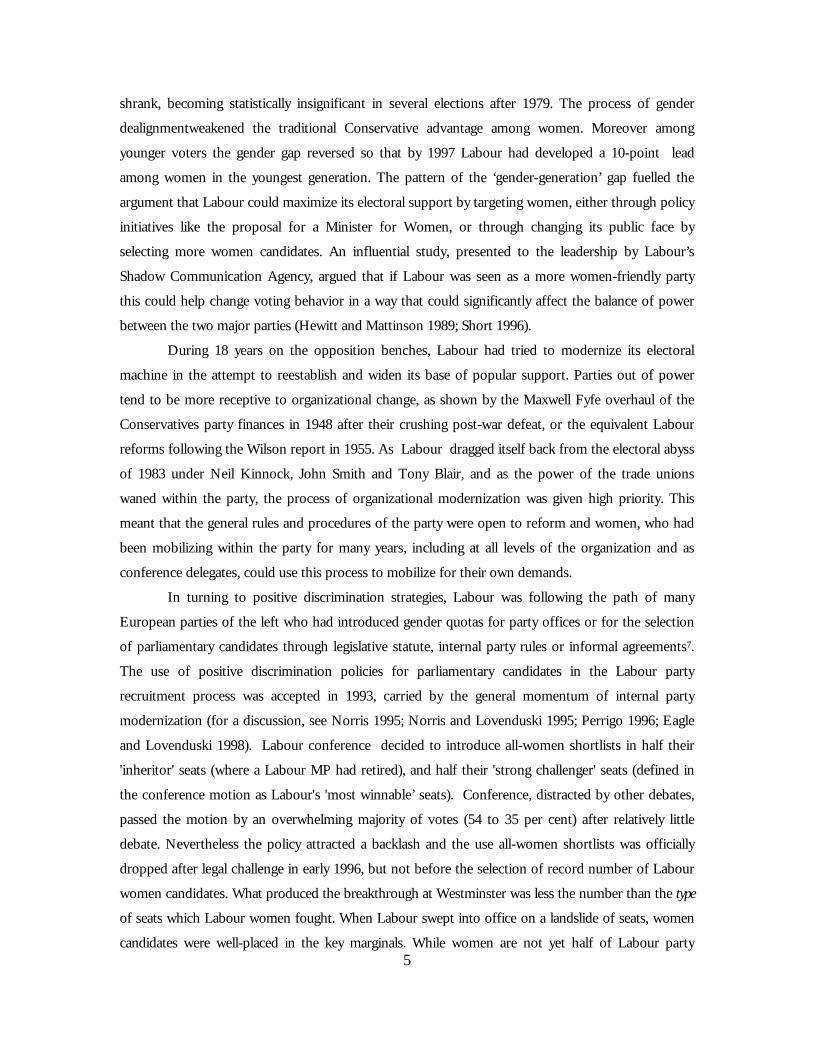
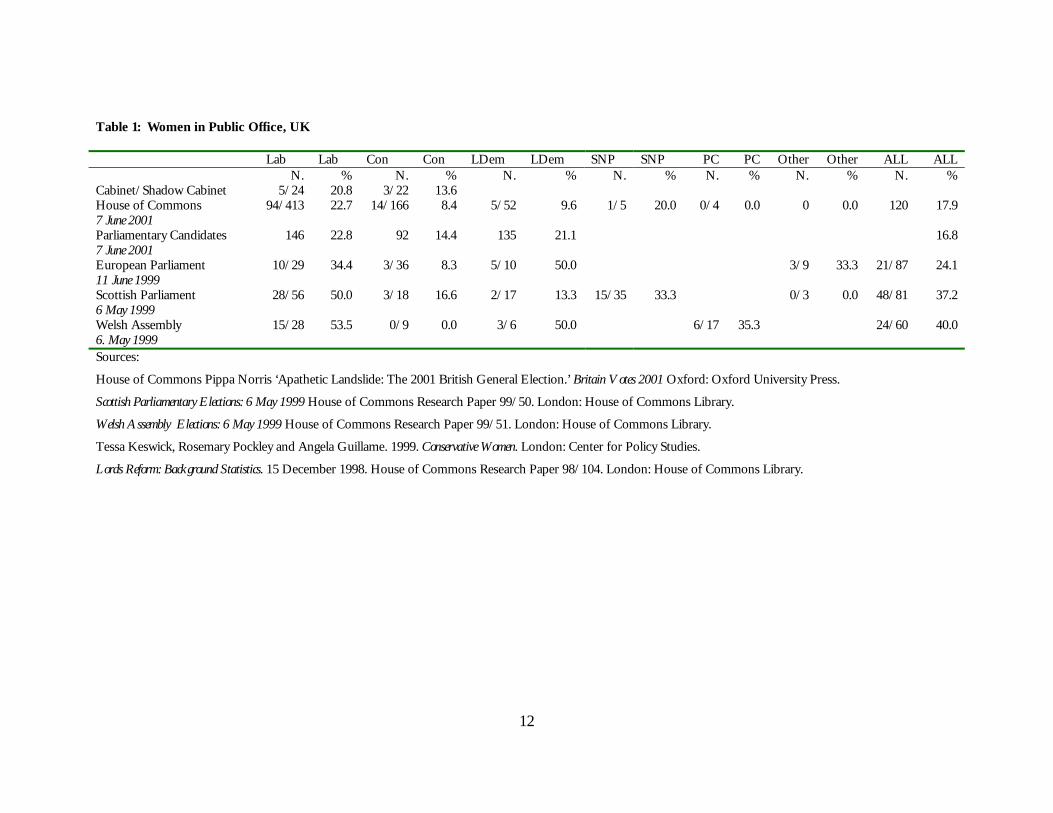
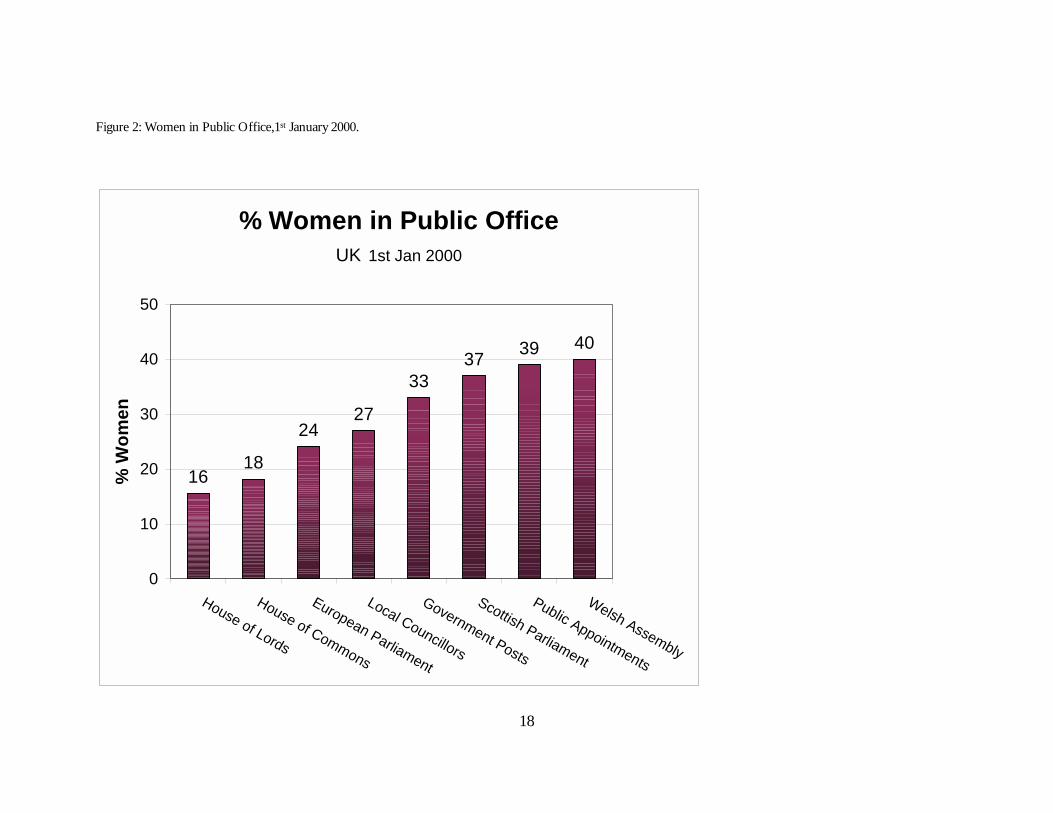
The breakthrough for women’s representation in British politics is not confined to
Westminster (see Table 1 and Figure 2). By the end of the twentieth century, women are 16% of the
House of Lords (doubling overnight with the abolition of most hereditary peers), one quarter of British
members of the European Parliament3, one third of all government posts, 37% of members of the
Scottish parliament, 40% of the new Welsh Assembly, and 39% of the 35,000 public appointments on
boards of executive and advisory quangos, nationalized industries, public corporations and NHS
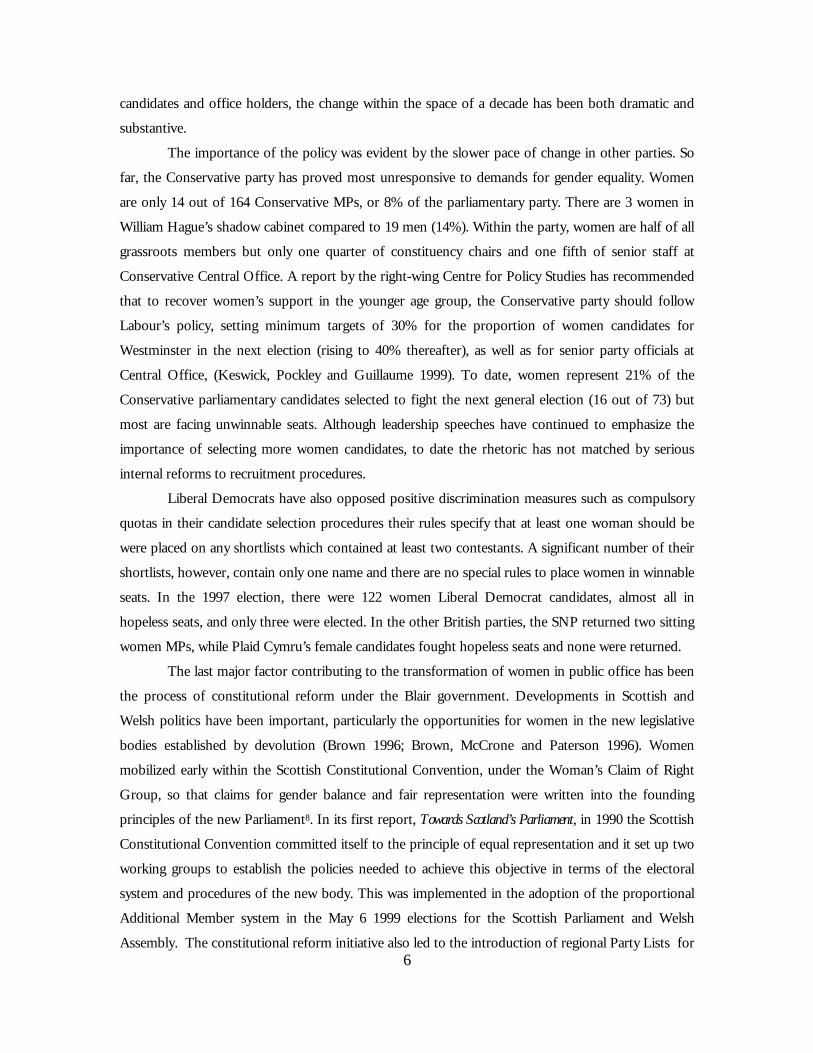
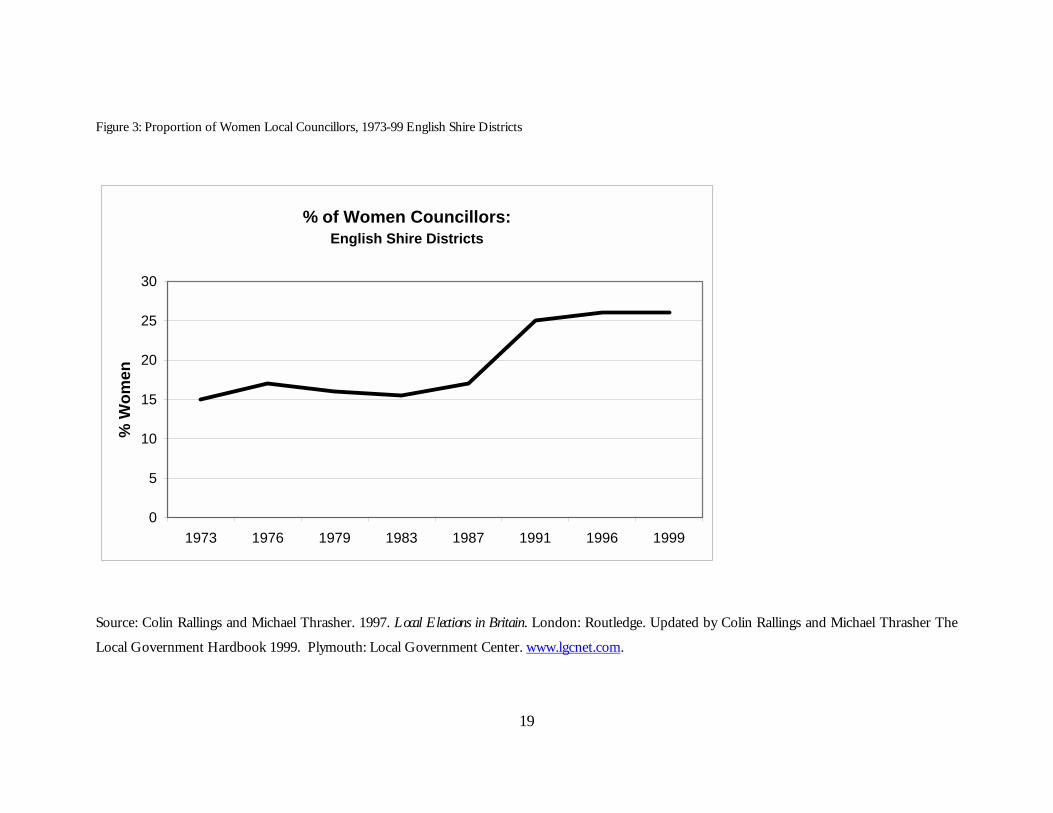
bodies4. The proportion of women in local government grew from about 15% in the 1970s to just over
one quarter of all councillors (26%) in 1999 (see Figure 3), with slightly more in England5. Within each
party women have made some gains as branch and constituency officers, the Labour party is led by the
first female General Secretary, Margaret McDonagh, and at the grassroots women are about 40% of
Labour party members and 50% of Conservative Party members (Lovenduski 1996). If not yet
4
reflecting the proportion of women in the electorate, after decades of either trendless fluctuations, or
glacial improvements, the last few years represent a major watershed for women’s in elected office.
To compare this situation with the representation of women elsewhere, the Inter-Parliamentary Union
estimates that by fall 1999 there were just under 5000 women in parliament worldwide, constituting
13.4% of the membership of lower houses and 10.9% of upper houses6. With the number of women
in the Commons, Britain therefore ranks 26th globally, well above average, although not yet reaching
Scandinavian levels.
[Figure 2 about here]
The Causes of Gains in Women’s Representation
Many factors have contributed towards this development in Britain. This includes long-term
developments, like general cultural shifts associated with more egalitarian gender roles in the
workforce and society, and by socioeconomic trends shrinking the size of the traditional
manufacturing working class, and expanding the size of the service economy, and the role of women
in the professional and managerial workforce, higher education and within the trade union
movement. Nevertheless the sudden parliamentary breakthrough in the 1997 election, and its main
impact within the Labour party rather than across the British political landscape, means that secular
or socio-economic explanations are less plausible than political/institutional ones. This includes the
growth of identity politics in a more multicultural British electorate, and in particular by Labour’s
move towards the center group of British politics in the attempt to maximize its appeal as a ‘catch-all’
party (Evans and Norris 1999). Pressure for reform of Labour’s recruitment process were exerted by
external associations like the Fawcett Society, the ‘300 Group’, Socialist International Women, and
Engender in Scotland, and by certain sectors of the trade union movement, as well as by an internal
coalition of groups within the Labour party like Tribune, and by women’s organizations and
Women’s Officers. These pressures proved influential due to developments in the gender gap in the
electorate, the modernization of the Labour party organization leading to its adoption of gender
quotas for parliamentary selection, and the Labour’s legislative programme of constitutional reforms
altering the structure of opportunities for women candidates.
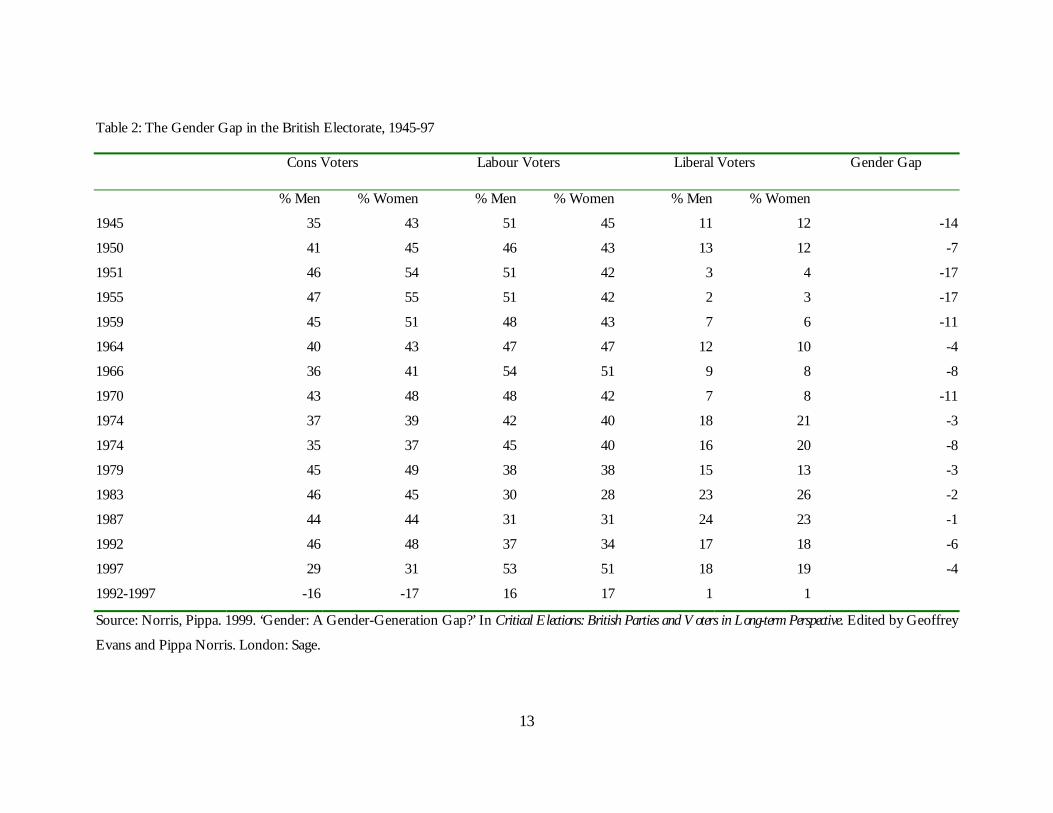
One of the most important developments has been Labour’s attempt to widen its electoral
base by becoming a ‘catch-all’ party courting women voters. During the postwar decade the
traditional gender gap meant that women leant strongly towards the Conservatives, while men gave
greater support to Labour (Norris 1999). The size of the gender gap (the difference between the
percentage Conservative-Labour lead among women minus the percentage Conservative-Labour lead
among men) was substantial, peaking in the early 1950s, with women’s votes giving the decisive edge
to Conservative governments (see Table 2). During the 1960s and 1970s the gender gap gradually
5
shrank, becoming statistically insignificant in several elections after 1979. The process of gender
dealignmentweakened the traditional Conservative advantage among women. Moreover among
younger voters the gender gap reversed so that by 1997 Labour had developed a 10-point lead
among women in the youngest generation. The pattern of the ‘gender-generation’ gap fuelled the
argument that Labour could maximize its electoral support by targeting women, either through policy
initiatives like the proposal for a Minister for Women, or through changing its public face by
selecting more women candidates. An influential study, presented to the leadership by Labour’s
Shadow Communication Agency, argued that if Labour was seen as a more women-friendly party
this could help change voting behavior in a way that could significantly affect the balance of power
between the two major parties (Hewitt and Mattinson 1989; Short 1996).
During 18 years on the opposition benches, Labour had tried to modernize its electoral
machine in the attempt to reestablish and widen its base of popular support. Parties out of power
tend to be more receptive to organizational change, as shown by the Maxwell Fyfe overhaul of the
Conservatives party finances in 1948 after their crushing post-war defeat, or the equivalent Labour
reforms following the Wilson report in 1955. As Labour dragged itself back from the electoral abyss
of 1983 under Neil Kinnock, John Smith and Tony Blair, and as the power of the trade unions
waned within the party, the process of organizational modernization was given high priority. This
meant that the general rules and procedures of the party were open to reform and women, who had
been mobilizing within the party for many years, including at all levels of the organization and as
conference delegates, could use this process to mobilize for their own demands.
In turning to positive discrimination strategies, Labour was following the path of many
European parties of the left who had introduced gender quotas for party offices or for the selection
of parliamentary candidates through legislative statute, internal party rules or informal agreements7.
The use of positive discrimination policies for parliamentary candidates in the Labour party
recruitment process was accepted in 1993, carried by the general momentum of internal party
modernization (for a discussion, see Norris 1995; Norris and Lovenduski 1995; Perrigo 1996; Eagle
and Lovenduski 1998). Labour conference decided to introduce all-women shortlists in half their
'inheritor' seats (where a Labour MP had retired), and half their 'strong challenger' seats (defined in
the conference motion as Labour's 'most winnable’ seats). Conference, distracted by other debates,
passed the motion by an overwhelming majority of votes (54 to 35 per cent) after relatively little
debate. Nevertheless the policy attracted a backlash and the use all-women shortlists was officially
dropped after legal challenge in early 1996, but not before the selection of record number of Labour
women candidates. What produced the breakthrough at Westminster was less the number than the type
of seats which Labour women fought. When Labour swept into office on a landslide of seats, women
candidates were well-placed in the key marginals. While women are not yet half of Labour party
6
candidates and office holders, the change within the space of a decade has been both dramatic and
substantive.
The importance of the policy was evident by the slower pace of change in other parties. So
far, the Conservative party has proved most unresponsive to demands for gender equality. Women
are only 14 out of 164 Conservative MPs, or 8% of the parliamentary party. There are 3 women in
William Hague’s shadow cabinet compared to 19 men (14%). Within the party, women are half of all
grassroots members but only one quarter of constituency chairs and one fifth of senior staff at
Conservative Central Office. A report by the right-wing Centre for Policy Studies has recommended
that to recover women’s support in the younger age group, the Conservative party should follow
Labour’s policy, setting minimum targets of 30% for the proportion of women candidates for
Westminster in the next election (rising to 40% thereafter), as well as for senior party officials at
Central Office, (Keswick, Pockley and Guillaume 1999). To date, women represent 21% of the
Conservative parliamentary candidates selected to fight the next general election (16 out of 73) but
most are facing unwinnable seats. Although leadership speeches have continued to emphasize the
importance of selecting more women candidates, to date the rhetoric has not matched by serious
internal reforms to recruitment procedures.
Liberal Democrats have also opposed positive discrimination measures such as compulsory
quotas in their candidate selection procedures their rules specify that at least one woman should be
were placed on any shortlists which contained at least two contestants. A significant number of their
shortlists, however, contain only one name and there are no special rules to place women in winnable
seats. In the 1997 election, there were 122 women Liberal Democrat candidates, almost all in
hopeless seats, and only three were elected. In the other British parties, the SNP returned two sitting
women MPs, while Plaid Cymru’s female candidates fought hopeless seats and none were returned.
The last major factor contributing to the transformation of women in public office has been
the process of constitutional reform under the Blair government. Developments in Scottish and
Welsh politics have been important, particularly the opportunities for women in the new legislative
bodies established by devolution (Brown 1996; Brown, McCrone and Paterson 1996). Women
mobilized early within the Scottish Constitutional Convention, under the Woman’s Claim of Right
Group, so that claims for gender balance and fair representation were written into the founding
principles of the new Parliament8. In its first report, Towards Scotland’s Parliament, in 1990 the Scottish
Constitutional Convention committed itself to the principle of equal representation and it set up two
working groups to establish the policies needed to achieve this objective in terms of the electoral
system and procedures of the new body. This was implemented in the adoption of the proportional
Additional Member system in the May 6 1999 elections for the Scottish Parliament and Welsh
Assembly. The constitutional reform initiative also led to the introduction of regional Party Lists for
7
the 11 June 1999 elections to the European Parliament, scrapping first-past-the-post. Reform of the
House of Lords has also contributed towards this process. The overwhelming majority of hereditary
peers (98%) were men and prior to reform there were 1,297 members who could sit in the House of
Lords, of whom 103 (8%) were women9. After most of the hereditary peers retired to their country
estates, the proportion of women peers doubled to 16.1%. The Labour party committment to
consider alternatives to the first-past-the-post electoral system at Westminster represents another
opportunity for reform, since plurality single-member districts have long been a hindrance for
women at Westminster (Norris 1985). Nevertheless the Jenkins Commission report on electoral
reform for the Commons attached minimum priority (one paragraph) to this issue. The proposal
from the Commission is for a majoritarian Alternative Vote system based on 80-85% of members
elected in single-member districts, plus top-up list seats for the remainder in 65 small electoral
districts. The small district magnitude of the proposed system means that if this is eventually
accepted and implemented, and at present it remains under debate, it is unlikely to have a substantial
effect on women’s representation10.
The Consequences of Women at Westminster
What have been the more general consequences of this development, in particular, has the
new intake of women into public office ‘made a difference’ in terms of the substantive policy agenda?
Previous research on women in the 1992 election found that there was a significant, although
modest, difference between women and men politicians within each party. In particular, compared
with men, within each party women tended to be more supportive of left-wing and feminist values,
to give higher priority to social policy issues like education, pensions and the health service, and to
devote more time to constituency service (Norris and Lovenduski 1995). Nevertheless the overall
size of the gender gap was small, and in general party provided a stronger predictor of these factors.
With the intake of far more women into the Commons, producing a shift from a ‘skewed’ a ‘titled’
minority, are the differences between male and female politicians becoming more marked, as critical
mass theory suggests? For evidence we can use the 1997 British Representation Study11, a survey
including almost 1000 MPs and parliamentary candidates from all parties in Britain.
The Gender Gap in Political Attitudes
The attitudes and values of politicians were monitored in this survey using a series of 10-
point scales monitoring their own position on six key issues dividing the parties. The 11-point scales
measured left-right self-placement, the trade-off between inflation versus unemployment, taxation
versus public spending, nationalization versus privatization, integration within the European Union,
and gender equality. The questions were in the following form:
8
“Recently there has been discussion about women's rights. Some people feel that women should have an equal
role with men in running business, industry and government. These people would put themselves in Box 1.
Other people feel that a woman's role is in the home. These people would put themselves in Box 11. Other
people have views somewhere in-between. Using the following scale... Where would you place your view?”
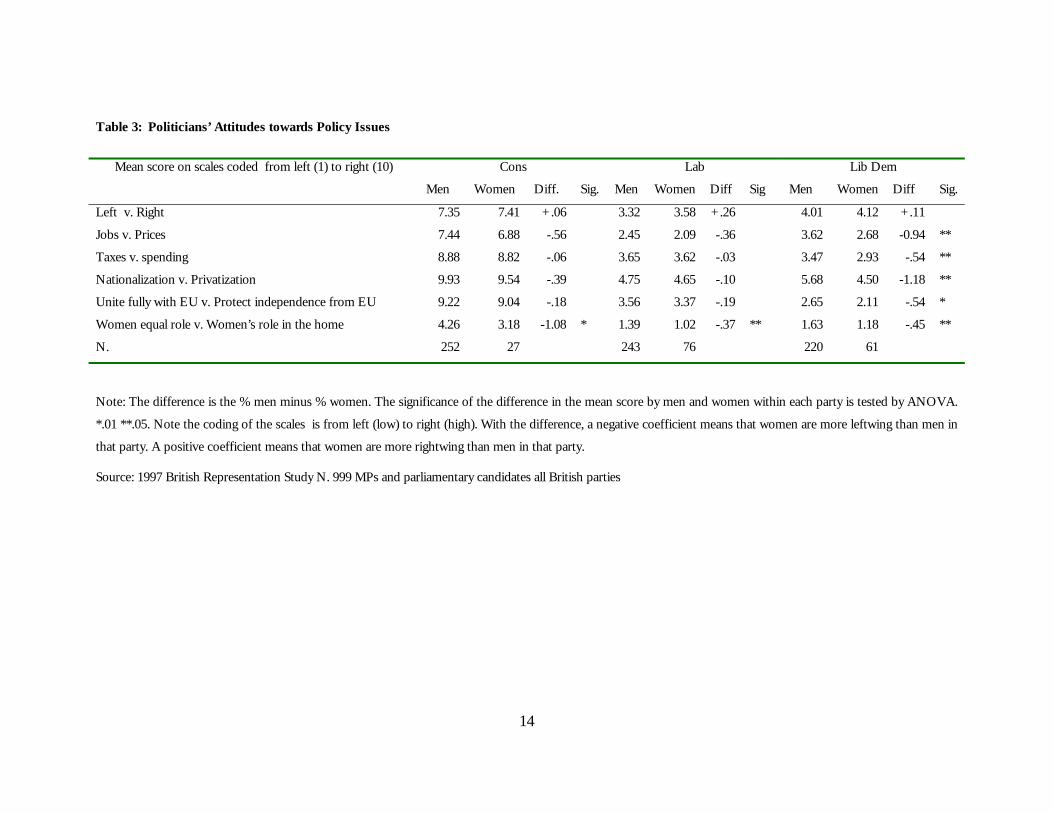
Table 3 compares the breakdown of mean responses by gender and party for the pool of politicians,
i.e. parliamentary candidates and incumbent MPs. Three interesting and important patterns emerge.
First, the results confirm the pattern found in 1992, namely that across most policy issues it
is party rather than gender which proves the strongest predictor of attitudes. Not surprisingly, given
the strength of party discipline within parliament, and the importance attached to collective
adherence to manifesto programmes, Westminster politicians are primarily party standard bearers
first and foremost.
Second, across all the issue scales, women consistently tend to place themselves slightly to
the left of men within their party with the exception of the left-right ideology scale, where women see
themselves as slightly more rightwing than their male counterparts. In the Liberal Democrat party, in
particular, women politicians are significantly more leftwing than men across all policy scales. The
gender differences within the Labour and Conservative party are modest and rarely statistically
significant.
Thirdly, on the issue of gender roles in the labour force and home, within each major party
women are more significantly more egalitarian than men. Despite expectations surrounding the new
Labour cohort of women MPs, in fact the gap on this issue is strongest within the Conservative
party, where women and men present very different positions. Moreover within the other major
parties, Liberal Democratic women proved more egalitarian on this scale not just than Liberal
Democrat men, but also than Labour men.
This overall pattern replicates and thereby strengthens confidence in similar findings in the
1992 survey of parliamentary candidates (Norris 1996). The most logical conclusion is that, although
there are modest differences on the classic economic cleavages that have always divided Westminster
parties, the gender of politicians matters most substantively on gender-related issues. If these findings can be
extended further, it suggests that where parliament debates issues where women and men have
different interests - whether protective measures preventing domestic violence against women, equal
opportunities in the paid labour force, or childcare provision in nursery schools – then potentially the
attitudes and values which women bring into the parliamentary arena have the potential to make a
difference to the outcome, especially within the Conservative party were men proved the most
traditional group of all politicians on the gender equality scale.
9
[Table 3 about here]
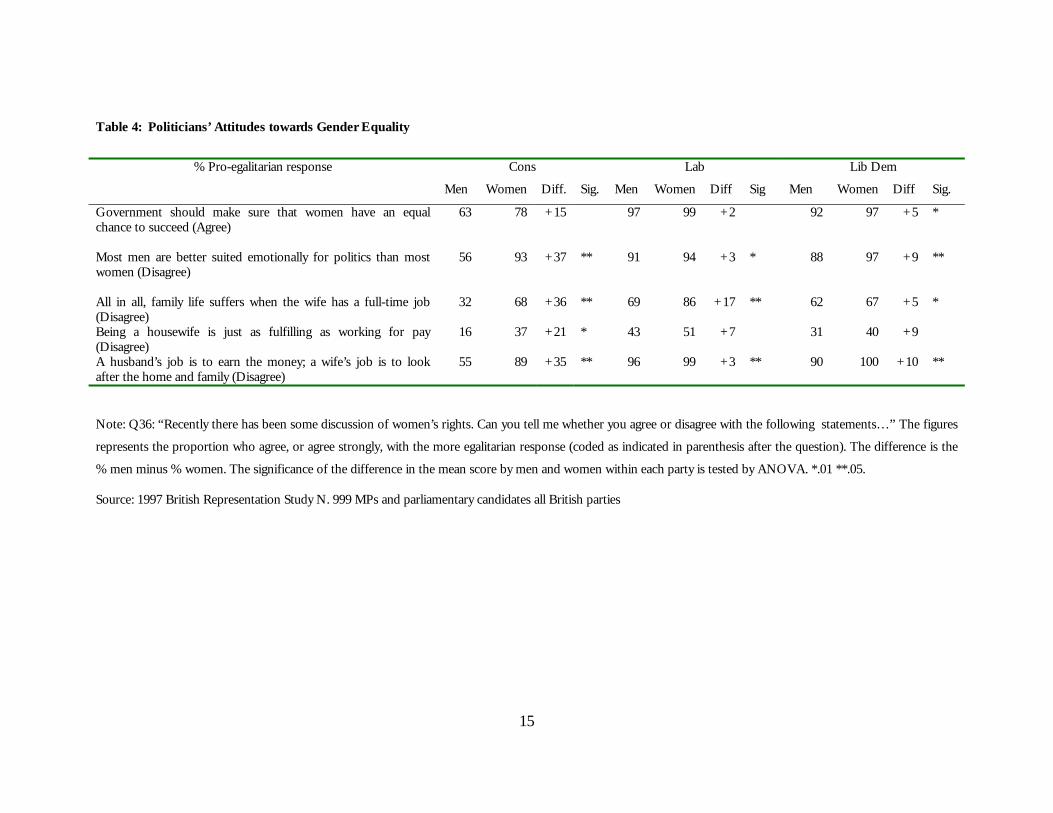
But can we extrapolate so far from a single issue scale? To explore this further, the British
Representation survey monitored egalitarian attitudes towards women and men’s roles using five
further items, listed in Table 4, designed to tap broader responses to matters like the appropriate
division of responsibilities over domestic roles, the suitability of women for public life, and the
government’s role in implementing equal opportunities. The table presents the proportion that
agreed with the most egalitarian response and the results confirm that on all these issues there was a
large and significant gender gap. Although much attention has focused on the entry of a new cohort
of Labour women, in fact again the gender gap in the elite proved greatest within the Conservative
party, particularly on whether women were suited to politics and work roles. For example, in the
Conservative party almost a fifth of the men agreed with the statement: “Most men are better suited
emotionally for politics than most women”, compared with none of the women.
Of course the gender differences that we have uncovered could be spurious if the result of
other factors, such as systematic age differences or the incumbency status of women and men
respondents. But when subject to multivariate OLS regression analysis (details not reported here),
gender remained the strongest predictor of attitudes towards these issues within each party, even
after controlling for age (the next strongest predictor), education, household income, whether the
respondent was elected in 1997, and their general left-right ideology. In other words, we can treat the
gender gap which has emerged from this study with some confidence for four reasons: the
differences between women and men’s attitudes towards egalitarian sex roles are consistent with
previous studies of the 1992 election; they are not just a product of question design since they are
evident when measured using different items; they cannot be explained as the product of Labour
recruiting women sympathetic to feminist values, since the gender gap proved significant within all
major parties; and lastly the multivariate analysis demonstrates that they are not simply the by-
product of other factors that distinguish women and men politicians, like their age or education.
[Table 4 about here]
Legislative Activities
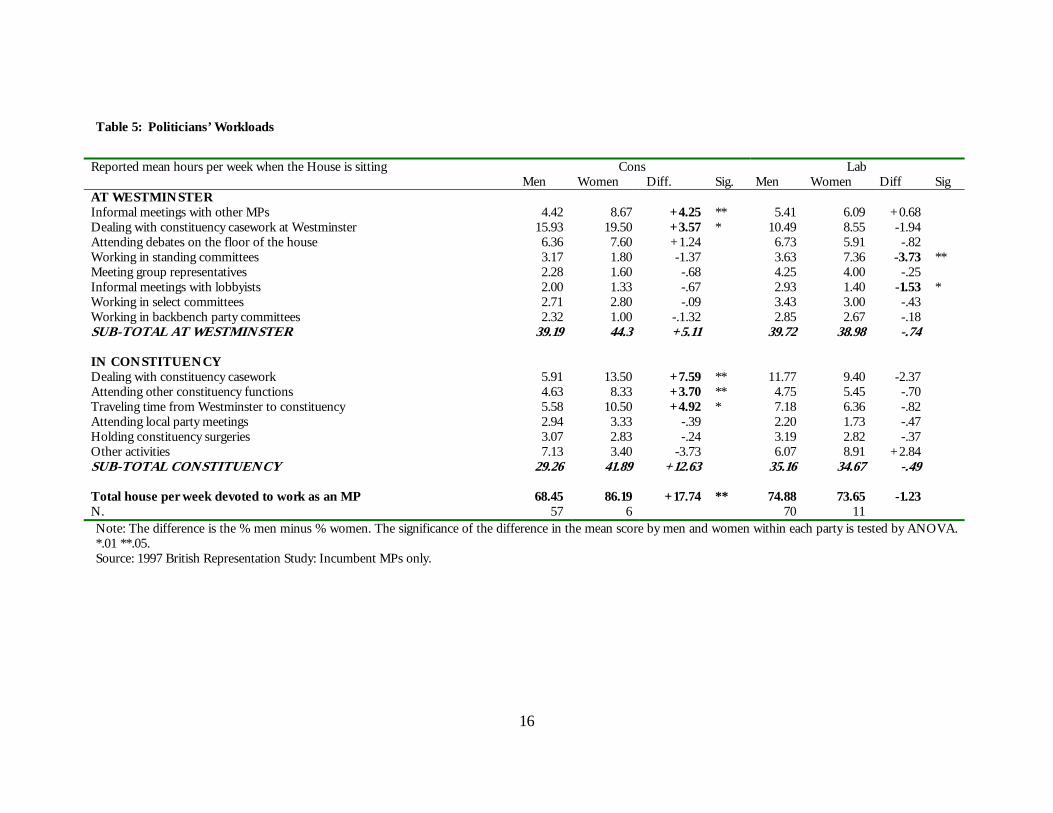
Were there also differences in the legislative work that occupies MPs at Westminster and in their
constituency? Previous work in the 1992 election found that women in every party gave higher
priority to constituency work, especially the day-to-day casework dealing with individual grievances
and problems (Norris and Lovenduski 1995, 223; Norris 1996, 1997). To examine this proposition
we can compare the average amount of time that incumbent MPs estimated that they usually devoted
to a list of activities in the average week when the house is sitting. The study confirms the long hours
10
and considerable demands of parliamentary life, with MPs estimating that they put in on average
more than 70 hours per week (including traveling time between their constituency and Westminster).
[Table 5 about here]
If broken down by gender, the results are hampered by the relatively small number of cases,
but nevertheless Table 5 shows that in the Conservative party, women MPs (ie incumbents elected
prior to 1997) estimated to be spending far more time than men (up to 12 hours extra per week) on
constituency service, especially on casework, attending other local functions, and traveling between
Westminster and their constituency. In contrast to the 1992 study, this gender gap was not evident
among Labour politicians. Similar patterns were found when Conservative MPs were asked to
estimate how many letters they received from constituents or from others in the average week.
Conservative women MPs estimated that they received about 325 letters from both sources, while
their male counterparts said that they received far fewer, only 132 per week. The equivalent figures in
the Labour party were 146 for men to 101 for women MPs. In the same way, Conservative women
members also said that they held about three constituency surgeries per month, compared with two
for male Conservatives. Therefore the gender differences in the Conservative parliamentary party are
consistent across different indicators, and with previous studies, although we would need more cases
to see whether these results hold once controlling for ministerial status, which previous studies
suggest may affect this pattern (Norris 1997).
Conclusions and Discussion
The last few years have witnessed substantial developments in the representation of women
in Britain. Gender equality in public life is far from established but nevertheless, after decades where
there were fewer than 30 women at Westminster, the 1997 general election and subsequent contests
in Scotland, Wales and for the European Parliament have seen unprecedented progress in Britain.
The main reasons for this development lie in strategies of positive discrimination within the Labour
party parliamentary recruitment process which led to the selection of many women in key target
marginals, before the 1997 landslide swept Labour into power. This development has increased the
pressures on the opposition parties to bring more women into office although so far the doctrine and
ethos of the Conservative party means they have been reluctant to adopt gender quotas. The process
of constitutional reform has altered the structure of opportunities for women in the new elected
bodies in Scotland and Wales, without the barrier of established incumbents.
The growth of women in office has certainly altered the symbolic face of the British political
elite. But has it had a significant impact upon the policy agenda or ethos of parliamentary life? Prior
to the last election, it was commonly claimed that more women at Westminster and in the devolved
11
assemblies would transform the political agenda and the dominant political style. The more
optimistic hopes have proved to be exaggerated, as British party politics have followed essentially
familiar tracks. Nevertheless any fundamental change to the British political culture cannot be
expected to occur overnight. The evidence within this study demonstrates that although British
politicians differ far more by party than by gender, especially on the core cleavages over the economy
and foreign policy, there are certain policy issues where there is a consistent gender gap within each
of the major parties, and where the claim that women and men in politics speak ‘in a different voice’
seems most plausible. In short, the gender of politicians does not seem to matter on everything, but
it does seem to matter most on gender-related values, which have significant implications for sex
equality policy in the labor force and home. If these issues become more salient, as women move
from a skewed to a tilted minority at Westminster, then critical mass theory suggests that this will
gradually become evident in legislative priorities and political debates. The idea that gender matters
most on gender-related issues may, perhaps, seem unsurprising, perhaps even commonsense. But it
does provide a strong argument to counter exaggerated popular claims by both skeptical critics, who
argue that nothing has changed, and more optimistic advocates, who hope that all will be
transformed overnight.
12
Table 1: Women in Public Office, UK
Lab Lab Con Con LDem LDem SNP SNP PC PC Other Other ALL ALL N. % N. % N. % N. % N. % N. % N. %
Cabinet/Shadow Cabinet 5/24 20.8 3/22 13.6 House of Commons 7 June 2001
94/413 22.7 14/166 8.4 5/52 9.6 1/5 20.0 0/4 0.0 0 0.0 120 17.9
Parliamentary Candidates 7 June 2001
146 22.8 92 14.4 135 21.1 16.8
European Parliament 11 June 1999
10/29 34.4 3/36 8.3 5/10 50.0 3/9 33.3 21/87 24.1
Scottish Parliament 6 May 1999
28/56 50.0 3/18 16.6 2/17 13.3 15/35 33.3 0/3 0.0 48/81 37.2
Welsh Assembly 6. May 1999
15/28 53.5 0/9 0.0 3/6 50.0 6/17 35.3 24/60 40.0
Sources:
House of Commons Pippa Norris ‘Apathetic Landslide: The 2001 British General Election.’ Britain Votes 2001 Oxford: Oxford University Press.
Scottish Parliamentary Elections: 6 May 1999 House of Commons Research Paper 99/50. London: House of Commons Library.
Welsh Assembly Elections: 6 May 1999 House of Commons Research Paper 99/51. London: House of Commons Library.
Tessa Keswick, Rosemary Pockley and Angela Guillame. 1999. Conservative Women. London: Center for Policy Studies.
Lords Reform: Background Statistics. 15 December 1998. House of Commons Research Paper 98/104. London: House of Commons Library.
13
Table 2: The Gender Gap in the British Electorate, 1945-97
Cons Voters Labour Voters Liberal Voters Gender Gap
% Men % Women % Men % Women % Men % Women
1945 35 43 51 45 11 12 -14
1950 41 45 46 43 13 12 -7
1951 46 54 51 42 3 4 -17
1955 47 55 51 42 2 3 -17
1959 45 51 48 43 7 6 -11
1964 40 43 47 47 12 10 -4
1966 36 41 54 51 9 8 -8
1970 43 48 48 42 7 8 -11
1974 37 39 42 40 18 21 -3
1974 35 37 45 40 16 20 -8
1979 45 49 38 38 15 13 -3
1983 46 45 30 28 23 26 -2
1987 44 44 31 31 24 23 -1
1992 46 48 37 34 17 18 -6
1997 29 31 53 51 18 19 -4
1992-1997 -16 -17 16 17 1 1
Source: Norris, Pippa. 1999. ‘Gender: A Gender-Generation Gap?’ In Critical Elections: British Parties and Voters in Long-term Perspective. Edited by Geoffrey
Evans and Pippa Norris. London: Sage.
14
Table 3: Politicians’ Attitudes towards Policy Issues
Note: The difference is the % men minus % women. The significance of the difference in the mean score by men and women within each party is tested by ANOVA.
*.01 **.05. Note the coding of the scales is from left (low) to right (high). With the difference, a negative coefficient means that women are more leftwing than men in
that party. A positive coefficient means that women are more rightwing than men in that party.
Source: 1997 British Representation Study N. 999 MPs and parliamentary candidates all British parties
Mean score on scales coded from left (1) to right (10) Cons Lab Lib Dem
Men Women Diff. Sig. Men Women Diff Sig Men Women Diff Sig.
Left v. Right 7.35 7.41 +.06 3.32 3.58 +.26 4.01 4.12 +.11
Jobs v. Prices 7.44 6.88 -.56 2.45 2.09 -.36 3.62 2.68 -0.94 **
Taxes v. spending 8.88 8.82 -.06 3.65 3.62 -.03 3.47 2.93 -.54 **
Nationalization v. Privatization 9.93 9.54 -.39 4.75 4.65 -.10 5.68 4.50 -1.18 **
Unite fully with EU v. Protect independence from EU 9.22 9.04 -.18 3.56 3.37 -.19 2.65 2.11 -.54 *
Women equal role v. Women’s role in the home 4.26 3.18 -1.08 * 1.39 1.02 -.37 ** 1.63 1.18 -.45 **
N. 252 27 243 76 220 61
15
Table 4: Politicians’ Attitudes towards Gender Equality
Note: Q36: “Recently there has been some discussion of women’s rights. Can you tell me whether you agree or disagree with the following statements…” The figures
represents the proportion who agree, or agree strongly, with the more egalitarian response (coded as indicated in parenthesis after the question). The difference is the
% men minus % women. The significance of the difference in the mean score by men and women within each party is tested by ANOVA. *.01 **.05.
Source: 1997 British Representation Study N. 999 MPs and parliamentary candidates all British parties
% Pro-egalitarian response Cons Lab Lib Dem
Men Women Diff. Sig. Men Women Diff Sig Men Women Diff Sig.
Government should make sure that women have an equal chance to succeed (Agree)
63 78 +15 97 99 +2 92 97 +5 *
Most men are better suited emotionally for politics than most women (Disagree)
56 93 +37 ** 91 94 +3 * 88 97 +9 **
All in all, family life suffers when the wife has a full-time job (Disagree)
32 68 +36 ** 69 86 +17 ** 62 67 +5 *
Being a housewife is just as fulfilling as working for pay (Disagree)
16 37 +21 * 43 51 +7 31 40 +9
A husband’s job is to earn the money; a wife’s job is to look after the home and family (Disagree)
55 89 +35 ** 96 99 +3 ** 90 100 +10 **
16
Table 5: Politicians’ Workloads
Note: The difference is the % men minus % women. The significance of the difference in the mean score by men and women within each party is tested by ANOVA. *.01 **.05. Source: 1997 British Representation Study: Incumbent MPs only.
Reported mean hours per week when the House is sitting Cons Lab Men Women Diff. Sig. Men Women Diff Sig AT WESTMINSTER Informal meetings with other MPs 4.42 8.67 +4.25 ** 5.41 6.09 +0.68 Dealing with constituency casework at Westminster 15.93 19.50 +3.57 * 10.49 8.55 -1.94 Attending debates on the floor of the house 6.36 7.60 +1.24 6.73 5.91 -.82 Working in standing committees 3.17 1.80 -1.37 3.63 7.36 -3.73 ** Meeting group representatives 2.28 1.60 -.68 4.25 4.00 -.25 Informal meetings with lobbyists 2.00 1.33 -.67 2.93 1.40 -1.53 * Working in select committees 2.71 2.80 -.09 3.43 3.00 -.43 Working in backbench party committees 2.32 1.00 -.1.32 2.85 2.67 -.18 SUB-TOTAL AT WESTMINSTER 39.19 44.3 +5.11 39.72 38.98 -.74 IN CONSTITUENCY Dealing with constituency casework 5.91 13.50 +7.59 ** 11.77 9.40 -2.37 Attending other constituency functions 4.63 8.33 +3.70 ** 4.75 5.45 -.70 Traveling time from Westminster to constituency 5.58 10.50 +4.92 * 7.18 6.36 -.82 Attending local party meetings 2.94 3.33 -.39 2.20 1.73 -.47 Holding constituency surgeries 3.07 2.83 -.24 3.19 2.82 -.37 Other activities 7.13 3.40 -3.73 6.07 8.91 +2.84 SUB-TOTAL CONSTITUENCY 29.26 41.89 +12.63 35.16 34.67 -.49 Total house per week devoted to work as an MP 68.45 86.19 +17.74 ** 74.88 73.65 -1.23 N. 57 6 70 11
17
Figure 1: Number of Women in the UK Parliament
Women MPs in UK Parliament
1 28 4
14 159
24 21 1724 25 29 26 26 23 27
19 23
41
60
120
0
20
40
60
80
100
120
140
1918192219231924192919311935194519501951195519591964196619701974197419791983198719921997
N. o
f Wom
en
Source: Women in the House of Commons (Rev. August 1999). London: House of Commons Information Office.
18
Figure 2: Women in Public Office,1st January 2000.
% Women in Public Office UK 1st Jan 2000
1618
2427
3337 39 40
0
10
20
30
40
50
House of Lords
House of Commons
European Parliament
Local Councillors
Government Posts
Scottish Parliament
Public Appointments
Welsh Assembly
% W
omen
19
Figure 3: Proportion of Women Local Councillors, 1973-99 English Shire Districts
% of Women Councillors: English Shire Districts
0
5
10
15
20
25
30
1973 1976 1979 1983 1987 1991 1996 1999
% W
omen
Source: Colin Rallings and Michael Thrasher. 1997. Local Elections in Britain. London: Routledge. Updated by Colin Rallings and Michael Thrasher The
Local Government Hardbook 1999. Plymouth: Local Government Center. www.lgcnet.com.
20
References
Brooks, Rachel, Angela Eagle and Clare Short. 1990. Quotas Now: Women in the Labour Party. Fabian
Tract 541. London: Fabian Society.
Brown, Alice, David McCrone and Lindsay Paterson. 1996. Politics and Society in Scotland. London:
Macmillan.
Bystydzienski, Jill M. 1992. Women Transforming Politics: Worldwide Strategies for Empowerment. Indianpolis:
Indiana University Press.
Dahlerup, Drude. 1988. ‘From a small to a large minority: Women in Scandinavian politics.’
Scandinavian Political Studies. 11(4): 275-298.
Drude Dahlerup. 1999. ‘Using quotas to increase women’s political representation.’ In IDEA:
Women in Politics Beyond Numbers. IDEA: Stockholm. http://www.int-idea.se/women/
Eagle, Angela and Joni Lovenduski. 1998. High Time or High Tide for Labour Women. London: Fabian
Society.
Equal Opportunities Commission. Facts about Women and Men in Great Britain 1999. EOC: Manchester.
http://www.eoc.org.uk
Evans, Geoffrey and Pippa Norris. 1999 Critical Elections: British Parties and Voters in Long-term
Perspective London: Sage Publications.
House of Commons Research Papers. Scottish Parliamentary Elections: 6 May 1999 House of Commons
Research Paper 99/50. London: House of Commons Library.
____ Welsh Assembly Elections: 6 May 1999 House of Commons Research Paper 99/51. London: House of
Commons Library.
____ Women in the House of Commons (Rev. August 1999). London: House of Commons Information
Office.
____ Lords Reform: Background Statistics. 15 December 1998. House of Commons Research Paper 98/104.
London: House of Commons Library.
Hewitt, Patricia and Deborah Mattinson. 1989. Women’ Votes: The Key to Winning. London: Fabian
Society.
Jenkins Report, The. The Independent Commission on the Voting System. October 1998. Cm. 4090-I.
London: The Stationery Office.
Kanter, Rosabeth Moss. 1977. ‘Some effects of proportion of group life: skewed sex ratios and
responses to token women.’ American Journal of Sociology. 82(2): 965-990.
Karvonen, Lauri and Per Selle. 1995. Women in Nordic Politics. Aldershot: Dartmouth.
Keswick, Tessa, Rosemary Pockley and Angela Guillame. 1999. Conservative Women. London: Centre
for Policy Studies. http://www.cps.org.uk/women.htm.
21
Lovenduski, Joni and Vicky Randall. 1993. Contemporary Feminist Politics. Oxford: Oxford University
Press.
Lovenduski, Joni. 1996. ‘Sex, Gender and British Politics.’ In Women in Politics. Eds. Joni Lovenduski
and Pippa Norris. Oxford: Oxford University Press.
Lovenduski, Joni and Pippa Norris. 1996. Women in Politics. Oxford: Oxford University Press.
Lovenduski, Joni, Pippa Norris, and Catriona Burness. 1994. "The Party and Women." Conservative
Century, eds. Anthony Seldon and Stuart Ball. Oxford: Oxford University Press.
Lovenduski, Joni and Pippa Norris. 1994 ‘Labour and the Unions: After the Brighton Conference.’
Government and Opposition Spring 29(2) pp.201-217.
MacDougal, Linda. 1998. Westminster Women. London: Vintage.
Noelle-Neuman, Elisabeth. 1984. Spiral of Silence. Chicago: University of Chicago Press.
Norris, Pippa and Joni Lovenduski. 1995. Political Recruitment: Gender, Race and Class in the British
Parliament. Cambridge: Cambridge University Press.
Norris, Pippa 1996 "Women Politicians: Transforming Westminster?" Parliamentary Affairs 49(1): 89-
102.
Norris, Pippa. 1997. "The Puzzle of Constituency Service." The Journal of Legislative Studies 3(2): 29-
49.
Norris, Pippa. 1999. ‘Gender: A Gender-Generation Gap?’ In Critical Elections: British Parties and
Voters in Long-term Perspective. Edited by Geoffrey Evans and Pippa Norris. London: Sage.
Norris, Pippa. 1985 "Women in European Legislative Elites." West European Politics 8(4): 90-101.
Norris, Pippa. The British Representation Study 1997. http://www.pippanorris.com
Perrigo, Sarah. 1996. ‘Women and Change in the Labour Party 1979-1995.’ In Women in Politics, Eds
Joni Lovenduski and Pippa Norris. Oxford: Oxford University Press.
Short, Clare. 1996. ‘Women and the Labour Party.’ In Women in Politics, Eds Joni Lovenduski and
Pippa Norris. Oxford: Oxford University Press.
Stephenson, Mary-Ann. 1989. The Glass Trapdoor: Women, Politics and the Media during the 1997 Election.
London: Fawcett..
Thomas, Sue.1994. How Women Legislate. Oxford: Oxford University Press.
Tremblay, Manon. 1998. ‘Do female MPs substantively represent women?’ Canadian Journal of Political
Science. 31(3): 435-465.
22
1 As at November 1999. 2 For details of initiatives taken by the Ministry for Women see http://www.cabinet-office.gov.uk/womens-
unit. 3 The British elections to the European parliament on 10 June 1999 returned 21 women and 66 MEPs, or
24.1% female, compared with 29.9% of women MEPs across the whole European parliament. The British
Liberal Democrats and Greens elected 50% women MEPs. 4 Cabinet Office Fourth Report of the Commissioner for Public Appointments. 5 Colin Rallings and Michael Thrasher. 1997. Local Elections in Britain. London: Routledge. Updated by Colin
Rallings and Michael Thrasher The Local Government Hardbook 1999. Plymouth: Local Government Center.
www.lgcnet.com. 6 Inter-Parliamentary Union. Women in World Parliaments. Geneva: Inter-Parliamentary Union. November 1999.
http://www.ipu.int 7 See Drude Dahlerup ‘Using quotas to increase women’s political representation.’ In IDEA: Women in Politics
Beyond Numbers. IDEA: Stockholm. http://www.int-idea.se/women/ 8 See http://www.engerder.org.uk 9 Prior to reform, out of 1326 members the House of Lords contained 118 women - 17 hereditary and 101 life
peers. Out of 75 heredity peers elected on 5th November 1999, four were women (all crossbenchers): Baroness
Darcy de Knayth, Lady Saltoun of Abernethy, Baroness Strange and Baroness Wharton. After reform, out of
651 members, the total number of women in the Lords was therefore 105 or 16.1%. Estimated from the House
of Lords Briefing 1st November 1999. http://www.publications.parliament.uk/pa/ld199798. See also Richard
Cracknell. Lords Reform: Background Statistics. London: House of Commons Research Paper 98/104 15
December 1998. Table Ib. 10 When discussing this issue the Jenkins report mistakenly uses the Irish STV system as an example of a
proportional electoral system, rather than a semi-proportional one, and seems unaware of the substantial body
of evidence of a systematic relationship between PR and women’s representation. See paragraph 39. The
Independent Commission on the Voting System. (The Jenkins Report). October 1998. Cm. 4090-I. London: The
Stationery Office. 11 The British Representation Study was conducted under the direction of Pippa Norris (Harvard
University) in collaboration with Joni Lovenduski (Southampton University), Anthony Heath (Nuffield
College/ CREST), Roger Jowell (Social and Community Planning Research/CREST), and John Curtice
(Strathclyde University/ CREST). The research was distributed and administered from the School of
Economic and Social Studies at the University of East Anglia and funded by the Nuffield Foundation. The
1997 BRS survey used a mail survey sent out to all candidates selected by the main British parties
(Conservative, Labour, Liberal Democrat, SNP, Plaid Cymru, and Green) by 1st June 1996. Fieldwork was

23
from 18th June to 3rd July 1996. In total 1,628 questionnaires were distributed, producing 999 replies,
representing a response rate of 61.4 percent. The survey includes 179 MPs elected in 1992 and 277 MPs
elected in 1997. The response rate produced a fairly even balance between parties although the rate of
return was higher among candidates than incumbent MPs. Full details can be found at www.pippanorris.com


![[Pippa Norris] Critical Citizens Global Support f(BookFi.org) (1)](https://static.fdocuments.in/doc/165x107/55cf99d4550346d0339f6218/pippa-norris-critical-citizens-global-support-fbookfiorg-1.jpg)