UMTS Capacity simulation study Andrés Felipe Cosme Hurtado ...

een.ec.europa.eu
Gearing up for innovation and growth
2015-16 Final Activity Report
August 2017
2 | Enterprise Europe Network 2015-16 Final Activity Report
2
Executive Agency for Small and Medium-sized Enterprises (EASME)
Department A COSME, H2020 and EMFF
Unit A.1 COSME
Enterprise Europe Network
Sector A.1.1. Evaluation and Monitoring
Sector A.1.2. Business Services
Sector A.1.3. Communication, Governance and Training
Contact: Erwan LE GUEN
E-mail: [email protected]

3 | Enterprise Europe Network 2015-16 Final Activity Report
3
TABLE OF CONTENTS The Network at a glance .......................................................................................................................................... 6
Executive Summary .................................................................................................................................................... 7
1. Key results ............................................................................................................................................................ 9
2. A renewed Network ................................................................................................................................... 14
3. Progress ............................................................................................................................................................. 17
4. Client satisfaction ........................................................................................................................................ 27
5. Network Governance ................................................................................................................................ 30
6. Network communication ....................................................................................................................... 37
7. Learning & development ....................................................................................................................... 39
8. Business Cooperation Centres ............................................................................................................ 41
9. Main operational challenges and objectives ............................................................................ 43
Annexes ........................................................................................................................................................................... 45
4 | Enterprise Europe Network 2015-16 Final Activity Report
4
FIGURES
Figure 1: Countries covered by Business Cooperation Centres (BCCs) ..................................................................................... 15
Figure 2: 2015-2016 Achievements ................................................................................................................................................................. 20
Figure 3: Achievements Expected Impact EU 28 ................................................................................................................................ 22
Figure 4: Partnership Agreements - Expected Impact EU 28 .......................................................................................................... 22
Figure 5: Advisory Services Outcomes - Expected Impact EU 28 ................................................................................................. 23
Figure 6: Efficiency of Key Account Management services .............................................................................................................. 25
Figure 7: Percentages of overall satisfaction .............................................................................................................................................. 27
Figure 8: Percentage of clients who would recommend Network services .......................................................................... 28
Figure 9: Client and coaches satisfaction for KAM services .............................................................................................................. 28
Figure 10: Examples of BCC contributions to deals between European and foreign companies ........................... 41
Figure 11: Evolution of the number of PAs between EU and foreign companies ............................................................. 42
Figure 12: Main achievements of the 10 best performing Business Cooperation Centres .......................................... 42
Figure 13: Network partners by type of organisation in December 2015 ............................................................................... 49
Figure 14: Partners new to the Network in 2015: EU28 and COSME countries .................................................................... 49
TABLES
Table 1: Enterprise Europe Network - COSME indicators ................................................................................................................... 11
Table 2: Enterprise Europe Network - H2020 indicators ..................................................................................................................... 12
Table 3: Partnering services 2016-2016 Efficiency ratios ................................................................................................................ 19
Table 4: SAG Bureau membership in 2015-16 .......................................................................................................................................... 31
5 | Enterprise Europe Network 2015-16 Final Activity Report
5
MAIN ABREVIATIONS
BCC: Business Cooperation Centres: Enterprise Europe Network members located in third
countries.
PA: Partnership Agreement. Outcome of a partnering service: the start of a durable
partnership between a Network client and a foreign partner.
ASO: Advisory Service Outcome. Outcome of an advisory service: implemented advisory
plan with a durable positive impact on a clients' business.
KAM: Key Account Manager. Network staff member who ensures that SME Instrument
beneficiaries receive the most appropriate services and support to optimise the
exploitation of their innovation project1.
EIMC: Enhancing Innovation Management Capacity. Service provided by Network partners
to help client SMEs improve their innovation process to more successfully innovate
and bring innovations to the market.
SME Instrument
beneficiary: SME which successfully applied to the SME Instrument. Financed under the H2020
funding programme, the SME Instrument helps high-potential SMEs to develop
ground-breaking innovative ideas for products, services or processes that are ready
to face global market competition.
AM: Associate Members of the Enterprise Europe Network: organisations that provide
added value to the Network and increase the efficiency of its operations by making
available their expertise in a certain field.
KPRs: Key Performance Ratios. Efficiency and performance ratios based on the 16 numerical
indicators defined for the Network's activities.
POD: Partnering Opportunities Database. Database used by Network members to find
partners abroad for their clients.
BE/CM: Brokerage Events and Company Missions. Matchmaking events organised by the
Network to help its clients identify suitable partners abroad.
FTE: Full-Time-Equivalent. Refers to the number of hours a Network staff members work
per year on average (About 1,720 hours but can vary).
PES Data Items: Numerical targets each consortium has to set for a two-year activity period for each
activity (an activity can have one or several PES Data Items). PES stands for
'Performance Enhancement System', as these numerical indicators are used not only
to measure progress but also to help enhance the Network's efficiency and
performance.
COSME: The European Union programme for the competitiveness of small and medium-sized
enterprises.
SMEs: Small and Medium-sized Enterprises.
1 DETAILS ON: HTTPS://EC.EUROPA.EU/EASME/EN/NEWS/ROLE-ENTERPRISE-EUROPE-NETWORK-SME-INSTRUMENT-S-COACHING-
PROCESS

6 | Enterprise Europe Network 2015-16 Final Activity Report
6
The Network at a glance

7 | Enterprise Europe Network 2015-16 Final Activity Report
7
Executive Summary In the first two years of activity within the new COSME programme (2015-2016), the Enterprise Europe
Network delivered significant value to its main target group: European SMEs. During this period, the
Network worked in the context of a new monitoring and reporting strategy based on result-oriented
activities focusing on quality, efficiency and impact.
The results demonstrate that the Network managed to deliver on its aim to be an efficient and effective
instrument to support the internationalisation and innovation of European SMEs. In some cases, the
Network even exceeded key COSME indicators, such as the number of partnership agreements signed by
clients per year: in just two years, the Network reached an average of 2,550 agreements per year.2
A new focus for the Network in this period was the implementation of the SME Instrument with Key
Account Management (KAM) services, financed under the H2020 programme. In parallel, Network partners
also delivered Enhancing Innovation Management Capacity services (EIMC) to SME clients. In total, Network
partners provided these new innovation-focused services to 3,152 SMEs per year, 79% of the target
set in the 2014-2015 H2020 Work Programme. In doing so they demonstrated high levels of flexibility,
resource efficiency and the capacity to create synergies with other COSME-funded services.
In the period 2015-2016, clients reached 5,486 agreements with foreign companies thanks to Network
partnering services3, while Network advisory support services gave 3,317 clients a significant impetus
to improve their competitiveness and innovation at European level4. The Network's added-value was
validated by the results of impact questionnaires, completed by all clients who achieved Partnership
Agreements (PAs) or Advisory Service Outcomes (ASOs).
The quality and efficiency of Network services was also reflected in the results of the COSME client
satisfaction survey where 86% of respondents declared being satisfied or very satisfied with Network
services.
These positive results were underpinned by improvements in the Network's governance: the Steering
and Advisory Group's effectiveness was enhanced with the creation of a smaller group, the SAG Bureau.
Recognising their importance in structuring Network activities, Sector Groups were reinforced, with their
chairs' management tasks covered by specific expert contracts.
A dedicated support system for consortium coordinators was also set up. This system aimed at
improving their skills and efficiency when addressing the specific challenges they face in coordinating
Network consortia. Additional support and training was also provided to KAM and EIMC experts, to help
set up and structure these new services.
2 NOT INCLUDING BCC RESULTS AS BCCS ARE NOT FINANCED FROM THE COSME BUDGET 3 INCLUDING BCC COUNTRIES 4 NOT INCLUDING BCC COUNTRIES WHO ARE NOT DIRECTLY INVOLVED IN THIS ACTIVITY
8 | Enterprise Europe Network 2015-16 Final Activity Report
8
Led by EASME, Network communication efforts were stepped up in 2015-2016 to boost the Network's
visibility towards clients and stakeholders. A new visual identity and messaging, targeted promotion actions
and a stronger emphasis on communication aspects in all Network activities, have already started to show
results.
Improved learning and development activities supported the arrival of new staff, the introduction of new
services (e.g. trainings for the IMP3rove methodology and tools) and a stronger focus on quality, efficiency
and impact.
Recognising the importance of key strategic markets for European SMEs, the Network developed its
presence in global target markets through its Business Cooperation Centres (BCCs). In 2015-16, BCCs
contributed to 7% of the Partnership Agreements signed by Network clients.
Building on the positive results of its first two years of activity under the COSME programme, the Enterprise
Europe Network is well placed to continue to improve the quality, the efficiency and the relevance of
its services for European SMEs to further increase the concrete positive impact on its clients' businesses.
9 | Enterprise Europe Network 2015-16 Final Activity Report
9
1. Key results The Network's objective is to help European SMEs innovate and grow internationally. The following success
stories provide a snapshot of the many different ways in which the Network fulfilled its mandate in 2015-16.
1.1. Success Stories
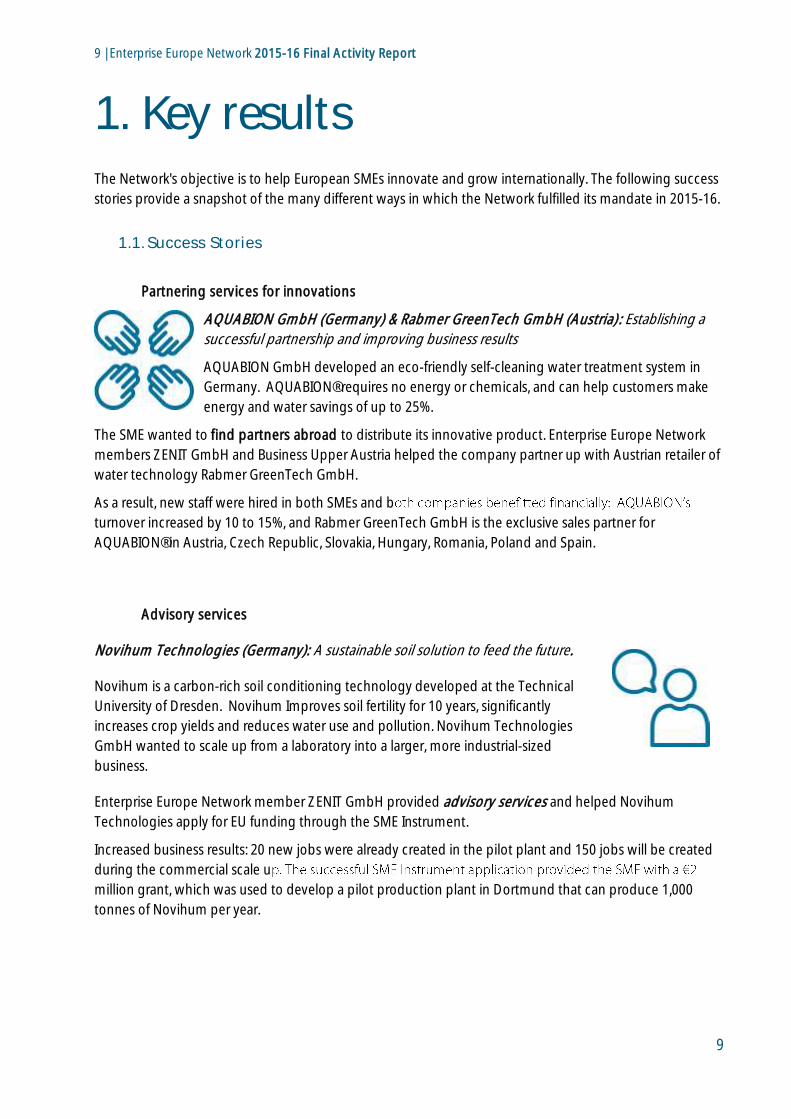
Partnering services for innovations
AQUABION GmbH (Germany) & Rabmer GreenTech GmbH (Austria) : Establishing a
successful partnership and improving business results
AQUABION GmbH developed an eco-friendly self-cleaning water treatment system in
Germany. AQUABION® requires no energy or chemicals, and can help customers make
energy and water savings of up to 25%.
The SME wanted to find partners abroad to distribute its innovative product. Enterprise Europe Network
members ZENIT GmbH and Business Upper Austria helped the company partner up with Austrian retailer of
water technology Rabmer GreenTech GmbH.
As a result, new staff were hired in both SMEs and b
turnover increased by 10 to 15%, and Rabmer GreenTech GmbH is the exclusive sales partner for
AQUABION® in Austria, Czech Republic, Slovakia, Hungary, Romania, Poland and Spain.
Advisory services
Novihum Technologies (Germany): A sustainable soil solution to feed the future.
Novihum is a carbon-rich soil conditioning technology developed at the Technical
University of Dresden. Novihum Improves soil fertility for 10 years, significantly
increases crop yields and reduces water use and pollution. Novihum Technologies
GmbH wanted to scale up from a laboratory into a larger, more industrial-sized
business.
Enterprise Europe Network member ZENIT GmbH provided advisory services and helped Novihum
Technologies apply for EU funding through the SME Instrument.
Increased business results: 20 new jobs were already created in the pilot plant and 150 jobs will be created
during the commercial scale u
million grant, which was used to develop a pilot production plant in Dortmund that can produce 1,000
tonnes of Novihum per year.

10 | Enterprise Europe Network 2015-16 Final Activity Report
10
Support for SME-instrument beneficiaries
Smartive (Spain): Improving a business model and expanding to new markets
Smartive developed a range of digital platforms to monitor the performance of wind
turbines. The technology helps wind farms avoid failures and improve maintenance.
Smartive wanted to scale up and expand its market share. Enterprise Europe Network
member ACCIÓ helped Smartive improve their business model and apply for EU funding
through the SME Instrument.
A successful SME Instrument application brought This support allowed the three-staff
SME to now employ 14 and its annual turnover increased
Smartive landed major clients in Spain, Endesa and Gas Natural, and its technology is further used by wind
farms in Italy, Bulgaria, Denmark and Uruguay. Is annual turnove
Partnering services
Veziris Healthcare (Greece): expanding to new markets with the Network's business
database.
A Greek SME, Veziris Healthcare, gained a Czech distributor for its innovative mobility
aid thanks to the Enterprise Europe Network.
In 1998, the SME pioneered a mobility aid called BodyUpEvolution, a lightweight,
easy-to-assemble patient lift that works as an indoor wheelchair with interchangeable seats for the shower
and toilet. The company began exporting to a few countries in 2011 but lacked reliable distribution partners
in Europe.
Thanks to the help of Cristina Pascual at the National Documentation Centre Enterprise Europe Network
based
in BIC Plzen, the two companies got in touch and since their first contact have established a long-term
cooperation.
More succcess stories are available in Annex 1 and on the Enterprise
Europe Network website at een.ec.europa.eu

11 | Enterprise Europe Network 2015-16 Final Activity Report
11
1.2. Good progress towards COSME and H2020 targets
In 2015-16, the Network progressed well towards – and sometimes exceeded – its main COSME Indicators.
It supported over 254,057 SMEs (E.4.) with intensive services and reached 15.8 million SMEs through its
digital service offer. It achieved a high proportion of its H2020 targets5, managing these new innovation-
focused services efficiently and in increasing synergy with its COSME-funded services.
a) COSME results
Table 1: Enterprise Europe Network - COSME indicators
Specific objective Long term
target (2020)
Achieved
E.1. Number of partnership agreements signed per year 2,500 2,5506
E.2. Recognition of the Network amongst SME population Increase 8%7
E.3. Client satisfaction rate (% SMEs stating satisfaction, added-value of
specific service provided by the Network) 82% 86%8
E.4. Number of SMEs receiving support services (per year) 500,000 254,057
E.5. Number of SMEs using digital services (including electronic
information services) provided by the Network (in million) 2.3 15.8
E.1. Number of partnership agreements signed per year: with an average of 2,550 signed agreements
per year for the 2015-16 periods, the Network reached 101% of its objective for 2020: an average of 2,500
agreements per year.
E.2. Recognition of the Network amongst SME population: in 2015, 8% of all EU SMEs polled indicated
they had heard or read about the Network. Note that 51% of those polled were not engaged in any
international business activity, and thus not part of the Network's core target group.
E.3. Client satisfaction rate: Network services provided in 2015-16 were very appreciated by clients: 86% of
clients who answered the 2017 Client Satisfaction Survey were overall very satisfied or somewhat satisfied
with Network services (4% above the 2020 target).
E.4. Number of SMEs receiving support services: On average, 254,057 clients per year received support
during 2015 and 2016. The results for this indicator are lower than targeted due to a new method of
calculation of the indicator, and not because of a lower service level from the Network. To help Network
partners focus on intensive, high-value-added services while reducing the administrative burden, a sub-
indicator used in the calculation of the target (the number of clients receiving information services) was
5 90 CONSORTIA HAD TO SUBMIT FINAL REPORTS FOR 2015-2016 FOR THE COSME PART OF NETWORK ACTIVITIES, 82 FOR THE
H2020 PART. THIS REPORT IS BASED ON 97% OF REPORTS RECEIVED AND COMPLETED AT THE TIME OF WRITING. 6 REFERS TO COSME COUNTRIES ONLY 7 EUROBAROMETER SURVEY N° 421 (OCTOBER 2015) OF 13,000 SMES AS PRESENTED IN THE FINAL EVALUATION OF THE ENTERPRISE
EUROPE NETWORK 2008-2014, CARRIED OUT BY TECHNOPOLIS GROUP FOR THE EUROPEAN COMMISSION. 8 DATA FROM THE ENTERPRISE EUROPE NETWORK CLIENT SATISFACTION SURVEY 2017.
12 | Enterprise Europe Network 2015-16 Final Activity Report
12
dropped. Network partners keep providing information services to large numbers of SME clients, but no
longer need to record them.
For 2015-2016, COSME indicator E.4 is thus based on the following indicators from Network reports: DI02 #
Participants in regional/local events + DI03 # SMEs/clients receiving advisory support + DI05 # SMEs/clients
in brokerage events/company missions + DI07 # Partnership profiles produced + DI09 # Expression of
interests made. In 2017-2018, DI05 will be replaced by # SMEs/clients receiving partnering support, to cover
all brokerage services' clients.
In this context, Network results can be considered very good: while still providing services to a wide
client base (see results for COSME indicator E.5. below) the Network managed to improve its efficiency and
positively impact an increasing number of clients, as demonstrated by COSME indicator E.1 results.
E.5. SMEs using digital services: Network partners reported higher results than foreseen in the number of
SMEs using digital services. Network partners are particularly active in providing information, tender alerts or
partnering opportunities to SME clients via newsletters, social media and automatic matching tools.
b) H2020 results
Following a pilot phase in 2014, the Network successfully ramped up the provision of new services to
enhance the innovation management capacity of SMEs with two types of services:
Support to SME Instrument beneficiaries through the work of appointed Key Account Managers
(KAM) who initiated, brokered and monitored coach-SME relationships.
Provision of Enhancing Innovation Management Capacity (EIMC) services on a large scale while
training staff involved when needed.
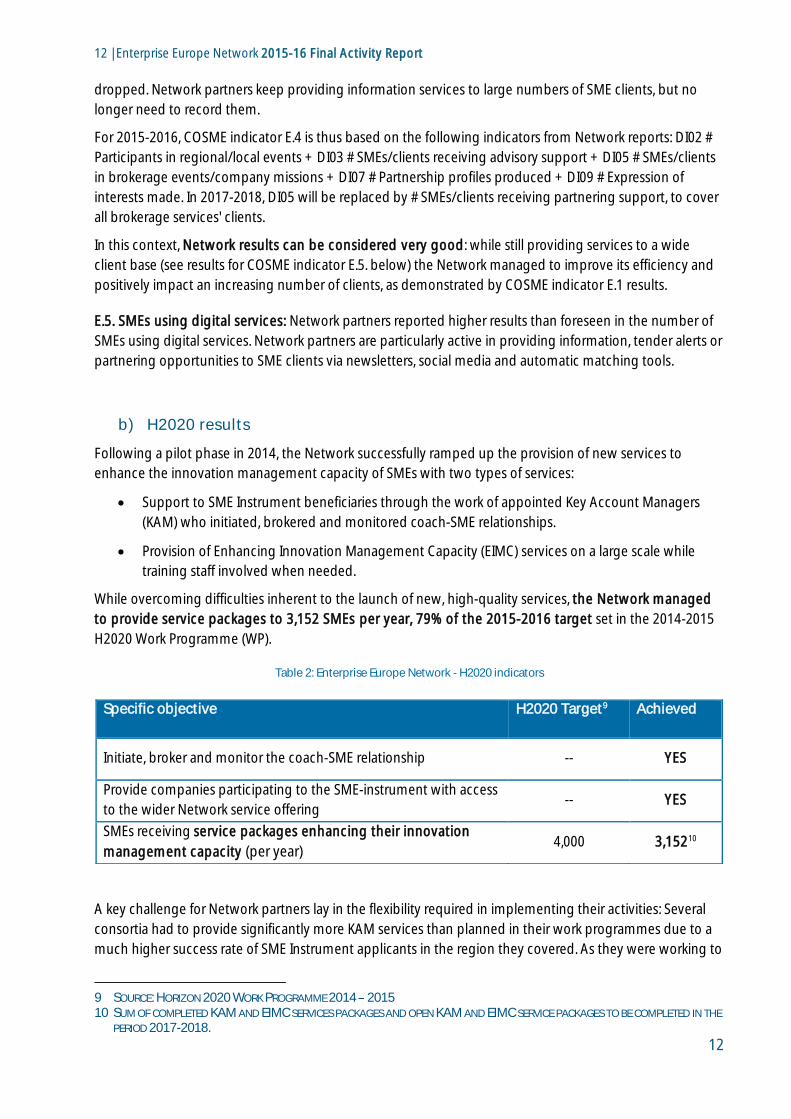
While overcoming difficulties inherent to the launch of new, high-quality services, the Network managed
to provide service packages to 3,152 SMEs per year, 79% of the 2015-2016 target set in the 2014-2015
H2020 Work Programme (WP).
Table 2: Enterprise Europe Network - H2020 indicators
A key challenge for Network partners lay in the flexibility required in implementing their activities: Several
consortia had to provide significantly more KAM services than planned in their work programmes due to a
much higher success rate of SME Instrument applicants in the region they covered. As they were working to
9 SOURCE: HORIZON 2020 WORK PROGRAMME 2014 2015 10 SUM OF COMPLETED KAM AND EIMC SERVICES PACKAGES AND OPEN KAM AND EIMC SERVICE PACKAGES TO BE COMPLETED IN THE
PERIOD 2017-2018.
Specific objective H2020 Target9 Achieved
Initiate, broker and monitor the coach-SME relationship -- YES
Provide companies participating to the SME-instrument with access
to the wider Network service offering -- YES
SMEs receiving service packages enhancing their innovation
management capacity (per year) 4,000 3,15210
13 | Enterprise Europe Network 2015-16 Final Activity Report
13
a fixed budget, this meant that they were forced to limit the number of Enhancing Innovation Management
Capacity (EIMC) services they could provide under this contract.
Each of the 2,300 successful SME Instrument applicants was referred to a Network Key Account Manager
(KAM) in charge of selecting the most appropriate coach who would support them in their SME Instrument
project. Most of them were successfully assigned a coach, while some clients declined (see detailed
explanation below).
As regards EIMC services, the Network invested time in 2015 establishing the service on a sound, quality
footing and training staff to use dedicated IT tools (such as IMP3rove). This meant that activity picked up in
2016 and the number of EIMC service packages provided to clients more than doubled.
Consortia mostly adopted a flexible, client-centric approach when providing EIMC services, e.g. using
the IT tool which best suited the clients' needs and preferences. Besides IMP3rove, consortia turned to other
IT solutions when assessing innovation management capacities, such as the Innovation Health Check,
Check Innov', smE-MPOWER or the NBank Innovation Management Tool. While IMP3rove is comprehensive
and has a good benchmarking database, SMEs often found it complex and preferred other tools that also
met the CEN/TS 16555 standard but were easier to work with.
EIMC service provision was sometimes delayed as staff needed training to use the IT tools and associated
methodologies, particularly IMP3rove which could not be used without training and certification. This
impacted the number of services that could be provided during the contractual period. Finally, convincing
client companies of the benefits of EIMC services often proved to be more difficult than expected.
Focused on meeting clients' needs, Network partners provided access to wider Network services to all
SMEs receiving KAM and EIMC services.
A number of consortia highlighted that they had provided further support to KAM or EIMC clients in the
framework of COSME-funded Network services. However; a lack of synergies was sometimes observed,
resulting in part from the contractual and staff split between H2020 and COSME activities. An ad-hoc action
was planned for 2017-2018 to address this issue and maximise synergies between COSME services and KAM
/ EIMC services to the benefit of clients.
Overall, even if there were difficulties in the implementation of EIMC services, the results are positive: the
Network provided service packages enhancing their innovation management capacities to nearly 80% of
the H2020 work programme target. It achieved these results using only 59% of the resources planned, in
part because SMEs often required less than the average 7-day service packages, in part because a slower
start of EIMC services did not allow the completion of all initiated service packages by the end of the period.
Overall, Network partners provided clients with KAM and EIMC services efficiently, and the preliminary
performance results data looks promising (see detailed assessment of the Network's performance for H2020
activities below).

14 | Enterprise Europe Network 2015-16 Final Activity Report
14
2. A renewed Network 2.1. Composition
At the end of 2016, the Enterprise Europe Network covered 65 countries with 605 partner organisations,
of which 20% had joined for the first time in 2015.
A total of 525 partner organisations grouped in 90 consortia covered 36 countries from EU Member States
and countries associated to the COSME programme11 ('COSME associated countries'). These "core Network
partners" worked with 80 Business Cooperation Centres grouped in 30 consortia covering 29 third countries.
These 605 organisations provide "standard" information, advisory services and partnering services, as well as
SME-feedback activities financed under the COSME programme.
The two most represented types of organisations in the Network are Chambers of Commerce and
Chambers of Craft (170) and National and Regional Development Agencies (166)12.
From these 605 organisations, 486 partners provide services to "enhance the innovation management
capacity of SMEs" in 35 countries (EU Member States and countries associated to H2020). In many
cases, only some of the organisations providing services under COSME also deliver innovation support
services (KAM and EIMC) under the H2020 specific grant agreement due to the service's specificity and staff
competencies' requirements.
The Network-building process was gradual: three consultations were launched for the consortia's 2015-2016
work programmes, leading to shifting project starting dates. Delays in contract signatures and pre-financing
payments affecting staff and activities prevented some consortia from reaching their full potential. In the
Inception Survey13, 76% reported negative consequences from contractual difficulties and delays.
The Network's renewal through the arrival of new organisations and its extension to new countries brought
in a wealth of new expertise and was mostly smooth14, but also led to integration challenges which, in some
cases, impacted results.
2.2. Evolution in COSME countries
In COSME countries, 11 organisations joined after 1 January, 2015 and 17 left before the end of 2016. In 2016
the Republic of Serbia and the Republic of Armenia were granted COSME associated country status leading
to two new consortia joining the Network: EEN Serbia and EEN Armenia, a total of 9 organisations covering
2 countries.
Certain consortia faced major changes during this period, notably in France where a reorganisation of
chambers of commerce (CCI) and a territorial reform reducing the number of administrative regions led to
CCI mergers and changes in some consortia's territorial coverage: some organisations had to switch
consortia. In Italy, Network partners also had to cope with a reorganisation and restructuring of CCIs.
11 ALBANIA, ARMENIA, FYROM, ICELAND, MOLDOVA, MONTENEGRO, SERBIA AND TURKEY 12 SEE ANNEX 5 FOR DETAILS 13 REFERS TO A SHORT SURVEY LAUNCHED BY EASME IN 2015 WITH THE AIM TO ESTABLISH TO WHICH EXTENT CONSORTIA HAD BEGUN
TO IMPLEMENT THEIR ACTIVITIES AND ENSURE THAT CONDITIONS WERE IN PLACE TO PROVIDE THE REQUIRED SERVICES
14 2015 INCEPTION SURVEY

15 | Enterprise Europe Network 2015-16 Final Activity Report
15
2.3. Countries with Business Cooperation Centres
The Network's Business Cooperation Centres (BCCs) are based in countries that are not associated to the
COSME programme. They do not receive EU funding and they finance Network activities with national
and/or host structure funds.
Between 2015 and 2017, the number of BCC countries grew from 26 to 29. Each BCC is covered by one
consortium, China being the only exception with three consortia in Western, Central and Eastern China.
To exploit synergies, BCC consortia integrated EU business support structures in Asia such as the EU SME
Centre in Beijing or the EU-Vietnamese Business Network.
Figure 1: Countries covered by Business Cooperation Centres (BCCs)
2.4. Associate Members
Associate Members (AM) provide added value to the Network and increase the efficiency of its operations
by making their expertise available in a certain field. All European Network partners are able to call on their
services, which include: promoting the Network, signposting, interacting and networking, sharing expertise
and good practice, answering queries, acting as speakers, contributing to Sector Groups and liaising with
Thematic Contact Points. According to a recent survey of AMs:
75% regularly signpost their clients/members to Network partners (when they have identified a
need for a service offered by the Network)
Most AMs promote the Network via their websites, newsletters and social media
75% plan to attend the Annual Conference in Estonia in 2017 and most are keen to contribute to
workshops or meet Network partners in face-to-face meetings
80% have supported/co-organised at least one event with Network partners such as b2b meetings,
trainings or info-sessions
Nearly 60% are contacted less than five times per month by our Network partners. Only two AMs
indicated receiving more than five questions per month.

16 | Enterprise Europe Network 2015-16 Final Activity Report
16
2.5. Network budget: COSME and H2020
For 2015-2016, the Network's total committed budget was 202,367,986 with 118,572,891 of EU
contribution.
This budget is split between a COSME budget of , with of EU contribution
corresponding to a 55% co-financing rate; and an H2020 budget covering KAM and EIMC services with a
budget and a 100% co-financing rate.
Budget consumption on reports which had been assessed at the time of writing was 96% for COSME
Specific Grant Agreements (SGA) and 59% for H2020 SGAs.
17 | Enterprise Europe Network 2015-16 Final Activity Report
17
3. Progress In the first two years under the COSME programme, the Enterprise Europe Network focused on creating a
positive impact for clients.
In terms of COSME activities, the progress of Network partners is reflected in the results reported for the 16
PES Data Items (see details in Annex 7). These interrelated activity indicators, for which each consortium sets
target values for a two-year period, give a good reflection of the Network's overall progress: 13 out of 16
Data Items were achieved at over 93%, of which 11 at over 100%15. This progress coincides with an
improved efficiency and performance of the services provided.
In terms of H2020 innovation support services, Network partners answered all requests to support SME-
instrument beneficiaries with KAM services while at the same time launching Enhancing Innovation
Management Capacity (EIMC) services. The promising results detailed below were achieved despite the
need, especially in 2015, to adapt to changes and deal with issues linked to the start of a new phase of
Network activities
Contributing to these results were a number of governance, communication and learning and
development initiatives and changes (detailed in sections 5 to 8 below) which reinforced the relevance and
quality of Network services and their impact on SME clients' businesses.
3.1. COSME activities
3.1.1. KPRs and a clearer ASO definition help focus on efficiency and impact
Key Performance Ratios (KPRs)
To contribute to a stronger focus on efficiency and impact as opposed to just meeting quantitative targets
of clients served and services provided, eight efficiency and performance ratios (together Key
Performance Ratios - KPRs) based on PES Data Items were introduced.
(1) Two Performance ratios help focus on the Network's key objective to achieve a high positive
impact per resource invested: KPR2 - number of Partnership Agreements per full-time equivalent
(PA/FTE) and KPR3 number of Advisory Services Outcomes per FTE (ASO/FTE).
(2) Six Efficiency ratios focus the Network on improving the quality and efficiency of services, as
better client support is more likely to result in a positive impact on clients' businesses. KPR1, number
of ASOs per client receiving advisory services, highlights the aim of advisory services: to have a
strong impact on clients, and should drive partners towards services with a higher added-value for
clients. KPR6, number of expressions of interests (EoI) per profile published in the POD database,
points to the need for quality profiles which help identify the number of potential matches needed
to reach eventual partnership agreements with foreign clients16.
KPRs are used as tools in the monitoring and reporting of Network activities. Context is essential when using
them to assess the results of Network partners' activities. For example, having more EoIs per profile is only
good if there is a strong follow-up of these "leads": turning leads into partnership agreements with a lasting
15 SEE ANNEX 7 FOR THE LIST OF DATA ITEMS BY ACTIVITY, WITH THE TARGETS AND ACHIEVED FIGURES FOR 2015-2016
18 | Enterprise Europe Network 2015-16 Final Activity Report
18
impact on clients (as opposed to simply the volume of EoIs) is the objective. Details on all KPRs, including
definitions, use and figures achieved for 2015-2016 can be found in Annex 8.
Clearer Advisory Service Outcome (ASO) definition
For advisory services, the process and quality requirements to reach and report Advisory Services Outcomes
were clarified in the ASO guidelines. Specifically, (1) not all advisory services lead to a measurable outcome
for the clients; (2) an implemented advisory plan is a requirement to register an ASO in the Network's
Achievements database. Both points stress that quality, intensive advisory services should result in an action
plans that clients should implement, and result in a measurable outcome17.
3.2. Promising results
Overall, this new approach has demonstrated solid results. In two years, Network partners from EU 28,
COSME associated countries and Business Cooperation Centres helped 8,418 clients reach
Achievements18, which represents a good step towards their principal targets19 for COSME activities.
Achievements are the end-product of a dynamic set of activities:
1) In Information and Advisory services, 302,900 clients attended information and training events at
local and regional level (133% of target planned in the Network consortia's work programmes) and
102,866 received advisory services (96% of target).
The number of advisory services was influenced by the stronger focus on achievements and
impact: Network partners often offered clients fewer, more intensive services.
2) Partnering services: 45,963 clients attended Network brokerage events and company missions
(151% of target) where they had 156,421 meetings (178% of target).
BCC partners' contribution was significant as they helped organise 17,512 meetings between EU
and overseas companies. This figure also shows the dynamism of Network client SMEs who search
for partners beyond the Single Market in growing numbers.
3) In SME feedback activities, Network staff members actively engaged 18,462 SMEs to take part in
SME feedback actions and panels, such as the request for feedback on the Review of the special
schemes for small enterprises under the VAT Directive 2006/112/EC (105% of target).
Despite achieving better results than initially planned, convincing SMEs to take part in panels remained
difficult for several reasons: (1) clients often perceive no tangible benefits in participating; (2) the absence of
official feedback to clients to inform them on how feedback will be used after closure of the panel, makes it
difficult to engage them in further panels; (3) the lack of evidence of the effect of their participation puts
some clients off; (4) timing issues can complicate the implementation of the activities by Network partner,
e.g. in 2016 when several panels were published in close succession; (5) several EU open consultations
published were not directly relevant to Network client companies.
17 SEE MORE DETAILS IN THE ACHIEVEMENTS GUIDELINES - SECTION 2 ADVISORY SERVICES OUTCOMES (ASOS), AVAILABLE ON THE
ENTERPRISE EUROPE NETWORK INTRANET (LOGIN REQUIRED) 18 ACHIEVEMENTS ARE PARTNERSHIP AGREEMENTS OR ADVISORY SERVICES OUTCOMES AND ARE THE FINAL RESULTS RESPECTIVELY OF
PARTNERING SERVICES AND ADVISORY SERVICES 19 COSME COUNTRY PARTNERS HAVE WORK PROGRAMMES ANNEXED TO THEIR CONTRACTS, BCC PARTNERS HAVE ANNUAL BINDING
TARGETS ANNEXED TO THEIR COOPERATION AGREEMENTS BUT RECEIVE NO FUNDING
19 | Enterprise Europe Network 2015-16 Final Activity Report
19
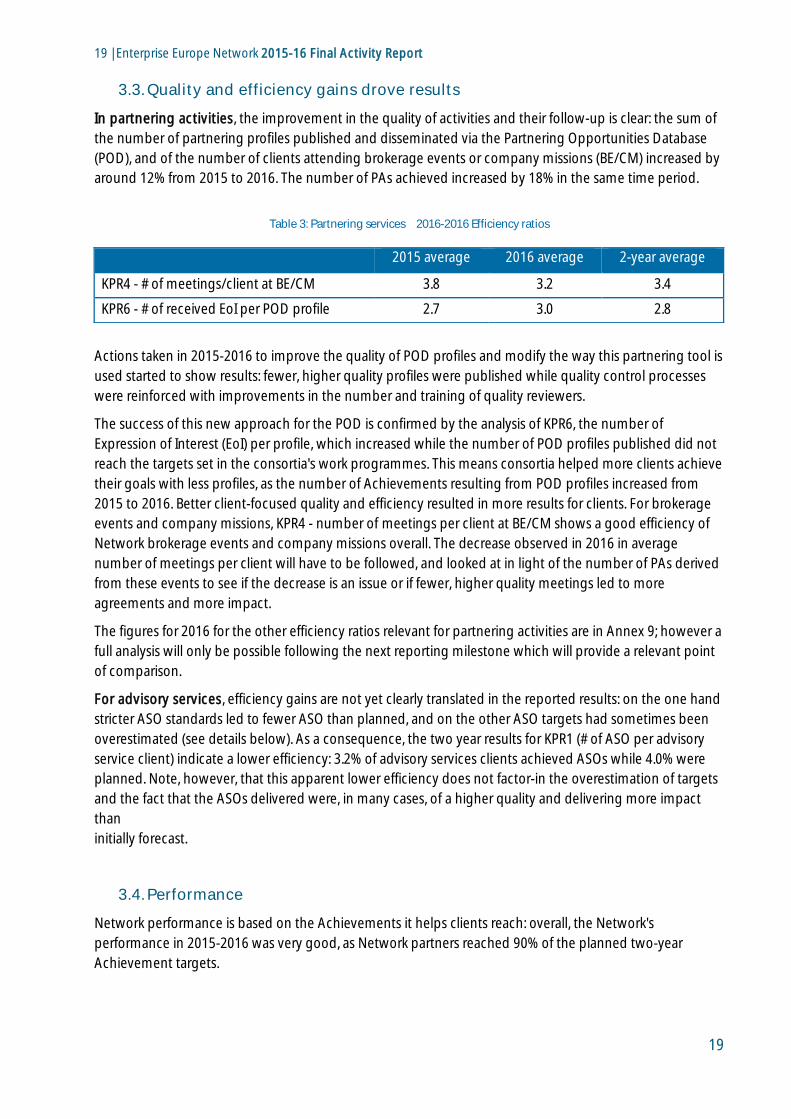
3.3. Quality and efficiency gains drove results
In partnering activities, the improvement in the quality of activities and their follow-up is clear: the sum of
the number of partnering profiles published and disseminated via the Partnering Opportunities Database
(POD), and of the number of clients attending brokerage events or company missions (BE/CM) increased by
around 12% from 2015 to 2016. The number of PAs achieved increased by 18% in the same time period.
Table 3: Partnering services 2016-2016 Efficiency ratios
Actions taken in 2015-2016 to improve the quality of POD profiles and modify the way this partnering tool is
used started to show results: fewer, higher quality profiles were published while quality control processes
were reinforced with improvements in the number and training of quality reviewers.
The success of this new approach for the POD is confirmed by the analysis of KPR6, the number of
Expression of Interest (EoI) per profile, which increased while the number of POD profiles published did not
reach the targets set in the consortia's work programmes. This means consortia helped more clients achieve
their goals with less profiles, as the number of Achievements resulting from POD profiles increased from
2015 to 2016. Better client-focused quality and efficiency resulted in more results for clients. For brokerage
events and company missions, KPR4 - number of meetings per client at BE/CM shows a good efficiency of
Network brokerage events and company missions overall. The decrease observed in 2016 in average
number of meetings per client will have to be followed, and looked at in light of the number of PAs derived
from these events to see if the decrease is an issue or if fewer, higher quality meetings led to more
agreements and more impact.
The figures for 2016 for the other efficiency ratios relevant for partnering activities are in Annex 9; however a
full analysis will only be possible following the next reporting milestone which will provide a relevant point
of comparison.
For advisory services, efficiency gains are not yet clearly translated in the reported results: on the one hand
stricter ASO standards led to fewer ASO than planned, and on the other ASO targets had sometimes been
overestimated (see details below). As a consequence, the two year results for KPR1 (# of ASO per advisory
service client) indicate a lower efficiency: 3.2% of advisory services clients achieved ASOs while 4.0% were
planned. Note, however, that this apparent lower efficiency does not factor-in the overestimation of targets
and the fact that the ASOs delivered were, in many cases, of a higher quality and delivering more impact
than
initially forecast.
3.4. Performance
Network performance is based on the Achievements it helps clients reach: overall, the Network's
performance in 2015-2016 was very good, as Network partners reached 90% of the planned two-year
Achievement targets.
2015 average 2016 average 2-year average
KPR4 - # of meetings/client at BE/CM 3.8 3.2 3.4
KPR6 - # of received EoI per POD profile 2.7 3.0 2.8
20 | Enterprise Europe Network 2015-16 Final Activity Report
20
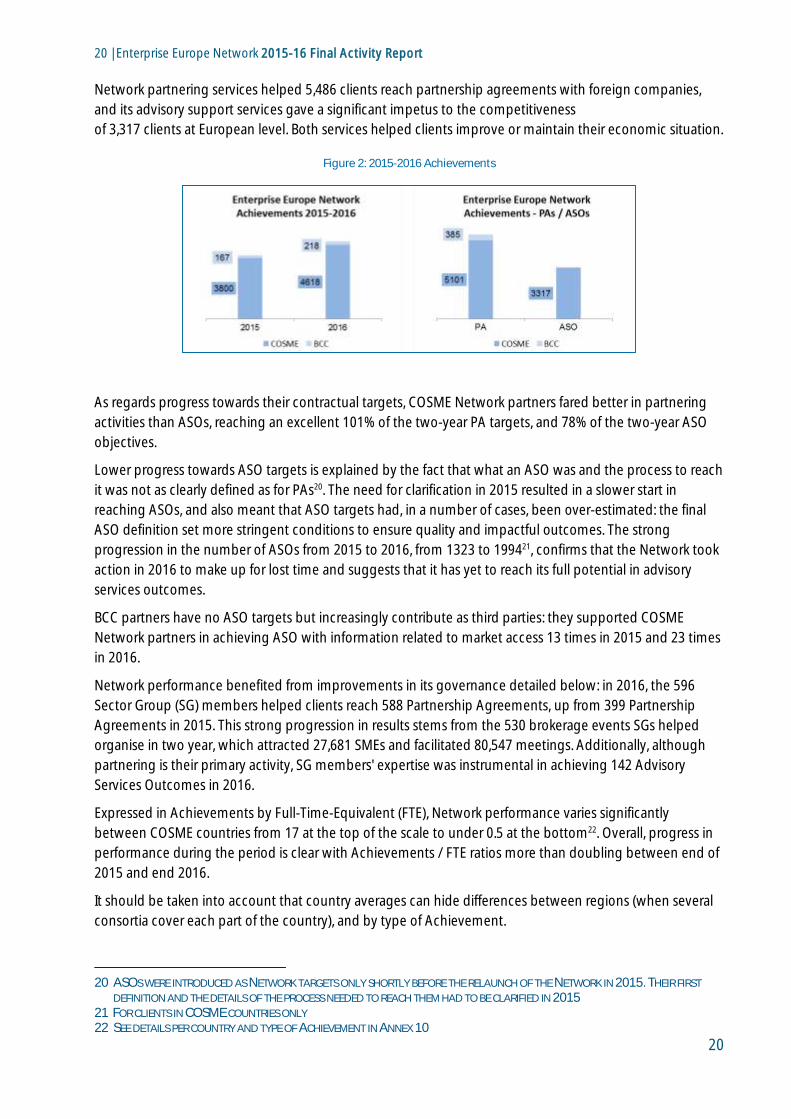
Network partnering services helped 5,486 clients reach partnership agreements with foreign companies,
and its advisory support services gave a significant impetus to the competitiveness
of 3,317 clients at European level. Both services helped clients improve or maintain their economic situation.
Figure 2: 2015-2016 Achievements
As regards progress towards their contractual targets, COSME Network partners fared better in partnering
activities than ASOs, reaching an excellent 101% of the two-year PA targets, and 78% of the two-year ASO
objectives.
Lower progress towards ASO targets is explained by the fact that what an ASO was and the process to reach
it was not as clearly defined as for PAs20. The need for clarification in 2015 resulted in a slower start in
reaching ASOs, and also meant that ASO targets had, in a number of cases, been over-estimated: the final
ASO definition set more stringent conditions to ensure quality and impactful outcomes. The strong
progression in the number of ASOs from 2015 to 2016, from 1323 to 199421, confirms that the Network took
action in 2016 to make up for lost time and suggests that it has yet to reach its full potential in advisory
services outcomes.
BCC partners have no ASO targets but increasingly contribute as third parties: they supported COSME
Network partners in achieving ASO with information related to market access 13 times in 2015 and 23 times
in 2016.
Network performance benefited from improvements in its governance detailed below: in 2016, the 596
Sector Group (SG) members helped clients reach 588 Partnership Agreements, up from 399 Partnership
Agreements in 2015. This strong progression in results stems from the 530 brokerage events SGs helped
organise in two year, which attracted 27,681 SMEs and facilitated 80,547 meetings. Additionally, although
partnering is their primary activity, SG members' expertise was instrumental in achieving 142 Advisory
Services Outcomes in 2016.
Expressed in Achievements by Full-Time-Equivalent (FTE), Network performance varies significantly
between COSME countries from 17 at the top of the scale to under 0.5 at the bottom22. Overall, progress in
performance during the period is clear with Achievements / FTE ratios more than doubling between end of
2015 and end 2016.
It should be taken into account that country averages can hide differences between regions (when several
consortia cover each part of the country), and by type of Achievement.
20 ASOS WERE INTRODUCED AS NETWORK TARGETS ONLY SHORTLY BEFORE THE RELAUNCH OF THE NETWORK IN 2015. THEIR FIRST
DEFINITION AND THE DETAILS OF THE PROCESS NEEDED TO REACH THEM HAD TO BE CLARIFIED IN 2015 21 FOR CLIENTS IN COSME COUNTRIES ONLY 22 SEE DETAILS PER COUNTRY AND TYPE OF ACHIEVEMENT IN ANNEX 10
21 | Enterprise Europe Network 2015-16 Final Activity Report
21
In some cases, lower performance is not linked to inefficient activities but to the fact that the consortia were
completely new to the Network and that initial integration proved more difficult. In 2015-2016, Turkey's
performance was also affected due to the difficult situation in the country which did not allow its consortia
to carry out their activities as planned.
As foreseen in the contracts, underperforming consortia for which no extenuating circumstances apply can
see their EU grant reduced. At the time of this report's writing, only one consortium was concerned.
Overall, performance differentials suggest that exchange of efficient working practices could help less
successful partners and consortia improve their performance in reaching Achievements. To ensure that
appropriate actions are undertaken to address the issues at the root of the underperformance, all consortia
with difficulties in meeting performance targets in 2015-2016 will receive special support from their EASME
Project Advisers.
3.5. Expected impact of Achievements from COSME activities
In April 2016, EASME launched the systematic recording of the impact that Network clients23 expect
Achievements to have on their businesses. This was done with a 15-question questionnaire in five areas:
market improvement, positive impact on jobs, improvement in competitiveness through innovation, cost
savings and quality improvements. Clients were asked to fill in a questionnaire every time they reach an
Achievement24. Clients' answers were recorded by Network partners when registering the Achievements in
the Network's database.
One year after the Achievements' registration, clients are asked to answer the same questions to check if the
expected impact has materialised the second questionnaire records actual impact.
The first completed year (1st April 2016 and 31st March 2017) of expected impact information for both PAs
and ASOs yielded results in three key areas25 which are primary Network objectives:
Market improvement - improvement in market position / market share / turnover
Positive impact on jobs - expect to preserve / create jobs
Expected improved competitiveness through innovation
Results showed that nearly 70% of clients expect their market situation to improve thanks to Network
support. Close to one in two clients feels its competitiveness will improve thanks to improvements in
innovation achieved with Network help and more than 4 out of 10 clients who reached an Achievement
estimate Network services will help them preserve or create jobs .
A conclusive analysis of expected impact results will only be possible once the actual impact results of the
4,064 Achievements are collected and consolidated in 2018.
23 FOR CLIENTS IN COSME COUNTRIES ONLY 24 SEE QUESTIONNAIRE ANNEX 6 25 GRAPHS GIVE THE PERCENTAGE OF POSITIVE ANSWERS (CLIENTS CAN ANSWER POSITIVELY TO SEVERAL QUESTIONS). SEE THE LIST OF
EXPECTED IMPACT QUESTIONS PUT TO CLIENTS WHO REACHED AN ACHIEVEMENT IN ANNEX 6

22 | Enterprise Europe Network 2015-16 Final Activity Report
22
Figure 3: Achievements Expected Impact EU 28
Figure 4: Partnership Agreements - Expected Impact EU 28

23 | Enterprise Europe Network 2015-16 Final Activity Report
23
Figure 5: Advisory Services Outcomes - Expected Impact EU 28
3.6. Scope of Network innovation support under H2020
Lack of innovation management capacity can be a significant barrier to creating economic impact
(competitiveness, growth and jobs) from innovation activities among SMEs. Consulting services in
enhancing innovation management capacity are not available to SMEs in many European regions due to
the absence of these services on the local market, unaffordable market prices or poor quality. Helping to
address this need are -instrument mentoring and coaching services and the Network's
(EIMC) services.
An EIMC service package is expected to have an average duration of 7 to 10 days. It includes an innovation
management capacity assessment, a gap analysis and the provision of at least five days of targeted services
to address recognised gaps. The assessment could be based on the IMP³rove methodology or
methodologies that comply with the definition of innovation management and the elements of an
innovation management system as in CEN technical specification CEN/TS 16555-1.
Beneficiaries of the Horizon 2020 SME Instrument receive a service offered by Key Account Managers
'KAM service package' with an average duration of seven days, covering phase 1 or phase 2 of the SME
Instrument. This service package is used to identify gaps, find suitable coaches and support their work. It
addresses recognised barriers to growth on the basis of a joint Within the seven-
day service package, SMEs benefitting from Horizon 2020 project should, where appropriate, be assisted in
managing their EU project with the EU.
Beneficiaries who complete Phase 1 of the SME Instrument but unsuccessfully apply for Phase 2 and receive
a 'Seal of Excellence' are supported in finding alternative source of funding. The alternative funding will
serve to implement the proposed project and to further develop its innovation strategy and innovation
management. These services are then provided in synergy with the Network's existing services under
COSME.

24 | Enterprise Europe Network 2015-16 Final Activity Report
24
3.6.1. H2020 activities
Following a pilot phase in the second half of 2014, Network partners started offering Key Account
Management (KAM) and Enhancing Innovation Management Capacities (EIMC) services in January 2015.
This included the follow-up of services initiated but not completed in 2014, illustrating the "continuous-
operation" mode of Enterprise Europe Network partners in innovation-related activities, just as in COSME
activities.
In the first two years of implementation of these service packages aiming to enhance the innovation
management capacity of SMEs, the Network provided service packages to 3,152 SMEs per year, 79% of its
2015-2016 target set in the 2014-2015 H2020 Work Programme (WP).
In 2015-16, the Network's innovation experts acting as Key Account Managers (KAM) carried out the needs
assessment26 for 2,300 SME Instrument projects27 - 1,827 Phase I and 473 and Phase II projects submitted
to cut-off dates from 2014 to 2016.
Additionally, the Network's KAMs continued to support all SME Instrument beneficiaries whose project had
been submitted in 2014 and had not yet been concluded.
The increase in the pace of KAM support is best shown by the increased in the number of Coaching Reports
submitted (i.e. number of projects concluded) from 392 in 2015 to 970 in 2016.
Network EIMC experts provided 3,024 service packages and started to provide an additional 981 which
will be completed in 2017-2018.
Network consortia had to remain quite flexible in the implementation of their activities, as the number of
SME Instrument beneficiaries in some regions varied significantly from what had been expected. These
variations required reallocations of resources foreseen for KAM services to EIMC services or vice-versa. This
proved challenging in some cases as the high level of expertise required for KAM and EIMC experts meant
that appropriate staff were not immediately available.
Identifying and recruiting SMEs interested in EIMC services also proved unexpectedly challenging in some
regions. In other regions, the high success rate of SME Instrument beneficiaries, led to a more limited
budget available for EIMC services, as Network partners gave priority to KAM services. Potential clients could
sometimes not be served by the end of the reporting period or were assisted through advisory services
provided under the COSME part of Network services.
Overall, these challenges resulted in a lower number of service packages delivered or completed by the end
of the period than initially planned. This lower level of activity was matched by a lower use of resources.
However, because the overall target set in the consortia's work programmes was higher than H2020 Work
Programme 2014-2015 target, the Network still reached 79% of the H2020 target while only consuming
59% of the budget.
In BCC countries, KAMs in Norway started to provide support to SME Instrument beneficiaries in January
2015 under an H2020 grant agreement. In Israel, KAMs also started to support Israeli SME Instrument
beneficiaries, albeit without a contract. Finally, in Switzerland and Tunisia, preparations to provide KAM and
EIMC services got underway in 2016 as both countries were set to become associated to H2020. They will
start to provide services as of 1st January 2017.
26 FIRST STEP IN THE SUPPORT GIVEN TO AN SME INSTRUMENT BENEFICIARY BEFORE THE ASSIGNMENT OF A COACH WHO WILL HELP
HIM/HER IN IMPLEMENTING ITS PROJECTS 27 DATA FROM COACHCOM2020, REFERRED TO AS 'CASETRACKER'. THE CASETRACKER IS AN ONLINE IT TOOL IN WHICH EACH STEP OF
THE SUPPORT PROVIDED TO SME INSTRUMENT BENEFICIARIES IS RECORDED. THIS INCLUDES THE ASSIGNMENT OF THE RIGHT KAM UP
TO THE CLOSING OF THE PROJECT AND THE ASSESSMENT OF THE QUALITY OF SERVICE RECEIVED FROM THE KAM BY THE COACH, AND
FROM THE SME INSTRUMENT BENEFICIARY BY THE COACH AND THE KAM
25 | Enterprise Europe Network 2015-16 Final Activity Report
25
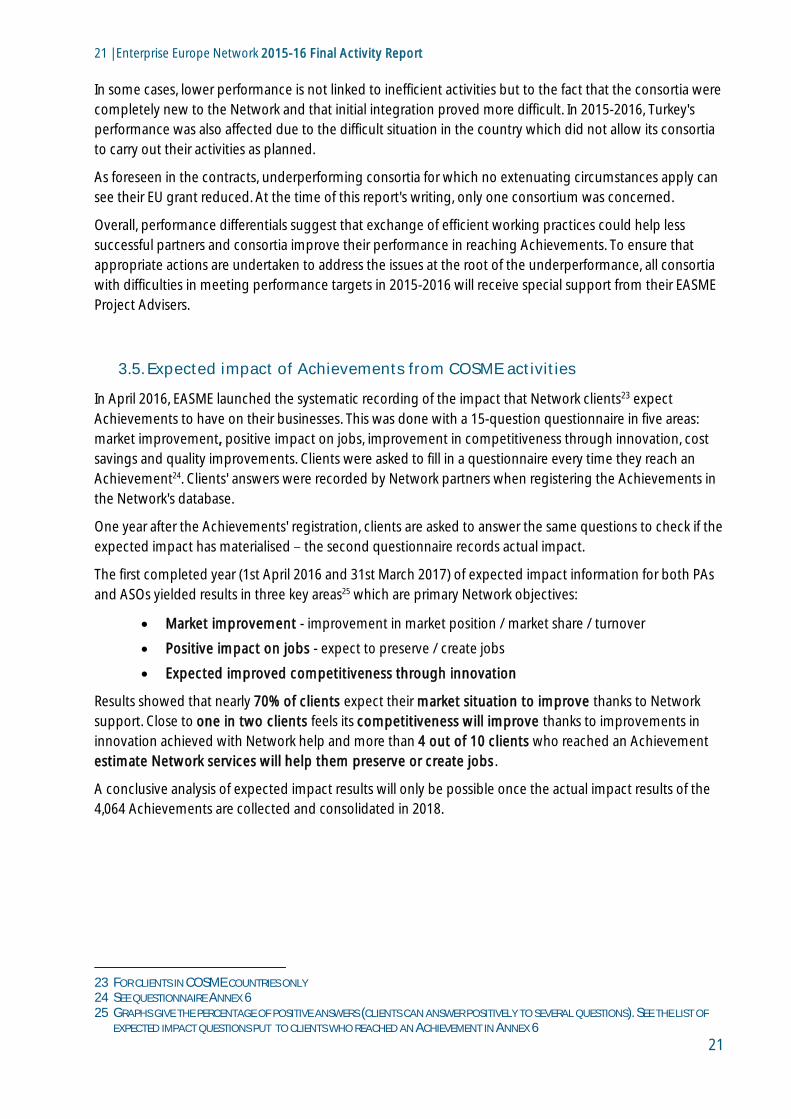
3.6.2. Efficiency of KAM services
According to information provided by KAMs, SMEs and coaches in the Case Tracker, the efficiency of
Network support to SME Instrument beneficiaries steadily increased over the period.
Figure 6: Efficiency of Key Account Management services
No similar data is available for EIMC services which are not followed through a central IT tool. However, as
Network partners achieved their results using only 53% of their assigned H2020 budget, the resource
efficiency of KAM and EIMC services can be considered excellent.
3.6.3. Performance
Network staff KAMs performed well over the two years, responding to almost 100% of SME Instrument
"cases" or beneficiaries requiring a KAM service.
According to the Case Tracker, 352 SME Instrument beneficiaries declined coaching, especially in the early
stages of the SME instrument implementation. A number of factors explain this:
The gradual development of the Case Tracker: as services started before the tool was fully
operational, a number of accepted coach assignments could not be recorded.
Initial rejections due to a low interest of SME Instrument beneficiaries for coaching stemmed in
part from a lack of awareness of its potential benefits. Clearer communication by EASME on
those benefits lead to fewer coaching rejections.
The issue posed by an insufficient number of quality coaches in the coach database was
gradually solved through a database quality check by EASME rejecting inadequately qualified
coaches and enabling KAMs to identify coaches faster. EASME also published calls for
expressions of interest to become a coach and adopted the strategy to sign grant agreements
with SME-I beneficiaries only once the coaches had been selected.
In most cases, therefore, rejections reflected a choice made by the beneficiary rather than an
underperformance of Network staff members acting as KAMs.
26 | Enterprise Europe Network 2015-16 Final Activity Report
26
Overall, Network performance in KAM and EIMC service provision was satisfactory: Network experts, while
establishing the services, managed to provide service packages to 79% of the target number of 4,000 SMEs
while only consuming 59% of the planned budget.
The lower budget consumption is due to a number of factors, chiefly:
most SME Instrument beneficiaries only implemented Phase I of the SME-Instrument and did
not require a seven-day service package (which covers Phase I and Phase II)
a slower start of EIMC services did not allow the completion of all initiated service packages by
the end of the period
Service packages sometimes did not require a full seven days to complete
There was a notable increase in budget consumption in most cases from 2015 to 2016. In parallel with
acceleration in the pace of activities and the Network's overall performance expressed in the number of
clients served overall in KAM and EIMC services. These numbers should be higher in 2017-2018 as
innovation support services will be in full swing. The average actual cost per completed service package
was on average, in line with expectations.
3.6.4. First Expected Impact results
As the provision of KAM and EIMC services only started recently, measuring their impact is not yet possible
across the Network. More information on impact should be available in the next reporting exercise thanks
to Network partners' follow-up on clients who received KAM or EIMC services in 2015-2016.

27 | Enterprise Europe Network 2015-16 Final Activity Report
27
4. Client satisfaction Along with measurable impact on clients, client satisfaction is a constant objective of Network partners, as it
also provides crucial feedback on the perceived relevance of services for clients.
4.1. COSME client satisfaction survey: a new approach
Clients who had received Network services in 2015-2016 were asked to assess their level of satisfaction in six
areas:
1) Events
2) Partnering services
3) Specialised advisory services
4) General information services
5) Services provided with a subscription
6) Publications
The survey followed a new approach: clients answered directly after receiving a link to the survey from their
local partner: 2,113 clients from 34 out of 36 EU or COSME countries took part in it28.
Overall results show that 86% of respondents were satisfied or very satisfied with Network services, while
93% would recommend its services to others.
Figure 7: Percentages of overall satisfaction
28 SEE MORE DETAILS IN ANNEX 2

28 | Enterprise Europe Network 2015-16 Final Activity Report
28
Figure 8: Percentage of clients who would recommend Network services
4.2. H2020 client satisfaction
The satisfaction of SME Instrument beneficiaries and coaches who received services from the Network's Key
Account Managers (KAM) can be assessed through the answers of both groups to 4 questions (Q3, Q4, Q6
and Q7). These are directly linked to the work of KAMs provided in the Case Tracker after the completion of
the KAM service package and of the coaching service. Q3, Q4 and Q6 are answered by SME Instrument
beneficiaries, Q7 by coaches.
(Q3) To SME: The KAM helped us to identify relevant business needs
(Q4) To SME: The needs analysis performed together with the KAM led our company to take
internal actions
(Q6) To SME: I was well informed about coaches to be able to choose the appropriate one
(Q7) To Coach: The KAM prepared constructively my interaction with the SME beneficiary
Figure 9: Client and coaches satisfaction for KAM services

29 | Enterprise Europe Network 2015-16 Final Activity Report
29
Overall satisfaction of clients and coaches with the KAMs' services remained high during the whole period,
with over 85% satisfaction rates, except for Question 4. However, although Q4 addresses the work of KAMs,
it should be noted that the primary objective of the needs' analysis is not to lead the company to take
internal actions but to identify the right coach. Results for 2015 for Q3, Q6 and Q7 might be slightly skewed
by the fact that year's data-set is only half that of 2016.
In terms of client satisfaction, examples of what beneficiaries appreciated included:
We learned a lot about our approach to potential customers, our business plan and its strengths and
weaknesses that we need to address."
"[The coach] has helped me to identify not only the current challenges and ways to tackle them, but also
the effective method to anticipate, recognise, and avoid the most common obstacles in our business
development.
EIMC clients also provided positive feedback:
"Overall very satisfied particularly in terms of identifying new ideas to sup
most appreciated: the audit and the targeted advice provided".
"Each collaborator is now more involved in the company's innovation process. This is a benefit for our
management. Projects are now prioritised in terms of objectives as well as in terms of resources which need
to be allocated".
30 | Enterprise Europe Network 2015-16 Final Activity Report
30
5. Network Governance In 2015, changes were enacted in the Network's governance to improve efficiency and better support
Network activities and results. These changes were built on work started in the previous financing period
(CIP).
5.1. The 'New SAG'
The Network's Steering and Advisory Group (SAG) is a forum that ensures dialogue, participation and
transparency between the Enterprise Europe Network Partners, the Directorate-General for Internal Market,
Industry, Entrepreneurship and SMEs (DG GROW) and the Executive Agency for SMEs (EASME).
The SAG helps establish a continuous and interactive process between these three parties, identifying
actions to be undertaken before, during and after SAG meetings, as well as during the Annual Conference. It
is chaired by DG GROW, with the support of EASME.
The SAG offers the opportunity for the European Commission to provide guidance and listen
to Network representatives, and for Network representatives to raise issues of interest to Network partners.
In 2015-2016, the SAG evolved to increase the efficiency and impact of its contribution to
the Network, both as regards its current activities and, in a more strategic way, as regards to its future.
5.1.1. SAG meetings
Exceptionally, instead of three SAG meetings per year, two meetings took place in 2015 (April, September),
and four in 2016 (January, April, June, October). The November 2015 meeting had to be postponed to
January 2016 due to a raised security alert level in Belgium.
5.1.2. SAG bureau
A SAG Bureau (the Bureau) was officially created in April 2015. Its role is to:
Set the agenda for future SAG meetings together with other SAG representatives,
Ensure the follow-up of the tasks decided at the SAG,
Alert the EC / EASME to important Network-related issues between SAG meetings.
Seven members were appointed in April 2015 via online vote. At the last SAG meeting of 2016, an online
vote took place again to elect seven new Bureau members as the mandate of the first elected SAG Bureau
members came to an end. The SAG bureau was renewed with the election of 40% new members for an 18-
month period starting from November 2016.
31 | Enterprise Europe Network 2015-16 Final Activity Report
31
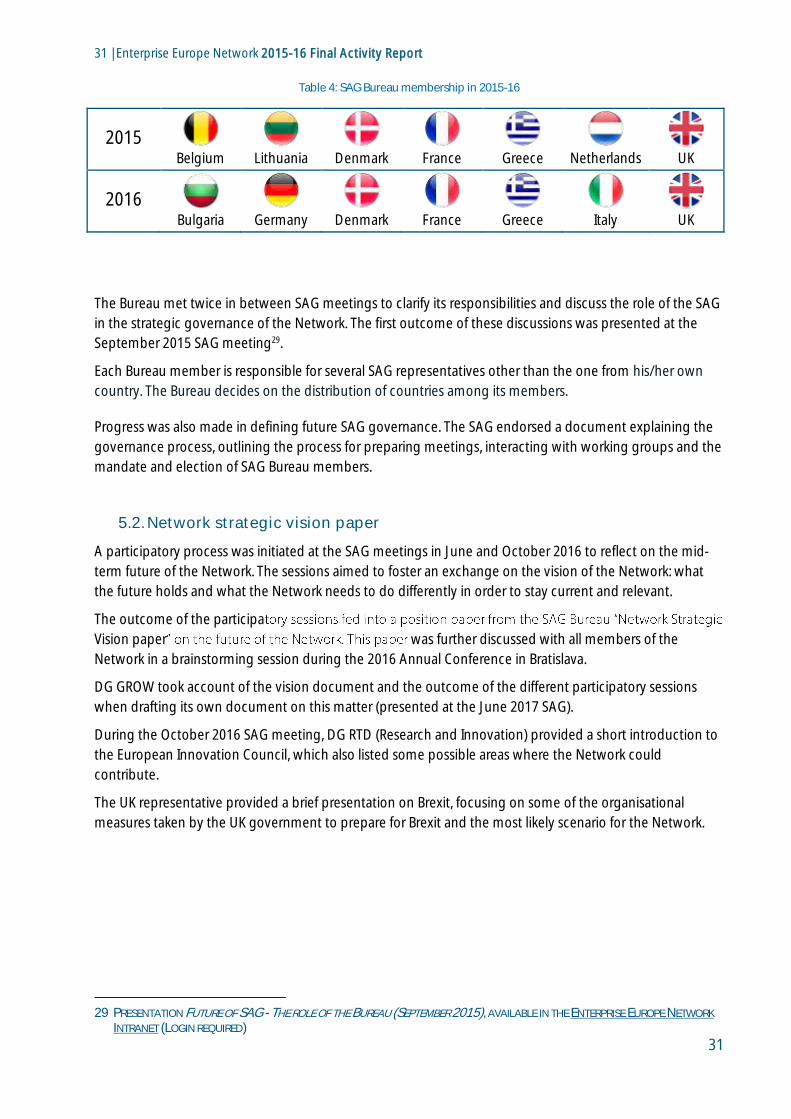
Table 4: SAG Bureau membership in 2015-16
2015 Belgium
Lithuania
Denmark
France
Greece
Netherlands
UK
2016 Bulgaria
Germany
Denmark
France
Greece
Italy
UK
The Bureau met twice in between SAG meetings to clarify its responsibilities and discuss the role of the SAG
in the strategic governance of the Network. The first outcome of these discussions was presented at the
September 2015 SAG meeting29.
Each Bureau member is responsible for several SAG representatives other than the one from his/her own
country. The Bureau decides on the distribution of countries among its members.
Progress was also made in defining future SAG governance. The SAG endorsed a document explaining the
governance process, outlining the process for preparing meetings, interacting with working groups and the
mandate and election of SAG Bureau members.
5.2. Network strategic vision paper
A participatory process was initiated at the SAG meetings in June and October 2016 to reflect on the mid-
term future of the Network. The sessions aimed to foster an exchange on the vision of the Network: what
the future holds and what the Network needs to do differently in order to stay current and relevant.
The outcome of the participa
Vision paper was further discussed with all members of the
Network in a brainstorming session during the 2016 Annual Conference in Bratislava.
DG GROW took account of the vision document and the outcome of the different participatory sessions
when drafting its own document on this matter (presented at the June 2017 SAG).
During the October 2016 SAG meeting, DG RTD (Research and Innovation) provided a short introduction to
the European Innovation Council, which also listed some possible areas where the Network could
contribute.
The UK representative provided a brief presentation on Brexit, focusing on some of the organisational
measures taken by the UK government to prepare for Brexit and the most likely scenario for the Network.
29 PRESENTATION FUTURE OF SAG - THE ROLE OF THE BUREAU (SEPTEMBER 2015), AVAILABLE IN THE ENTERPRISE EUROPE NETWORK
INTRANET (LOGIN REQUIRED)
32 | Enterprise Europe Network 2015-16 Final Activity Report
32
5.3. 'Sector Groups 2.0'
The Network under COSME has 17 Sector Groups (SG), which unite Network experts in strategically and
economically important sectors to enhance efficiency and collaboration between Network partners and
client SMEs. The aim is to foster transnational business cooperation, technology transfer, innovation
partnerships and research activities of SMEs both within and across their respective sectors of economic
activity.
Throughout 2015, a thorough review of the working methods and composition of Sector Groups took
place. SG membership was completely reset in 2015, with renewed membership only available upon
(re)application. The process removed (formerly) inactive members from the groups, creating a more
efficient and responsive membership.
A new structure was also put in place to improve the management of Sector Groups. SG chairs, who
previously acted on a voluntary and unpaid basis, are now subject to a clear contractual relationship with
EASME, with a clear job description and a financial incentive to deliver results. EASME in turn has greater
leverage to monitoring the performance of Sector Groups which has had a direct impact on their efficiency
and the results.30
5.4. Working Groups
The good relations between EC/EASME highlighted by Network partners in the Inception Survey was put to
good use in 2015 and 2016: the Network's input was taken on board, for example, to clarify Achievement
Guidelines and processes (particularly ASOs), or to improve reporting templates and make them more user-
re relevant in drafting the consultations
for the Network's 2017-2018 work programmes. The group of Communication Champions was also
particularly active.
Additionally to this good collaboration, three Working Groups (WGs) were set up in 2015-2016.
WGs allow a limited number of highly qualified experts to work together on urgent issues of common
concern to the whole Network identified as such by the SAG. These experts are to come up with solutions
and/or tools for the benefit of the entire Network. They are:
Advanced Access to Finance services WG: in order to improve Network services in the area of
access to finance, a WG on Advanced Access to Finance services was agreed to by the SAG in
September 2015. It concluded its work in 2016. Its goal was to create common concepts,
methodologies and tools to support the daily activities of Network partners working on access
to finance. In particular, it focused on advanced services (e.g. SME readiness activities,
matchmaking SMEs-investors) and developed a strategy for efficient and mutually beneficial
relations with private investors (e.g. business angels, venture capitalists, etc.), by producing a
methodology to organise events to connect SMEs with funding stakeholders.
Network services for scale-up companies WG: Europe has many bright and promising SMEs
in the scale-up stage who need to understand and embrace the Single Market from the earliest
stages of their business plan. The Network lacks structural relationships with service providers of
scale-up support, such as incubators, business plan competitions, regional scale-up schemes,
and regional support for scale-ups often struggles with the international dimension.
30 A DETAILED REPORT ON SG ACTIVITIES WAS DONE: ONLY THE MAIN FINDINGS ARE SUMMED UP IN THIS REPORT
33 | Enterprise Europe Network 2015-16 Final Activity Report
33
A WG was thus set up to identify how the Network could best work with regional support
systems for scale-ups and provide the most adequate services to these ambitious and
opportunity-driven entrepreneurs.
The WG met twice in 2016 and produced a detailed guide on Network services for scale-up
companies. Its input was also used in the preparation of the terms of reference for the pilot
action set to start in mid-2017 in which Network partners will map the regional scale-up
support system and pilot services for scale-ups.
POD quality and review process improvement WG: The Partnership Opportunity Database
(POD) is a crucial Network partnering tool. In January 2016, the SAG decided to create a WG for
"POD quality and review process improvement" to tackle delays in quality checks and
publication of partnering profiles and to improve the experience of POD users, partners and
clients.
The following results had an immediate, concrete impact:
Simplification of the Profile drafting guidelines
Creation of a Thematic group on Partnering process and POD
Simplification of requirements to become external reviewer
Obligation for all consortia to appoint active external reviewers
Creation of an online quiz to let Network partners to test their POD knowledge
Recommendation accepted by EASME, to abandon the number of partnering profiles
published as contractual target.
5.5. Thematic Groups (TGs) and Thematic Contact Points (TCPs)
Thematic Groups (TGs), introduced in 2014, help to:
Better organise and structure existing expertise in the Network
Trigger information exchange on specific topics
Contribute to the improvement of Network processes
There are currently 14 TGs31 composed of Thematic Contact Points (TCPs), Network staff members
nominated to be the contact person for the topic in each consortium. TGs focus on topics such as access to
finance, single market, clusters, public procurement or taxation. The Single market and Taxation TGs will
probably merge in the near future, the latter becoming a subgroup of the former.
The TGs' were set up progressively throughout 2015-2016. Their activities include:
Sharing information and good practices
Training
Reflecting on Network working standards
Giving input to working groups and implementation their recommendations
Providing feedback on policy initiatives
Giving feedback or input to running EU projects
Coordinating support to clients applying for EU calls for proposals 31 SEE COMPLETE LIST OF THEMATIC GROUPS IN ANNEX 3
34 | Enterprise Europe Network 2015-16 Final Activity Report
34
Most TGs are first and foremost internally-oriented structures aiming to improve Network processes in
various horizontal areas. Some TGs, however, have activities closer to the client as they coordinate "back-
office" processes linked to client support services (e.g. coordinating support to clients applying for EU calls
for proposals). Finally, more externally-oriented TGs are also involved in the planning and organisation of
direct client-support activities and even help initiate Partnership Agreements: the TG Participation of SMEs
in EU research programmes has been a front runner in this regard, contributing to PAs by organising a
virtual match making event.
In 2015-16, TGs carried out or launched a number of concrete initiatives, such as the organisation of training
sessions (see Annex 3).
In order to provide guidance on the evolution of the TG concept, an executive group of TG representatives
("Execs") has been set up, moderated by EASME. It is composed of the chairs and executive members of all
TGs. Discussions are held in the Network forum and as a side event at the Annual Conference (the first
meeting took place in Bratislava in 2016).
5.6. Annual Conference 2016
The Enterprise Europe Network Annual Conference 2016 (EENAC2016) was held on 14-16 November in
Bratislava as part of the Slovak EU Presidency programme. The event, organised by the Ministry of Economy
of the Slovak Republic jointly with EASME and DG GROW, brought together delegates from 60 countries.
Conference outcomes included:
797 registered participants;
251 replies from Network partners to the online survey, with a response rate of 36%;
75% of the survey respondents considered the Annual Conference "worth their time";
Almost two thirds of the respondents declared having made more than 10 new contacts during
the event;
More than 400 delegates participated in the 970 formal business meetings organised at the
matchmaking activity;
The event registered more than 11,000 networking connections among participants.
In terms of press and media impact:
Media outreach activities were organised for the promotion of the Enterprise Europe Network
Awards nominees using nine success stories.
The estimated total audience reach is 448, 297 770 visitors for online publications (including
online media, online versions of the print media, radio or TV reports published online). The
reach of print publications sums up to 558,215 readers while radio broadcast reached 450,000
listeners. The stories were covered by national media (57% of reports collected) followed by
pan-European media (26% of reports) and regional media (17% of reports).
In terms of social media:
#EEN16 was used 249 times. This is an increase of 25% from 2015.
The top Tweet around the conference generated 8,346 impressions and a total of 323
engagements.

35 | Enterprise Europe Network 2015-16 Final Activity Report
35
The storify compiled after the event was viewed 636 times:
https://storify.com/EEN_EU/enterprise-europe-network
5.7. Specific support for KAM and EIMC experts
A specific support infrastructure was put in place in 2015-2016 for Network staff members approved to work
on advanced innovation support services as KAM or EIMC experts.32
A number of actions were taken to ensure that KAM and EIMC experts receive up-to-date information
crucial to their work, are trained in using the IT tools necessary to complete their tasks and can improve their
skills to enhance the level of service they provide to clients:
Q&A service in a dedicated KAM forum in the Network Intranet with nearly 300 topics
Continuous e-mail support from the EASME team in charge of organising and managing SME
Instrument coaching, Project Advisors,
Learning and training events addressed to KAM/EIMC staff such as:
o Seminar for senior innovation advisers (March 2015): Two-day seminar to present the
Case Tracker and methodology, understand EASME's aims and clarify the roles of all
parties involved. First big event for the Network's KAMs: 105 KAMs took part.
o 'Pump up the KAM' (June 2016): Two-day info day and working session for 85+ KAMs
and prospective KAMs, to exchange experiences, working methods and approaches,
help KAMs and coaches understand each other's roles.
o Centralised EIMC & KAM trainings: 4 trainings in 2015, each for 25 to 35 staff members,
focusing on how to carry out the 7-day service packages, use of tools, understanding of
innovation (management) support activities of the Network, etc.
In addition, the IMP3rove Academy, under contract with EASME, trained 580 Network staff members33 in
innovation management issues. IMP3rove trainings are small, focused, and in-depth often with fewer than
10 participants resulting in a strong learning effect.
5.8. Network coordinators
Coordinators have a hands-on role in the Network, acting as efficient links with the EASME and EC. To assist
them in their role, enhance their effectiveness and help them overcome some the specific challenges they
face - such as rotation of staff, staff motivation or integrating new recruits - a series of initiatives were
proposed by Network coordinators and EASME.
A dedicated buddy system for coordinators, proposed by coordinators meets the need for peer-
to-peer support among coordinators, especially for advice on strategic issues.
It is open to all coordinators, driven by a core group of enthusiastic 'inspirers' and participation is
voluntary. It is based on listening, support and sharing of good practices, not ready-made solutions.
A first "buddy system workshop" for coordinators "Inspirers Training" took place on 23-24 February
2016 at Zeche Zollverein, Essen, Germany; a second planned in January 2017.
32 THE CRITERIA FOR STAFF WORKING AS KAM / EIMC EXPERTS ARE DETAILED IN THE TERMS OF REFERENCE OF THE CONSULTATION TO
IN WHICH NETWORK CONSORTIA TOOK PART 33 TOTAL NUMBER OF PARTICIPANTS AT IMP3ROVE ACADEMY TRAININGS. STAFF MEMBERS COULD ATTEND SEVERAL TRAININGS

36 | Enterprise Europe Network 2015-16 Final Activity Report
36
Specific training sessions for coordinators were also organised by EASME, such as the
Coordinators' Days in June 2016, to which 63 participants from 63 Consortia in 32 countries took
part. Topics covered included: role of the coordinator; focus on the client; focus on quality; new in
reporting 2015-2016; how to be a better coordinator.
An ad-hoc Training on Financial & Technical Reporting was added in January 2017 at the
coordinators' request. It gathered 69 coordinators, financial officers and other Network staff from 23
countries.
A Management Summer School for coordinators on 29-31 August 2017, coordinated by EASME,
will cover topics such as advanced leadership skills, leading people and organisations and boosting
collaboration.
37 | Enterprise Europe Network 2015-16 Final Activity Report
37
6. Network communication In 2015-2016, important steps were taken to boost the Network's visibility towards clients and stakeholders,
through a comprehensive communication strategy, the rolling out of a revised visual identity and targeted
communication actions and a stronger emphasis on communication aspects in all Network activities, which
have already started to show results.
6.1. Communication strategy
The Network began its new programming period with a new communication strategy that laid out the
overall communication objectives for the Network with a medium-term outlook and time-specific goals. A
major achievement of the strategy was the agreement of core messages for the Network providing a basis
for coherent and consistent communication across the Network. Developed by the Communication
Champions, they have been translated into all EU languages. A key element of the strategy was
encouraging SMEs who have benefitted from the Network to tell their stories, as the most powerful way of
communicating its value. This concept underpinned the Network's presence at events, including a high
impact on site and on social media at the Web Summit 2016 in Lisbon.
6.2. A new visual identity
The new brand identity was launched in May 2016, providing a clearer and more coherent Network brand.
Network partners were given a deadline of 31 March 2017 to implement the brand digitally and end of 2017
to fully phase out all materials using the old Network branding. The re-branding exercise was also an
opportunity for Network partners to ensure that the Network messaging is fully present across all of the
Network's communication materials.
6.3. Digital outreach
The uptake of digital services provided by the Network exceeded COSME targets34 proving the appetite and
need for a stronger Network digital presence. The same trend is clearly visible for the central digital
presence of the Network managed by EASME.
A focus on meeting user needs with quality content, improved web architecture and design has led to an
increasingly strong and influential Network presence on web and social media.
By the end of 2016, the Enterprise Europe EU (@EEN_EU) Twitter account was reaching out to a community
of nearly 20,000 Twitter followers (compared to 7,630 in 2014) and 10,000 Facebook fans (compared to
3,500 in 2014). In 2016, views of social media posts on Twitter and Facebook increased fourfold to 4.5 million
(compared to 1,150,000 views in 2015), with a clear increase in engagement.
A social media campaign featuring people in the Network telling stories about their work supporting SMEs
took place in the summer of 2016. The campaign marked the beginning of the use of the hashtag
#EENCanHelp across the Network.
34 SEE 1.2. GOOD PROGRESS TOWARDS COSME AND H2020 TARGETS
38 | Enterprise Europe Network 2015-16 Final Activity Report
38
Video outreach via the Network's YouTube channel also increased from a yearly total of 18,057 views in
2014 to 22,851 in 2015 and 31,491 in 2016.
In 2016, the Enterprise Europe Network website attracted more than 4,280 visitors per day compared to
2,400 in 2015. For the Network intranet, in 2016 there was also a massive improvement in page views and
average session duration which proved that the quality of the content along with the refreshed look and
feel largely contributed to a better user experience. Subscriptions to the Network internal newsletter,
NetLife, rose from 350 at the end of 2014 to 900 in 2016.
6.4. Communication in Host Organisations
Support from host organisations is a key driver for better positioning and impact. In 2016, the Network
launched a Network-wide campaign celebrating the important role they play. Over the course of the year,
the campaign saw Network partners reaching out to their hosts, raising their visibility and encouraging
good cooperation. With the support of the Network's Communication Champions, EASME produced a
series of tools that were released month by month to help partners keep up the momentum. This included
a toolkit to produce an endorsement video from the CEO of the Host Organisation. The videos included
some memorable testimonials which were packaged into a video "Europe's Top Business Organisations are
Talking about the Network".
Peer support took the shape of a Best Practice guide and a LinkedIn Group with 236 members where
people share their experiences, tips and suggestions. The conversation continues in this group and
members are regularly sharing their successes and ideas.
6.5. Open For Business Campaign
In 2015-16 the Network played a central role in designing, rolling out and refining the European
Commission's "Open For Business" campaign communicating the opportunities and benefits of the single
market for SMEs and directing them towards the Enterprise Europe Network for help and support. The
campaign was organised across radio, social media, printed ads in newspapers and magazines and billboard
posters.
Communication Champions from Spain, France, Greece, Cyprus and Italy advised on and implemented the
campaign in 2015. Feedback on their experiences was integrated into the 2016 campaign that was rolled
out in Ireland, Poland, Portugal, Hungary and Denmark. The local advice and particularly the post-campaign
feedback sessions provided by the Communication Champions were greatly appreciated by DG GROW
(who ran the campaign) and who have promoted this method within the Commission as a best practice in
communication.
39 | Enterprise Europe Network 2015-16 Final Activity Report
39
7. Learning & development To deliver more impact on client businesses through higher quality services and a better structured, more
efficient Network, EASME and Network partners teamed up in 2015-2016 to revise and implement a new
learning and development framework for Network staff. In areas such as POD database profile quality or
IMP3rove, a positive impact on activities is already evident.
7.1. A new learning and development strategy
A new learning and development strategy35 was drafted for the Network. This document took into
account the results of a survey on training needs addressed to Network partners. The main principles of the
strategy are for:
Learning activities to be based on identified needs following training needs analysis;
Learning to be fully integrated in the networking process (learning is everywhere in the
Network);
Learning will take account of the overall Network objectives and activities;
Learning activities to be delivered on a value-for-money basis;
The use of shared resources will be maximised human, financial, software and physical
resources;
Best practice to be applied to evaluation. A selective, focused and practical approach will be
taken in assessing the impact of learning;
Learning to be focused on the development of the necessary competencies to enable
individuals to perform to the best of their ability.
7.2. Learning and development activities
The Network's diverse training offer in 2015-2016 put the learning and development strategy
into practice with flexibility. A number of training sessions were managed by EASME
(centralised) and others by Network partners (decentralised) or by third parties such as the IMP3rove
Academy.
7.2.1. Activities in 2015
19 centralised training sessions were organised, on operational topics: POD (internal/ external
reviewers), IT (former 'Merlin Champions'), Innovation support, Communication (via
Communication Champions' meetings). The focus was set on "train the trainer" approach to
enable more partners to benefit from local training sessions.
The capacity of the 'newcomer' sessions was increased to 4 sessions a year, addressing the
Network structure & organisation, the role of the EC, the code of conduct, Network
management tools, the partnership process and communication. In total, more than 150
participants benefitted from the newcomers sessions.
35 SEE ANNEX 11 FOR THE IMPLEMENTATION CYCLE OF THE LEARNING AND DEVELOPMENT STRATEGY

40 | Enterprise Europe Network 2015-16 Final Activity Report
40
15 decentralised training sessions took place in 10 countries: Newcomers (Timisoara),
Internationalisation: Japan (Thessaloniki), China (Athens), Innovation (Copenhagen), IMPR3ove
(Budapest), KAM (Copenhagen, Amsterdam, Rome, Vienna, Barcelona and Mülheim-an-der-
Ruhr), Competitiveness (Szczecin), Public procurement (Munich), IPR (Vienna), etc.
A few local training sessions took also place targeting national organisations on very specific
topics (IMP3rove, POD, etc.).
The eligibility rules for training activities were clarified and published on the intranet.
Staff Exchanges were also boosted: the dedicated database was refreshed with 575
organisations and 338 active updated profiles.
7.2.2. Activities in 2016
19 centralised training sessions (408 people) were organised, on operational topics: POD
(internal/ external reviewers), IT (former 'Merlin Champions'), Innovation support,
Communication (via comm. champions' meetings). At both beginners and advanced level, in
order to meet all the different needs in the Network.
The capacity of newcomers' sessions remained at four sessions a year with a stable
programme compared to 2015 due to the high interest from the Network. In total, more than
140 participants benefitted from the newcomers sessions.
22 decentralised training sessions took place in 38 countries in addition to 14 training
sessions from IMP3rove Academy including Newcomers (Limoges), Innovation journey for
clients (Prague), Creating Impact on clients within the Network (Timisoara), Increasing
competitiveness of companies by design (Szczecin), POD: Training session for External
Reviewers (Glasgow), Training session for Network change makers (Torino).
35 webinars: organised by Network Partners of which 23 on Japan; seven on Technology
Transfer and about five on other topics including: Exporting Organic Food to China: New Food
Safety Law and Cross-border E-commerce Policies; General Aviation Sector in China: Status,
Challenges, Outlook and Useful Contacts; Exporting Dairy Products to China:; H2020 Eurostars:
Bringing SMEs to the next level; Using Free Trade Zones to Sell.
Staff Exchanges were also boosted: during the year there were 22 completed staff exchange
visits involving 35 countries and around 65 people.
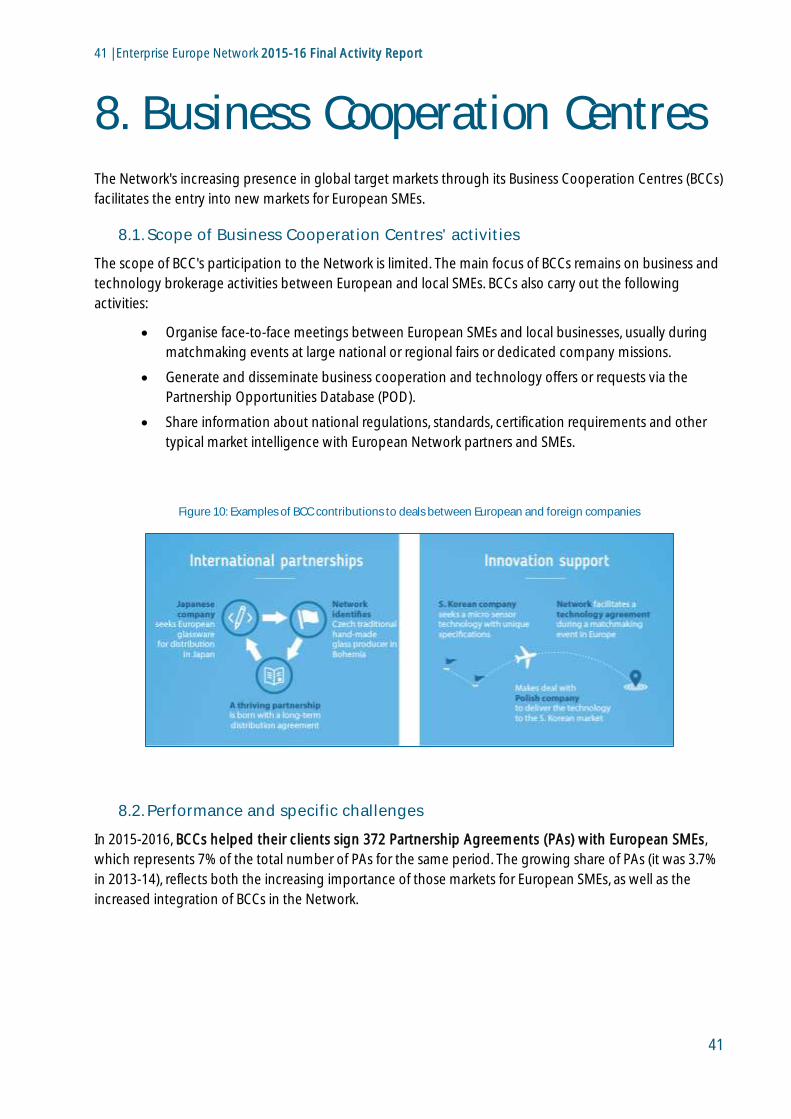
41 | Enterprise Europe Network 2015-16 Final Activity Report
41
8. Business Cooperation Centres The Network's increasing presence in global target markets through its Business Cooperation Centres (BCCs)
facilitates the entry into new markets for European SMEs.
8.1. Scope of Business Cooperation Centres' activities
The scope of BCC's participation to the Network is limited. The main focus of BCCs remains on business and
technology brokerage activities between European and local SMEs. BCCs also carry out the following
activities:
Organise face-to-face meetings between European SMEs and local businesses, usually during
matchmaking events at large national or regional fairs or dedicated company missions.
Generate and disseminate business cooperation and technology offers or requests via the
Partnership Opportunities Database (POD).
Share information about national regulations, standards, certification requirements and other
typical market intelligence with European Network partners and SMEs.
Figure 10: Examples of BCC contributions to deals between European and foreign companies
8.2. Performance and specific challenges
In 2015-2016, BCCs helped their clients sign 372 Partnership Agreements (PAs) with European SMEs,
which represents 7% of the total number of PAs for the same period. The growing share of PAs (it was 3.7%
in 2013-14), reflects both the increasing importance of those markets for European SMEs, as well as the
increased integration of BCCs in the Network.
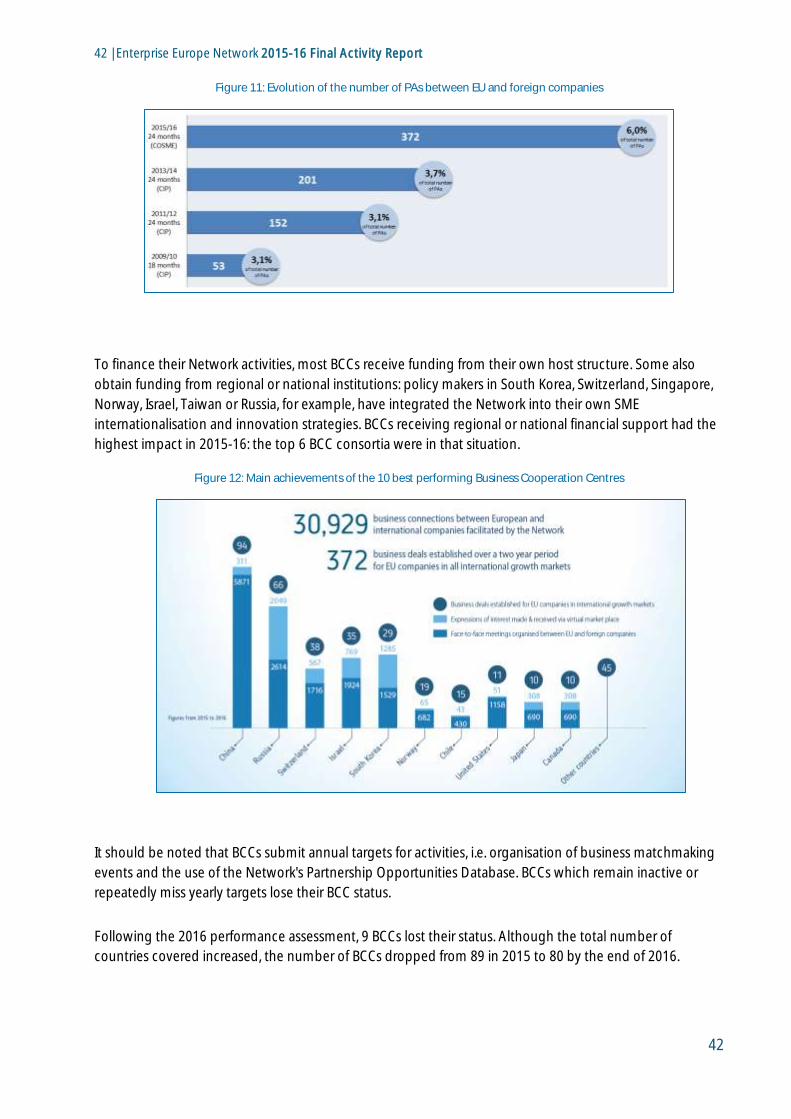
42 | Enterprise Europe Network 2015-16 Final Activity Report
42
Figure 11: Evolution of the number of PAs between EU and foreign companies
To finance their Network activities, most BCCs receive funding from their own host structure. Some also
obtain funding from regional or national institutions: policy makers in South Korea, Switzerland, Singapore,
Norway, Israel, Taiwan or Russia, for example, have integrated the Network into their own SME
internationalisation and innovation strategies. BCCs receiving regional or national financial support had the
highest impact in 2015-16: the top 6 BCC consortia were in that situation.
Figure 12: Main achievements of the 10 best performing Business Cooperation Centres
It should be noted that BCCs submit annual targets for activities, i.e. organisation of business matchmaking
events and the use of the Network's Partnership Opportunities Database. BCCs which remain inactive or
repeatedly miss yearly targets lose their BCC status.
Following the 2016 performance assessment, 9 BCCs lost their status. Although the total number of
countries covered increased, the number of BCCs dropped from 89 in 2015 to 80 by the end of 2016.

43 | Enterprise Europe Network 2015-16 Final Activity Report
43
9. Main operational challenges
and objectives Building on these good results, the Enterprise Europe Network now looks ahead. Its main operational
objectives are to continue improving the quality, the efficiency and the relevance of its services for
European SMEs.
A first key objective and challenge for the Network is to keep increasing the efficiency of services and
their performance, i.e. their ability to lead to Achievements which have a concrete, positive impact on
client businesses Advisory Services Outcomes (ASO) and Partnership Agreements (PA).
For Advisory services, the challenge is to provide clients with the services they need, simple or complex,
while continuing to improve their efficiency (# of ASO per client receiving advisory services) and
performance (# of ASOs by FTE). To achieve this, it should focus on: 1) optimising the service offering to
ensure that resources are used to support clients with the highest potential to derive concrete benefits from
the advice received; 2) continuing to improve the quality of the advice given; and 3) improving the follow-
up.
In Partnering services, a specific goal is turning the overall efficiency (three meetings per client) of
brokerage events (BE) and company missions (CM) into more PAs. The work done to improve the quality
and efficiency of profiles in the Partnering Opportunities Database (POD), which is already delivering results
(fewer profiles lead to more PAs) shows that the Network and EASME together can reach this goal. In line
with what was done for the POD, EASME removed the number of clients brought to BE and CM as specific
contractual target. This will allow Network partners to focus more on improving the efficiency of these
activities (# of meetings/client) and its impact (# PAs).
For advisory and partnering services, quality intake assessments the evaluation of clients' needs before
providing a service will play a crucial role. Further deepening synergies with local and regional
stakeholders will also be essential to save resources while ensuring clients get the best answers to their
questions. Finally, expected and actual impact information provided by clients who reach PAs or ASOs
might help identify the services or processes yielding the highest actual impact on clients, thus allowing
Network partners to re-allocate resources.
For the SME feedback activities, in cooperation with the European Commission, better informing SMEs on
the results of their involvement giving clients more 'feedback on their feedback' would help Network
partners convince more SMEs to provide their input by participating in open consultations and panels,
while contributing to make European legislation SME-friendlier.
A second key objective is to keep improving the Network's service-offering to maintain its relevance
and be able to respond to the evolving needs of SMEs and companies in general. Network partners will
need to invest the resources freed through efficiency gains to meet this challenge. Developing its services
to innovative SMEs will be a first line of action. This will involve further expanding the offer of EIMC services
notably by addressing more 'traditional' companies such as crafts companies while continuing to

44 | Enterprise Europe Network 2015-16 Final Activity Report
44
provide efficient KAM services. It will also mean that high-impact "phase 3" services36 need to be created, in
order to support clients in the commercialisation phase of their SME Instrument projects.
Improving existing services and developing new, high-quality and complex services will require investing
in training on new skills. In that context, a key new element to be developed during 2017 is an Enterprise
Europe Network eLearning platform, to deliver certain learning opportunities in a more effective way.
With the input of the Network, upgrading the Network's IT platform will support efforts to increase the
efficiency and impact of services, particularly partnering services.
Helping more clients to access financing adapted to their needs will also be crucial. Setting up services for
scale-up companies in collaboration with local stakeholders will be another key line of action.
Overall, however, the Network will need to continuously actively promote its diverse service offering to
its existing and potential clients. This includes listening to their needs, analysing its impact and adjusting
to ensure that it remains relevant. It also means investing time and effort in communication: ensuring a
consistent and coherent narrative across the Network supported by a uniform visual identity and
compelling stories of SME success with the Network's added value.
36 SEE PRESENTATION OF THE SME INSTRUMENT AVAILABLE ONLINE HERE.

45 | Enterprise Europe Network 2015-16 Final Activity Report
45
Annexes Annex 1: Success Stories published on the Network website in 2015-16
Story Country(ies) involved
Link to story
2016
Medins and Seastar Survey: Bridging over new waters to boost business growth
Sweden, UK Learn more...
Providing cutting-edge technology for neuroscience Poland, UK Learn more...
Life sciences SME wins EU funding for breakthrough medical testing
UK Learn more...
grids Spain Learn more...
Blue Abyss: Diving into the future UK Learn more...
malnutrition France Learn more...
Intale: A digital assistant for small shop owners Greece Learn more...
Training future astronauts with Swedish triathlon technology
Italy, Sweden Learn more...
BalBok: Hunting hazardous waste in Bulgaria Bulgaria Learn more...
2015
Plunging into new markets Iceland, Sweden Learn more...
Training tomorrow's top managers UK Czech Republic
Learn more...
Reaching new heights in wireless innovation France, Italy Learn more...
Silver linings in the business cloud Germany Greece, Poland
Learn more...
Here comes the sun UK, Netherlands Learn more...
Swimming in new waters France, Spain Learn more...
A real-life toy story Germany, Slovenia Learn more...
A clean-energy connection Spain, UK Learn more...
Changing the climate for business Greece, Italy Learn more...
Exporting clean technology Lithuania, Sweden Learn more...
Laying strong foundations for growth Germany, Poland Learn more...
Building an eco-friendly future Hungary Romania
Learn more...
Successful expansion for Swedish SME Bulgaria Sweden
Learn more...
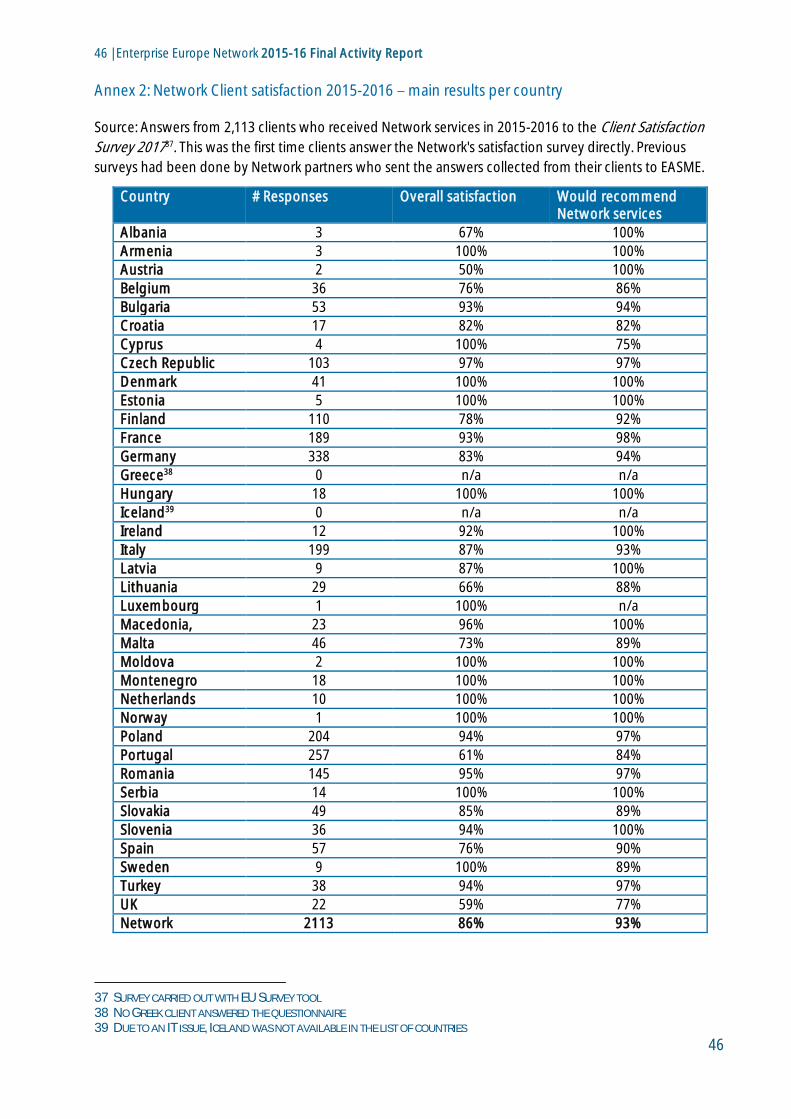
46 | Enterprise Europe Network 2015-16 Final Activity Report
46
Annex 2: Network Client satisfaction 2015-2016 main results per country
Source: Answers from 2,113 clients who received Network services in 2015-2016 to the Client Satisfaction
Survey 201737. This was the first time clients answer the Network's satisfaction survey directly. Previous
surveys had been done by Network partners who sent the answers collected from their clients to EASME.
Country # Responses Overall satisfaction Would recommend Network services
Albania 3 67% 100%
Armenia 3 100% 100%
Austria 2 50% 100%
Belgium 36 76% 86%
Bulgaria 53 93% 94%
Croatia 17 82% 82%
Cyprus 4 100% 75%
Czech Republic 103 97% 97%
Denmark 41 100% 100%
Estonia 5 100% 100%
Finland 110 78% 92%
France 189 93% 98%
Germany 338 83% 94%
Greece38 0 n/a n/a
Hungary 18 100% 100%
Iceland39 0 n/a n/a
Ireland 12 92% 100%
Italy 199 87% 93%
Latvia 9 87% 100%
Lithuania 29 66% 88%
Luxembourg 1 100% n/a
Macedonia, 23 96% 100%
Malta 46 73% 89%
Moldova 2 100% 100%
Montenegro 18 100% 100%
Netherlands 10 100% 100%
Norway 1 100% 100%
Poland 204 94% 97%
Portugal 257 61% 84%
Romania 145 95% 97%
Serbia 14 100% 100%
Slovakia 49 85% 89%
Slovenia 36 94% 100%
Spain 57 76% 90%
Sweden 9 100% 89%
Turkey 38 94% 97%
UK 22 59% 77%
Network 2113 86% 93%
37 SURVEY CARRIED OUT WITH EU SURVEY TOOL 38 NO GREEK CLIENT ANSWERED THE QUESTIONNAIRE 39 DUE TO AN IT ISSUE, ICELAND WAS NOT AVAILABLE IN THE LIST OF COUNTRIES
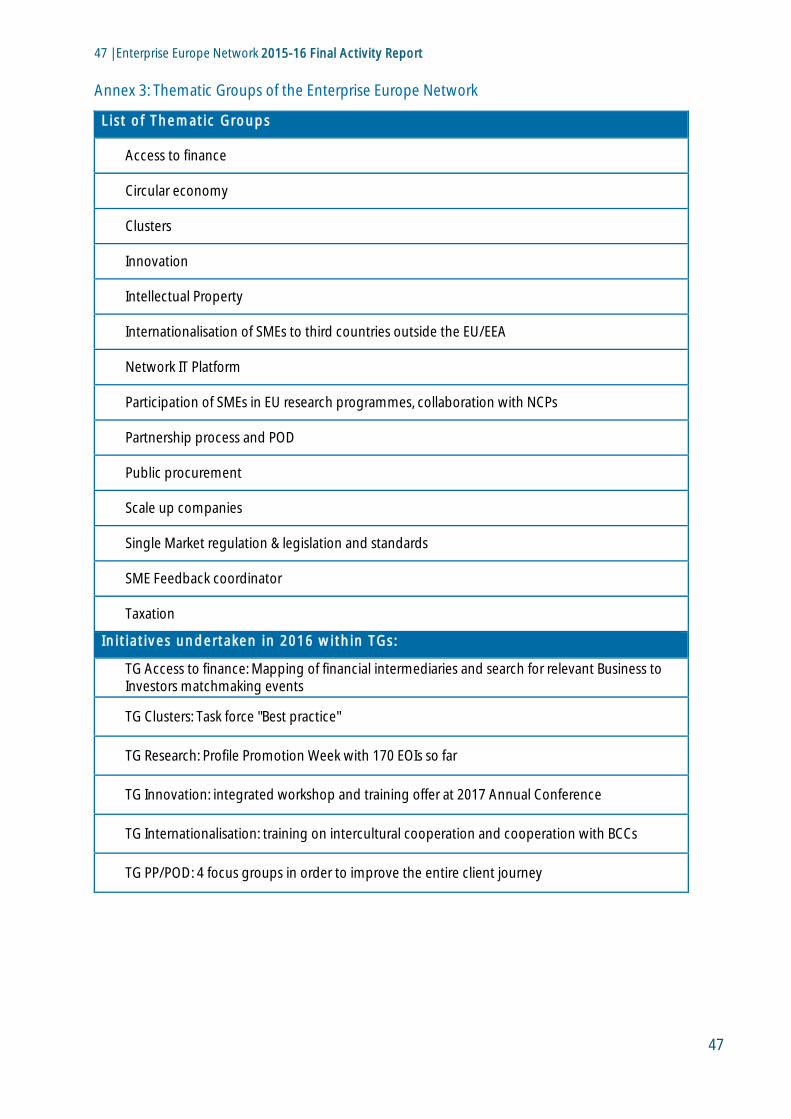
47 | Enterprise Europe Network 2015-16 Final Activity Report
47
Annex 3: Thematic Groups of the Enterprise Europe Network
List of Thematic Groups
Access to finance
Circular economy
Clusters
Innovation
Intellectual Property
Internationalisation of SMEs to third countries outside the EU/EEA
Network IT Platform
Participation of SMEs in EU research programmes, collaboration with NCPs
Partnership process and POD
Public procurement
Scale up companies
Single Market regulation & legislation and standards
SME Feedback coordinator
Taxation
In i t iat ives undertaken in 2016 within TGs :
TG Access to finance: Mapping of financial intermediaries and search for relevant Business to Investors matchmaking events
TG Clusters: Task force "Best practice"
TG Research: Profile Promotion Week with 170 EOIs so far
TG Innovation: integrated workshop and training offer at 2017 Annual Conference
TG Internationalisation: training on intercultural cooperation and cooperation with BCCs
TG PP/POD: 4 focus groups in order to improve the entire client journey
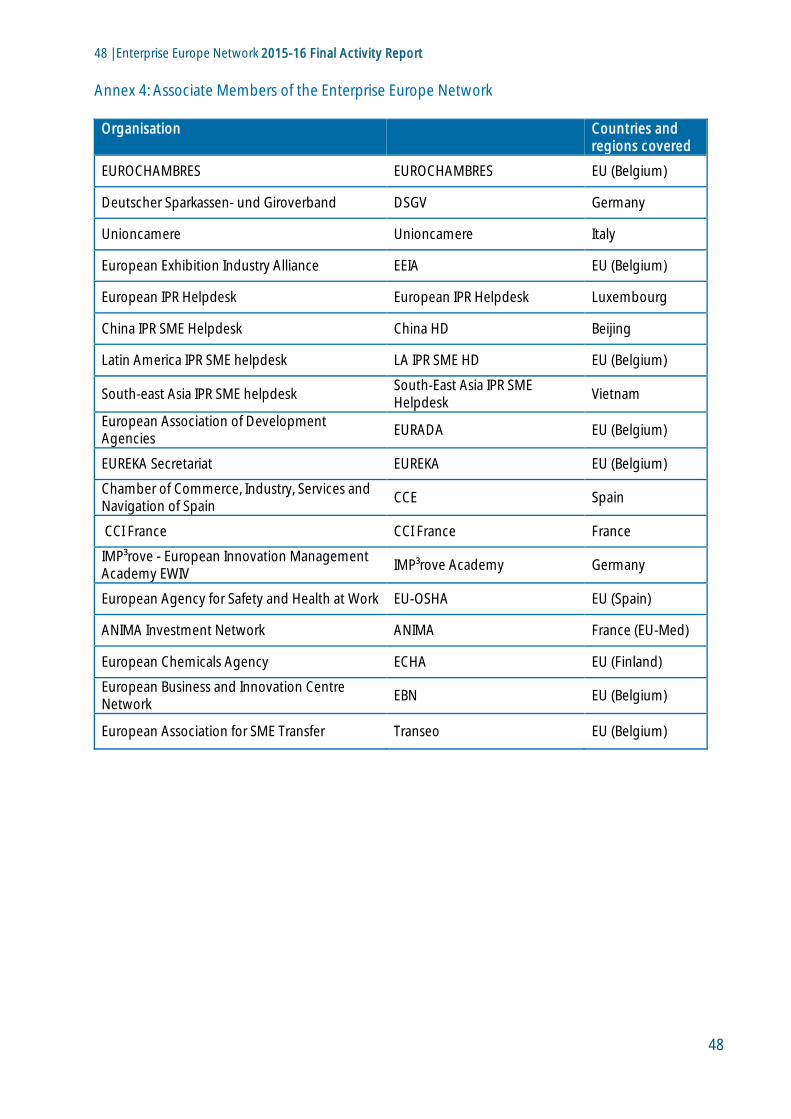
48 | Enterprise Europe Network 2015-16 Final Activity Report
48
Annex 4: Associate Members of the Enterprise Europe Network
Organisation Countries and regions covered
EUROCHAMBRES EUROCHAMBRES EU (Belgium)
Deutscher Sparkassen- und Giroverband DSGV Germany
Unioncamere Unioncamere Italy
European Exhibition Industry Alliance EEIA EU (Belgium)
European IPR Helpdesk European IPR Helpdesk Luxembourg
China IPR SME Helpdesk China HD Beijing
Latin America IPR SME helpdesk LA IPR SME HD EU (Belgium)
South-east Asia IPR SME helpdesk South-East Asia IPR SME Helpdesk
Vietnam
European Association of Development Agencies
EURADA EU (Belgium)
EUREKA Secretariat EUREKA EU (Belgium)
Chamber of Commerce, Industry, Services and Navigation of Spain
CCE Spain
CCI France CCI France France
IMP³rove - European Innovation Management Academy EWIV
IMP³rove Academy Germany
European Agency for Safety and Health at Work EU-OSHA EU (Spain)
ANIMA Investment Network ANIMA France (EU-Med)
European Chemicals Agency ECHA EU (Finland)
European Business and Innovation Centre Network
EBN EU (Belgium)
European Association for SME Transfer Transeo EU (Belgium)
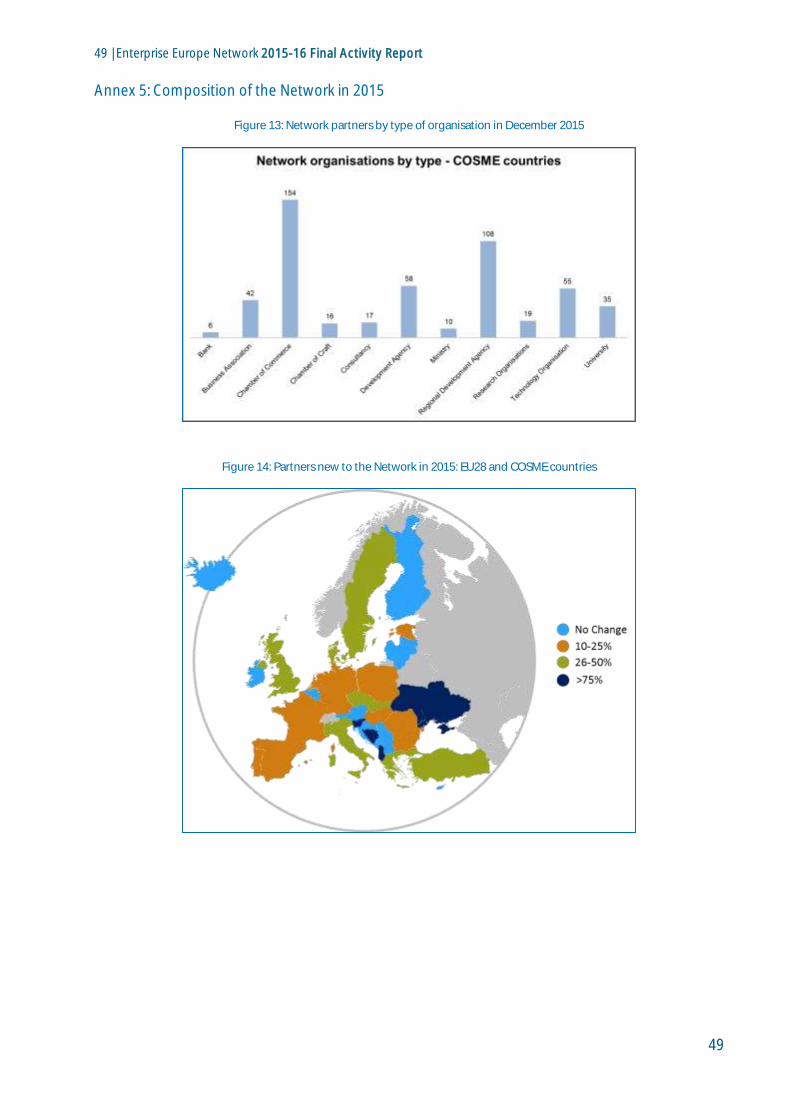
49 | Enterprise Europe Network 2015-16 Final Activity Report
49
Annex 5: Composition of the Network in 2015
Figure 13: Network partners by type of organisation in December 2015
Figure 14: Partners new to the Network in 2015: EU28 and COSME countries
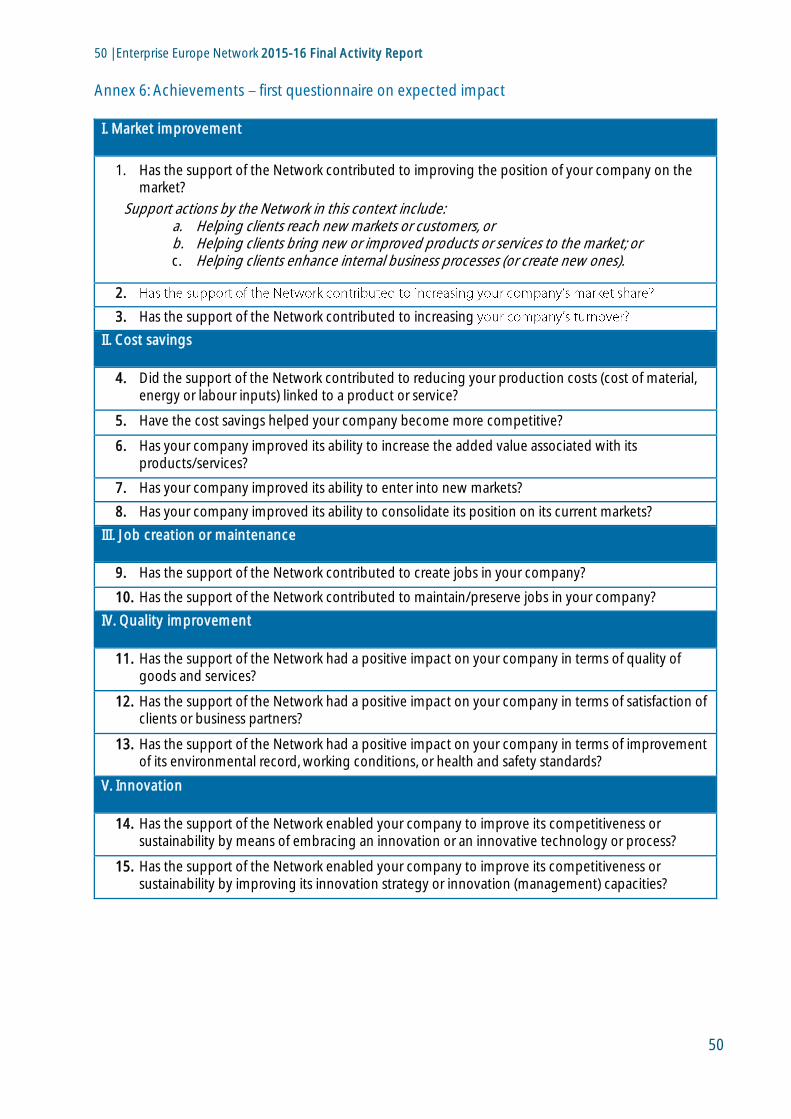
50 | Enterprise Europe Network 2015-16 Final Activity Report
50
Annex 6: Achievements first questionnaire on expected impact
I. Market improvement
1. Has the support of the Network contributed to improving the position of your company on the market?
Support actions by the Network in this context include: a. Helping clients reach new markets or customers, or b. Helping clients bring new or improved products or services to the market; or c. Helping clients enhance internal business processes (or create new ones).
2.
3. Has the support of the Network contributed to increasing
II. Cost savings
4. Did the support of the Network contributed to reducing your production costs (cost of material, energy or labour inputs) linked to a product or service?
5. Have the cost savings helped your company become more competitive?
6. Has your company improved its ability to increase the added value associated with its products/services?
7. Has your company improved its ability to enter into new markets?
8. Has your company improved its ability to consolidate its position on its current markets?
III. Job creation or maintenance
9. Has the support of the Network contributed to create jobs in your company?
10. Has the support of the Network contributed to maintain/preserve jobs in your company?
IV. Quality improvement
11. Has the support of the Network had a positive impact on your company in terms of quality of goods and services?
12. Has the support of the Network had a positive impact on your company in terms of satisfaction of clients or business partners?
13. Has the support of the Network had a positive impact on your company in terms of improvement of its environmental record, working conditions, or health and safety standards?
V. Innovation
14. Has the support of the Network enabled your company to improve its competitiveness or sustainability by means of embracing an innovation or an innovative technology or process?
15. Has the support of the Network enabled your company to improve its competitiveness or sustainability by improving its innovation strategy or innovation (management) capacities?

51 | Enterprise Europe Network 2015-16 Final Activity Report
51
Annex 7: PES Data Items: 2015-2016 targets and results (COSME countries)
Actuals Targets % achieved
Advice, support and
information activities
DI01 # Regional/local events
organised 8,527 7,313 117%
DI02 # Participants in
regional/local events 302,900 226,902 133%
DI03 # SMEs/clients receiving
advisory support 102,866 107,164 96%
Cross-border partnering
activities for business
cooperation, technology
transfer, innovation and
research
DI04 # Brokerage Events &
Company Missions organised 5,984 3,301 181%
DI05 # SMEs/clients in brokerage
events/company missions 45,963 30,524 151%
DI06 # Meetings at brokerage
events/company missions 156,421 87,803 178%
DI07 # Partnership profiles
produced 12,615 23,160 54%
DI08 # Expression of interests
received 40,984 38,069 108%
DI09 # Expression of interests
made 43,770 46,766 94%
SME feedback activities DI10 # Clients in feed-back
related actions 18,462 17,590 105%
Achievements DI12 # Achievements 8,418 9,352 90%
nDI12 - PA 5,101 5,075 101%
nDI12 - ASO 3,317 4,277 78%
Promotion of the
communication activities
DI13 # SMEs/clients using digital
services provided by the
Network
31,764,342 8,150,327 390%
Network building and
reinforcing the Network
DI14 # Cooperation with local
stakeholders 6,020 4,639 130%
DI15 # Answered enquiries from
Network partners 26,220 29,798 88%
DI16 # Active contributions to
Network activities 13,271 9,792 136%
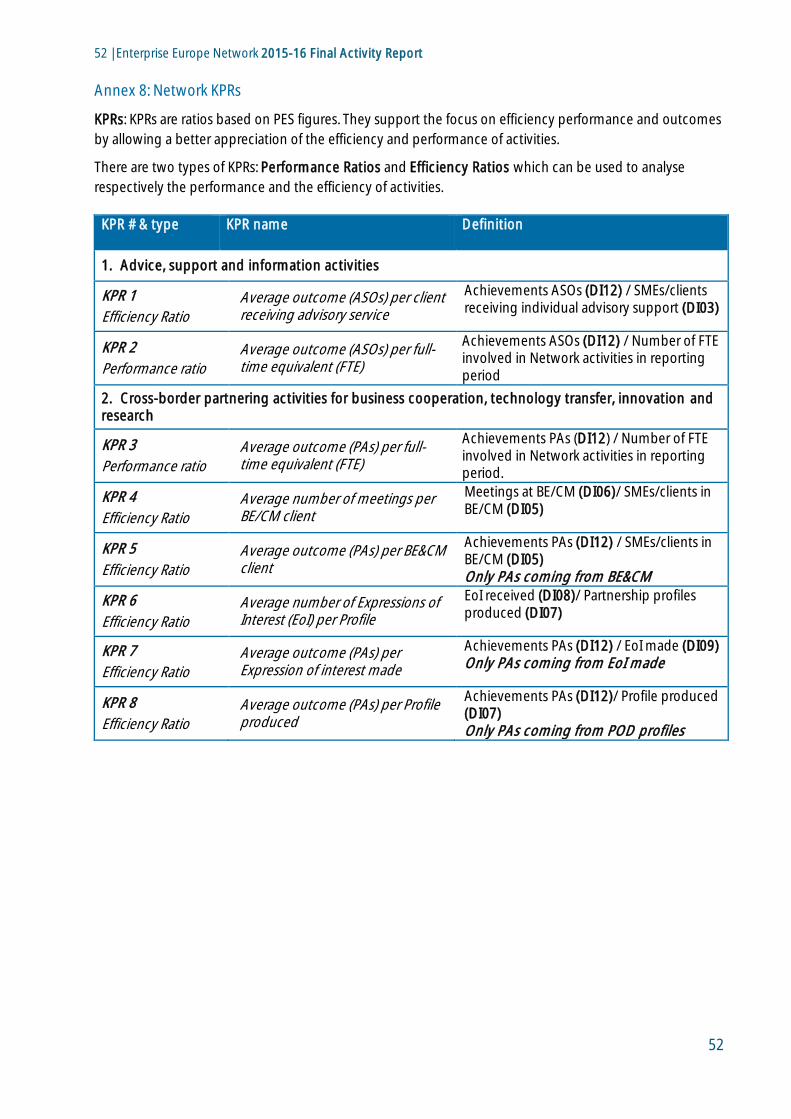
52 | Enterprise Europe Network 2015-16 Final Activity Report
52
Annex 8: Network KPRs
KPRs: KPRs are ratios based on PES figures. They support the focus on efficiency performance and outcomes
by allowing a better appreciation of the efficiency and performance of activities.
There are two types of KPRs: Performance Ratios and Efficiency Ratios which can be used to analyse
respectively the performance and the efficiency of activities.
KPR # & type KPR name Definition
1. Advice, support and information activities
KPR 1
Efficiency Ratio
Average outcome (ASOs) per client receiving advisory service
Achievements ASOs (DI12) / SMEs/clients receiving individual advisory support (DI03)
KPR 2
Performance ratio Average outcome (ASOs) per full-time equivalent (FTE)
Achievements ASOs (DI12) / Number of FTE involved in Network activities in reporting period
2. Cross-border partnering activities for business cooperation, technology transfer, innovation and research
KPR 3
Performance ratio
Average outcome (PAs) per full-time equivalent (FTE)
Achievements PAs (DI12) / Number of FTE involved in Network activities in reporting period.
KPR 4
Efficiency Ratio
Average number of meetings per BE/CM client
Meetings at BE/CM (DI06)/ SMEs/clients in BE/CM (DI05)
KPR 5
Efficiency Ratio
Average outcome (PAs) per BE&CM client
Achievements PAs (DI12) / SMEs/clients in BE/CM (DI05) Only PAs coming from BE&CM
KPR 6
Efficiency Ratio
Average number of Expressions of Interest (EoI) per Profile
EoI received (DI08)/ Partnership profiles produced (DI07)
KPR 7
Efficiency Ratio
Average outcome (PAs) per Expression of interest made
Achievements PAs (DI12) / EoI made (DI09) Only PAs coming from EoI made
KPR 8
Efficiency Ratio Average outcome (PAs) per Profile produced
Achievements PAs (DI12)/ Profile produced (DI07) Only PAs coming from POD profiles
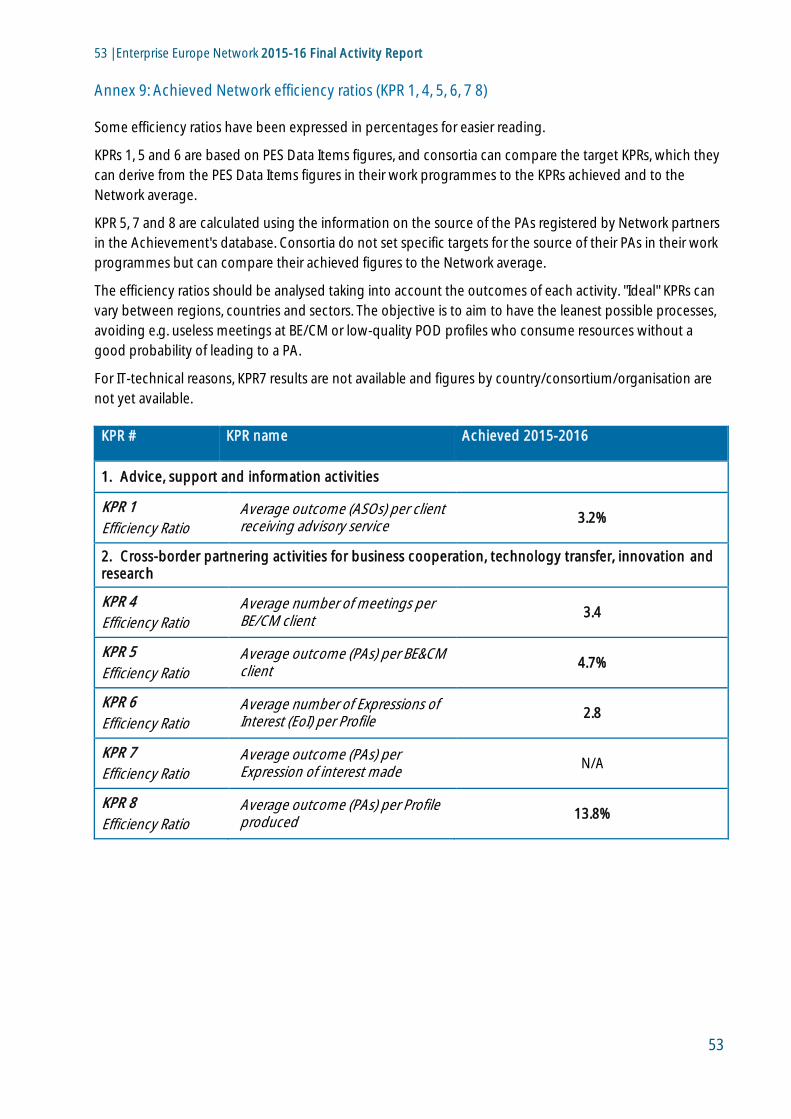
53 | Enterprise Europe Network 2015-16 Final Activity Report
53
Annex 9: Achieved Network efficiency ratios (KPR 1, 4, 5, 6, 7 8)
Some efficiency ratios have been expressed in percentages for easier reading.
KPRs 1, 5 and 6 are based on PES Data Items figures, and consortia can compare the target KPRs, which they
can derive from the PES Data Items figures in their work programmes to the KPRs achieved and to the
Network average.
KPR 5, 7 and 8 are calculated using the information on the source of the PAs registered by Network partners
in the Achievement's database. Consortia do not set specific targets for the source of their PAs in their work
programmes but can compare their achieved figures to the Network average.
The efficiency ratios should be analysed taking into account the outcomes of each activity. "Ideal" KPRs can
vary between regions, countries and sectors. The objective is to aim to have the leanest possible processes,
avoiding e.g. useless meetings at BE/CM or low-quality POD profiles who consume resources without a
good probability of leading to a PA.
For IT-technical reasons, KPR7 results are not available and figures by country/consortium/organisation are
not yet available.
KPR # KPR name Achieved 2015-2016
1. Advice, support and information activities
KPR 1
Efficiency Ratio
Average outcome (ASOs) per client receiving advisory service
3.2%
2. Cross-border partnering activities for business cooperation, technology transfer, innovation and research
KPR 4
Efficiency Ratio
Average number of meetings per BE/CM client
3.4
KPR 5
Efficiency Ratio
Average outcome (PAs) per BE&CM client
4.7%
KPR 6
Efficiency Ratio Average number of Expressions of Interest (EoI) per Profile
2.8
KPR 7
Efficiency Ratio Average outcome (PAs) per Expression of interest made
N/A
KPR 8
Efficiency Ratio Average outcome (PAs) per Profile produced
13.8%

54 | Enterprise Europe Network 2015-16 Final Activity Report
54
Annex 10: Achieved performance indicators by country (KPR 2 and KPR 3)
The actual number of FTE invested in Network activities is calculated using the target number of FTEs
planned in the work programme, multiplied by the percentage of budget actually used (most costs are
personnel costs).
C O UNT R Y P A AS O Achiev e
ments
K P R 2
P A/F T E
K P R 3
AS O /F T E
Achiev ements
/ F T E
Number of
actual F T E
Albania 1 0 1 0 0 0 8
Armenia 13 0 13 7 0 7 2
Aus tria 75 40 115 3 1 5 23
B elgium 117 50 167 6 2 9 19
B os nia and Herzegovina7 0 7 n/a n/a n/a n/a
B ulgaria 166 150 316 5 4 10 31
C roatia 61 20 81 5 2 6 14
C yprus 15 7 22 3 1 4 6
C zech R epublic 159 87 246 5 2 7 34
Denmark 146 12 158 15 1 17 10
E s tonia 26 26 52 5 4 9 6
F inland 37 38 75 4 4 8 10
F rance 323 372 695 3 3 7 95
Germany 528 643 1,171 4 3 8 145
Greece 184 78 262 5 3 8 35
Hungary 113 175 288 3 2 7 42
Iceland 17 4 21 6 3 7 3
Ireland 27 10 37 6 2 8 5
Italy 412 208 620 4 2 5 115
Latvia 61 20 81 5 2 7 12
Lithuania 73 15 88 5 0 6 15
Luxembourg 19 2 21 3 0 3 7
Macedonia, The former Yugos lav R epublic of27 13 40 3 1 4 9
Malta 22 16 38 6 1 10 4
Moldova 8 1 9 5 1 5 2
Montenegro 15 0 15 4 0 4 4
Netherlands 205 9 214 11 1 11 19
P oland 291 167 458 2 1 4 128
P ortugal 92 23 115 3 1 4 28
R omania 180 28 208 3 1 4 57
S erbia 63 3 66 7 1 7 9
S lovakia 56 16 72 5 1 7 10
S lovenia 110 27 137 9 2 11 13
S pain 555 316 871 5 3 8 105
S weden 128 134 262 5 3 10 26
Turkey 174 139 313 2 1 4 72
United K ingdom 595 468 1,063 5 3 9 113
Network 5,101 3,317 8,418 5 2 7 1,235
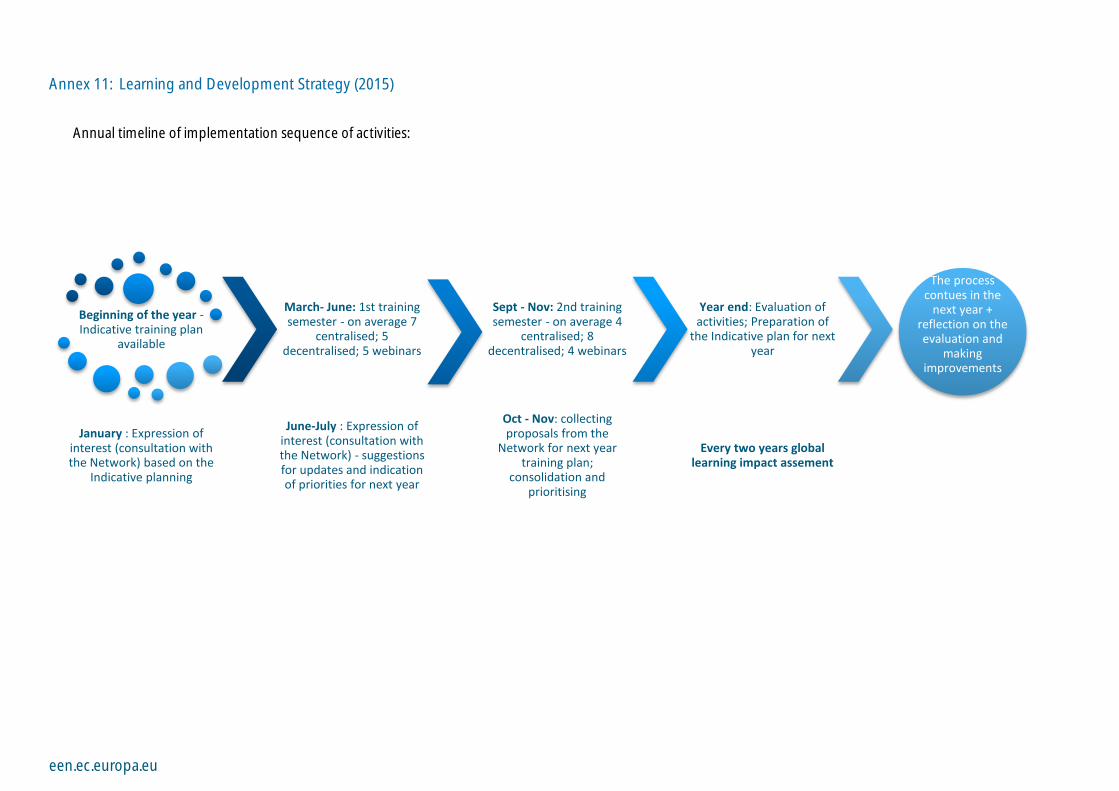
een.ec.europa.eu
Annex 11: Learning and Development Strategy (2015)
Annual timeline of implementation sequence of activities:
Beginning of the year - Indicative training plan
available
January : Expression of interest (consultation with the Network) based on the
Indicative planning
March- June: 1st training semester - on average 7
centralised; 5 decentralised; 5 webinars
June-July : Expression of interest (consultation with the Network) - suggestions for updates and indication of priorities for next year
Sept - Nov: 2nd training semester - on average 4
centralised; 8 decentralised; 4 webinars
Oct - Nov: collecting proposals from the
Network for next year training plan;
consolidation and prioritising
Year end: Evaluation of activities; Preparation of
the Indicative plan for next year
Every two years global learning impact assement
The process contues in the
next year + reflection on the evaluation and
making improvements