
Gearing up for growth Future perspectives on the global ...
69
Advanced Industries May 2016 Gearing up for growth Future perspectives on the global truck market
Transcript of Gearing up for growth Future perspectives on the global ...

Advanced Industries May 2016
Gearing up for growth Future perspectives on the global truck market

2Gearing up for growth – future perspectives on the global truck market
Contents
Introduction and key insightsPages 04 - 05
Overview of 10 trends shaping the global truck market until 2020Pages 07 - 11
Deep dives on key industry topics
ContactsPage 76
Gearing up for growth – future perspectives on the global truck market
III.ANew service and business models
Pages 37 - 49
IThe Chinese truck market
Pages 13 - 21
III.BOpportunities through tele matics
Pages 51 - 61
IIModular strategy
Pages 23 - 35
III.CAutonomous driving
Pages 63 - 75
2

3 Gearing up for growth – future perspectives on the global truck market
In the years since the Great Recession, the global truck industry has seen two major developments: profit pools have globally recovered from the crisis while at the same time the sizeable profit pools that once characterized the Western European markets have begun to spill over into the US and emerging markets. Also, as the key findings of and insights from our McKinsey Truck Initiative indicate, further growth and more rebalancing of the profit pools are very likely to come over the next four to five years – for 2020, the Truck Initiative predicts a global profit of EUR 11.8 billion, i.e., 40 percent growth over 2008.
In light of these imminent shifts and the resulting challenges ahead, this study aims at providing a fresh perspective on the future of the global truck market through 2020. With empirical support from new market research conducted in 2015, McKinsey both identified potentially game-changing market trends and highlights the most relevant topics for the truck industry in the years to come.
Following a detailed overview of the ten trends shaping the future of the global truck market until 2020, the chapters in the main part of this publication present “Deep dives on key industry topics” and provide answers primarily to the first of the following two overarching questions looming large in the industry: What are the biggest changes, chances, and challenges ahead, and how can the resulting potentials be captured?1
The first chapter here, “The Chinese truck market,” focuses on the challenges of price pressure, e.g., due to overcapacity and the expansion of emerging Chinese market players, while the next chapter, “Modular strategy,” elaborates on the many advantages of the use of common components across different platforms and brands. The last three chapters give an overview of and explore “New service and business models” – with a special focus on “Opportunities through telematics” and an outlook on the promises and risks of “Autonomous driving.”
This publication is intended to offer readers insights into crucial topics in tomorrow’s global truck market. Instead of providing extended text descriptions, the articles collected here focus on highlighting key facts and developments. We very much hope you will find our findings interesting and inspiring and we would be delighted to further discuss them with you.
Introduction
1 Answers to the second question will be provided for the most part in a forthcoming expanded and updated version of this report.

4Introduction and key insights
Our McKinsey Truck Initiative resulted in several insights with regard not only to the industry’s profit pools and their shifts but also to its core changes as well as trends and opportunities:
� Industry rebound. In 2013, the global truck industry collectively earned a profit pool of EUR 6.2 billion (~ 4.2 percent margin), just 26 percent short of the 2008 level.
� Profit and margin gains. The industry has the potential to reach a norm year profit of EUR 11.8 billion (~ 5.8 percent margin) by 2020.
� Geographic shifts. The industry recovered sharply after the 2009 crisis; however, profits are shifting from Western Europe to the US and emerging markets/Rest of World. In the long term, Western Europe will account for ~ 20 percent of global profits – compared to a precrisis share of ~ 55 percent.
� Regionalization shifts. Global players will gain in importance, increasing their profit pool share from 38 percent in 2008 to 42 percent in 2020.
� EE profit erosion. Main growth drivers of sales revenue are Eastern Europe, emerging markets, and the US; however, absolute profits in emerging markets will remain low due to increased competition from strengthened local players as well as localized international OEMs.
� Market barriers. Technological advantages of Western OEMs and emissions regulation will prevent emerging market players from entering Western markets in the short and medium term.
� Mid-market opportunity. Attractive profit pool segments in China and India are the technologically advancing mid-market segments. Participation in the “run to the middle” is thus a prerequisite to secure an option for participating in the increasing mid-market profits in the longer term.
� Shift towards services. Triad markets will see a continued shift towards services and alternative business models (e.g., pay per kilometer).
� Reg-driven investment. The convergence towards tighter emissions norms implies investments and a cost of around an additional EUR 100 million for the industry (net of pass-throughs), especially in emerging markets.
� Greater fuel efficiency. After the emissions regulation of the past decade (EURO 6, EPA10, JP09), investments into CO2 reduction measures will increase due to both upcoming regulatory frameworks and continued competitive pressure on TCO reduction (e.g., increased fuel efficiency) in the freight-forwarding industry.
� Profit from scale. Major industry players continue to strive for unlocking the additional profit potential of EUR 1.4 billion by realizing global scale effects stemming from, e.g., modularization and global engine and component strategies.
Key insights from the McKinsey truck initiative
Profit pools and
shifts
Core changes
Trends and
oppor-tunities

5Overview of 10 trends shaping the global truck market until 2020
Overview of 10 trends shaping the global truck market until 2020

Trends and opportunities in the commercial vehicle industry6
Until 2020, the global truck industry will
be shaped by 10 key trends
in 4 categories
Industry regu-lation
4Emissions standards
Stricter regulation of NOx and par ti culates, especially in emerging
markets
Increased require-ments on fuel efficiency (CO2), both regulatory driven and TCO driven
Fuel efficiency
5
Industry dy na mics
6Increasing com pe-tition
Price pressure through increasing
competition
Shift to higher-value trucks, and increased after market services in
emerging markets
Rising standards
7
Market eco -
nomics Rising sales due to economic development
1Structural shifts
Volatile raw material markets with overall
falling prices
Raw material volatility
2
Rising labor cost, especially in emerging
markets
Labor cost changes
3
OEM levers
8Modular strategy
Use of common components across different platforms
and brands
New service and business models,
e.g., pay per kilo meter
Shift of production footprint towards low-
cost countries
Service and busi ness mode ls
9Footprint/LCC
10
Key trends shaping the truck market
Gearing up for growth – future perspectives on the global truck market

7
Ten trends shaping the industry through 2020
In the course of the Truck Initiative1, McKinsey identified ten market trends that will change the economic and political context in which truck manufacturers operate. For overview purposes, these trends can be grouped into four categories: market economics, industry regulation, industry dynamics, and OEM levers.
The first three categories are comprised of global developments that are largely outside the control of truck manufacturers. However, individual manufacturers can take steps to craft an effective response to some of them. By contrast, the fourth category comprises actions that OEMs can take to extend their business models, innovate their product strategies and footprints, and create cost-saving efficiencies.
Market economics. The markets for medium- and heavy-duty trucks tend to expand in step with freight volume, which rises and falls in line with the gross domestic product. Global GDP will grow at over 5 percent annually from 2012 until 2017, leading to an increase in freight volume and, thus, growth in the truck markets. On the other hand, labor cost is steadily increasing, especially in emerging markets. Consensus data, for example, project that labor cost will almost double in China from 2013 to 2019. And, while prices for materials are generally falling and are likely to continue doing so, raw material price volatility is increasing significantly and will further complicate sourcing strategies.
Industry regulation. Another external force acting on the truck industry is regulation. As traditional heavy truck exhaust emissions like nitrogen oxides (NOx ) and particulate matter (PM) trend toward zero in the Triad countries, emerging markets are catching up fast, which will add to truck maker cost pressures in these low-cost-focused markets. However, because most key emerging economies are adopting EU emissions standards, global truck OEMs can standardize technologies across markets to gain increased scale economies and, thus, advantages over smaller players.
At the next level of emissions regulation, governments are beginning to regulate CO2 emissions via increasing fuel efficiency requirements. In fact, Japan and the US have already defined regulatory schemes that will become effective starting with model years 2015 and 2017, respectively. The EU and China expect to implement CO2 regulation during the 2015 to 2020 time frame. No concrete plans exist for Brazil, Russia, or India at the moment. Since CO2 emissions are directly linked to fuel consumption, customers will save on fuel costs as trucks become “cleaner” with respect to CO2 emissions.
In 2002, fuel made up 30 percent of the total cost of ownership (TCO) for a 40-ton long-haul tractor in Germany, for example. By 2011, it had risen to 37 percent – an absolute increase of over 43 percent – due to diesel price hikes, while most other costs remained relatively constant. Given this increased fuel cost burden, truck owners are well prepared to pay for advanced fuel-saving technologies as long as they are convinced of a sufficiently short pay-back period. This is a significant revenue and profit opportunity for truck OEMs that add fuel-saving technologies to their vehicles (see text box).
Overview of 10 trends shaping the global truck market until 2020
Industry regu-lation
Market eco -
nomics
1 In December 2014, McKinsey conducted interviews with truck industry experts in the key markets Western Europe, US, Japan, Eastern Europe, Turkey, Brazil, Russia, India, China, and Rest of World. The goal of these interviews was to better understand which trends will shape the global truck industry.
8 Gearing up for growth – future perspectives on the global truck market
Fuel-saving technologies
Truck OEMs have a rich bundle of fuel-saving technologies at their disposal that can theoretically capture cumulative savings of 50 to 65 percent. Solutions include near- and longer-term diesel improvements, vehicle upgrades such as advanced aerodynamics and active driver influence technologies, hybrid-electric vehicle (HEV) powertrains, and the shift to natural gas from diesel fuel.
However, not all viable new fuel economy technologies provide the same levels of profitability from the OEM’s perspective. Viewed in terms of TCO, for example, HEV solutions for a typical medium-duty truck could result in negative OEM unit margins (~ -10 percent) due to the costs associated with hybrid batteries. In fact, McKinsey analysis reveals major differences in profitability across solutions, with HEVs showing the worst bottom-line performance. To become profitable, OEMs need to cut hybrid costs by 60 to 80 percent. While hybrid technologies are the worst in terms of profit-ability, both compressed and liquefied natural gas (CNG/LNG) offer very good eco-nomics, followed by active driver influence technologies. McKinsey also found that most diesel engine and transmission improvements still provide viable opportunities. The attractiveness of some solutions will vary by region or depend on the gross vehicle weight and usage pattern.
Industry dynamics. Competition among truck manufacturers will likely increase through 2020. On the one hand, emerging markets still exhibit significant overcapacities, leading to a strong and increasing price competition. China, for example, was only using about half of its installed manufacturing capacity in 2013. On the other hand, emerging market – and especially Chinese – truck manufacturers are increasingly finding a customer base in Eastern Europe and Latin America (see text box).
Trucks beyond borders: Chinese truck manufacturers success-fully expand into South America and Eastern Europe
Chinese truck manufacturer JAC offers a prime example of what is possible when OEMs expand into new markets. JAC became active in South America in 2009. The company sold an initial 381 units that first year and reached 2,178 units in 2014, increasing its market share in the region from 0.2 to 1.1 percent. Foton entered South America one year after JAC and experienced similar gains. The manufacturer sold 250 units in 2010 and 2,405 units just four years later, growing its market share in the region from 0.1 to 1.2 percent.
Eastern Europe is also a target for truck manufacturers – particularly those in China – looking to expand beyond their borders. Weichai entered the Eastern European mar-ket in 2007. In its inaugural year in the region, the manufacturer sold 715 units of its Shaanxi Heavy brand. By 2012, the number of units sold had grown ten times, and Weichai had increased its market share in Eastern Europe to 3.9 percent.
Industry dy na mics

Along with growing competition, increasing customers’ demand for quality, features, and service in emerging markets also plays a role in intensifying industry dynamics. For example, customers want more powerful trucks with greater carrying capacity to handle the habitual overloading vehicles face and more robust suspension systems to navigate poor road conditions. They seek good reliability to keep utilization levels high and to cope with the practice of overloading without sustaining serious damage. Quality aftersales service represents another critical need. Fleets want high levels of parts availability, exten-sive service networks, and timely service. In addition, customers with large fleets that cross borders seek international customer support, cross-border financing, strong fleet management capabilities, telematics systems, and mobility packages. Together, these demands are driving the shift from low-cost toward higher-value, heavier trucks and more aftermarket sales, especially in the Chinese market.
OEM levers. Heavy-truck players are not just subject to the external market forces of eco-no mics, competition, and regulation. They also have several levers at their disposal to increase their profit pools. Their ability to develop new business models could generate sig ni fi cant revenue streams, while the continued shift of production to low-cost countries can yield massive savings. Companies are already pursuing some of these options. For instance, some OEMs are actively growing their aftersales and service income: one European player increased the aftersales and service portion of its revenues from 20 to 26 per cent from 2004 to 2012. In doing so, it discovered that aftermarket services could boost its mar gins by up to 1.5 percentage points, helping the company smooth out the big ups and downs of its cyclical performance.
The development of modular components for use across different platforms can also lead to significant savings through cost efficiencies. Daimler, for example, introduced a common engine platform for heavy-duty applications and claims that this particular modular strategy has helped decrease costs by 6 to 10 percent even after production volume doubled. Looking ahead, Volkswagen has announced plans to introduce a modular toolkit for its heavy trucks next year.
OEM levers
9Overview of 10 trends shaping the global truck market until 2020

10Gearing up for growth – future perspectives on the global truck market
Deep dives on key industry topics
I.The Chinese truck market
10Deep dives on key industry topics – I. The Chinese truck market

China is the largest
national truck mar ket world-wide in terms
of volume figures as of
2014
Volume development in the Chinese truck market
11 Gearing up for growth – future perspectives on the global truck market
Period of rapid volume expan-
sion followed by sharp decline
01 04 07 10 132000 02 0503 06 08 09 11 201412
1,295
1,173
867
926
1,061999
707719
510
436
569
406420
315
248
Thou
sand
s
China: 45% 999 thousand units
US: 18% 407 thousand units
WE: 14% 315 thousand units
RoW: 14% 304 thousand units
India: 9% 208 thousand units
Global market
Volume 2,233 thousand units (MDT and HDT)
(100%)

12
Although the Chinese market for medium- and heavy-duty trucks experienced a sharp decline in recent years, it remains the world’s largest national truck market by volume. It began expanding rapidly in 2000 and continued to do so for the next decade. A sudden loss of volume after 2010 is just one of the developments to shake up the market: fast-moving changes are also evident in the sophistication of transport infrastructure, OEM and customer structures, and truck price-performance ratios. A look back at the market’s recent history reveals the extent to which change has been the norm.
A look in the rear-view mirror
1997 - 2005: start of domestic production
� Several new local brands established (e.g., Foton, Hualing)
� Volume shift from medium- to heavy-duty trucks begins
� Rapid expansion of road network
2005 - 2010: fast market expansion, step-change in logistics system
� Volume grows quickly
� Local OEMs upgrade products, partly by sourcing components internationally
� Multiple new brands compete for market share, resulting in price pressure (real price development is flat)
� Dealer and service networks expand
2010 - 2011: rapid decline in truck volume
� Underlying economic growth slows, leading to underutilization of the rolling fleet built up over the previous expansion period
� As a result, sales of new trucks decline sharply
While the market is stabilizing, current volume demand is still significantly below OEM production capacity. The transport company landscape also remains very fragmented, and short-term cash flow is a very important consideration for these companies when deciding which trucks to source. The market for premium trucks (served mostly by imported vehicles from European OEMs) remains a niche market accounting for a very small share of total truck volume.
Deep dives on key industry topics – I. The Chinese truck market

Chinese truck makers have
noticeably improved their
pro duct offer over the last
5 - 10 years – example of a Chinese top-model truck
The bulk of truck sales occured in
price segments below the
RMB 400,00 level1
20132006
> RMB 400 thousands
RMB 200 - 400 thousands
< RMB 200 thousands
100% = 290,000 vehicles
100% = 753,000 vehicles
Air suspension
4 point2 point
340 hp
1,500 Nm
400 hp
1,800 Nm
Euro IVEuro III
2010 2013
25% 35% Maximal gradeability
10 speed 12 speed
Manual transmission
Gearing up for growth – future perspectives on the global truck market
Performance and price developmentof Chinese trucks
13
~ 2%
~ 93%
~ 5%
~ 2%
~ 72%
~ 26%
1 2006 real price level, inflation adjusted for 2013

In recent years, Chinese truck makers have dramatically improved their products – and their customers have reaped most of the benefits.
Improved truck specifications represent the largest product-related leap, which has taken place across essentially all component groups (engine, gearbox, chassis, cabin). While higher specifications do not automatically translate into better performance, customers are also starting to notice a step change in the quality and daily operational performance of Chinese trucks. Several applications that previously required imported Western trucks can now be sufficiently served with locally built models.
During the same period, the development of the real price for trucks in the Chinese market has been relatively flat – inflation adjusted, prices have even gone down, as the graph shows.
Deep dives on key industry topics – I. The Chinese truck market 14

Truck manu-fac turers
factories have been sig nif-
icantly under-utilized for
a number of years
15 Gearing up for growth – future perspectives on the global truck market
Local production overcapacity and the profitability challenge
Overall, profit-a bility has
declined since 2007
2007 08 09 10 11 12 13 2014
8.9%
Utilized
Not utilized
5.0% 4.7%4.0%
1.1%1.9%
< 1%
5.2%
32% 36%
41%
65%
40%
51%
36%
43%

16
Truck specifications and performance have risen faster than the prices for these products for a simple reason: fierce competition. The long period of rapid volume expansion in the market led OEMs to focus on securing capacity to meet the seemingly ever-growing demand. Now that demand has dried up, the many local makes are competing for their slice of a pie that is only ~ 40 percent of their aggregated production capacity.
This dynamic explains why truck buyers have pocketed most of the benefits from product improvements. Intense competition has prevented OEMs from pricing these improvements into the market. Not surprisingly, the profitability of Chinese truck makers has diminished as a result.
Deep dives on key industry topics – I. The Chinese truck market

The market’s premium share
is very small
Low-cost and value market
> 97%
Premium market
< 3%
Price of premium trucks
often being 2.5 - 3x as high
as those of local makers
Total volume ofChinese market
(100%)
Premium makes also
suffer from their more limited
sales and service network
coverage
~ 98% sales and service network coverage ~ 2%
sales and service network coverage
2.5 - 3x
Gearing up for growth – future perspectives on the global truck market
Obstacles to the competitiveness ofimported premium trucks
17

Imported premium trucks face many obstacles in the Chinese market. Today, a premium truck generally costs 2.5 to 3 times more than one from a local manufacturer, yet most customers do not perceive a corresponding advantage in performance or quality. In addition, import makes suffer from their more limited sales and service network coverage. Although imports are still well ahead of local makes in terms of product quality and reliability, the uptime and reliability perceived by customers is often quite similar. In the words of one customer, “Even though the premium trucks may break down only once or twice a year, when they do it can take a week to get them back on the road – instead of one day for a Chinese truck.” Consequently, the widely anticipated growth of the premium market has not materialized, and premium trucks still account for less than 3 percentage points of total truck volume in China.
What can we expect from the Chinese truck market in the long term (2025 - 30)?
In the long term, the customer and supply structure of the Chinese truck market is likely to become more similar to that of Western markets. The pace and magnitude of the shift, however, remain uncertain. The answers to several questions will determine what the market looks like 15 years from now:
� How fast will the transport company landscape consolidate?
� Will the producer landscape consolidate down to four to five major Chinese OEMs, and which ones will they be?
� What will be the role and influence of these companies’ Western joint venture partners?
� Will Chinese truck makers be able to continue closing the gap to Western imports in terms of specifications, performance, and quality?
� Will they be able to do so without increasing product cost – and thereby pricing – in an environment where labor and material are becoming more expensive?
� Who will ultimately win the price/performance race in the Chinese truck market – and at what price levels?
These developments are worth watching: depending on the outcome, the Chinese truck market could eventually emerge as a major premium truck market where manufacturers from all over of the world compete head-to-head.
Deep dives on key industry topics – I. The Chinese truck market 18

19Gearing up for growth – future perspectives on the global truck market 19
Deep dives on key industry topics
II.Modular strategy
Deep dives on key industry topics – II. Modular strategy
Successful modular
strategies incorporate 3 lenses in
order to find the sweet spot
20 Gearing up for growth – future perspectives on the global truck market
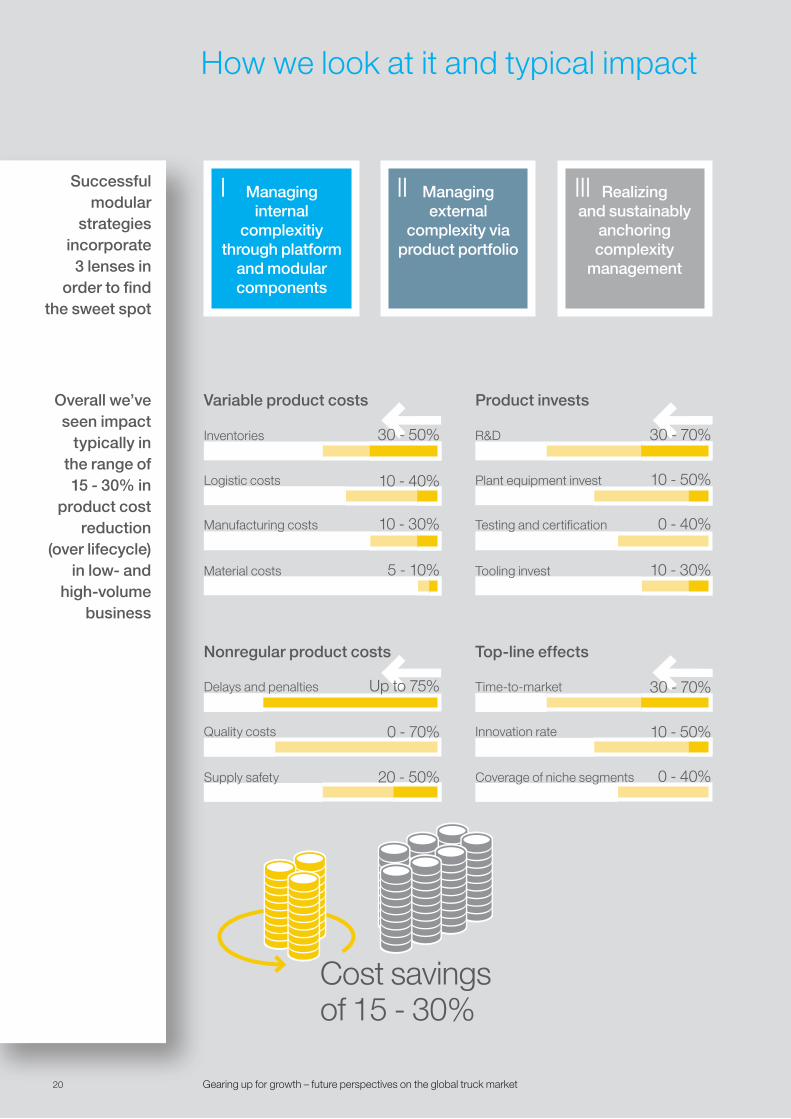
How we look at it and typical impact
Overall we’ve seen impact
typically in the range of 15 - 30% in
product cost reduction
(over lifecycle) in low- and
high-volume business
Cost savings of 15 - 30%
Managing external
complexity via product portfolio
Managing internal
complexitiy through platform
and modular components
Realizing and sustainably
anchoring complexity
management
Variable product costs
Material costs 5 - 10%
Manufacturing costs 10 - 30%
Inventories 30 - 50%
Logistic costs 10 - 40%
Product invests
Tooling invest 10 - 30%
Testing and certification 0 - 40%
R&D 30 - 70%
Plant equipment invest 10 - 50%
Nonregular product costs
Supply safety 20 - 50%
Delays and penalties Up to 75%
Quality costs 0 - 70%
Top-line effects
Coverage of niche segments 0 - 40%
Time-to-market 30 - 70%
Innovation rate 10 - 50%
I II III

21
Effectively managing complexity has become a key mandate for business success. In the past, consumers looking to buy products from automobiles to appliances may have been satisfied with just a handful of choices. Today, however, few companies can survive with such a basic product portfolio. The shift has been dramatic. An automotive OEM that once sold 6 compact models now lists 17 different compact class vehicles. In an even more extreme example, the number of mobile phones offered by a major electronics company exploded from 5 in 1990 to more than 180 – with a vast range of specifications, features, and geographic variants – in 2013.
However, rapidly growing product portfolios and increasingly global markets are not the only factors driving the complexity boom. Products themselves have also become more complicated as companies offer more features and options. When faster innovation cycles that complicate portfolios and more intricate aftermarket parts management are added, the complexity soon begins to seem overwhelming.
This web of new complexity drivers has repercussions beyond increased complexity itself. Since most traditional accounting systems do not fully capture the complexity costs that result, niche products often seem more profitable on paper than they really are – and can drag down the profitability of the entire business. While complexity management is essential to success, it is not a business objective in itself. A good business strategy needs to find the “sweet spot” between two extremes: a market-driven product portfolio with a differentiated offering for all customer groups and market segments on the one hand and clear, organization-wide standards to ensure the effectiveness of internal processes on the other. For truck manufacturers today, a modular approach to product development and production is the key to achieving this balance.
A modular strategy supports the entire organization in managing complexity:
� “Upstream” functions, such as product development, sourcing, supply chain, and production, can better ensure optimal synergies between the different products (i.e., manage internal complexity). This includes managing the re-use of common parts, designing product architectures with clear interfaces that allow for plug-and-play configuration, and developing supply chain processes that bundle effective production of standard modules with a highly responsive, make-to-order assembly process.
� At the same time, the “downstream” functions (sales, marketing, services, aftersales) can more effectively manage the portfolio of offerings (i.e., external complexity). Modular approaches enable them to ensure adequate levels of product differentiation and better manage complexity costs, order lead times, and effective pricing of options in their planning processes.
� Work does not stop once these efforts are successful. Complexity levels across the portfolio need to be constantly and effectively monitored and measured (i.e., complexity management needs to be realized and sustainably anchored), as product complexity has a strong tendency to creep back in. But companies that manage this balance well have seen cost savings reach 15 to 30 percent over their product lifecycles.
Deep dives on key industry topics – II. Modular strategy

Key success factors
... from low-cost segments
(standard entry product)
to premium segment (high-
end platform)
Successful imple men ta tion
at agri cultural machinery
showed great impact on
internal product com plexity ...
22 Gearing up for growth – future perspectives on the global truck market
Managing internal complexity
Common parts
20%
40%
80%
60%
Premium segment
Volume segment
Low-cost segment
Fact-based
decision making
Com pre-hen sive cross-
functional effort
Differ enti-ation and levels of
standard-ization
Integrated long-term planning
InternalI
Segment common parts
Base common parts

23
Differ enti-ation and levels of
standard-ization
Integrated long-term planning
Case example
While standardization is desirable, it cannot be a one-size-fits-all activity. The optimal level of commonality between products depends on the differentiation needs of those products, the profitability of the segment, and production volumes.
One agricultural machinery manufacturer takes a two-tiered approach. The target level of standardization is much higher for its low-cost segments, where intense cost pressure and high production volumes meet customers who more or less look for commodity/retail products. Products for the high-end market are more sophisticated and require much more differentiation, and margins allow for this.
As a result, the company has designed distinct platform architectures. Just as passenger car OEMs create different platforms for large and compact vehicles, the machinery company technically differentiates its platforms by market segment. Price considerations justify differentiation along this dimension. For example, it would be impossible to set prices for premium products that are 2 to 3 times higher than those for entry-level products if platforms were designed to have 80 percent of their parts in common.
Key elements of optimal standardization
Integrated long-term planning. Companies should take a long-term, forward-looking perspective regarding modular architectures instead of pursuing an opportunistic, one-off reuse of parts across products. They should fully integrate platform and module development into a broader product portfolio strategy and planning framework over time, setting clear milestones for key product events such as new launches and/or facelifts over the entire product cycle.
Differentiation and levels of standardization. Teams need a very explicit understanding of the sources of product or regional distinctiveness, which they typically develop by working hand in hand with the marketing and sales function. Differentiating specific components to reflect a product’s unique selling proposition (USP) requires companies to establish clear guidelines for future development.
Comprehensive cross-functional effort. This approach moves beyond standardization alone to employ a broader set of cross-functional modularity tools and techniques.
Fact-based decision making. Experience shows that it pays to overinvest up front in data transparency so that teams can drive modularity decisions based on facts rather than opinions or gut instinct, which can lead to bad decisions.
Fact-based
decision making
Com pre-hen sive cross-
functional effort
Deep dives on key industry topics – II. Modular strategy

24 Gearing up for growth – future perspectives on the global truck market
Deep dive on success factors
… and these need to be pulled in a
systematic approach
(from-to examples)
Modul arization is not only
about com-monality –
different levers have
to be applied together …
24 Gearing up for growth – future perspectives on the global truck market
Differ-entiation Reuse
Supplier activa-
tion
Supplier con so li-dation
Life cycle de coup-
ling
Com-monality
ModuleSubmodule
PartInterface
Unsystematic approach Same instrument panel in different cars
Systematic approach Differentiation between visible and invisible components: differentiation of visible parts on the surface, and com mon ality of invisible parts “behind the scenes”
Unsystematic approach Reuse of instrument panel from one generation to the next
Systematic approach Lifecycle decoupling of seat control units: definition of standard space enables appli cation of latest equip ment across all modules (~ 30% price reduction every 3 years)
Unsystematic approach Engine-specific development of a fuel injection system (sourcing on system level)
Systematic approach Intensification of competition on sub-module level: break-up of fuel injection system and standardization of speci fi ca-tions enable new sourcing
InternalI

25
Implementing a successful modular strategy at the product level requires moving beyond the typical approach of simply classifying parts as common or differentiated. Products and platforms usually have a long lifecycle in the truck industry, so OEMs have to dig deep. From the pure module or component level down to interfaces and specification descriptions within products – the challenge for truck manufacturers is to find and pull the right levers at the right level.
Examples include decoupling lifecycles (for example, of electronics for customer interfaces/controls vs. for infotainment systems) or reviewing sourcing strategies with the procurement function to boost scale effects or break up supplier monopolies. One truck manufacturer established dual sourcing for a fuel injection system by standardizing the design specifica-tions.
Deep dives on key industry topics – II. Modular strategy

26 Gearing up for growth – future perspectives on the global truck market
Managing external complexity
Market-driven spread of
product port-folio within
market cover-age and price-
performance mapping
3 external forces with
high impact on product complexity
Example: dissecting
product/price leakages from market share performance
helped to opti-mize strategy- driven spread
of product portfolio
Number of brands/SKUs, etc.
Geographies, regulation, customer
segments, etc.
Market-driven spread of product
portfolio
26 Gearing up for growth – future perspectives on the global truck market
Strategy-driven spread of product portfolio
Number of features, feature bundles, etc.
Com plexity of products
Pric
e
Bes
t B
ette
rG
ood
Global player
Premium segment
Value segment
Low-cost segment
Customer segments
External
Product leakage
Price leakage
Adressed market
Market share within addressed
market
Product com-
plexity
20% 35% 45% 30%
II

27
When thinking about a modular strategy, the most obvious places to start are the design of products and the architecture of platforms. As we have seen, tackling these areas can bring big benefits. However, this approach only addresses complexity that OEMs generate internally, based on their desired market coverage and the resulting spread of their product portfolio.
Customers themselves are becoming more complex, too, and market competition is pushing up the requirements on manufacturers regarding the features they offer and the differentiation in their product portfolios. Understanding this “external complexity” is a must, especially for manufacturers with more than one brand. Not only does it ensure that the OEM is meeting customer needs, but it can also guide modularization efforts. For example, mapping a manufacturer’s products against market coverage can identify white spots the company needs to fill. At the same time, it can reveal overlap between existing products and feature offerings. Equipped with insights from such a “broader view,” management can reassess the product architecture and optimize the underlying modular strategy, narrowing the number of options offered to respective customer groups.
Considering external complexity helped one industrial equipment manufacturer devise a new modular strategy for its products. The company had focused on the Western European premium market when developing its product portfolio. As a result, it was underperforming in some key fast-growing markets where customers were generally most interested in low-cost products.
Deriving product portfolio gaps from its market share performance enabled the company to define product standardization initiatives for the different regions where it does business. Market share increased by 5 percentage points as a result, and this improvement was seen as key driver for revenue growth of USD 2.6 billion.
Deep dives on key industry topics – II. Modular strategy

28 Gearing up for growth – future perspectives on the global truck market
Deep dive on complexity of products
Example: SKU reduction
via feature/con figuration
bundling through
data- driven approach
Typically, financial
systems do not account for fair
allocation of overhead and
complexity cost
18% of customers have configured
option B, only 8% have bought it. Most
customers have upgraded
28 Gearing up for growth – future perspectives on the global truck market
Total configuration
Configuration option
A 22%
B 18%
C 32%
D 28%
Total purchase 100%
B
2%
4%
1%
1%
8%
C
4%
8%
28%
2%
42%
A
15%
2%
0%
0%
17%
D
1%
4%
3%
25%
33%
Cumulative net profit accounting for fair allocation of over head and com plexity costs
Cumulative net profit
~ 30% healthy
~ 30% to be
reviewed
40% candidate for phase-
out
Additional improvement potential after standardization
Impact of internal com plexity man age ment on the cum u la tive net profit
SKUs
Profit distribution today
Profit distribution after rollout of platform strategy
Technical rationalization: cost reduction potential
ExternalII

29
Allocating complexity (costs) fairly to reduce the product portfolio
Traditionally, complexity costs (primarily consisting of one-time costs for niche products) are allocated based on sales. In this approach, long-tail products and configurations – in other words, those with smaller unit counts – generally show a profit just as high runners do. But there is a catch: sales-based allocation does not accurately reflect the actual cost of long-tail offers. As a result, niche products appear more profitable than they really are and end up “freeloading” off their high-runner counterparts. The picture changes when truck makers identify what drives costs and appropriately allocate costs to unit counts. In a fair allocation approach, many long-tail configurations are unmasked as loss makers.
Purely internal efforts to reduce complexity can help to lift the curve, but in most cases they leave manufacturers with products that still do not make a profit – or deliver weak returns that do not justify the cost of a platform migration. Intelligently structuring the product offering based on customer segmentation and big data analysis of customers’ configuration and purchasing behavior can weed out these unprofitable products.
Customers can be divided into clear segments based on the engines, lines, and special equipment they select. Within each segment, their behavior is highly predictable. As a result, manufacturers can simplify and structure the choices available to them by offering packages, providing some equipment exclusively with certain packages, and managing the options available in the configurator. Such segmentation and structuring pays off by lowering complexity and increasing the average share of wallet per customer. Within this segment-focused structure, truck makers can take advantage of customers’ upgrade behavior to optimize equipment offers with standard and premium versions, such as infotainment and telematics systems.
Segment patterns remain consistent across both countries and models, creating opportunities to reduce production and development complexity as well. All in all, truck makers can greatly increase their share of customers’ wallets and lower complexity, especially for higher-quality models they are less likely to offer as special model versions.
Deep dives on key industry topics – II. Modular strategy

30 Gearing up for growth – future perspectives on the global truck market
How to achieve sustainable impact
In the enthusiasm stirred by early modularity successes, companies often underestimate the effort required to establish it strongly. For example, making sure the company’s IT infrastructure can codify and manage common part numbers on schedule is a “must have” element of any plan to implement and measure modularity improvements. If not addressed in a timely manner, it can significantly slow down and endanger the program’s success, hindering engineers’ efforts to identify the correct common parts to use, for instance.
From the organizational point of view, mastering modularity will require a deep and complex transformation when it comes to roles, responsibilities, and product development practices. Consequently, organizations cannot approach it as a one-off project. While there may not be a one-size-fits-all organizational model, companies can still identify a set of common elements. These relate to the development and application of modular solutions across families of products and platforms, the coordination of the innovation cycles in the broader company portfolio strategy, and the need to guard the achieved commonality levels and avoid a resurgence of complexity.
Organizations typically address these requirements by appointing central module man-agers. An automotive OEM might assign a “Rear Axle Module Leader,” while a telecommuni-cations cell phone OEM might hire a “Display Technology Champion.” These managers coordinate the company-wide portfolio of variants, define specifications for common parts, and act as complexity guardians for their systems. They also work closely with platform and project managers to ensure the best trade-offs are made between modularity and product-specific requirements.
Why success requires top management attention
In addition, top management commitment is a pre-condition to success. The journey to modularity requires a broad, cross-functional effort that involves a significant mindset change and requires a systematic approach. The most successful experiences, especially when companies launch their very first modularity initiatives, involve company-wide assemblies where top managers openly discuss the opportunity to launch such a program and the expected benefits and risks. These communication campaigns, especially when they involve a deeply committed CEO and top managers in program status reviews, help to confirm the cross-functional nature of the effort and demonstrate the role modeling required to sustain the change.
RealizeIII

31Deep dives on key industry topics – III.A. New service and business models
Deep dives on key industry topics
III.ANew service and business models

Total cost of owner ship (TCO) today
The impact of new services on the elements of TCO
Significant TCO
savings potential
32 Gearing up for growth – future perspectives on the global truck market32
Estimated change in
TCO through new service
and busi ness models
-5 to -10%
~ 16% Administration
-5 to -10%
~ 10% Maintenance
+/- 0%
~ 4% Insurance
-5%
~ 27% Personnel cost
-5 to -10%
~ 35% Operations
+10%
~ 8% Vehicle price
Total TCO savings of 3 - 6%

33
New, connectivity-enabled business models are transforming the medium-sized and heavy-duty trucks market by increasing safety, driving down the cost of ownership, and adding a never-before-seen level of convenience for owners. These business models affect virtually all aspects of ownership and operation – from automated driving to telematics-based fleet management services – and involve all stakeholders, including manufacturers, customers, regulators, financial services institutions, and telecommunications operators.
While many stakeholders have a role to play in the new, connectivity-enabled services, cus-tomers and truck manufacturers are among those with the most to gain.
Connectivity and remote services have the potential to significantly reduce the total cost of ownership (TCO) of medium-sized and heavy-duty trucks. While these ser vices will likely increase a unit’s purchase price by about 10 percent, this cost is offset by the fact that the purchase price is one of the least significant contributors to TCO. Costs related to maintenance, operations, personnel, and administration generate the largest share (> 80 percent of a truck’s TCO, see infographic). Remote diagnostic services can help reduce maintenance costs by 5 to 10 percent, and real-time traffic information can deliver similar savings in the operations category. Combined, connectivity-enabled services in these cate gories and others can yield total TCO savings of 3 to 6 percent.
Deep dives on key industry topics – III.A. New service and business models

34
Customers are even more
interested in vehicle man-
age ment appli-cations than in enter tainment
34
Market research on the use and expectations of apps in cars
Use of smart-phones is up
~ 28% of German drivers use smartphones
in the car~ 70%
use their phones for purposes other
than calls
~ 60% of customers
are interested in vehicle man age-
ment appli ca tions
Gearing up for growth – future perspectives on the global truck market
~ 50% of customers
are interested in enter tain ment
appli cations

Personal data is becoming increasingly
available
~ 67% of the 18- to 39- year-olds expect that person al data from social media plat forms will be avail able in cars in the next 10 years
35
Market research indicates that now is the time for heavy-truck manufacturers to create and offer segment-specific value propositions in the area of connectivity-enabled services. Services that leverage personal data to enhance the driving experience offer significant revenue potential. Furthermore, customers increasingly expect these services and are willing to pay for them – thus creating a context in which this potential can be unlocked
Customers are willing to pay a
premium~ 50% of car drivers expect to pay an increased vehicle price due to con nec- tivity-enabled services being included in the future
Deep dives on key industry topics – III.A. New service and business models

36 Gearing up for growth – future perspectives on the global truck market
Connectivity-enabled
products and services
Small fleets, craftsmen
Medium-sized trucking companies
Large freight carriers
Truck OEMs can enlarge their portfolios through innovative products and services and potentially become fully integrated service providers
Fleet size
Large fleets
Reg
iona
lizat
ion
Glo
bal
Owner driver
Loca
l
Cross-border financing
International customer support
Fleet management
Telematics
Mobility package
Buy-back obligations
Insurance
Contract hire
Extended warranty
Service contracts
Leasing/ financing
Truck sales
Used vehicle intake
3636 Gearing up for growth – future perspectives on the global truck market
Products and services demand by fleet size and regionalization

37
Cost efficiencies are just one driver of customer demand for connectivity and remote services. These services also offer a level of convenience and peace of mind, and automotive research reveals that not only are customers comfortable with this digital-driven convenience, they increasingly expect it. Customers across the size and footprint spectrum value connectivity’s upside, from the possibilities for greater inter national support for cross-border fleets to ease of sale/purchase for the individual owner.
Manufacturers see the business opportunity that connectivity presents. First, there is revenue potential from the higher vehicle sales price that comes with additional features and ongoing aftersales services. Second, offering the digital innovations of con nectivity-enabled services is an opportunity for truck manufacturers to strengthen their brands. Third, these services generate new types and high volumes of customer data, which manu facturers can leverage to sell additional, highly-tailored offerings and retain satisfied cus tomers.
Deep dives on key industry topics – III.A. New service and business models

38
Connectivity-enabled product
and service offering
unlocks a variety of use
cases
38
Connectivity-enabled service by type and application
Applications
Driving assistance/ automated driving
Infra struc ture services Vehicle relationship management
Driving behavior feedback In-truck content/servicesTy
pe
of c
om
mun
icat
ion Truck to
driverParking assistance Theft protection Live warning for inappropriate
drivingAugmented reality through windshield with routing infor-mation
Remote unlock/lock, horn, cooling/heating
Real-time infor ma tion on fuel con sumption and how to improve
Transfer of “last mile” infor-mation to smartphone
Remote truck steering In-truck app eco system
Access to native apps and smart phone-integrated apps
Truck to truck Pre-collision warning Tracking of multiple trucks to drive in convoy
Traffic jam assistant
Platooning
Automated obstacle avoidance
Truck to trans port er/ transport buyer
Cus tom ized OEM add-ons
Track-and-trace function for fleet management
OEM-exclusive repair shop finder
Reporting of per formance to fleet owner
Reliable predictive traffic information
Optimization of routing Notification for (preventive) main tenance appoint ment in work shop
Location-based services
Real-time freight data (cooling temperature, etc.)
Extended emer gency assistance
Map updates
Fuel theft pro tec tion Stolen truck tracker Web access
Direct mobile payment
Truck to infra struc ture
Automatic emer gency call (e-call)
Optimized signal timing and traffic flow (avoiding traffic jams)
Handling- and usage-based insurance tariff
Optimized signal timing and traffic flow
Electronic tolling Environmental and roadway monitoring
Interconnected parking
Gearing up for growth – future perspectives on the global truck market

39
Applications
Driving assistance/ automated driving
Infra struc ture services Vehicle relationship management
Driving behavior feedback In-truck content/services
Typ
e o
f co
mm
unic
atio
n Truck to driver
Parking assistance Theft protection Live warning for inappropriate driving
Augmented reality through windshield with routing infor-mation
Remote unlock/lock, horn, cooling/heating
Real-time infor ma tion on fuel con sumption and how to improve
Transfer of “last mile” infor-mation to smartphone
Remote truck steering In-truck app eco system
Access to native apps and smart phone-integrated apps
Truck to truck Pre-collision warning Tracking of multiple trucks to drive in convoy
Traffic jam assistant
Platooning
Automated obstacle avoidance
Truck to trans port er/ transport buyer
Cus tom ized OEM add-ons
Track-and-trace function for fleet management
OEM-exclusive repair shop finder
Reporting of per formance to fleet owner
Reliable predictive traffic information
Optimization of routing Notification for (preventive) main tenance appoint ment in work shop
Location-based services
Real-time freight data (cooling temperature, etc.)
Extended emer gency assistance
Map updates
Fuel theft pro tec tion Stolen truck tracker Web access
Direct mobile payment
Truck to infra struc ture
Automatic emer gency call (e-call)
Optimized signal timing and traffic flow (avoiding traffic jams)
Handling- and usage-based insurance tariff
Optimized signal timing and traffic flow
Electronic tolling Environmental and roadway monitoring
Interconnected parking
39Deep dives on key industry topics – III.A. New service and business models

40 Trends and opportunities in the commercial vehicle industry
Hard nut, but worth it
Various kinds of upside
potential for OEMs and
other service providers
40 Gearing up for growth – future perspectives on the global truck market
Benefits of connectivity-enabled maintenance and repair services
Low-hanging fruit
First stepToo much effort
Ease of implementation
Easy
Mar
ket p
oten
tial
Hig
h
Difficult
Low
A
B
CD
EF
GH
I
Assessment regarding
ease of imple-men ta tion
and market potential
(com pany dependent)
A Optimization of customer contact and loyalty
C Reduction in “lost sales”
E Cooperation models
G Excellence in supply chain and repair shop processes
I Systematic analysis of overall pool
B Offers tailored to specific customer segments
D Innovative service products
F Optimized pricing
H Preventive/predictive maintenance
Revenue focus Efficiency focus

41
A
B
C
E
G
I
D
F
H
For a better understanding of the various kinds of upside potential for OEMs and other repair and maintenance service providers in the truck business, it may be helpful to provide concrete examples for the relevant levers and distinguish between levers with a revenue focus and those with an efficiency focus.
First, here is a list of the six levers with a revenue focus, including a short description of what each of these entails:
Optimization of customer contact and loyalty through increasing (service) loyalty with direct contact, e.g., proactively suggesting maintenance appointments
Offers tailored to specific customer segments through using more precise customer seg-mentation to create product offerings for specific needs, e.g., with cross-selling or “packages”
Reduction in “lost sales” by ensuring high parts availability and, thus, reducing the incentive for customers to go to another repair shop
Innovative service products through introduction of innovative telematics-enabled services
Cooperation models with the use of telematics infrastructure and data for external partners, such as fueling stations and insurance companies
Optimized pricing, e.g., specific products in each region, enabled by big data.
Second, here are the three levers with an efficiency focus:
Excellence in supply chain and repair shop processes through improvements in, for example, demand forecasts for spare parts, leading to lower inventories and more targeted repairs
Preventive/predictive maintenance by diagnosing problems remotely based on historic main-tenance data (preventive) or sensor-data-based data (predictive) to eliminate them before they lead to greater damage
Systematic analysis of overall pool can keep “surprise” problems minimal, especially those involving new developments.
Deep dives on key industry topics – III.A. New service and business models

42
Example from the train
industry
42
Example: cost impact through preventive maintenance
How it works
What it needs to
make it happen
Trans for mation of main ten ance man age ment con cept for a fleet of 150 diesel electric loco motives
�Central database with sufficient failure samples�Sufficient vehicle data quality�Analytical models for failure patterns, rates, and dependencies�Easy-to-read evaluation of results�Derivation of recommended service patterns
Analytics OutputInput
� Central sensor data (pressure, temperature, mileage, etc.)
� Technical data (age, energy con-sumption, etc.)
� System data (work orders, inven tory trans actions)
� Experience from personnel
� Comparison with known failure patterns and rates
� Optimization of component-specific mainte nance approaches and intervals
30%Cost savings potential of up to
of total main tenance cost
� Data cleaning � Combination of data
sources � Segmentation
of failures � Statistical analysis
Gearing up for growth – future perspectives on the global truck market

43
Broad agreement exists that new, connectivity-enabled business services are perceived as value-adding to customers, in terms of savings and convenience, and value-creating for manufacturers, with regard to revenue. In fact, connectivity-enabled services have already been introduced by the overwhelming majority of truck fleets. The incongruence comes when we look at the degree to which services are being implemented. Remote services for preventive maintenance, connected service pricing, and connected spare parts supply chains, for example, are, so far, being used by only a small share of manufacturers.
It also seems increasingly clear that connectivity proliferation will no longer be just a “nice-to-have” industry add-on but a disruptive force. Among other shifts, autonomous driving technology may move the responsibility for accidents from the driver to the manufacturer, and remote diagnostic services may make some in-person maintenance services obsolete. Losing out on potential revenue and customer retention gains may be just the tip of the iceberg for manu facturers who are slow to adopt the new, connectivity-enabled business models.
Deep dives on key industry topics – III.A. New service and business models

44Deep dives on key industry topics – III.B. Opportunities through telematics
Deep dives on key industry topics
III.BOpportunities through telematics

45 Gearing up for growth – future perspectives on the global truck market45
Telematics technology is expected to become
standard automotive equipment
by 2020
45
Telematics will boost several automotive revenue pools by 2020
Telematics technology
will likely unlock several
significant automotive
revenue pools
Gearing up for growth – future perspectives on the global truck market
Total number of fleet manage-ment systems installed in commercial vehicles in EuropeMillions
Passenger car telematics units sold in EuropeMillions
14% p.a.
35% p.a.
2015 20202015 2020
~ 4 ~ 8
Source: Machina Research, 2015
Source: Frost & Sullivan, 2014
~ 7 ~ 29
98%penetration of Europe’s
new passenger car market in 2020
99%penetration of Europe’s
new truck market in 2020
Volume of revenue pool
Application2015 EUR billions
2020 EUR billions
CAGR 2015 - 20
Fleet management 3.3 8.0 19%
In-vehicle emergency call system 0.3 1.8 43%
In-vehicle entertainment and Internet access 1.7 10.0 42%
In-vehicle voice 0.1 0.3 37%
Lease, rental, HP, and share car management 0.9 2.5 23%
Roadside assistance 1.5 9.1 43%
Stolen vehicle recovery 6.0 27.2 35%
Usage-based insurance 2.6 12.7 37%
Vehicle diagnostics 2.1 13.0 44%
... ... ... ...

4646
Telematics technology and telematics-based applications are already widely available and play an important role for commercial trucks. By 2020, it is expected that these technologies will be present in almost 100 percent of all new commercial vehicles and private cars sold.
With the technology becoming standard automotive equipment, ever larger revenues are going to be generated from service offerings that rely on telematics technology for connecting the vehicle with the driver and the service provider. This opens up multiple opportunities for increasing customer value beyond the simple functioning of driving a car or basic product transport.
The significant increase in new automotive revenue pools unlocked by telematics-based applications results from a wide range of service offerings that can be expected to experience strong growth within the next five years. Among others, these applications include:
� Fleet management, i.e., telematics technology-based systems and services for businesses – e.g., for car rental companies and car sharing providers – that facilitate information exchange between a commercial fleet and the dispatching office
� In-vehicle emergency call systems that automatically call the national emergency hotline (e.g., 911) in case of a serious road accident and simultaneously transmit GPS location data to local emergency services
� In-vehicle entertainment and Internet access, i.e., navigation, multimedia, social media, and in-vehicle Wi-Fi connection
� In-vehicle voice that offers telephone or even concierge services to drivers
� Lease, rental, HP, and share car management that is used for mileage capture, expense management, vehicle administration, environmental monitoring, etc.
� Roadside assistance that helps drivers with a mechanical failure, who would otherwise be stranded
� Stolen vehicle recovery that tracks and locates a stolen vehicle and notifies the police of its precise location for recovery
� Usage-based insurance that can be used for dynamically adjusting insurance cost through exact measurement of driving behavior and customer feedback
� Vehicle diagnostics, i.e., on-board telematics that monitor a vehicle’s performance in real time and alert the driver (and potentially maintenance services) of potential problems with the engine, for example.
Deep dives on key industry topics – III.B. Opportunities through telematics

47
Business planning for a new
connected truck offering
should follow a 4-step process
47
Creating a connected truck offering requires a specific process
Gearing up for growth – future perspectives on the global truck market
Need Understand the
customer needs
Delivery model Define how the value will
be captured by and shared between involved players
Asset Identify which assets are used to satisfy particular needs
Monetization Calculate the total revenue pool and determine how satisfying customer needs can be monetized
The potential service
offerings require different building blocks
of telematics technology
Sensors and connectivity
Data processing/analytics
Customer interfaces
Smartphone Sensor and device gateway
Portals
Apps
Interfaces to 3rd- party databasesAnalytics
platformRetro-fitted
Line-fitted

48
Businesses planning to enter the market of connected car offerings should follow a 4-step process to assess the potential and fit of the new products and services:
1. Need. Understand the customers’ needs, e.g., personalized pricing, safety and security, convenience, vehicle maintenance, fleet management.
2. Asset. Identify which assets are used to satisfy particular needs, e.g., analytical capabilities, ability to deliver physical services, technological know-how, consumer insights, innovativeness.
3. Monetization. Calculate the total revenue pool, e.g., competition for profit pools with competitors vs. division of profit pools among partners, and determine how satisfying customer needs can be monetized through different monetization models such as one-time purchase, subscription, ad supported.
4. Delivery model. Define how the value will be captured by and shared between involved players, e.g., stand-alone, with strong partners, as part of an ecosystem consisting of different players, or an ecosystem orchestrator.
Each telematics-based service offering requires a specific combination of technology building blocks. Here is an overview of some basic considerations and rules of thumb in this regard:
� Data processing and analytics are required in every case, but sensors and connectivity as well as the customer interface can be flexibly combined.
� Data processing and analytics require device gateways and analytics platforms.
� As for sensors and connectivity, there are three options:
— Line fitted, i.e., the device is fully embedded in the vehicle data system and installed by an OEM
— Retro-fitted, i.e., an external device, which either incorporates its own sensors or connects to a vehicle data bus via interface, and is professionally installed after sale
— Smartphone, i.e., sharing of apps allows the transfer of location data via a smartphone’s LTE/4G/GPS system
� The customer interface can be implemented through an app on the smartphone or a computer – or even through interfaces to third-party databases.
Deep dives on key industry topics – III.B. Opportunities through telematics

49 Gearing up for growth – future perspectives on the global truck market49
Safety and
security
Con-venience
Fleet manage-
ment
Vehicle manage-
ment
49
Telematics technology serves a broad range of customer needs
Usage of telematics
significantly improves
driving behavior and thus
facilitates personalized
car insurance policy pricing
Customer needs can
be clustered along
5 dimensions
Gearing up for growth – future perspectives on the global truck market
Personalized pricing of car
insurance
Selected insights from telematics-based insurance tariffs
Usage of truck telematics has led to:
80%reduction of fleet incidents
30%reduction of number of claims
54%reduction of client crashes
50%reduction of fleets claim costs
Need

5050
Customer needs that are addressed with telematics-based service offerings can be clustered along five dimensions:
� Safety and security, including stolen vehicle tracking; advanced driver safety coaching; high-risk area warning; individual speed-limit warning
� Convenience, including “find my car” functions; trip and location reporting; concierge services; gamification (incl. basic driver coaching); location-based advertisements
� Vehicle management, including remote diagnostics and condition monitoring; scheduling of repair and maintenance services; predictive maintenance
� Fleet management, including optimization of fleet staffing, loading and routing; advanced driver efficiency coaching; real-time fleet tracking and reporting
� Personalized pricing of vehicle insurance that is based on pay per use (e.g., micro-insurance); driver profiling; policy renewal.
Deep dives on key industry topics – III.B. Opportunities through telematics

5151
All 3 sensor types’
penetration rate of Europe’s
new car sales are growing
stronlgy
Telematics offerings can
be designed at very little cost
due to scale effects
Gearing up for growth – future perspectives on the global truck market
Retro-fitted
Line-fitted
34%
15%15%20%
51%
98%
Smart-phone
20202015
Smart - phone
Retro-fitted Line-fitted
Smart-phone
Cigarette lighter
Black box Battery box
Crash recorder
OBD dongle
Installed OBD box
Sensor
GPS
Accelerometer
Transmission
Bluetooth and smartphone
SIM
Installation
Self
Professional
Line-fitted (OEM)
Overview of technology requirements and penetration rates for each sensor type
x7volume increase
~ 40%cost savings
Each sensor type requires
different building blocks
of telematics technology
Typical telematics costs per annum and contract (in EUR)
Transmission fees depending on choice of technology
Platform costs are mainly fixed costs
Hardware and shipment cost depending on sensor and sales structure
~ 5 - 10
~ 10 - 25
~ 10
AssetApplicable

52
Telematics unlocks a multitude of automotive revenue streams
Overview of the telematics-
based applications
with the largest revenue-
generating potential
MonetizationRevenue generating units Thousands
Devices and installation EUR billions
Service EUR billions
Application 2015 to 2020 2015 2020 2015 2020
Fleet management + ~ 270.8
1.4
2.5
6.6
In-vehicle emergency call system + ~ 259
0.0
0.3
0.3
1.5
In-vehicle entertainment and
Internet access+ ~ 107
0.4
1.3
1.3
8.8
In-vehicle voice + ~ 4 – – 0.1
0.3
Lease, rental, HP, and share car
management+ ~ 22
0.5
0.8
0.4
1.7
Roadside assistance + ~ 1880.0
0.1
1.5
9.0
Stolen vehicle recovery + ~ 299
0.9
2.0
5.1
25.3
Usage-based insurance + ~ 128
1.4
4.2
1.2
8.5
Vehicle diagnostics + ~ 2830.1
0.5
2.0
12.5
...
Source: Machina Research, 2015
Deep dives on key industry topics – III.B. Opportunities through telematics

53 Gearing up for growth – future perspectives on the global truck market5353
Mainhold delivery models allow new competition for attractive segments of the value chain
Gearing up for growth – future perspectives on the global truck market
Cal
l c
enter
VoltDeltaLSSiDATA
...
AnalyticsAgnikISO
SpeedgaugeCrashboxx
...
Driv
er behavior improvement
Runzheimer International
Audiovox...
Drivin
g ris
k scoring
DrivefactorSensomatic
Advance...Fleet managem
ent
TelogisGeoTabTrimble
...
DevicesRedtail
TelematicsTelit
CarChip pro...
Exemplary use cases
Volvo and Carlsberg:
Connected fleet for brewery distribution with flexible pay-per-KM service
DPD:
Real-time tracking of parcel through smartphone
John Deere and TimberLink:
Remote monitoring system to drive customer productivity
A broad range of
new players compete for the various segments
Delivery model

5454
A new landscape of delivery models is currently developing based on existing and new players. This will result in a new world of business around connected trucks that requires novel partnerships and diverse capabilities around sensor technology, analytics, and service delivery.
First partnerships within these new delivery models are already emerging, for example:
� Volvo and Carlsberg have teamed up to create a connected fleet for their brewery distribution to restaurants and stores with a flexible pay-by-kilometer service for their customers.
� John Deere and TimberLink have partnered to increase their customers’ productivity and improve uptime with a remote monitoring system of their vehicles’ status to prevent potential maintenance issues.
Players within each capability along the new telematics value chain are potentially numerous, and the growth opportunity for OEMs and third-party solution providers who benefit from telematics technology, is promising.
Deep dives on key industry topics – III.B. Opportunities through telematics

55Gearing up for growth – future perspectives on the global truck market 55
Deep dives on key industry topics
III.CAutonomous driving
Deep dives on key industry topics – III.C. Autonomous driving

56
Autonomous driving
unlocks vast optimization
potential in the truck industry
56 Gearing up for growth – future perspectives on the global truck market
Outlook on significant advancement through autonomous truck
Up to 28% decrease in average TCO of a 40-ton tractor long-haul truck – from limited ADAS to full AV stage
Significant capex decrease through approximately
76% fewer crashes
Up to 60% savings in CO2 through
reduced operating ...
... while labor costs are reduced by
up to 90%
Up to 5% savings in driving time through route optimizations
Vast opportunities through spillover to other industries (e.g., airline and insurance industry)
871 TEUR 628
TEUR

57
Owing to the huge monetary, technological, and societal benefits it generates, automation in the form of self-driving vehicles has the potential to significantly advance the truck and passenger car industries, and even other industries such as insurance, which will be impacted by large spillover effects. Trucks are most likely to be in the driver’s seat of the autonomous-driving revolution, while self-driving cars will take more of a back seat, since the long, monotonous highway environment is ideal for trucks while cars mainly have to deal with more complex urban driving situations.
Although the necessary technological developments are basically in place and working (at least for semi-automated vehicles), industry experts anticipate that it will take another ten years before we see fully autonomous trucks readily available for operation on public roads. As this has more to do with policy issues that need to be resolved than with a technology lag, emergence of at-scale use of autonomous trucks will most likely first occur in the US. For among other advantages, the US offers the best-suited legislative system and very open public opinion regarding the technology for autonomously-driving vehicles. What is more, semi-autonomous trucks may even be ready for series production as soon as within the next two to three years.
Deep dives on key industry topics – III.C. Autonomous driving

5858 Gearing up for growth – future perspectives on the global truck market
Customers are open to automation and its pilots
Source: Global McKinsey car survey
Germany
US
Customers in Germany and the US need to be convinced by pilots to
establish trust in the
autonomous driving
technology
“Should cars with autonomous functions be legal?”
77% are open to the idea
47%
30%
80% are open to the idea
50%
30%

59
China
Yes, it should be legal
No, but successful pilots could change my mind
No
Deep dives on key industry topics – III.C. Autonomous driving
Chinese customers
are extremely receptive for autonomous
driving
99% are open to the idea
87%
12%

6060 Gearing up for growth – future perspectives on the global truck market
There are 5 levels of
automation
Positive public perception of auton-omous vehicles can be increased with the option of conventional driving
Public perception
differs by geographic
region and level of automation
“Would you switch to an autonomously driving vehicle at the same cost?”
33%
Level 4
76%
Level 3
Combined function
Function- specific
No automation Level 0
12 3
4
Limited self-driving
Full self-driving
Germany
China
US
76% 93%
40% 67%
Yes
No
+130%
+68%
+22%

61
The speed of change is dramatic: automotive customers in general continue to request a greater number of Advanced Driver Assistance Systems (ADAS) and autonomy in vehicles ever more quickly, even if there is still some scientism surrounding the technology.
Given that the road to full autonomy is an evolution with increasing levels of ADAS function-alities, it is helpful for orientation purposes to provide an overview of the various automation levels and a timeline of their development based on the National Highway Traffic Safety Administration’s (NHTSA) official definition of autonomy in vehicles, which consists of five levels:
� No-automation (Level 0). The driver is in complete and sole control of the primary vehicle controls – brakes, steering, throttle, and motive power – at all times.
� Function-specific automation (Level 1). Automation at this level involves one or more specific control functions. Examples include electronic stability control or pre-charged brakes, whereas the vehicle automatically assists with braking to enable the driver to regain control of the vehicle or stop faster than possible by acting alone.
� Combined-function automation (Level 2). This level involves automation of at least two primary control functions designed to work in unison to relieve the driver of control of those functions. An example of combined functions enabling a Level 2 system is adaptive cruise control in combination with lane centering.
� Limited self-driving automation (Level 3). Vehicles at this level of automation enable the driver to cede full control of all safety-critical functions under certain traffic or environmental conditions. And in those conditions, the driver should be able to rely heavily on the vehicle to monitor for changes in the conditions requiring transition back to driver control. The driver is expected to be available for occasional control, but with sufficiently comfortable transition time. The Google car is an example of limited self-driving automation.
� Full self-driving automation (Level 4). The vehicle is designed to perform all safety-critical driving functions and monitor roadway conditions for an entire trip. Such a design anticipates that the driver will provide destination or navigation input, but is not expected to be available for control at any time during the trip. This includes both occupied and unoccupied vehicles.
When asked, consumers show a very high willingness to purchase an autonomous vehicle and therefore, it is generally expected that today’s scientism view will change as soon as cus tomers are able to actually use the technology and experience its associated conve-nience. Public perception of autonomously driving vehicles increases significantly when successful pilots are reported and drivers have the opportunity to gain control over the vehicle if necessary.
Deep dives on key industry topics – III.C. Autonomous driving

62
~ 28% savings in average
TCO (40-ton tractor long-
haul truck)
62
Impact of autonomous driving on the elements of TCO
870 TEUR
Combined function automation
Today
627 TEUR
Full-self driving
2025
-28%
Driver 227 TEUR 44 TEUR
-81%
Insurance and taxes 52 TEUR 31 TEUR
-40%
Administration and garage 174 TEUR 157 TEUR
-10%
Repair and maintenance 52 TEUR 44 TEUR
-15%
Fuel 261 TEUR 232 TEUR
-11%
Depreciation and capital
costs 104 TEUR 119 TEUR
+15%
Gearing up for growth – future perspectives on the global truck market

63
In the truck industry however, customers will not buy into that technology because of convenience. Much more likely, the truck industry will even accelerate the change towards higher level of automation as it enables significant TCO savings (driver’s time, fuel, maintenance) and is therefore a “first priority.”
More than some 80 percent of the total TCO savings result from cost improvement in the three areas of driver, insurance and taxes, and fuel. Here are some further details on these cost savings:
� Driver. As driverless systems suggest, savings here will be derived by reducing driver’s time through fully automated vehicles. For lower automation levels, legislation may allow that drivers work longer since they can pause while driving.
� Insurance and taxes. Potential reductions of human-caused accidents will lead to lower insurance costs due to less risk that operators have to pay for.
� Fuel. Savings can be expected for fuel, due to more predictive gear changes and also due to platooning with little distance between vehicles which leads to more efficient aerodynamic setups.
Even calculated on the basis of current standard combustion engines, the business case is already very convincing. However, the monetary benefits are likely to grow even bigger, when synergies with other future technologies such as electric mobility become reality.
Deep dives on key industry topics – III.C. Autonomous driving

64
From pilots, standard
applications will evolve
64 Gearing up for growth – future perspectives on the global truck market
First pilots show revolutionary potential of self-driving trucks for commercial fleets
Ongoing pilots and research
indicate the future of the
truck industry
There are already
successful use cases
in adjacent industries
Today
Autonomous driving already in use in controlled environments, e.g., mining/farming
Mining
Autonomous haulage systems (AHS), by Rio Tinto
Medium term ~ 2023 - 2040
Autonomous trucks first to enter public roads
Farming
Supervised autonomy by John Deere
Full automation by New Holland
Long term 2040+
Delivery will go beyond roads, e.g., automated planes
Scania/Volvo:
Tests of platooning systems; trains of vehicles autonomously controlled by one “locomotive”
Daimler:
Future Truck 2025 semi-autonomously driving on public roads, no external infrastructure needed
MAN:
First full self-driving protection vehicle that slowly follows mobile construction sites on freeways to save drivers from rear-end collision accidents

Strategic partnership and business model
65
We see 6 success factors for truck OEMs regarding self-driving vehicles
Technology/information and
infrastructure
Regulation and public perception
Strategic partnerships Engage in ecosystems with defined standards
Business model Adapt your business model to monetize on additional revenue streams from connecitity features and services
Technology/information� Make granular map data
available�Invest in software and tele-
matics to deliver interlaces and protocolls for open connectivity
Regulatory changesAdopt levers to novel technological features, e.g., “hand of the wheel,” speed limits
Infrastructure Ensure coverage of mobile Internet infrastructure
Public perception/ customer acceptance� Promote successful pilot
testing to relevant audiences� Secure high safety standards
before serial production
Deep dives on key industry topics – III.C. Autonomous driving

6666 Gearing up for growth – future perspectives on the global truck market
What truck OEMs and regulators need to do next
There are several success factors involved in bringing autonomously driving trucks to the market, which can be grouped into company-specific and environmental factors. Concerning company-specific aspects, truck OEMs should take the following steps (and preferably in this order):
� Actively engage in strategic partnerships and industry alliances to achieve the necessary scale and drive creation of industry-wide standards with defined protocols and inter-faces. Cooperating with major IT and digital players will likely be necessary in order to gain the required know-how.
� Fulfill and master several technological requirements, such as innovation of sensors, artificial intelligence, and connected technologies that are key in developing autonomous vehicles. Furthermore, granular map data is the basic requirement for establishing autonomous vehicles. Significant R&D expenditure should be supported by early monetization through connectivity features and services (see also Chapter III.A. “New service and business models”).
� Adapt the existing OEM business model based on the new technological features in order to find ways of commercializing on the huge amounts of data generated by the thousands of autonomously driving trucks on public roads. Moreover, the business model should be flexible enough to embrace future technologies such as electric drives.
With regard to the environmental factors, several aspects will influence the timing of the transition to self-driving trucks on public roads. Regulators and relevant authorities should work to:
� Bring about changes to current national regulations and legal environments, especially road regulation and type approval. Regulators are required to grant the OEMs permission to test and further develop their vehicles under real conditions. National laws, such as the US’ Road Traffic Act (RTA), must be changed so that drivers will be allowed to take their hands off the steering wheel while in motion.
� Further improve public perception and consumer acceptance of autonomous vehicles. Consumers already find ADAS features very useful and are willing to give up car control (e.g., one-third of new car buyers would allow their connected car to keep them from exceeding the speed limit). And while people are generally open to autonomous driving, there are significant regional differences where autonomous trucks could face resistance from policymakers as well as the public.

67
Open questions on the road ahead
The exact pace and magnitude of the shift toward fully autonomous trucks remain uncertain. The answers to several questions will determine what the truck market and the long-haul sector look like 15 years from now:
� Will all OEMs be capable of stemming the technical challenges and standing the often protracted regulatory change processes?
� With thousands of autonomously driving trucks on public highways, the question of how to solve the “problem of the last mile” (e.g., from leaving the highway to the final destination) still remains unsolved and potential solutions need to be discussed.
� And finally, when all these challenges have been overcome, will the advancements lead to increasing sales as transportation volume shifts toward the street?
It appears that with all the advancements that have been achieved, many opportunities exist for truck OEMs and other stakeholders to gain a significant competitive advantage in being able to shape the future of autonomous trucks in the industry and beyond.
Deep dives on key industry topics – III.C. Autonomous driving

Contacts
Detlev Mohr is a Director in McKinsey’s Stuttgart office. [email protected]
Bernd Heid is a Director in McKinsey’s Cologne [email protected]
Dago Diedrich is a Principal in McKinsey’s Düsseldorf [email protected]
Daniel Hannemann is a Principal in McKinsey’s Stuttgart [email protected]
Markus Forsgren is a Principal in McKinsey’s Stockholm office. [email protected]
Matthias Kässer is an Associate Principal in McKinsey’s Munich office. [email protected]
Johannes Wojciak is an Engagement Manager in McKinsey’s Munich office. [email protected]
Sebastian Küchler is an Engagement Manager in McKinsey’s Munich office. [email protected]
68 Gearing up for growth – future perspectives on the global truck market

Advanced IndustriesMay 2016 – second editionCopyright © McKinsey & Company Design contact: Visual Media Europewww.mckinsey.com