GEARING UP FOR COMPETITIVENESS - Asian … · · 2016-09-01Gearing up for competitiveness: The...
117
ASIAN DEVELOPMENT BANK GEARING UP FOR COMPETITIVENESS THE ROLE OF PLANNING, GOVERNANCE, AND FINANCE IN SMALL AND MEDIUM-SIZED CITIES IN SOUTH ASIA
Transcript of GEARING UP FOR COMPETITIVENESS - Asian … · · 2016-09-01Gearing up for competitiveness: The...
ASIAN DEVELOPMENT BANK
GEARING UP FOR COMPETITIVENESSTHE ROLE OF PLANNING, GOVERNANCE, AND FINANCE IN SMALL AND MEDIUM-SIZED CITIES IN SOUTH ASIA

ASIAN DEVELOPMENT BANK
Creative Commons Attribution 3.0 IGO license (CC BY 3.0 IGO)
© 2016 Asian Development Bank6 ADB Avenue, Mandaluyong City, 1550 Metro Manila, PhilippinesTel +63 2 632 4444; Fax +63 2 636 2444www.adb.org
Some rights reserved. Published in 2016. Printed in the Philippines.
ISBN 978-92-9257-302-7 (Print), 978-92-9257-303-4 (PDF)Publication Stock No. BKK157568
Cataloging-In-Publication Data
Asian Development Bank. Gearing up for competitiveness: The role of planning, finance, and governance in small and medium-sized cities in South Asia.Mandaluyong City, Philippines: Asian Development Bank, 2016.
1. Governance. 2. Sri Lanka. 3. Bangladesh. 4. Nepal. I. Asian Development Bank.
The views expressed in this publication are those of the authors and do not necessarily reflect the views and policies of the Asian Development Bank (ADB) or its Board of Governors or the governments they represent.
ADB does not guarantee the accuracy of the data included in this publication and accepts no responsibility for any consequence of their use. The mention of specific companies or products of manufacturers does not imply that they are endorsed or recommended by ADB in preference to others of a similar nature that are not mentioned.
By making any designation of or reference to a particular territory or geographic area, or by using the term “country” in this document, ADB does not intend to make any judgments as to the legal or other status of any territory or area.
This work is available under the Creative Commons Attribution 3.0 IGO license (CC BY 3.0 IGO) https://creativecommons.org/licenses/by/3.0/igo/. By using the content of this publication, you agree to be bound by the terms of this license.
This CC license does not apply to non-ADB copyright materials in this publication. If the material is attributed to another source, please contact the copyright owner or publisher of that source for permission to reproduce it. ADB cannot be held liable for any claims that arise as a result of your use of the material.
Attribution—You should always acknowledge ADB as the source using the following format:[Author]. [Year of publication]. [Title of the work in italics]. [City of publication]: [Publisher]. © ADB. [URL or DOI]
[license].
Translations—Any translations you create should carry the following disclaimer:Originally published by ADB in English under the title [title in italics]. © ADB. [URL or DOI] [license]. The quality of
the translation and its coherence with the original text is the sole responsibility of the translator. The English original of this work is the only official version.
Adaptations—Any adaptations you create should carry the following disclaimer:This is an adaptation of an original work titled [title in italics]. © ADB. [URL or DOI][license]. The views expressed
here are those of the authors and do not necessarily reflect the views and policies of ADB or its Board of Governors or the governments they represent. ADB does not endorse this work or guarantee the accuracy of the data included in this publication and accepts no responsibility for any consequence of their use.
Please contact [email protected] if you have questions or comments with respect to content, or if you wish to obtain copyright permission for your intended use that does not fall within these terms, or for permission to use the ADB logo.
Notes: In this publication, “$” refers to US dollars. Corrigenda to ADB publications may be found at http://www.adb.org/publications/corrigenda

Contents
Boxes, Figures, and Tables iv
Foreword vi
Acknowledgments vii
About the Authors viii
Abbreviations ix
Executive Summary x
Introduction 1
Chapter 1: Why Planning, Governance, and Finance Matter for City Competitiveness 9
Planning and Competitiveness 9Governance and Competitiveness 17Finance and Competitiveness 23
Chapter 2: Methodology 29
Chapter 3: City Competitiveness Profiles 36
Gazipur, Bangladesh 36Khulna, Bangladesh 45Kurunegala, Sri Lanka 55Pokhara, Nepal 64
Chapter 4: Insights and the Way Forward 72
References 75
AppendixesAppendix 1 – Checklist and Scores for Rating by the Expert Panel 78Appendix 2 – Local Panel Scores 85
Index 86
Boxes, Figures, and Tables
BOXES
1 New York City Economic Development Corporation 92 Singapore’s Targets 103 Wider Role for Planning 114 From City to City-Region: Helsinki Strategic Spatial Plan 135 Key Services Provided by Local Government 196 Definition of Value Capture 237 Types of Value Capture Mechanisms 258 Key Planning Documents – Gazipur City Corporation 379 Key Planning Documents – Khulna 4710 Key Planning Documents – Kurunegala 5711 Key Planning Documents – Pokhara 65
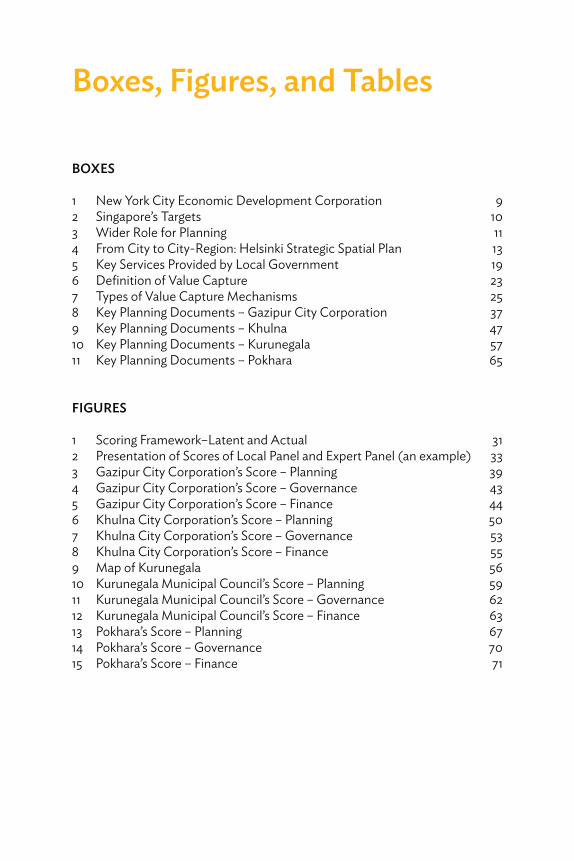
FIGURES
1 Scoring Framework–Latent and Actual 312 Presentation of Scores of Local Panel and Expert Panel (an example) 333 Gazipur City Corporation’s Score – Planning 394 Gazipur City Corporation’s Score – Governance 435 Gazipur City Corporation’s Score – Finance 446 Khulna City Corporation’s Score – Planning 507 Khulna City Corporation’s Score – Governance 538 Khulna City Corporation’s Score – Finance 559 Map of Kurunegala 5610 Kurunegala Municipal Council’s Score – Planning 5911 Kurunegala Municipal Council’s Score – Governance 6212 Kurunegala Municipal Council’s Score – Finance 6313 Pokhara’s Score – Planning 6714 Pokhara’s Score – Governance 7015 Pokhara’s Score – Finance 71
Boxes, Figures, and Tables�v
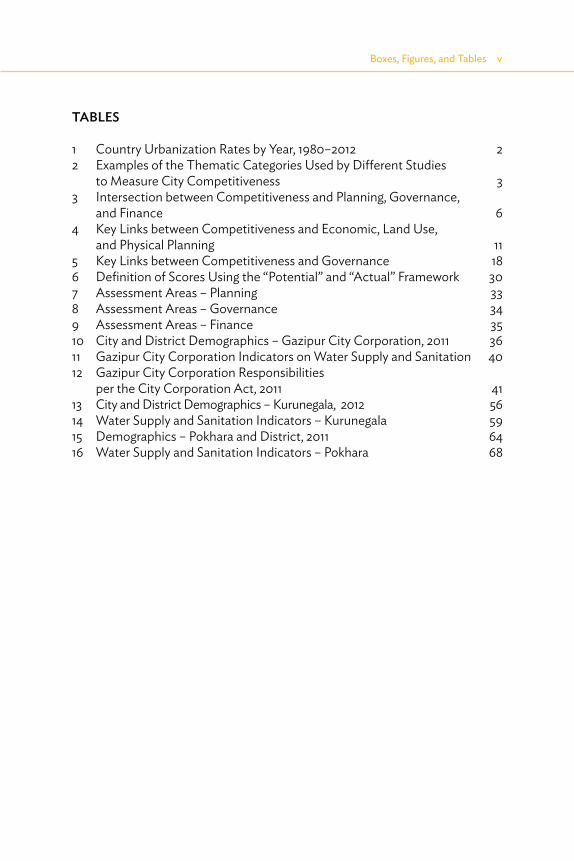
TABLES
1 Country Urbanization Rates by Year, 1980–2012 22 Examples of the Thematic Categories Used by Different Studies
to Measure City Competitiveness 33 Intersection between Competitiveness and Planning, Governance,
and Finance 64 Key Links between Competitiveness and Economic, Land Use,
and Physical Planning 115 Key Links between Competitiveness and Governance 186 Definition of Scores Using the “Potential” and “Actual” Framework 307 Assessment Areas – Planning 338 Assessment Areas – Governance 349 Assessment Areas – Finance 3510 City and District Demographics – Gazipur City Corporation, 2011 3611 Gazipur City Corporation Indicators on Water Supply and Sanitation 4012 Gazipur City Corporation Responsibilities
per the City Corporation Act, 2011 4113 City and District Demographics – Kurunegala, 2012 5614 Water Supply and Sanitation Indicators – Kurunegala 5915 Demographics – Pokhara and District, 2011 6416 Water Supply and Sanitation Indicators – Pokhara 68
Foreword
While there has been a considerable focus on megacities, little research has been undertaken on the competiveness of smaller and medium-sized cities, where much of the growth is taking place. These cities often support the larger ones with their industrial zones, logistics infrastructure, and affordable housing.
For smaller and medium-sized cities to sustain growth and chart their development trajectories, they will require greater emphasis on the quality of planning and institutions and the ability to secure finance for infrastructure. This requires cities to have a deeper understanding of their competitive advantages and ability to position themselves within a regional planning framework that extends beyond municipal boundaries. They will also need to anticipate demand for land and public services, among others.
The Asian Development Bank (ADB) has been working across South Asia to help its partners address the multitude of challenges that urbanization brings. This is being done by strengthening local government and investing in infrastructure. ADB is increasingly engaging with government partners on more complex issues through multisector solutions to help cities and regions unleash their economic potentials. These initiatives include strengthening the linkages between urbanization and regional integration and the development of economic corridors.
This ADB study uses new tools to rate city performance and provides insights into selected cities’ competitiveness through the framework of planning, governance, and finance. It provides insights into these cities’ potential to increase prosperity and quality of life. We hope these insights will be of use to policy-makers, officials, local leaders, and others interested in advancing local and regional economies; and will help to inform our future urban operations.
Hun KimDirector GeneralSouth Asia DepartmentAsian Development Bank
Acknowledgments
The study was funded through two regional capacity development assistance programs of the Asian Development Bank (ADB): Strengthening Knowledge-Driven Development in South Asia (R-CDTA 45282) and Support to Urban Infrastructure Development and Financing (R-CDTA 45102).
The authors would like to express their gratitude to a number of people for their contributions to the study concept, evolution, and review. The expert panel, which advised the authors at key phases, included Mukundan Krishnamachary from India (consultant), Nihal Samaruppuli from Sri Lanka (Board of Investment of Sri Lanka), and Earl Kessler from the United States (consultant). Brian Roberts from the University of Canberra provided early support to the national consultants to collect data and lead city-level discussions, and Marcel Pandin from Indonesia provided inputs on early concepts and direction. Archana Karvande provided support to the team throughout as the assistant planner.
The authors would also like to thank ADB staff who supported the study in different ways. These include Ghambhir Bhatta, Sekhar Bonu, Kamal Dahanayake, Saugata Dasgupta, Ma. Consuelo Garcia, Jingmin Huang, Md. Rafiqul Islam, Hiroyuki Miyazaki, Vijay Padmanabhan, Pamela Puspus, Michelle Sevilla-Ylo, Laxmi Sharma, Priyanka Sood, Ashok Srivistava, Keiichi Tamaki, and Fei Yue.
The authors would like to express gratitude to Edward Lemon of Chreod for peer reviewing the study. The authors would also like to thank the local panels of public and private representatives who came together in each city to discuss their current situation and their vision for the future. Finally, the authors would like to thank the very knowledgeable urban experts in each country who believe in the topic and worked hard to collect data and bring key stakeholders together to discuss their cities. These include Hemantha Jayasundera, Pushkar Pradhan, Nazem Nurul Islam, and Dilip Karmarkar.
About the Authors
Vivian Castro-Wooldridge has been an urban development specialist with the South Asia Department of the Asian Development Bank (ADB) since 2012. She previously worked for the World Bank’s Water and Sanitation Program to improve water supply and sanitation for low-income communities in sub-Saharan Africa and she was formerly in the consulting business. She has worked in over 20 countries and has a master’s degree in urban planning from Columbia University. Vivian’s professional interests include leveraging urbanization for higher growth and quality of life; city, metropolitan, and regional planning; and strengthening local government and utilities. Tatiana Gallego Lizon is director at the Urban Development and Water Division of ADB’s Southeast Asia Department. Prior to this, Tatiana worked in ADB’s South Asia Department, ADB’s Strategy and Policy Department, and the private sector. Tatiana’s areas of interest include competitiveness and city cluster development, city region and metropolitan planning, e-governance and modernization of local government reform initiatives, and urban climate change resilience. Tatiana holds a doctoral degree and a master’s degree in environmental chemical engineering from Imperial College and a PDG in (public) policy studies from the School of Oriental and African Studies.
Abbreviations
ADB – Asian Development BankDMDP – Dhaka Metropolitan Development PlanDOE – Department of EnvironmentFY – fiscal yearGCC – Gazipur City CorporationKCC – Khulna City CorporationKDA – Khulna Development AuthorityKMC – Kurunegala Municipal CouncilKWASA – Khulna Water Supply and Sewerage AuthorityLED – local economic developmentMOFALD – Ministry of Federal Affairs and Local DevelopmentMOUD – Ministry of Urban DevelopmentO&M – operation and maintenancePSMC – Pokhara sub-metropolitan cityPVTDC – Pokhara Valley Town Development CommitteeRAJUK – Rajdhani Unnayan KartripakkhyaUDA – Urban Development Authority

Executive Summary
This study focuses on local government’s role in increasing city competitiveness, particularly in small to medium-sized towns in South Asia. Towns of these sizes are not typically the focus of studies on city competitiveness, and yet they will house an increasingly large portion of South Asia’s population. Improving the investment climate and providing greater opportunities for more people in smaller cities will be crucial to alleviating regional urban poverty and improving the quality of life in these cities.
The challenges associated with haphazard urban development such as congestion, pollution, and poor service delivery are well documented, and various studies on the topic of city competitiveness conclude that there is a strong correlation between competitiveness and infrastructure and quality of life. This study seeks to initiate more systematic thinking on the role of planning, governance, and finance to overcome challenges and drive city competitiveness.
The building blocks of planning, governance, and finance are interlinked. Planning provides the vision and blueprint for development, and is an opportunity for identifying actions to increase competitiveness. Finance bridges the gap between a “plan” and “implementation,” which is critical given the scale of the investment gap in cities in South Asia.*1The third piece of the puzzle, governance with a focus on service delivery, helps ensure that finances are managed soundly and invested wisely to implement a city’s vision. It ensures that systems are in place to deliver basic services such as water supply and sanitation, and to enforce plans, policies, and regulations.
The study recognizes that there are additional factors that contribute to city competitiveness, and for which local government in South Asia is not the leading player. Local government may not play a leading role in regional market integration, for example, or in higher education and its role in developing and attracting talent. Nevertheless, we argue that local government must play a proactive role in supporting a city’s economic strength, particularly through driving the local economic development planning process, understanding its role in the region, and then aligning its development policies, plans, and investments accordingly.
* In India, the investment requirements between 2010 and 2030 are estimated at $1.2 trillion (McKinsey Global Institute 2010).
Executive Summary�xi
The study methodology involved a literature review and development of a tool to rate city performance in driving competitiveness through the lens of planning, governance, and finance. An expert panel was assembled at an early stage to provide guidance and feedback throughout the process with a diverse group of experts from the Board of Investment of Sri Lanka, academics from within the region and outside the region, and consultants with extensive experience working with local government in South Asia. The methodology was tested in four small to medium-sized cities in Bangladesh, Nepal, and Sri Lanka. The case studies highlight the strengths and weaknesses of the cities examined, identify focus areas that can help cities improve their competitiveness, and describe the role of different levels of government in promoting city competitiveness.
From the four case studies it is evident that most cities have plans and policies to guide their urban development. However, these plans are not framed according to a competitiveness vision, which generally requires multisector integration and multi-agency coordination. The plans are also generally too rigid, and lack a clear list of priorities, actionable items, and a means of financing. The findings in the cities illustrate the need to identify the role that cities play, or could play, within the region, as well as the need for better alignment and integration of physical and investment planning, governance, and finance to increase competitiveness.
The findings in the four cities also show that central and regional governments still have a critical role to play in facilitating a local government’s achievement of its vision through (i) delegation (function, finance, and staff) and/or (ii) collaboration and partnership. Local governments need to position themselves to take advantage of the collaboration and facilitation on offer and play an increasingly expansive role to drive city competitiveness.

Introduction
The objective of the study is to better understand how local governments in small and medium-sized cities in Bangladesh, India, Nepal, and Sri Lanka can further contribute to city competitiveness through planning, governance, and finance. A recent study (McKinsey Global Institute 2012) argues that “rapidly expanding cities need healthy finances, strong governance and professional planning.” Looking at these three building blocks—planning, governance, and finance—together is vital because they are interlinked and mutually reinforcing. For example, planning provides the vision and blueprint for development and helps to identify priority investment and finance requirements. Planning and prioritization are important since cities cannot fund everything at once and need to optimize their resources and phase investments.
Finance bridges the gap between a “plan” and “implementation,” which is important given the scale of the investment gap.1 The third piece of the puzzle, governance with a focus on service delivery, helps ensure that finances are managed soundly and invested wisely to implement a city’s vision. It ensures that systems are in place to deliver basic services such as water supply and sanitation, and to enforce plans, policies, and regulations. The complexity of urban development means that the quality of and performance in one of these three functions will significantly impact performance in the other two. Therefore, cities seeking to improve their investment climate and drive their competitiveness must focus on and align all three building blocks: planning, governance, and finance.
Urbanization and EmploymentUrbanization rates in South Asia are low as compared with those in other regions such as East Asia. However, urban agglomeration is increasingly evident in Bangladesh, India, Nepal, and Sri Lanka, the focus countries of this study (see Table 1). India has over 50 cities with a population of 1 million or more, and much of the country’s urban expansion is expected to take place through the absorption of smaller towns or rural areas into its metropolitan areas (Government of India 2011). Even in Sri Lanka, where urbanization is relatively lower than its neighbors and populations are smaller, the government’s spatial and economic vision is toward urban agglomeration with a focus on five metropolitan regions (Government of Sri Lanka 2011).
1 In India, the investment requirements between 2010 and 2030 are estimated at $1.2 trillion (McKinsey Global Institute 2010).

2�Gearing Up for Competitiveness
Throughout the region, there are also a large number of emerging small towns with urban characteristics, but that lack the legal classification of a city;2 or that have recently been classified as cities but with nascent (or absent) local governance structures. In Nepal, for example, the number of municipalities was recently increased from 58 to 191.3 New municipalities throughout the region will require significant support to get the systems in place to manage this population growth, deliver services, and ultimately support the local economy. Urbanization is on an upward trend, and local government needs to provide the best possible conditions for industry, entrepreneurs, and innovators to ensure adequate employment opportunities.
City Competitiveness and Local GovernmentA city competitiveness approach seeks to increase local economic productivity while balancing social and environmental objectives for sustainable growth. The overarching objective is to increase local incomes and living standards and create opportunities for a greater number of people. A more “competitive” city with increasing levels of its citizens’ disposable incomes and demand
2 The criterion used for legal classification of an urban area varies from country to country in South Asia. The type of factors that may be considered include population size, density, economic structure, and revenue generation.
3 In July 2014, 283 village development committees were merged to create 72 new municipalities. A further 61 municipalities were created in December 2014.
Table 1: Country Urbanization Rates by Year, 1980–2012
Urban Population by Year (% total)Country 1980 1999 2004 2013Bangladesh 15 23 25 33India 23 27 29 32Nepal 6 13 15 18Sri Lankaa 19 16 15 18
a The rate of urbanization in Sri Lanka has decreased since 1980. This is due to the government’s definition of urban areas, which stopped including town councils (referred to as pradeshiya sabhas) in 1987, when the provincial councils were established. Some pradeshiya sabhas have urban characteristics with local bodies that deliver basic services and collect property taxes.
Source: World Bank. World Development Indicators.

Introduction�3
for services, should give rise to new, homegrown business opportunities that continue to fuel the economy, in addition to external investments.
There are a number of indexes that establish cities as economic drivers and measure overall city competitiveness. Most of these look at competitiveness holistically, understanding that there are a number of important, interrelated, and diverse elements that help a city to attract business, investment, talent, and visitors. The number and type of categories used in different city competitiveness indexes vary, but they tend to cover topics such as economic strength, the business and regulatory environment, global appeal, governance, infrastructure, social and cultural character, and quality of life issues such as safety and access to public parks (Table 2).
Table 2: Examples of the Thematic Categories Used by Different Studies to Measure City Competitiveness
ADB (2011)
Economist Intelligence Unit Hot Spots 2025
(2013)IBM
(2013)
Urban Competitive Assessment
(World Bank)
World Economic
Forum (2014)City prosperity Economic
strengthMarket Economic
structureInstitutions
Urban governance
Institutional character
Regulations Institutional milieu
Policies and regulation
Quality of life Human capital Talent Human resources
Hard connectivity
Business environment
Financial maturity General business environment
Territorial endowment
Soft connectivitya
Infrastructure Physical capital Infrastructure and connectivity
Social and cultural character
Living environment
Environment and natural hazards
Sector specialization
Global appeal
ADB = Asian Development Bank, IBM = International Business Machines Corporation.a Soft connectivity elements include livability, or quality of life factors, to attract and retain talent; technological
innovation and diffusion; education and training systems; and others.
Source: Asian Development Bank. 2011. Competitive Cities in the 21st Century. Manila; Hot Spots 2025: Benchmarking the Future Competitiveness of Cities; IBM. 2013. ____; World Bank. n.d. Summary of Urban Competitiveness Assessment; World Economic Forum. 2014. The Competitiveness of Cities.

4�Gearing Up for Competitiveness
Why does local government matter? On some issues, central or regional government or even the private sector may have a stronger role to play than local government. So what areas are critical to competitiveness where local government can play a leading and proactive role? These are discussed in more detail below, with a focus on matters for which local government action and performance are important to city competitiveness and where other players are unlikely to fill this role at the required scale.
Infrastructure, quality of life, and service delivery matter. Public authorities at the metropolitan and city level are primarily responsible for providing infrastructure and ensuring a livable urban environment. They have important powers over “land use, transport and traffic, building codes and waste management...with impact on air pollution, energy utilization and conservation, renewable energy use and water conservation” (OECD 2006). Issues such as transport have wide-reaching impacts that can cripple a city if not addressed.
Existing studies generally agree that a city’s physical capital and quality of life issues are correlated with its overall competitiveness. However, a study by Urban Land Institute and Ernst & Young 2013, argues that infrastructure has different objectives in developing and developed economies. In developing economies, “well-planned and well-executed investments offer...the hope of basic facilities for all and a chance to compete in a global marketplace.” In developed economies, “superior and well-maintained infrastructure attracts the best talent as well as dynamic businesses seeking reliable connectivity and a high quality of life for workers.” As an economy develops and its structure shifts, its supporting infrastructure helps to serve different growth objectives that look out as well as in. Cities in South Asia may not, however, always fit into a single category as described above. In fact, within the same city in South Asia one may find two different economies coexisting side by side—one that still requires basic services (e.g., with a proliferation of slums), and one that requires a higher level of services (e.g., with a burgeoning information and communication technology [ICT] sector).
A city’s priorities for improving basic services and more “comfort” services may differ and shift between cities, depending largely on their current economic
What is local government? The institutional framework for planning, management, and service delivery differs between countries and even within countries. The term “local government” is used throughout the report in reference to the main local authority or municipal body responsible for planning, infrastructure development, or delivery of basic services.

Introduction�5
situation and trajectory. Cities that are still grappling with providing basic services, such as 24/7 water supply or storm water drainage to prevent chronic flooding, may need to first focus their energies on these basic challenges to lay the foundation for future competitiveness. As these more basic but important challenges are resolved and the economy shifts from manufacturing to also include services and innovation, experience shows that quality of life issues such as green space and convenient transport tend to increase in importance. However, quality of life issues are dependent on major land use decisions, which cannot be an afterthought because of the scale of planning and land acquisition they may require. Both infrastructure and quality of life issues thus require anticipation of demand, which is lacking in cities in South Asia.
Facilitating local economic development. Linked to local authorities’ contribution to infrastructure, services, and quality of life is their role in facilitating local economic development to help cities live up to their full economic potential. Local government’s role is that of a facilitator, particularly between the public and private sectors, and between relevant public agencies, and to ensure that planning, governance, and finance are operating in tandem to improve the overall investment climate.
An important role for local government is to lead the development of a vision for long-term growth and economic success, in collaboration with firms, local trade associations, and other members of civil society. This economic development vision may then form the basis of a collective vision for branding and marketing a city or city-region. The development of a shared vision can help articulate and communicate a city’s competitive advantage and branding strategy, help to consolidate resources, and strategically target public investments to support the local economy and inclusive growth. Local authorities that drive this process are more likely to reflect the economic vision in their various plans—and ensure that there is no disconnect between the competitiveness strategy, investment priorities, and their development.
Branding is an activity in which local authorities could play a strong role, usually in collaboration with local chambers of commerce or other professional associations. Tourism is often at the heart of branding strategies, but other common branding strategies are those related to the garment sector (e.g., Dhaka and Ho Chi Minh), the ICT sector (e.g., Bangalore and Silicon Valley), and financial centers (e.g., Hong Kong, China; London; and New York). Other cities may not have a dominant sector but can still plan and deliver on an economic vision that instills confidence in investors.
6�Gearing Up for Competitiveness
Building Blocks in PracticeThe contribution of planning, governance, and finance is an area of research that existing studies on competitiveness have not looked at in great detail, and yet they are the building blocks of cities. But how exactly do planning, governance, and finance affect local government’s ability and capacity to improve the overall investment climate and quality of life for its citizens? What seem to be the fundamental issues and the role of local government in the dynamic process of shaping, supporting, and boosting city competitiveness?
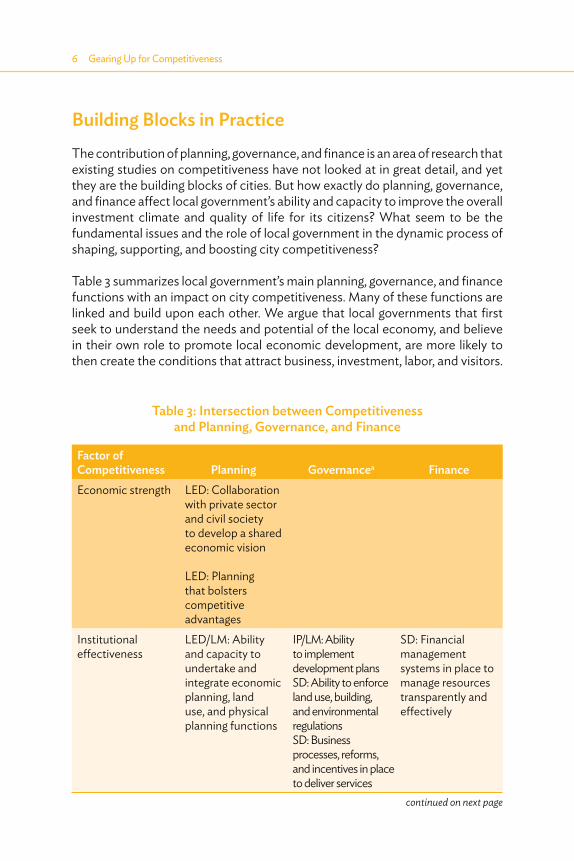
Table 3 summarizes local government’s main planning, governance, and finance functions with an impact on city competitiveness. Many of these functions are linked and build upon each other. We argue that local governments that first seek to understand the needs and potential of the local economy, and believe in their own role to promote local economic development, are more likely to then create the conditions that attract business, investment, labor, and visitors.
continued on next page
Table 3: Intersection between Competitiveness and Planning, Governance, and Finance
Factor of Competitiveness Planning Governancea FinanceEconomic strength LED: Collaboration
with private sector and civil society to develop a shared economic vision
LED: Planning that bolsters competitive advantages
Institutional effectiveness
LED/LM: Ability and capacity to undertake and integrate economic planning, land use, and physical planning functions
IP/LM: Ability to implement development plansSD: Ability to enforce land use, building, and environmental regulationsSD: Business processes, reforms, and incentives in place to deliver services
SD: Financial management systems in place to manage resources transparently and effectively

Introduction�7
Chapter 1 is a more detailed discussion on how planning, governance, and finance affect city competitiveness and the role of local government. It also provides a broad indication of the current situation in South Asia. Chapter 2 presents the methodology for assessing city performance in driving competitiveness through planning, governance, and finance. Chapter 3 includes brief case studies on four cities in South Asia: Gazipur and Khulna in Bangladesh, Pokhara in Nepal, and Kurunegala in Sri Lanka. Chapter 4 concludes with a discussion on the main trends in cities in South Asia and the challenges they face in increasing their competitiveness. The authors also provide broad recommendations for cities to strengthen their planning, governance, and finance functions.
Table 3 continued
Factor of Competitiveness Planning Governancea FinanceInfrastructure IP: Infrastructure
planning that anticipates demand
IP/SD: Providing access to affordable, high-quality services
Mobility, connectivity (IP, LED, LM, SD)
SD: Capacity to fund operation and maintenance
IP: Capacity to fund and attract finance for infrastructure
Quality of life LED/LM/IP: Capacity to plan for social and environmental considerations
SD: Enforcement of social and environmental plans and policies
SD: Availability of resources to implement social and environmental plans and policies
IP = infrastructure provision, LED = local economic development planning, LM = land management, SD = service delivery.a The focus is on governance for service delivery and enforcement of bylaws and policies.
Source: Asian Development Bank.

CHAPTER 1
Why Planning, Governance, and Finance Matter for City Competitiveness
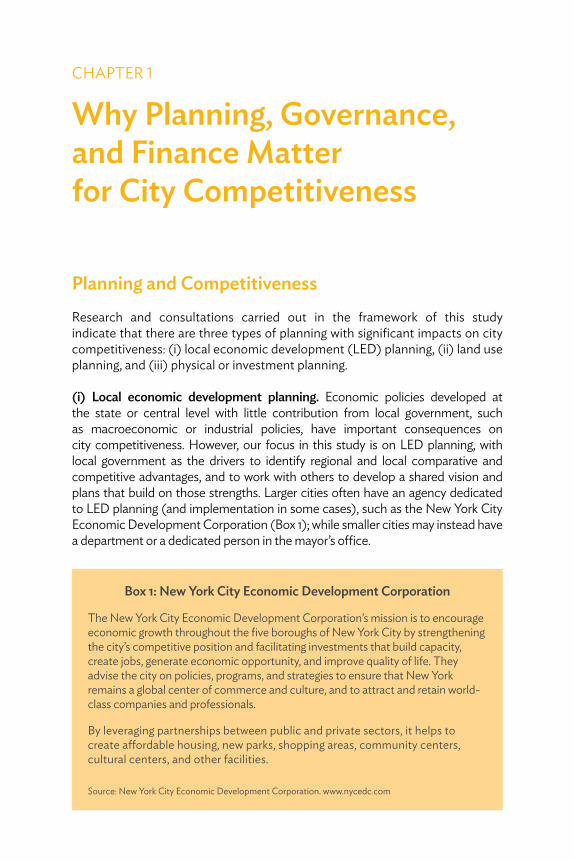
Planning and CompetitivenessResearch and consultations carried out in the framework of this study indicate that there are three types of planning with significant impacts on city competitiveness: (i) local economic development (LED) planning, (ii) land use planning, and (iii) physical or investment planning.
(i) Local economic development planning. Economic policies developed at the state or central level with little contribution from local government, such as macroeconomic or industrial policies, have important consequences on city competitiveness. However, our focus in this study is on LED planning, with local government as the drivers to identify regional and local comparative and competitive advantages, and to work with others to develop a shared vision and plans that build on those strengths. Larger cities often have an agency dedicated to LED planning (and implementation in some cases), such as the New York City Economic Development Corporation (Box 1); while smaller cities may instead have a department or a dedicated person in the mayor’s office.
Box 1: New York City Economic Development Corporation
The New York City Economic Development Corporation’s mission is to encourage economic growth throughout the five boroughs of New York City by strengthening the city’s competitive position and facilitating investments that build capacity, create jobs, generate economic opportunity, and improve quality of life. They advise the city on policies, programs, and strategies to ensure that New York remains a global center of commerce and culture, and to attract and retain world-class companies and professionals.
By leveraging partnerships between public and private sectors, it helps to create affordable housing, new parks, shopping areas, community centers, cultural centers, and other facilities.
Source: New York City Economic Development Corporation. www.nycedc.com
10�Gearing Up for Competitiveness
The role of local government in coordinating and facilitating local economic development is critical for city competitiveness. The goal is not to manipulate markets or to assume a top-down economic planning function. Rather, the goals are to (i) understand the dynamics of a city’s economy, (ii) define the economic vision, (iii) identify demand for investments, and (iv) determine how public resources and public and private partnerships may be best channeled to achieve the vision and further spur growth.
The latter point is essential to helping local government create the best possible conditions for industry, entrepreneurs, and innovators. A sustainable economic vision should also balance environmental and social considerations, as these have direct impacts on sustainability, quality of life, and ultimately, city competitiveness (Box 2). LED planning is challenging and needs to remain flexible, particularly since demographic and economic trends shift over time. But this is why it is critical for local government to seek to understand its local economy and its relationship with other markets—so that it can anticipate demand for land and services.
Local governments need to (i) understand different types of investors’ objectives and the features they are looking for in a city, and (ii) identify what types of businesses and investment the city would like to attract, and is likely to attract, to implement its vision.
To attract entrepreneurs, cities and city leaders must be entrepreneurial themselves.4 To raise their level of competitiveness they must understand their
4 Adapted from interview with Greg Clark, the United Kingdom’s Minister of State for Cabinet Office (Cities and Constitution), in an interview published in the Centre for Livable Cities’ newsletter, Urban Solutions, Issue No. 5 (June 2014). Singapore. Available at www.clc.gov.sg/documents/books/CLC_UrbanSolutionsIssue5.pdf
Box 2: Singapore’s Targets
By 2030, Singapore aims to have at least 80% of its households within a 10-minute walk of a mass rapid transit station, and 90% within 400 meters of a park. This vision for growth, coupled with increased quality of life, requires a clear plan, strong leadership, and interagency collaboration.
Source: Singapore Urban Redevelopment Authority. Draft Master Plan 2013. Singapore.
Why Planning, Governance, and Finance Matter for City Competitiveness �11
competitive advantages and economic potential. This understanding may then be used to develop an informed and strategic economic vision that is linked to and articulated by a city’s other “tools”—land use and physical planning (Box 3)—which may then be geared to boosting city competitiveness. The integration and harmonization of economic, land use, and physical planning lays the foundation for local government to drive city competitiveness (Table 4). In many cases, urbanization is happening or has happened without a blueprint. But not all blueprints are equal. The blueprints themselves must be geared to city competitiveness objectives in order for cities to sustain and increase their dynamism.
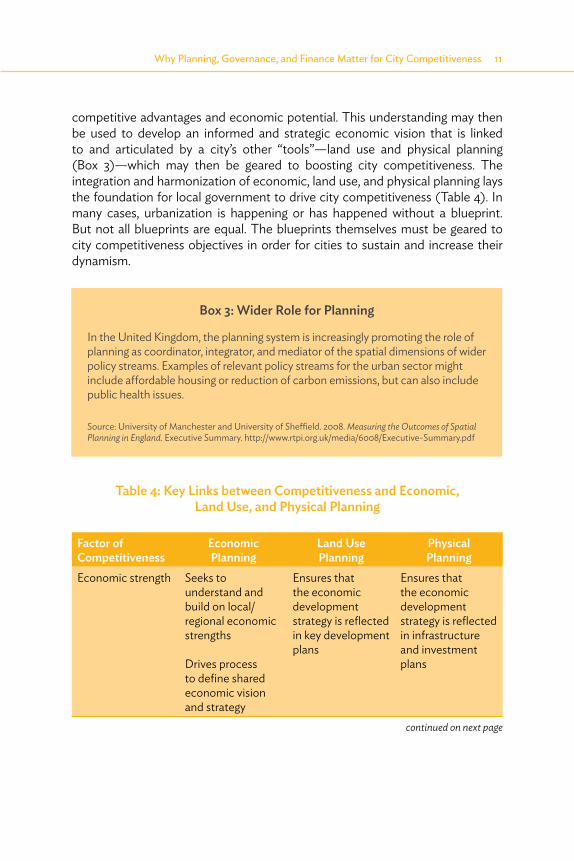
Box 3: Wider Role for Planning
In the United Kingdom, the planning system is increasingly promoting the role of planning as coordinator, integrator, and mediator of the spatial dimensions of wider policy streams. Examples of relevant policy streams for the urban sector might include affordable housing or reduction of carbon emissions, but can also include public health issues.
Source: University of Manchester and University of Sheffield. 2008. Measuring the Outcomes of Spatial Planning in England. Executive Summary. http://www.rtpi.org.uk/media/6008/Executive-Summary.pdf
continued on next page
Table 4: Key Links between Competitiveness and Economic, Land Use, and Physical Planning
Factor of Competitiveness
Economic Planning
Land Use Planning
Physical Planning
Economic strength Seeks to understand and build on local/ regional economic strengths
Drives process to define shared economic vision and strategy
Ensures that the economic development strategy is reflected in key development plans
Ensures that the economic development strategy is reflected in infrastructure and investment plans

12�Gearing Up for Competitiveness
(ii) Land use planning. Land use planning defines the broad uses of land in order to guide balanced, strategic, and plan-led development. A more advanced and comprehensive planning approach seeks to integrate development policies related to land with other policies and programs that also influence a city’s economic, social, and environmental fabric. These development policies might include, for example, policies that (i) maximize land-based revenues, (ii) release public land for public purposes, or (iii) promote mass affordable housing developments in mixed-use developments served by public transportation, to cite a few examples.
Table 4 continued
Factor of Competitiveness
Economic Planning
Land Use Planning
Physical Planning
Institutional effectiveness (capacity)
Plays a coordinating and facilitating role to drive local economic development
Leads the process of defining how land should be used to drive economic growth, promote equity, and protect the environment
Plans for investments that are synchronized with land use plans, are demand based, and will provide economic returns
Infrastructure Determines how limited public resources can best be targeted to support economic development
Identifies partnerships to leverage resources
Ensures that adequate land and rights-of-way are reserved for infrastructure
Practices land pooling for public purposes
Has system in place for planning new infrastructure and expansion
Quality of life Urban form and land use reflect quality of life issues (e.g., pedestrian friendliness, cultural attractions, green space, safety, affordable housing, etc.)
Infrastructure planning considers quality of life issues (e.g., transit times, recreational space, access to services)
Source: Asian Development Bank.

Why Planning, Governance, and Finance Matter for City Competitiveness �13
What is clear is that cities need plans and strategies to guide their spatial development in a manner that both manages population growth and supports the local economy. Cities that try to block growth do not typically succeed (Angel 2012) and should thus embrace and plan for it.
The different indexes consulted on city competitiveness indicate that quality of life issues matter—access to green space, a clean environment, and low commute times—and these are major features that do not just happen organically. They require deliberate land use decisions as well as strategies and the capacity to implement and enforce plans. The latter is discussed in more detail in the subsequent sections on governance.
Not all land use planning outputs have been successful in helping cities to realize their goals. There are many examples of top-down, stand-alone master plans that are too rigid or not easy to use; or for which there is little ownership and financing, perhaps because the exercise was completely outsourced with little local involvement. Emerging experiences suggest that more consultative and multidisciplinary land use plans with clear linkages to the city’s economic vision, investment plans, sector-specific plans, and operating budgets are a smarter way to go in shaping the urban form and supporting city dynamism. The newer, more flexible plans that are emerging set out principles to guide development, or identify focus zones for development linked to the economic vision (e.g., waterfront, clusters, corridors) rather than predetermining the usage of each plot. They may also restrict certain high-impact developments (e.g., industrial parks near environmentally sensitive areas) but leave room for some discretion so that cities can be more reactive to emerging demands and opportunities (Box 4).
Box 4: From City to City-Region: Helsinki Strategic Spatial Plan
Helsinki, the capital city of Finland, has a spatial strategy with a 30-year vision that is updated every 4 years. The strategy is an implementation document for the master plan, which is usually updated every 10 years. For the first time, the 2009 strategy set out guiding principles for future development that look beyond Helsinki’s boundaries to the city-region. This is in line with European Union Territorial Agenda guidelines on spatial planning.
The 4-year review process allows the City Council to decide if the strategy is still relevant for supporting city vitality and competitiveness, and if the Master Plan also requires any revisions.
Source: City of Helsinki. 2009. From City to City-Region: Strategic Spatial Plan. Available at www.hel.fi/hel2/ksv/julkaisut/julk_2009-8.pdf
14�Gearing Up for Competitiveness
(iii) Physical planning. Infrastructure is a key element of competitiveness—and a key function of government. What ultimately matters to business is the quality of services made possible through infrastructure—the quality, reliability, and cost of water, for example—rather than whether the distribution network is in place. But services are precluded by the advance efforts of planning and development of infrastructure.
Investments in infrastructure are imperative if cities are to (i) meet existing demands for basic services, (ii) keep pace with population growth, and (iii) attract business and investment. Companies have a number of factors to consider when deciding where to start or expand their operations. Key among these is the existence, quality, and cost of services from critical infrastructure. Infrastructure deficits can raise the cost of doing business and constrain productivity. Local government has a critical role to play in the provision of value-for-money services with benefits that accrue due to economies of scale. While business and individuals can, in some cases, meet their own needs (for example, for water supply through private wells), this is not efficient and not the way forward for competitive cities. The financing of infrastructure and the quality of services are critical. But adequate infrastructure and services cannot exist without proper planning.
There are basic issues related to physical and infrastructure planning that should be dealt with as a matter of good practice. These issues, which affect the sustainability of the infrastructure, include technical suitability and quality, environmental and social impact assessment, cost–benefit analysis and integration with other infrastructure, and capacity to support operation and maintenance (O&M), among others. There are institutional, financial, and strategic issues that should also be addressed at the early planning and appraisal stage, including (i) institutional clarity for developing and operating infrastructure, (ii) funding sources for O&M, and (iii) whether the priority should be to increase the focus on maintenance of existing assets before investing in new assets.
So what does infrastructure planning that goes beyond traditional infrastructure planning and supports city competitiveness look like? It should, at a minimum, (i) respond to confirmed demand, (ii) support the city’s economic vision, and (iii) have high expected economic returns. These may sound basic, but they are still too often neglected during the planning phase—or, as is often the case with large infrastructure projects worldwide, the benefits tend to be inflated and the costs tend to be underestimated.
Why Planning, Governance, and Finance Matter for City Competitiveness �15
Infrastructure plans should therefore aim to depict more realistic benefits and costs and reflect economic plans and land use plans, all geared to supporting competitiveness. This three-pronged approach (integrated economic, land use, and infrastructure planning) builds a strong foundation for the other steps in the urban development cycle—implementation, operations, enforcement, and reviewing and updating plans. Without a strong blueprint, development will be piecemeal and not at the scale and integration required to support city competitiveness. The linkages between economic planning, land use planning, and physical planning as described above help to ensure that resources are channeled to support aspects of the economy with the greatest potential to spur further economic growth, and that the urban form and infrastructure are deliberate in supporting city competitiveness.
What are the constraints on the use of the planning process to drive city competitiveness in South Asia? As cities in South Asia drive growth in the region and people are progressively concentrated in urban agglomerations, urban planning has, at least on paper, gathered importance across the region. An increasing number of institutions have been established at the national, state, provincial, and metropolitan levels to lead the process. However, urban planning has, in practice, improved little in most cities across South Asia. Most cities are practicing traditional land use planning at best—and not yet developing a more comprehensive spatial planning system based on a comprehensive city information base that links economic development objectives with land use and infrastructure planning. Staff capacity remains an issue. Despite manifestations of economic change, land use and physical planning are rarely preceded by or based on an assessment of economic drivers or proposals for economic planning at the city or metropolitan level. Planning systems tend to be closed rather than open and communicative, and guided more by power than by rational decision making. The ills are complex and involve both processes and institutions.
For starters, the public sector is not typically driving the coordination and facilitation of local economic development. There are institutions with the mandate for spatial planning and service delivery, and for macroeconomic planning (usually at the national or state level), but there is a gap in terms of city-level economic planning. The lack of useful and relevant data on the local and regional economy makes it difficult to develop robust economic plans as well. Cities need to understand the ebbs and flows of people, jobs, ideas, information, products, incomes, and money, but this type of information is not readily available and the cost of collecting reliable data is not negligible.

16�Gearing Up for Competitiveness
Second, planning processes in South Asia are at best consultative and rarely participatory and dynamic. They generally result in detailed land use plans and top-down infrastructure plans, for which (i) demand is yet to be determined or is overly optimistic, (ii) priorities may or may not be defined, and (iii) funds for implementation are not yet allocated. Master plans are often too rigid and static. Rather than being a useful document to guide a dynamic process with regular decision-making intervals set during the planning horizon, plans are more often prepared by a consultant and then only reviewed and updated once they have expired. They often reflect a long wish list rather than an implementable, phased plan. Local government ownership of the plan is often missing. Poor infrastructure planning, reflected in the often-repeated phrase “provide the infrastructure and they will come,” has led to unjustified and inefficient investments in the region, which often do not address the needs of the poor, the middle class, or the private sector.
Third, while overcapacity of infrastructure should be carefully avoided, being able to anticipate growth is necessary. The critical issue is properly capturing land value increases arising from public investments. Such land value capture policies need to be adopted from the planning phase. It is perhaps easier to convince landowners of the investment’s benefits and their required contribution prior to construction, rather than trying to persuade them retroactively. Politicians are also less likely to push through policies that are unfavorable with voters, such as retroactive value capture. This discussion should therefore be integral to the planning phase, particularly for larger investments such as mass rapid transit systems where the impact on property prices can be significant, and therefore the opportunity to recover the cost of investment is also significant (see section on finance for more discussion on value capture mechanisms).
Fourth, the role of local authorities in implementing or enforcing plans is not always well thought through during the planning phase; and/or staff capacity and numbers are inadequate and the institutional framework for enforcement is dysfunctional, with multiple agencies responsible for the same enforcement function. A disconnect between planning and operations can be observed when the institution charged with land use, physical, or transport planning falls into a different tier of government (e.g., national, state, or metropolitan level) than the municipal body charged with delivering services and implementing plans. It is critical to bridge this gap between planning and service delivery from the planning stage, ensuring that there is clarity regarding responsibilities for plan implementation and O&M, including funding, and that the financial and human capacity will be in place to maintain and operate the infrastructure.
Why Planning, Governance, and Finance Matter for City Competitiveness �17
Within this context, this study seeks to examine the current situation in four cities in South Asia and shed light on the following set of questions:
What are the predominant institutions, policies, and tools for economic, land use, and physical planning in South Asia?What are the key impediments to effective planning for shaping sustainable urban development in the sample cities?Within the current context, how can planning strengthen city competitiveness?
Governance and CompetitivenessWhy governance matters. The existing work on city competitiveness highlights the relationship between improving a city’s investment climate and local government institutional policies and capacities. The range of issues that affect the behavior and outcomes of local government is vast. The study identified two main areas of urban governance that have a direct relationship with city competitiveness: (i) service delivery; and (ii) enforcement of development plans, policies, and regulations. We use the term “governance” in this study to refer to the quality of management systems in the institutions and of outcomes in terms of delivering services and enforcing plans, policies, and regulations.
Issues such as democracy and devolution also have an impact on local government effectiveness. However, the relationship with competitiveness is complex since one finds examples of competitive cities with both high and low levels of democracy and devolution. For this reason, we focus the discussion on service delivery and enforcement of plans, policies, and regulations (Table 5). These are areas where local government can perhaps more readily take action given the constraints of the broader institutional landscape.5
5 This does not downplay the importance of democracy, devolution, and decentralization. Various studies confirm that these do have an impact on government effectiveness, but a detailed analysis on these complex topics are outside the scope of this study?
18�Gearing Up for Competitiveness
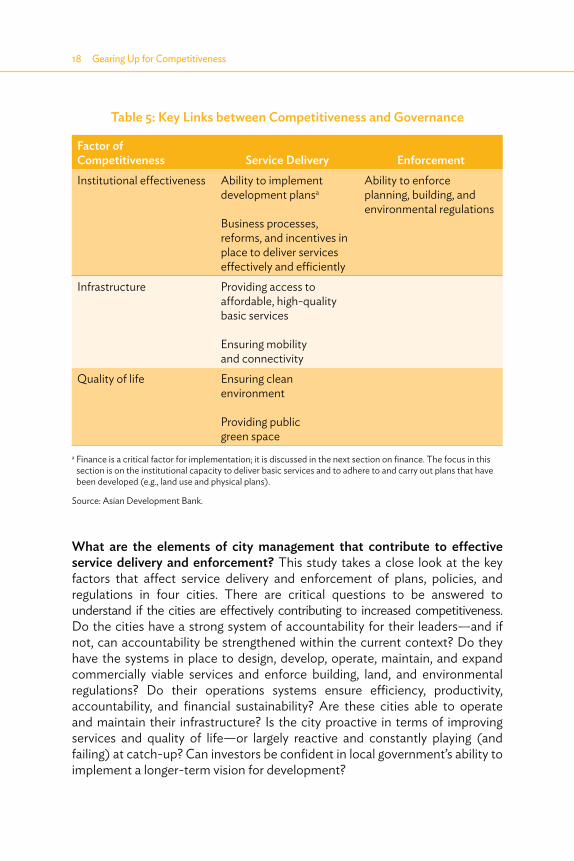
What are the elements of city management that contribute to effective service delivery and enforcement? This study takes a close look at the key factors that affect service delivery and enforcement of plans, policies, and regulations in four cities. There are critical questions to be answered to understand if the cities are effectively contributing to increased competitiveness. Do the cities have a strong system of accountability for their leaders—and if not, can accountability be strengthened within the current context? Do they have the systems in place to design, develop, operate, maintain, and expand commercially viable services and enforce building, land, and environmental regulations? Do their operations systems ensure efficiency, productivity, accountability, and financial sustainability? Are these cities able to operate and maintain their infrastructure? Is the city proactive in terms of improving services and quality of life—or largely reactive and constantly playing (and failing) at catch-up? Can investors be confident in local government’s ability to implement a longer-term vision for development?
Table 5: Key Links between Competitiveness and Governance
Factor of Competitiveness Service Delivery EnforcementInstitutional effectiveness Ability to implement
development plansa
Business processes, reforms, and incentives in place to deliver services effectively and efficiently
Ability to enforce planning, building, and environmental regulations
Infrastructure Providing access to affordable, high-quality basic services
Ensuring mobility and connectivity
Quality of life Ensuring clean environment
Providing public green space
a Finance is a critical factor for implementation; it is discussed in the next section on finance. The focus in this section is on the institutional capacity to deliver basic services and to adhere to and carry out plans that have been developed (e.g., land use and physical plans).
Source: Asian Development Bank.
Why Planning, Governance, and Finance Matter for City Competitiveness �19
The latter is perhaps as important as the city’s current situation. Cities need to demonstrate that they have a plan for gradual and predictable improvements.6 It is true that some investors may be looking to invest in cities where they can operate under the radar because officials are not concerned with enforcing plans and regulations (e.g., illegal dumping of industrial waste). We argue that this is a short-term view and this behavior will ultimately have a negative impact on city competitiveness. Cities aiming to be competitive take a longer view.
Governance and competitiveness. In the preceding section on planning, we established the importance of infrastructure on the investment climate. The creation of infrastructure is crucial but not an end in itself. In fact, what happens post-construction is often not given due consideration during the planning phase. The agency responsible for maintaining the infrastructure must ensure that the infrastructure performs well and that services can be sustained in the long term at a reasonable cost. This O&M cycle requires proper management systems and adequate human and financial resources to operate and maintain water supply networks, wastewater treatment plants, landfills, transportation systems, and public parks. Local government may enter into partnership with the private sector for some part or all of the O&M—but local government is ultimately responsible for ensuring that services are delivered to all citizens (Box 5).
For some industries, the cost and quality of services such as water supply is an important input factor in its business model. For others, quality of life issues for employees, such as efficient public transport, public safety, and green space, may be important for attracting and retaining qualified staff. The quality of services is directly related to quality of life issues such as a clean, livable, and safe environment. Proper management of wastewater and solid waste is key
6 The Economist Intelligence Unit Hot Spots 2025 index (2013) weighs a city’s current and potential plans for infrastructure (public transport and telecommunications).
Box 5: Key Services Provided by Local Government
There are a number of services provided by local government that are particularly important for city competitiveness. These include water supply, sanitation, solid waste, public transport, and public spaces (e.g., parks or plazas). There are other services that are critical for business productivity, such as electricity and telecommunications. However, these are not typically provided by local government and hence are not the focus of the study.
Source: Asian Development Bank.
20�Gearing Up for Competitiveness
to maintaining a clean and healthy environment. Street lighting can add to a sense of security. Public transport systems that are convenient and affordable contribute to general mobility and connectivity. They contribute to quality of life by reducing commute time and/or increasing convenience. The Economist Intelligence Unit (EIU) Hot Spots index (2013) gives great import to the quality of public transport systems for city competitiveness. Public transport is not only a solution for low-income persons. In fact, the highest score for this EIU indicator is based on whether top executives use public transport systems. Service delivery matters for competitiveness because it affects the private sector’s location decisions and productivity, and services are critical to quality of life. Local government needs to have the leadership, professional systems, and capacity to deliver.
In addition to providing services, cities must have the willingness, capacity, and systems to enforce development plans and policies. There is little point in having robust and comprehensive plans and policies to guide competitive development if cities are unable to implement and continuously enforce them. The enforcement issues that are typically the responsibility of local government are
(i) regulations, policies, and plans related to planning (e.g., development type, floor area ratio, and height);
(ii) building codes (i.e., standards for design and construction); and (iii) environmental regulations (e.g., discharge of effluent into water bodies).
Environmental considerations are usually incorporated into planning regulations (e.g., high impact uses prohibited in proximity to sensitive areas) and into building codes (e.g., requirement for sanitation infrastructure). Local government’s ability to enforce development plans and policies sends a clear message on the predictability of government behavior and its capacity to follow through on a longer-term vision.
…cities must have the willingness and capacity and systems to enforce development plans and policies.
Operating and maintaining infrastructure; delivering quality services; and enforcing development policies, plans, and regulations requires professional skills and systems for competitive urban management. Skills and systems are needed for activities such as asset management, information management, human resources development, and financial management, and for processing applications for developer’s permits. Citizens also increasingly expect local government to be more accountable for the results achieved with taxpayer

Why Planning, Governance, and Finance Matter for City Competitiveness �21
money, but performance is not likely to improve without the supporting institutional frameworks, incentives, and systems.
There are a number of basic elements that influence local government effectiveness in delivering services and enforcing plans, policies, and regulations. In the four cities included in the study, we assess whether there is (i) clarity in roles and responsibilities between relevant agencies, and (ii) accountability of city leaders. A clear mandate and incentives to perform are critical if local government is to contribute effectively to city competitiveness. The institutional framework that helps achieve accountability in a given context may vary. A study comparing service delivery in 44 United States (US) cities found that of all the factors influencing efficiency, the one that mattered the most was whether the city had a city manager versus an elected mayor (Moore et al 2001). This US study found that cities with city managers are far more likely to be efficient. However, a McKinsey study looking at the city governance situation in India advocates for a city governance system with empowered mayors (political skills) that have long tenures and clear accountability, supported by a commissioner (administrative and technical skills) (McKinsey Global Institute 2010). The common theme is that cities need continuity in leadership, and political, technical, and management know-how at the top. Political skills are needed to navigate and provide leadership among many competing interests. Technical skills are needed to ensure that projects, programs, and policies are sound. Administrative skills are critical to ensuring that systems run well. A mayor–commissioner structure may be a good solution in many cities for ensuring that all three sets of skills are available to manage the city.
Current situation in South Asia. Cities in the region are generally poorly managed, with few achieving reasonable levels of service delivery for water supply, sanitation, or solid waste management. In India, for example, a 2011 study published by the Federation of Indian Chambers of Commerce and Industry reports that (i) urban water supply is estimated to be available on average about 2.9 hours a day, (ii) nonrevenue water (physical and commercial losses) accounts for 40%–60% of total water supply, and (iii) less than 20% of wastewater is treated. Sri Lanka is doing well in terms of urban access figures for improved water supply (91%) and improved sanitation (87%) (World Bank 2012), but data on the quality of these services is not readily available. Sri Lanka also does not have any environmentally acceptable landfills for solid waste disposal and toxic waste is not safely disposed (World Bank 2012). The other countries in South Asia are facing similar challenges. In Bangladesh, about 40% of the urban population receives intermittent piped water supply. Only the capital city of Dhaka has a sewer system and it only serves about 30% of Dhaka’s
22�Gearing Up for Competitiveness
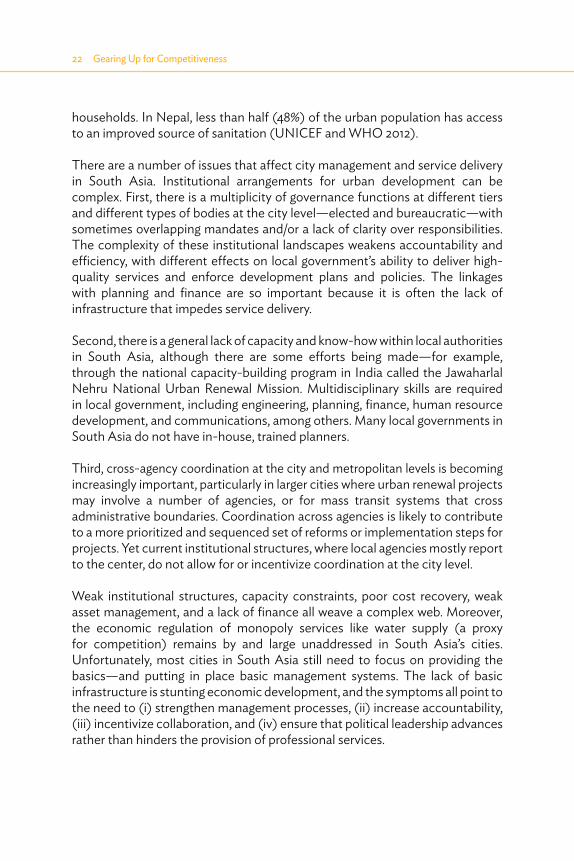
households. In Nepal, less than half (48%) of the urban population has access to an improved source of sanitation (UNICEF and WHO 2012).
There are a number of issues that affect city management and service delivery in South Asia. Institutional arrangements for urban development can be complex. First, there is a multiplicity of governance functions at different tiers and different types of bodies at the city level—elected and bureaucratic—with sometimes overlapping mandates and/or a lack of clarity over responsibilities. The complexity of these institutional landscapes weakens accountability and efficiency, with different effects on local government’s ability to deliver high-quality services and enforce development plans and policies. The linkages with planning and finance are so important because it is often the lack of infrastructure that impedes service delivery.
Second, there is a general lack of capacity and know-how within local authorities in South Asia, although there are some efforts being made—for example, through the national capacity-building program in India called the Jawaharlal Nehru National Urban Renewal Mission. Multidisciplinary skills are required in local government, including engineering, planning, finance, human resource development, and communications, among others. Many local governments in South Asia do not have in-house, trained planners.
Third, cross-agency coordination at the city and metropolitan levels is becoming increasingly important, particularly in larger cities where urban renewal projects may involve a number of agencies, or for mass transit systems that cross administrative boundaries. Coordination across agencies is likely to contribute to a more prioritized and sequenced set of reforms or implementation steps for projects. Yet current institutional structures, where local agencies mostly report to the center, do not allow for or incentivize coordination at the city level.
Weak institutional structures, capacity constraints, poor cost recovery, weak asset management, and a lack of finance all weave a complex web. Moreover, the economic regulation of monopoly services like water supply (a proxy for competition) remains by and large unaddressed in South Asia’s cities. Unfortunately, most cities in South Asia still need to focus on providing the basics—and putting in place basic management systems. The lack of basic infrastructure is stunting economic development, and the symptoms all point to the need to (i) strengthen management processes, (ii) increase accountability, (iii) incentivize collaboration, and (iv) ensure that political leadership advances rather than hinders the provision of professional services.
Why Planning, Governance, and Finance Matter for City Competitiveness �23
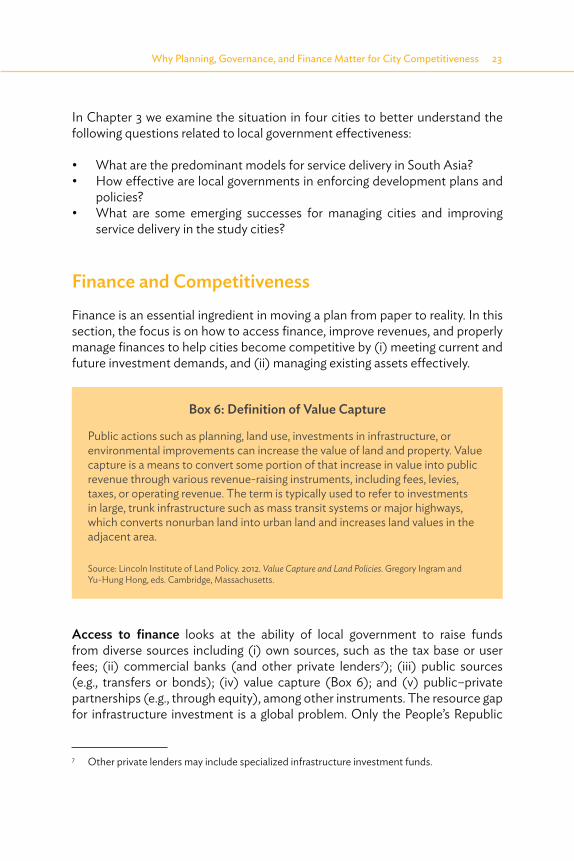
In Chapter 3 we examine the situation in four cities to better understand the following questions related to local government effectiveness:
What are the predominant models for service delivery in South Asia?How effective are local governments in enforcing development plans and policies? What are some emerging successes for managing cities and improving service delivery in the study cities?
Finance and CompetitivenessFinance is an essential ingredient in moving a plan from paper to reality. In this section, the focus is on how to access finance, improve revenues, and properly manage finances to help cities become competitive by (i) meeting current and future investment demands, and (ii) managing existing assets effectively.
Access to finance looks at the ability of local government to raise funds from diverse sources including (i) own sources, such as the tax base or user fees; (ii) commercial banks (and other private lenders7); (iii) public sources (e.g., transfers or bonds); (iv) value capture (Box 6); and (v) public–private partnerships (e.g., through equity), among other instruments. The resource gap for infrastructure investment is a global problem. Only the People’s Republic
7 Other private lenders may include specialized infrastructure investment funds.
Box 6: Definition of Value Capture
Public actions such as planning, land use, investments in infrastructure, or environmental improvements can increase the value of land and property. Value capture is a means to convert some portion of that increase in value into public revenue through various revenue-raising instruments, including fees, levies, taxes, or operating revenue. The term is typically used to refer to investments in large, trunk infrastructure such as mass transit systems or major highways, which converts nonurban land into urban land and increases land values in the adjacent area.
Source: Lincoln Institute of Land Policy. 2012. Value Capture and Land Policies. Gregory Ingram and Yu-Hung Hong, eds. Cambridge, Massachusetts.
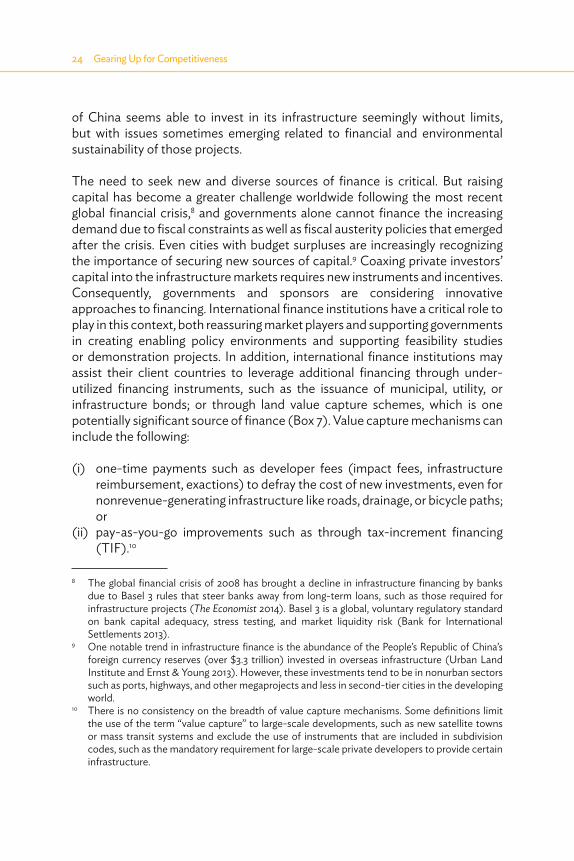
24�Gearing Up for Competitiveness
of China seems able to invest in its infrastructure seemingly without limits, but with issues sometimes emerging related to financial and environmental sustainability of those projects.
The need to seek new and diverse sources of finance is critical. But raising capital has become a greater challenge worldwide following the most recent global financial crisis,8 and governments alone cannot finance the increasing demand due to fiscal constraints as well as fiscal austerity policies that emerged after the crisis. Even cities with budget surpluses are increasingly recognizing the importance of securing new sources of capital.9 Coaxing private investors’ capital into the infrastructure markets requires new instruments and incentives. Consequently, governments and sponsors are considering innovative approaches to financing. International finance institutions have a critical role to play in this context, both reassuring market players and supporting governments in creating enabling policy environments and supporting feasibility studies or demonstration projects. In addition, international finance institutions may assist their client countries to leverage additional financing through under-utilized financing instruments, such as the issuance of municipal, utility, or infrastructure bonds; or through land value capture schemes, which is one potentially significant source of finance (Box 7). Value capture mechanisms can include the following:
(i) one-time payments such as developer fees (impact fees, infrastructure reimbursement, exactions) to defray the cost of new investments, even for nonrevenue-generating infrastructure like roads, drainage, or bicycle paths; or
(ii) pay-as-you-go improvements such as through tax-increment financing (TIF).10
8 The global financial crisis of 2008 has brought a decline in infrastructure financing by banks due to Basel 3 rules that steer banks away from long-term loans, such as those required for infrastructure projects (The Economist 2014). Basel 3 is a global, voluntary regulatory standard on bank capital adequacy, stress testing, and market liquidity risk (Bank for International Settlements 2013).
9 One notable trend in infrastructure finance is the abundance of the People’s Republic of China’s foreign currency reserves (over $3.3 trillion) invested in overseas infrastructure (Urban Land Institute and Ernst & Young 2013). However, these investments tend to be in nonurban sectors such as ports, highways, and other megaprojects and less in second-tier cities in the developing world.
10 There is no consistency on the breadth of value capture mechanisms. Some definitions limit the use of the term “value capture” to large-scale developments, such as new satellite towns or mass transit systems and exclude the use of instruments that are included in subdivision codes, such as the mandatory requirement for large-scale private developers to provide certain infrastructure.
Why Planning, Governance, and Finance Matter for City Competitiveness �25
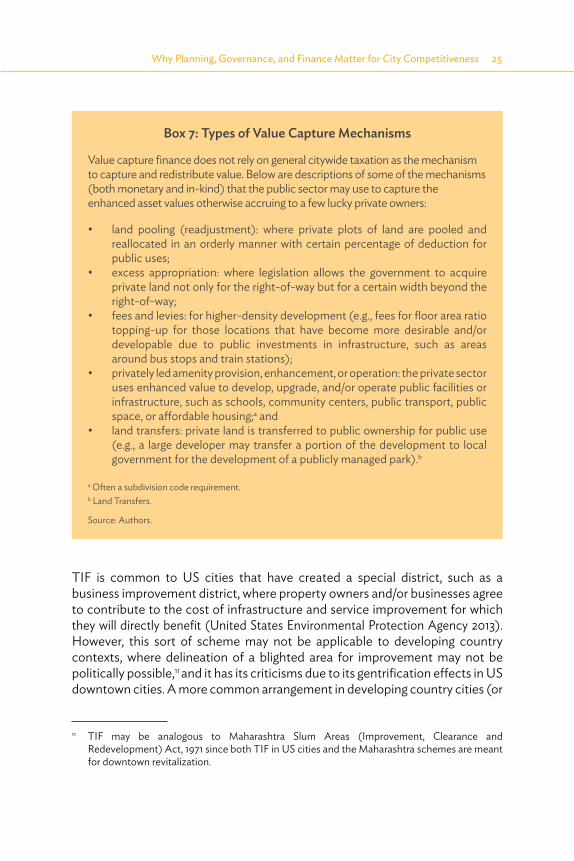
TIF is common to US cities that have created a special district, such as a business improvement district, where property owners and/or businesses agree to contribute to the cost of infrastructure and service improvement for which they will directly benefit (United States Environmental Protection Agency 2013). However, this sort of scheme may not be applicable to developing country contexts, where delineation of a blighted area for improvement may not be politically possible,11 and it has its criticisms due to its gentrification effects in US downtown cities. A more common arrangement in developing country cities (or
11 TIF may be analogous to Maharashtra Slum Areas (Improvement, Clearance and Redevelopment) Act, 1971 since both TIF in US cities and the Maharashtra schemes are meant for downtown revitalization.
Box 7: Types of Value Capture Mechanisms
Value capture finance does not rely on general citywide taxation as the mechanism to capture and redistribute value. Below are descriptions of some of the mechanisms (both monetary and in-kind) that the public sector may use to capture the enhanced asset values otherwise accruing to a few lucky private owners:
land pooling (readjustment): where private plots of land are pooled and reallocated in an orderly manner with certain percentage of deduction for public uses;excess appropriation: where legislation allows the government to acquire private land not only for the right-of-way but for a certain width beyond the right-of-way;fees and levies: for higher-density development (e.g., fees for floor area ratio topping-up for those locations that have become more desirable and/or developable due to public investments in infrastructure, such as areas around bus stops and train stations); privately led amenity provision, enhancement, or operation: the private sector uses enhanced value to develop, upgrade, and/or operate public facilities or infrastructure, such as schools, community centers, public transport, public space, or affordable housing;a and land transfers: private land is transferred to public ownership for public use (e.g., a large developer may transfer a portion of the development to local government for the development of a publicly managed park).b
a Often a subdivision code requirement.b Land Transfers.
Source: Authors.
26�Gearing Up for Competitiveness
adjacent areas) are industrial estates whereby the developer creates value for industries through infrastructure development and provides plots in exchange for fees and charges. In the case of special economic zones, the government subsidizes some of the costs.
Value capture mechanisms are usually discussed in the context of large-scale transportation projects and/or land pooling (readjustment) schemes, which would enable large-scale real estate development and generate revenues by properly capturing appreciated land values. Value capture mechanisms are meant to manage, to the extent possible and reasonable, the windfall gains of public investments, which makes certain locations more desirable, and accrue to a lucky few private parties in the form of increased land prices. While technical justification and economic merit are clear and significant, making value capture mechanisms work is often more about political maneuvering and bargaining, and consensus building among stakeholders, particularly where there is likely to be strong opposition to such an initiative. The key is to create win–win situations that would not be possible without the whole package: investment plus value capture mechanism.
Revenue streams of local government are generally used for operation and maintenance (O&M). In addition to O&M costs, in some cases, revenue may be sufficient to fund new infrastructure or system expansion. Sources of revenue can be (i) external—such as transfers from higher tiers of government; and (ii) own source—such as from property, business, and sales tax, and from fees for services, licenses, and permits. Local authorities may have additional sources of revenue (from leasing properties and other assets, for example). Local authorities should be making continuous efforts to increase their own-source revenue base, since grants are limited and can be unpredictable, and the continuous resource needs for O&M are so great.
In the four case studies, we examine predictability of their revenue streams and the dependence of local government on grants and subsidies. We examine whether they have well-functioning and up-to-date property valuation systems linked to their tax systems. We look at how effectively they bill and collect for services and whether they are generally committed to increasing their own-source revenue.
Financial management systems include the range of interrelated activities—budgeting, auditing, accounting, and reporting—that affect the efficient and effective management of local government funds. Professional and transparent systems help ensure that funds are managed well, but they also provide
Why Planning, Governance, and Finance Matter for City Competitiveness �27
important data that can be used to analyze and track performance, and for decision-making and planning purposes. There are industry standards for financial management in local government, which we assess in the four cities. These include (i) adequate production, upkeep, and dissemination of financial records and information to meet decision-making control, management, and reporting purposes; (ii) internal and external scrutiny and auditing; and (iii) predictability and control in budget execution.
Financial autonomy looks at the discretion of the local authority (as compared with higher levels of government) to set, collect, and retain property taxes, and to decide how to invest its revenue. Financial autonomy is important for understanding a local government’s constraints in improving its financial situation.
The link between finance, planning, and governance cannot be overlooked. Infrastructure investors (i) require a clear and viable plan for the investment (the “planning” element); (ii) examine past performance and present capacity of the implementing agency (the “governance” element); and (iii) typically have conditions related to institutional performance, including financial performance, to give comfort that the project will be implemented, managed well, and achieve expected returns. Commercial banks will only lend to a public sector entity at competitive rates if a project’s risk is perceived to be low. If the risk of default is high, investors will not be interested, or the terms of the loan will not be favorable.
In any case, local governments need to develop a stronger connection between the cost of infrastructure and the benefits that flow from these investments (Bosworth and Milusheva 2011). In their paper Innovations in U.S. Infrastructure Financing: An Evaluation, Bosworth and Milusheva argue that cities in the United States concentrate excessively on securing free federal funds for infrastructure with largely local benefits. Local beneficiaries generally support expansion but are less inclined to pay for its use. The consequence is that maintenance is inadequate. This situation is not limited to the United States. Local governments in many parts of the world need to be more strategic and committed to establishing demand and securing user contributions, through user fees, taxes, and value capture mechanisms as discussed earlier.
Current situation in South Asia. In many South Asian countries, growth has preceded physical infrastructure development. India, for instance, has estimated the gap to be of the order of $1 trillion.12 In many cities, property
12 India’s Twelfth Five Year Plan, 2012–2017 identifies investment need of about $1 trillion in order to bridge the deficit.

28�Gearing Up for Competitiveness
tax is still a largely untapped source of revenue. Cadastral databases need to be updated and digitized and integrated with a transparent and consistent land valuation method. In many cities, property values are underreported or negotiated in order to pay lower taxes. The concept of value capture is largely new for cities in South Asia with a few exceptions. In terms of user fees, many citizens are willing to pay for improved services, but many local authorities in the region are unwilling to charge (Water and Sanitation Program 1999). This is particularly the case for water supply and sanitation, where tariff regimes do not typically reflect the cost of service.
The situation is not all glum. There are emerging examples of cities in South Asia that already have or have begun to put in place professional financial management systems, often with pressure and also support from higher tiers of government or through projects financed by international finance institutions. These financial reforms are a stepping-stone to strengthen the financial position and autonomy of local authorities and decrease their financial dependence on higher tiers of government.
Cities in South Asia would benefit from greater efficiencies in their operations, improved financial management systems, and greater spending on maintenance of existing assets—but this does not negate the great need for capital investments. The ability to attract finance for infrastructure will play a major role in the pace of increasing city competitiveness.
We examine the situation in the four cities in South Asia to understand the following:
How effectively are the four cities managing and investing their financial resources?What are the major financing opportunities for cities in South Asia?
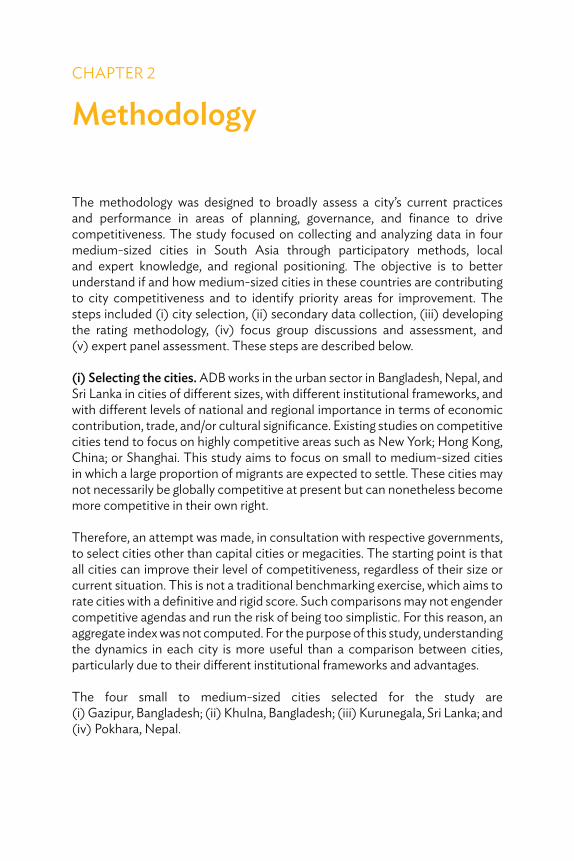
CHAPTER 2
Methodology
The methodology was designed to broadly assess a city’s current practices and performance in areas of planning, governance, and finance to drive competitiveness. The study focused on collecting and analyzing data in four medium-sized cities in South Asia through participatory methods, local and expert knowledge, and regional positioning. The objective is to better understand if and how medium-sized cities in these countries are contributing to city competitiveness and to identify priority areas for improvement. The steps included (i) city selection, (ii) secondary data collection, (iii) developing the rating methodology, (iv) focus group discussions and assessment, and (v) expert panel assessment. These steps are described below.
(i) Selecting the cities. ADB works in the urban sector in Bangladesh, Nepal, and Sri Lanka in cities of different sizes, with different institutional frameworks, and with different levels of national and regional importance in terms of economic contribution, trade, and/or cultural significance. Existing studies on competitive cities tend to focus on highly competitive areas such as New York; Hong Kong, China; or Shanghai. This study aims to focus on small to medium-sized cities in which a large proportion of migrants are expected to settle. These cities may not necessarily be globally competitive at present but can nonetheless become more competitive in their own right.
Therefore, an attempt was made, in consultation with respective governments, to select cities other than capital cities or megacities. The starting point is that all cities can improve their level of competitiveness, regardless of their size or current situation. This is not a traditional benchmarking exercise, which aims to rate cities with a definitive and rigid score. Such comparisons may not engender competitive agendas and run the risk of being too simplistic. For this reason, an aggregate index was not computed. For the purpose of this study, understanding the dynamics in each city is more useful than a comparison between cities, particularly due to their different institutional frameworks and advantages.
The four small to medium-sized cities selected for the study are (i) Gazipur, Bangladesh; (ii) Khulna, Bangladesh; (iii) Kurunegala, Sri Lanka; and (iv) Pokhara, Nepal.
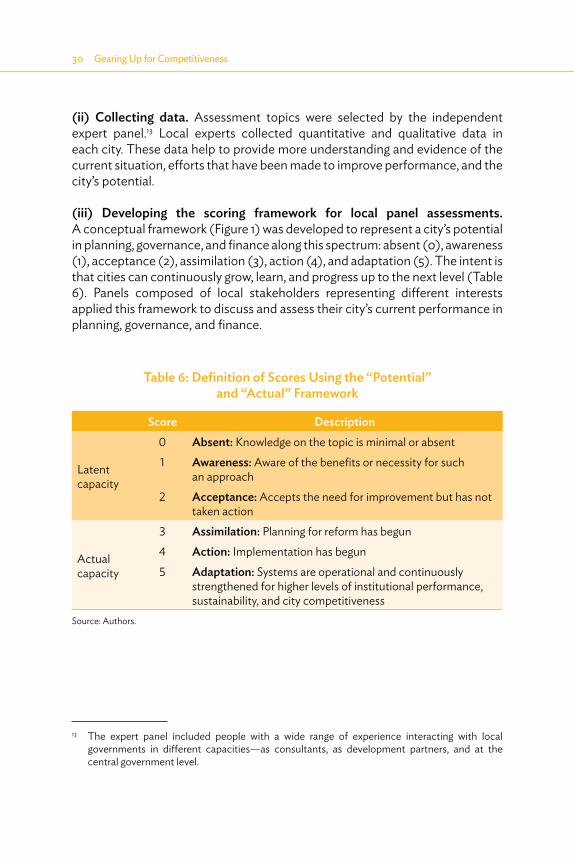
30�Gearing Up for Competitiveness
(ii) Collecting data. Assessment topics were selected by the independent expert panel.13 Local experts collected quantitative and qualitative data in each city. These data help to provide more understanding and evidence of the current situation, efforts that have been made to improve performance, and the city’s potential.
(iii) Developing the scoring framework for local panel assessments. A conceptual framework (Figure 1) was developed to represent a city’s potential in planning, governance, and finance along this spectrum: absent (0), awareness (1), acceptance (2), assimilation (3), action (4), and adaptation (5). The intent is that cities can continuously grow, learn, and progress up to the next level (Table 6). Panels composed of local stakeholders representing different interests applied this framework to discuss and assess their city’s current performance in planning, governance, and finance.
13 The expert panel included people with a wide range of experience interacting with local governments in different capacities—as consultants, as development partners, and at the central government level.
Table 6: Definition of Scores Using the “Potential” and “Actual” Framework
Score Description
Latent capacity
0 Absent: Knowledge on the topic is minimal or absent1 Awareness: Aware of the benefits or necessity for such
an approach2 Acceptance: Accepts the need for improvement but has not
taken action
Actual capacity
3 Assimilation: Planning for reform has begun4 Action: Implementation has begun5 Adaptation: Systems are operational and continuously
strengthened for higher levels of institutional performance, sustainability, and city competitiveness
Source: Authors.

Methodology�31
The framework is divided into two categories: (i) latent capacity: absent, awareness, and acceptance but no action as yet (scores 0–2); and (ii) actual capacity: assimilation, action, and adaptation (scores 3–5), with higher scores indicating that a city has made efforts to or succeeded in playing its role in contributing to city competitiveness through planning, governance, or finance.
The independent expert panel reviewed the guide used for focus group discussions. A more detailed explanation of the assessment areas is provided later in this section, and the scores are provided in the city snapshots in Chapter 4 and in Appendix 2.
(iv) Discussions with local panels. Local advisory panels of 10–20 people in each city were held from October 2013 to February 2014. The panels were led by national consultants and comprised the mayor and/or head bureaucrat in the municipality as well as municipal department heads (e.g., finance or planning). It also included representatives from the planning authority (where applicable); state, provincial, or district officers; civil society; the private sector (e.g., chamber of commerce and trade associations); and academia. The panels were asked to place their city’s performance and level of effort or progress in the 14 assessment areas according to the spectrum in Figure 1 and Table 6, and to provide insights into key constraints or examples of successful practices. The median of all panelists’ scores in that city was computed for each assessment area. Data cleaning was carried out to identify and address outliers.
Figure 1: Scoring Framework – Latent and Actual
PLANNING......
GOVERNANCE.....
FINANCE.....
Absent Awareness Assimilation Action
Low score
Highscore
LATENT ACTUAL
RATING
Acceptance Adaptation
Source: Asian Development Bank.
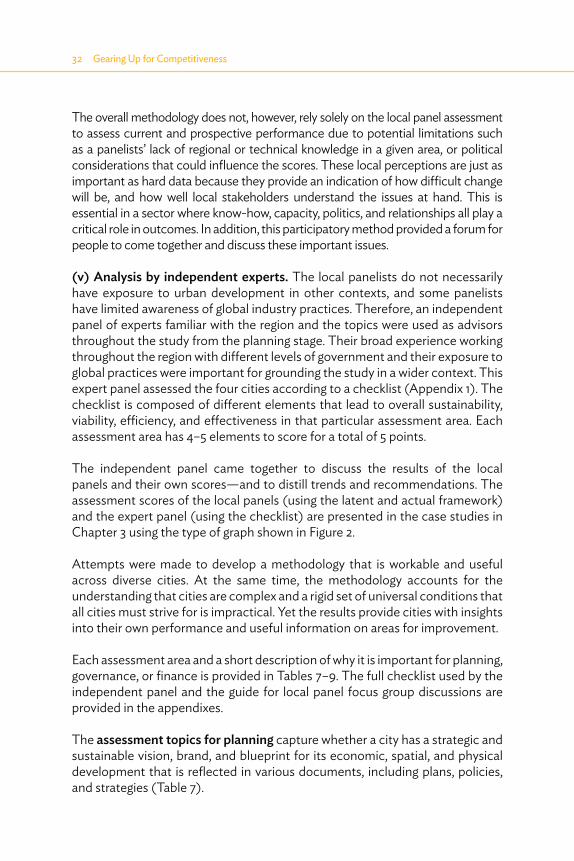
32�Gearing Up for Competitiveness
The overall methodology does not, however, rely solely on the local panel assessment to assess current and prospective performance due to potential limitations such as a panelists’ lack of regional or technical knowledge in a given area, or political considerations that could influence the scores. These local perceptions are just as important as hard data because they provide an indication of how difficult change will be, and how well local stakeholders understand the issues at hand. This is essential in a sector where know-how, capacity, politics, and relationships all play a critical role in outcomes. In addition, this participatory method provided a forum for people to come together and discuss these important issues.
(v) Analysis by independent experts. The local panelists do not necessarily have exposure to urban development in other contexts, and some panelists have limited awareness of global industry practices. Therefore, an independent panel of experts familiar with the region and the topics were used as advisors throughout the study from the planning stage. Their broad experience working throughout the region with different levels of government and their exposure to global practices were important for grounding the study in a wider context. This expert panel assessed the four cities according to a checklist (Appendix 1). The checklist is composed of different elements that lead to overall sustainability, viability, efficiency, and effectiveness in that particular assessment area. Each assessment area has 4–5 elements to score for a total of 5 points.
The independent panel came together to discuss the results of the local panels and their own scores—and to distill trends and recommendations. The assessment scores of the local panels (using the latent and actual framework) and the expert panel (using the checklist) are presented in the case studies in Chapter 3 using the type of graph shown in Figure 2.
Attempts were made to develop a methodology that is workable and useful across diverse cities. At the same time, the methodology accounts for the understanding that cities are complex and a rigid set of universal conditions that all cities must strive for is impractical. Yet the results provide cities with insights into their own performance and useful information on areas for improvement.
Each assessment area and a short description of why it is important for planning, governance, or finance is provided in Tables 7–9. The full checklist used by the independent panel and the guide for local panel focus group discussions are provided in the appendixes.
The assessment topics for planning capture whether a city has a strategic and sustainable vision, brand, and blueprint for its economic, spatial, and physical development that is reflected in various documents, including plans, policies, and strategies (Table 7).
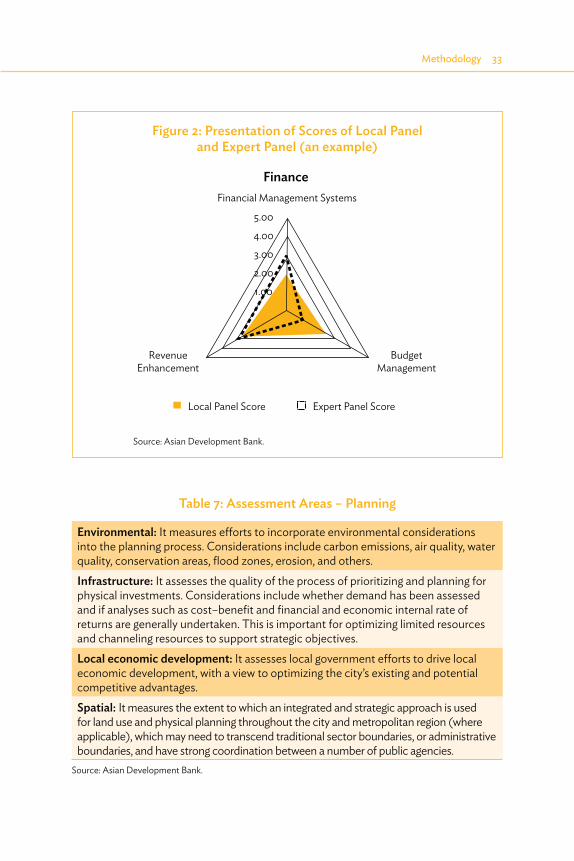
Methodology�33
Table 7: Assessment Areas – Planning
Environmental: It measures efforts to incorporate environmental considerations into the planning process. Considerations include carbon emissions, air quality, water quality, conservation areas, flood zones, erosion, and others.Infrastructure: It assesses the quality of the process of prioritizing and planning for physical investments. Considerations include whether demand has been assessed and if analyses such as cost–benefit and financial and economic internal rate of returns are generally undertaken. This is important for optimizing limited resources and channeling resources to support strategic objectives.Local economic development: It assesses local government efforts to drive local economic development, with a view to optimizing the city’s existing and potential competitive advantages.Spatial: It measures the extent to which an integrated and strategic approach is used for land use and physical planning throughout the city and metropolitan region (where applicable), which may need to transcend traditional sector boundaries, or administrative boundaries, and have strong coordination between a number of public agencies.
Figure 2: Presentation of Scores of Local Panel and Expert Panel (an example)
5.00
4.00
3.00
2.00
1.00
BudgetManagement
Local Panel Score Expert Panel Score
RevenueEnhancement
Financial Management Systems
Finance
Source: Asian Development Bank.
Source: Asian Development Bank.

34�Gearing Up for Competitiveness
The assessment topics for governance look at whether local government has the systems in place to deliver high-quality services, engage with citizens, and both facilitate and regulate development (Table 8).
Table 8: Assessment Areas – GovernanceAsset management: It assesses local government’s approach to maintaining its physical assets, with an emphasis on optimizing the benefits of existing assets. Asset management is critical for cost-effective and high-quality service delivery. Yet many cities do not fully understand the level of maintenance required to optimize investment returns and decelerate asset deterioration. City-region governance: It measures the quality of systems in place for collaboration across public agencies in the city-region (i.e., horizontal integration). This is important for avoiding duplication of efforts, ensuring harmony between various development plans, and providing more robust and interdisciplinary solutions to complex urban challenges.Civil engagement: It measures the level and quality of engagement between local government and civil society, including the private sector, nongovernment organizations, academia, etc., to inform policies, plans, project design, and operations. E-governance: It measures local government’s efforts to optimize its operations and customer service through electronic systems. Human resource management: It assesses local government capacity to attract, develop, and retain qualified staff within its constraints. This is critical since human capital impacts greatly on the performance of local government.Development permit process: It evaluates the efficiency of local government in reviewing and issuing developers’ applications (e.g., for construction, restoration, demolition, and subdivision, among others). Cities need transparent, predictable, and efficient systems since economic growth requires the continuous development of the built environment. Development controls: It measures the extent to which local government enforces building codes, zoning regulations, and environmental regulations. This is important for the credibility of the planning system and for maintaining healthy, safe, and livable environments.Transparency and accountability: It measures local government’s efforts to increase transparency and accountability, with the goal of using resources efficiently and reducing corruption.
Source: Asian Development Bank.

Methodology�35
The assessment topics for finance look at whether local government has the systems in place to plan and manage its financial resources, and whether local government is committed to increasing its own-source revenue (Table 9).
Table 9: Assessment Areas – FinanceBudget management: It evaluates the quality of budgeting practices, including whether the budget is integrated with development plans and strategies, whether the process of developing the budget is consultative or participatory, and whether there is great variance between actual and budgeted expenses.Financial management systems: It measures whether accounting, financial reporting, and auditing practices meet industry standards and are effective at managing resources efficiently and ensuring accountability and transparency. Revenue enhancement: It assesses whether local government is making efforts and succeeding at increasing its own-source revenue, particularly from taxes and user fees.
Source: Asian Development Bank.
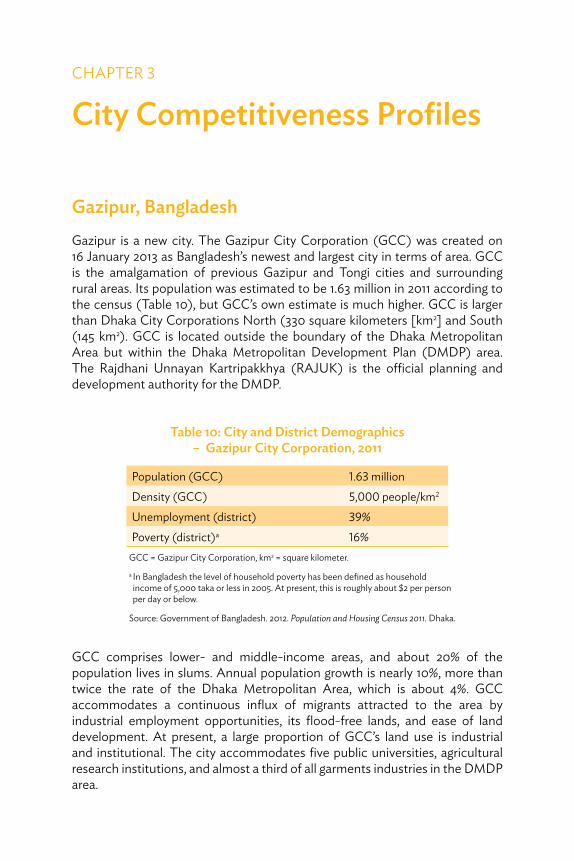
CHAPTER 3
City Competitiveness Profiles
Gazipur, BangladeshGazipur is a new city. The Gazipur City Corporation (GCC) was created on 16 January 2013 as Bangladesh’s newest and largest city in terms of area. GCC is the amalgamation of previous Gazipur and Tongi cities and surrounding rural areas. Its population was estimated to be 1.63 million in 2011 according to the census (Table 10), but GCC’s own estimate is much higher. GCC is larger than Dhaka City Corporations North (330 square kilometers [km2] and South (145 km2). GCC is located outside the boundary of the Dhaka Metropolitan Area but within the Dhaka Metropolitan Development Plan (DMDP) area. The Rajdhani Unnayan Kartripakkhya (RAJUK) is the official planning and development authority for the DMDP.
Table 10: City and District Demographics – Gazipur City Corporation, 2011
Population (GCC) 1.63 millionDensity (GCC) 5,000 people/km2
Unemployment (district) 39%Poverty (district)a 16%
GCC = Gazipur City Corporation, km2 = square kilometer.
a In Bangladesh the level of household poverty has been defined as household income of 5,000 taka or less in 2005. At present, this is roughly about $2 per person per day or below.
Source: Government of Bangladesh. 2012. Population and Housing Census 2011. Dhaka.
GCC comprises lower- and middle-income areas, and about 20% of the population lives in slums. Annual population growth is nearly 10%, more than twice the rate of the Dhaka Metropolitan Area, which is about 4%. GCC accommodates a continuous influx of migrants attracted to the area by industrial employment opportunities, its flood-free lands, and ease of land development. At present, a large proportion of GCC’s land use is industrial and institutional. The city accommodates five public universities, agricultural research institutions, and almost a third of all garments industries in the DMDP area.
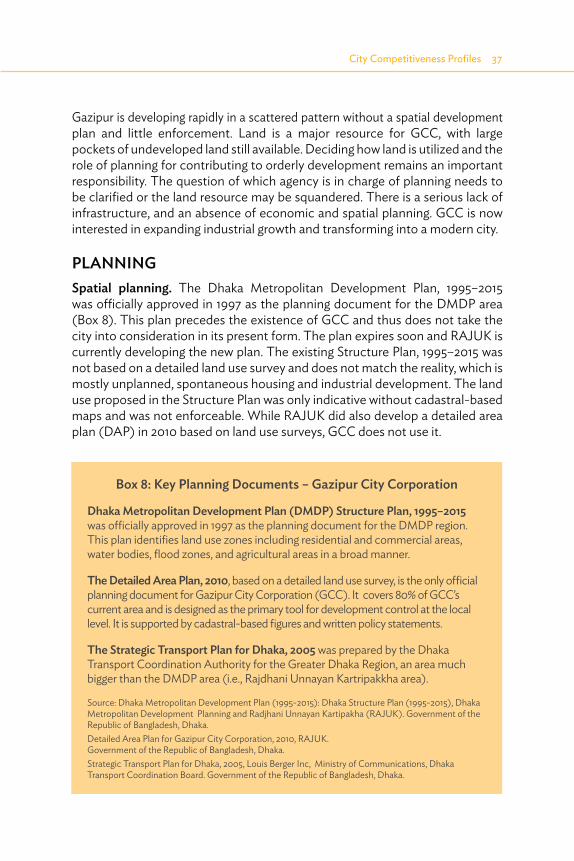
City Competitiveness Profiles�37
Gazipur is developing rapidly in a scattered pattern without a spatial development plan and little enforcement. Land is a major resource for GCC, with large pockets of undeveloped land still available. Deciding how land is utilized and the role of planning for contributing to orderly development remains an important responsibility. The question of which agency is in charge of planning needs to be clarified or the land resource may be squandered. There is a serious lack of infrastructure, and an absence of economic and spatial planning. GCC is now interested in expanding industrial growth and transforming into a modern city.
PLANNINGSpatial planning. The Dhaka Metropolitan Development Plan, 1995–2015 was officially approved in 1997 as the planning document for the DMDP area (Box 8). This plan precedes the existence of GCC and thus does not take the city into consideration in its present form. The plan expires soon and RAJUK is currently developing the new plan. The existing Structure Plan, 1995–2015 was not based on a detailed land use survey and does not match the reality, which is mostly unplanned, spontaneous housing and industrial development. The land use proposed in the Structure Plan was only indicative without cadastral-based maps and was not enforceable. While RAJUK did also develop a detailed area plan (DAP) in 2010 based on land use surveys, GCC does not use it.
Box 8: Key Planning Documents – Gazipur City Corporation
Dhaka Metropolitan Development Plan (DMDP) Structure Plan, 1995–2015 was officially approved in 1997 as the planning document for the DMDP region. This plan identifies land use zones including residential and commercial areas, water bodies, flood zones, and agricultural areas in a broad manner.
The Detailed Area Plan, 2010, based on a detailed land use survey, is the only official planning document for Gazipur City Corporation (GCC). It covers 80% of GCC’s current area and is designed as the primary tool for development control at the local level. It is supported by cadastral-based figures and written policy statements.
The Strategic Transport Plan for Dhaka, 2005 was prepared by the Dhaka Transport Coordination Authority for the Greater Dhaka Region, an area much bigger than the DMDP area (i.e., Rajdhani Unnayan Kartripakkha area).
Source: Dhaka Metropolitan Development Plan (1995-2015): Dhaka Structure Plan (1995-2015), Dhaka Metropolitan Development Planning and Radjhani Unnayan Kartipakha (RAJUK). Government of the Republic of Bangladesh, Dhaka.Detailed Area Plan for Gazipur City Corporation, 2010, RAJUK. Government of the Republic of Bangladesh, Dhaka.Strategic Transport Plan for Dhaka, 2005, Louis Berger Inc, Ministry of Communications, Dhaka Transport Coordination Board. Government of the Republic of Bangladesh, Dhaka.
38�Gearing Up for Competitiveness
Legally, both GCC and RAJUK may develop spatial plans within their respective jurisdictions. GCC contends it is capable of doing its own planning but does not have the staff or resources to carry out this function. GCC is unwilling to accept the plans prepared by RAJUK. RAJUK is not willing to delegate the planning responsibility to GCC, but is also not performing it effectively. The new Structure Plan, 2016–2035 being prepared by RAJUK includes the GCC area, but it is not clear what role, if any, GCC will play in the development of this plan.
The Strategic Transport Plan needs to be updated and coordinated with GCC. The plan was prepared when GCC was not yet declared a corporation. Specific recommendations for the region had major bypass roads through what is now the GCC area.
For Gazipur to develop as a competitive city the rivalry between RAJUK and GCC must be resolved. The fact that the two organizations belong to different ministries, have overlapping mandates, and lack a coordinating authority only makes matters more complicated. With clarification of responsibilities, strategic planning and more deliberate growth can occur.
Investment planning. The whole of the GCC area lacks physical infrastructure, especially a road network. As a result, most development is taking place along the main highways as ribbon development. Water supply is a serious problem. Only 6% of the population is connected to the system for an average of 8 hours per day. Only 5% of solid waste volumes are collected and the landfill is still under construction. Infrastructure is an expressed priority for GCC despite the absence of a clear list of investment priorities or a phased investment plan. GCC is responsible for infrastructure planning and implementation for basic services, and RAJUK has the mandate for land servicing, housing development, arterial roads, and industrial parks within GCC but is not currently doing so.
Neither RAJUK nor GCC has the information or the staff to collect and analyze data related to urban trends or the economy that would be useful for investment planning. The major investments planned for fiscal year 2014 by GCC are for roads, drains, street lighting, and its landfill. Investments are made to fill in service gaps as best they can. GCC is new and does not yet have a long history with project implementation. However, there are common issues facing local governments in Bangladesh that GCC can make efforts to avoid, including cost overruns due to unrealistic implementation schedules and ensuring that budget needs for operation and maintenance are factored into investment decisions.
Local economic planning. In Bangladesh, city corporations do not have the legal mandate for local economic development planning. The National Planning Commission looks at macroeconomic issues but not city-specific issues to guide and build city competitiveness. No agency is acting to coordinate the different agencies

City Competitiveness Profiles�39
to create a shared economic vision for cities. Gazipur has the potential to become a manufacturing and education center, but no agency has the explicit legal mandate for local economic development planning to support its planned development.
GCC economic development suffers from a lack of leadership from RAJUK or GCC. Neither RAJUK nor GCC enforces the controls necessary to manage area development and the necessary provision of infrastructure to support economic growth. Industrial developments occupy largely unplanned areas in GCC. GCC does not have any list of priority investments, much less a list of investments to support private sector growth. GCC does not have a discernible brand or a strategy that builds on it comparative advantages and vision to contribute to economic growth and develop into a modern city.
Environmental planning. RAJUK’s structure plan recommends the protection of all rivers and canals, natural forests, and high-value agricultural land. However, this is not being enforced. To date, RAJUK has been practicing traditional land use and spatial planning and not yet looking at more strategic issues with important consequences on the environment, such as the built form’s impact on carbon emissions and overall resiliency. However, there is an opportunity with the updating of the structure plan to integrate such considerations into the new plans or at least into the development of new, satellite cities in the DMDP (see Figure 3 for scores in the planning category).
- 1.00 2.00 3.00 4.00 5.00
Spatial
Local EconomicDevelopment
Environmental
Investment
Local Panel Score Expert Panel Score
Figure 3: Gazipur City Corporation’s Score – Planning
Note: The expert panel gave a score of 1 for spatial planning and 0 each for local economic development, environmental planning, and investment planning.
Source: Asian Development Bank.

40�Gearing Up for Competitiveness
GOVERNANCERAJUK operates under the Ministry of Housing and Public Works as the planning authority for the DMDP area. GCC is under a different ministry, the Ministry of Local Government, Rural Development and Cooperatives, and is administered by an elected mayor. GCC has about 540 full-time staff. RAJUK has the mandate for housing and land development as well as the planning and construction of industrial area development and major road networks within its jurisdiction. GCC is not excluded from also investing in these types of developments. RAJUK is not responsible for the development of services-related infrastructure such as water supply, solid waste, or drainage in GCC. This is GCC’s responsibility. GCC is new and is struggling to perform its functions per the City Corporation Act (Table 12). Service levels are low. Tensions between RAJUK and GCC and their inability to work together are caused by both political and systemic issues. For transportation in GCC, the Bangladesh Road Transport Authority issues licenses to private buses and tuktuks and GCC provides licenses to rickshaws.
Table 11: Gazipur City Corporation Indicators on Water Supply and Sanitation
Water supply Households with private connection 6%Average hours of supply per day 8 hoursNonrevenue water Not available Sanitation Households connected to the sewer network 0%Share of wastewater produced, collected, and treated to at least basic/primary level
0%
Share of solid waste collected and adequately disposed 5%Source: Gazipur City Corporation estimates.
City-region governance. Gazipur is part of the larger urban system of Greater Dhaka. There is no coordinating body for the Greater Dhaka region at present. RAJUK could play a coordinating role for planning issues, establishing the vision and helping build the foundation for urban development. However, this does not seem possible at present given unresolved tensions with GCC, which is creating a stalemate on planning issues for GCC. There are no major examples of cross-agency projects or cross-agency collaboration in GCC—but it is a new

City Competitiveness Profiles�41
city. The situation today is characterized by largely unplanned development of Gazipur with little coordination between agencies.
Table 12: Gazipur City Corporation Responsibilities per the City Corporation Act, 2011
Public health (mosquito control, immunizations)
Traffic and transport
Solid waste disposal Birth and death registrationSludge and liquid waste management Providing health and educational
facilitiesWater supply Slum improvementsStorm water drainage Public safety Maintaining streets, roads, and street lighting
Town planning
Removing unhealthy and dangerous structures
Building code enforcement
Providing and maintaining green spaces and recreational facilities
Source: Government of Bangladesh. 2011. Local Government (City Corporation) (Amended) Act, 2011. Dhaka.
Transparency and accountability. The legal framework for transparent and accountable local government in Bangladesh is generally weak. The Right to Information Act, 2009 establishes the parameters for disclosure by local governments in Bangladesh. However, the act does not specify which types of documents public agencies must disclose. The City Corporation Act does not require the disclosure of information such as budgets, development project plans, or financial reports.
GCC does not make public its financial reports and project documents. The opportunity for citizens to provide feedback and complaints is mandated through the GCC Citizens Charter. GCC has a complaints box in its office to collect this public feedback. GCC does not publish annual reports, but RAJUK has recently begun publishing an annual report it produces in-house. RAJUK also publishes a free quarterly bulletin listing its various projects and activities. Not all GCC staff have performance targets, and there are no staff performance incentives. Only GCC’s Revenue Section has targets at present. With the confusion and competition between GCC and RAJUK, accountability is not difficult to avoid in terms of planning issues. With the service levels as low as they are in GCC, accountability is a necessary complement to competitiveness.

42�Gearing Up for Competitiveness
Civil engagement. The legal framework for civil engagement by local government is also weak in Bangladesh. The City Corporation Act does not require information dissemination and public consultation during land use and infrastructure planning. For RAJUK, public hearings are mandatory when developing land use and infrastructure development plans. These hearings are typically led by the consultants developing the plans. One issue is that plans are typically written in English and a large portion of the public cannot read them. GCC is at a very nascent stage in terms of its civil engagement. Although GCC has a public relations officer who releases information to the media, it has no partnerships with civil society organizations at present. Budget preparation includes reviews in an open public session but for information purposes rather than in a spirit of collaboration and partnership.
E-governance. E-governance is weak in GCC. Its website is not updated regularly and does not have an online grievance or feedback capability. GCC has about 40 computers, but they are not connected to a central server. GCC does not use e-procurement systems. Citizens cannot make online payments for taxes or services or apply for development permits online. RAJUK, on the other hand, updates its website regularly, which may reflect its staff capacity as well as its intent to establish its service orientation. RAJUK’s Planning Section has geographic information system facilities, but they are used to create maps and not for higher-level planning or decision-making, or to improve service quality. GCC has a small planning unit with three planners currently working to update the GCC map. The young city is still at a very nascent stage of using e-governance as an urban management tool.
Development permit process. RAJUK reviews and issues permits to developers through its local branch in GCC or through its headquarters in Dhaka. Unlike in Khulna, an applicant has to file the application twice—first for initial planning and building clearances from RAJUK, and then to RAJUK again after securing all required clearances from other agencies. The processing time is stated to be a total of 6 weeks. There is a published schedule of fees according to the type and scale of development. An applicant must physically visit different agencies for various approvals—there is no one-stop shop or sharing of information between agencies. The application status cannot be checked online. RAJUK is constantly behind, and the processing time is not predictable. There have been no efforts to simplify the process. Many developers bypass the process altogether. Per the act, GCC can also issue planning and building permits. It was doing so until the central government ordered it to stop following the 2013 collapse of a garment industry building (Rana Plaza) in a nearby city.
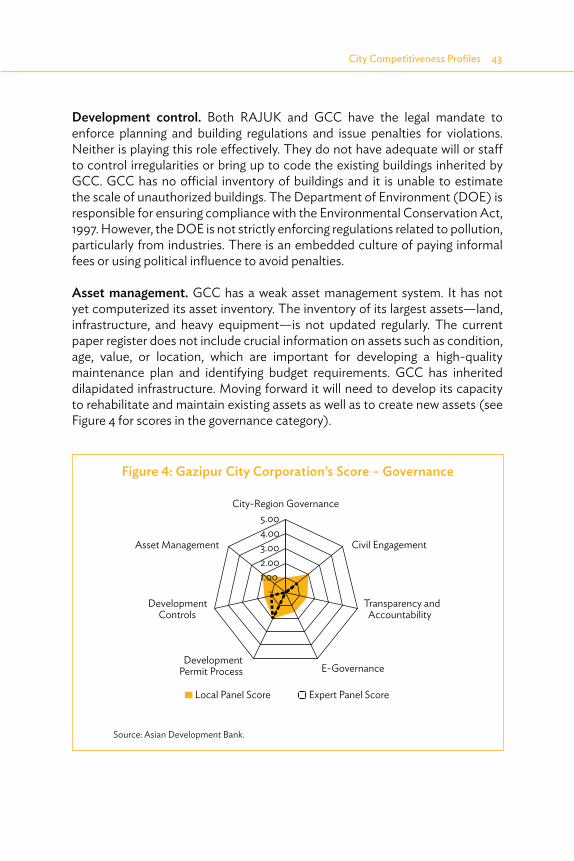
City Competitiveness Profiles�43
Development control. Both RAJUK and GCC have the legal mandate to enforce planning and building regulations and issue penalties for violations. Neither is playing this role effectively. They do not have adequate will or staff to control irregularities or bring up to code the existing buildings inherited by GCC. GCC has no official inventory of buildings and it is unable to estimate the scale of unauthorized buildings. The Department of Environment (DOE) is responsible for ensuring compliance with the Environmental Conservation Act, 1997. However, the DOE is not strictly enforcing regulations related to pollution, particularly from industries. There is an embedded culture of paying informal fees or using political influence to avoid penalties.
Asset management. GCC has a weak asset management system. It has not yet computerized its asset inventory. The inventory of its largest assets—land, infrastructure, and heavy equipment—is not updated regularly. The current paper register does not include crucial information on assets such as condition, age, value, or location, which are important for developing a high-quality maintenance plan and identifying budget requirements. GCC has inherited dilapidated infrastructure. Moving forward it will need to develop its capacity to rehabilitate and maintain existing assets as well as to create new assets (see Figure 4 for scores in the governance category).
Figure 4: Gazipur City Corporation’s Score – Governance
Source: Asian Development Bank.
- 1.00 2.00 3.00 4.00 5.00
City-Region Governance
Civil Engagement
Transparency andAccountability
E-GovernanceDevelopment
Permit Process
DevelopmentControls
Asset Management
Local Panel Score Expert Panel Score
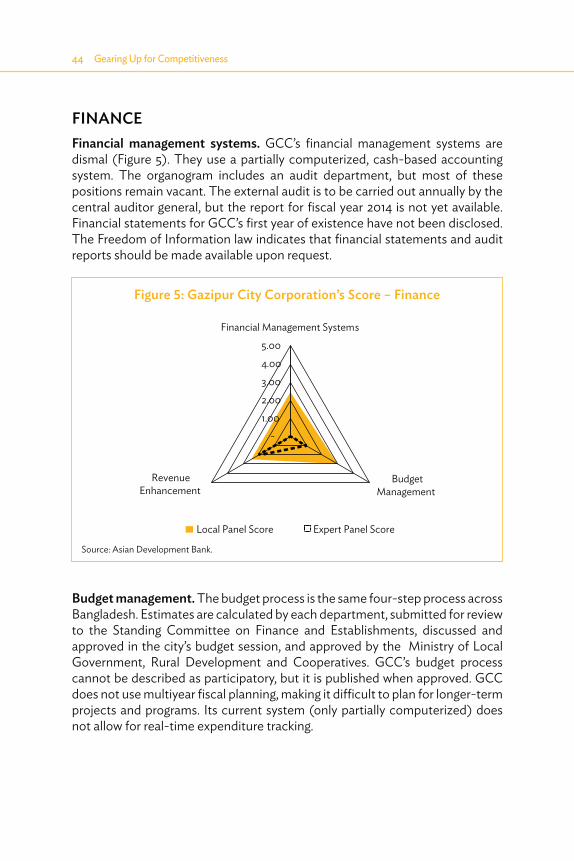
44�Gearing Up for Competitiveness
FINANCEFinancial management systems. GCC’s financial management systems are dismal (Figure 5). They use a partially computerized, cash-based accounting system. The organogram includes an audit department, but most of these positions remain vacant. The external audit is to be carried out annually by the central auditor general, but the report for fiscal year 2014 is not yet available. Financial statements for GCC’s first year of existence have not been disclosed. The Freedom of Information law indicates that financial statements and audit reports should be made available upon request.
-
1.00
2.00
3.00
4.00
5.00
Financial Management Systems
BudgetManagement
RevenueEnhancement
Local Panel Score Expert Panel Score
Budget management. The budget process is the same four-step process across Bangladesh. Estimates are calculated by each department, submitted for review to the Standing Committee on Finance and Establishments, discussed and approved in the city’s budget session, and approved by the Ministry of Local Government, Rural Development and Cooperatives. GCC’s budget process cannot be described as participatory, but it is published when approved. GCC does not use multiyear fiscal planning, making it difficult to plan for longer-term projects and programs. Its current system (only partially computerized) does not allow for real-time expenditure tracking.
Figure 5: Gazipur City Corporation’s Score – Finance
Source: Asian Development Bank.
City Competitiveness Profiles�45
Revenue enhancement. Gazipur is a new entity and as such is only beginning to develop its revenue base. About half of its revenue comes from the collection of taxes, tariffs, and fees. The other half comes from central government transfers. There are no systems in place yet to systematically revise tariffs, and tariff revisions for services such as water supply and sanitation require central government approval. The current tariff for water supply is a flat rate and not based on consumption. GCC is currently working to expand its property tax base by updating the database as well as by basing valuations on rental values and other criteria in accordance with central government guidelines. GCC estimates that only about half of the properties in its jurisdiction are listed in its tax database. GCC is not using other instruments for raising revenue, such as betterment charges or land value capture. GCC is only now establishing its management systems. Its ability to strengthen its own-source revenue base will be key to its ability to deliver on a vision.
Khulna, BangladeshKhulna is the third-largest city in Bangladesh, located 260 kilometers southwest of the capital, Dhaka. The city has developed on a north–south trajectory. Its growth is constrained by the Rupsha River on the east and by swamps on the west. Khulna’s economy is still suffering from the instability of its jute industry, and its population has decreased over the last decade. In 2011, Khulna had a population of about 670,000, down from about 760,000 in 2001. The pull factor of jobs is taking people elsewhere, most notably to the Dhaka Metropolitan Area, which has the highest density in the world (45,000 people per square kilometer [km] versus 14,531 in Khulna).14 In the last 15 years there have been attempts to revive Khulna’s economy through the establishment of two universities, one medical college, and shrimp processing industries in its periphery. There are also plans for opening new jute factories.
However, unemployment is still 9% and underemployment is thought to be much higher. One-fifth of households live below the poverty line.15
Manufacturing is still an important source of employment (19% of jobs), but the services sector is by far the biggest employer (75% of jobs). 16 The strategic importance of the city and its competitiveness relate to its important links with regional towns and growth centers, especially Mongla, the country’s second seaport. The connectivity created by the completion of the Lalon
14 Government of Bangladesh. 2012. Population and Housing Census 2011. Dhaka.15 In Bangladesh, the level of household poverty is defined as household income of 5,000 taka
or less— roughly $2 per person per day or below.16 Footnote 14.
46�Gearing Up for Competitiveness
Shah Bridge (over the Padma River) and the Khanjahan Ali Bridge (over the Rupsha River) will facilitate use by Nepal and the seven sister states of India to use Mongla port facilities if a government agreement can be reached. Khulna also has a potential tourism industry with its proximity to the Sundarban, the world’s largest mangrove forest. At issue is the city’s ability to plan, design, and implement the infrastructure required to support new economic activity.
The city is governed by the Khulna City Corporation (KCC). KCC’s jurisdiction (46 km2) lies within the Khulna Metropolitan Area (70 km2). As per the Khulna Development Authority Ordinance, 1961, the Khulna Development Authority (KDA) has the mandate to develop and enforce policies, regulations, and spatial plans related to the metropolitan area’s development. It also has the mandate to plan and invest in infrastructure throughout the metropolitan area, including within Khulna City, which has 88% of the KDA jurisdiction’s population.
KCC needs to adapt its investment strategies to first identify and then reflect new economic opportunities. The lack of coordination between government agencies is an incessant issue.
PLANNINGSpatial planning. In Bangladesh, the preparation of spatial plans is a major issue for its competitiveness. Spatial planning is outsourced and largely driven by external consultants. The process needs to be more inclusive and involve local government officials and other stakeholders. In Khulna, a master plan was developed in 1961 with a 20-year horizon.17 There was then a gap of about 20 years before the next set of development policies and plans were finalized (Box 9). There is no coordination of public agencies at the metropolitan level for the planning process. This may be because local agencies (including KDA and KCC) report to different ministries and there is no mechanism and little to no incentive to collaborate.18 The lack of coordination between agencies leads to a multitude of plans that are not always aligned, enforced, or followed. For example, Bangladesh Railway is currently preparing a plan that includes a new rail line on the opposite side of the Rupsha River than KDA’s Structure Plan, 2001–2020.
17 This plan was prepared by C. A. Minoprio, H. Spencely, and P. W. Macfarlane, the same consultants that prepared the master plans for Dhaka (1959) and Chittagong (1961).
18 KDA is under the Ministry of Housing and Public Works, and KCC is under the Ministry of Local Government, Rural Development and Cooperatives.

City Competitiveness Profiles�47
KDA’s current plans clearly indicate future land use pattern and suggested development of areas adjacent to Khulna on both sides of the river. The railway expansion could be an important driver of orderly urban development of the east side of the Rupsha River. The challenge is not with the quality of the plans per se; it is that the city is understaffed for the responsibilities it needs to take on. Equally important is that most plans are not complemented by an investment plan. The district commissioner does chair a monthly meeting of the agencies to coordinate development activities. But this is more of a firefighting meeting—e.g., resolving disputes between the water utility and roads authority on road cutting for water pipe installation—than a strategic discussion on development. The legal framework does allow for some flexibility to amend the master plan in order to adapt to changing urban conditions. But this is rarely done. There is a lack of a continuous planning culture. At present, master plans are revised or developed when previous versions have expired. There is no continuous process of analysis and responsiveness to changing conditions.
Box 9: Key Planning Documents – Khulna
Urban Strategy, 2001–2020 outlines the main policies and strategies for urban development in the metropolitan area.
Structure Plan, 2001–2020 articulates the metropolitan area’s overarching environmental, economic, and social goals and population growth strategy and focuses on broad land use and transportation networks. It also includes 18 sector policies, including for conservation, waste management, water supply, sanitation, housing, and slums.
Master Plan, 2001–2010 is a comprehensive land use plan that focuses on the core urban area of Khulna City Corporation and its immediate surroundings.
Detailed area plans, 2000–2005 were prepared for three smaller zones of Khulna to use as examples (the city center, slum improvement, and improvement of one unplanned residential area). The understanding was that Khulna Development Authority would then prepare the remaining detailed area plans based on these examples, but it did not. These plans have now expired, and Khulna Development Authority is currently preparing new detailed area plans through consultants for about 70% of its area.
Source: Urban Strategy. 2002. ‘Structure Plan, Master Plan and Detailed Area plan (2001-2020) for Khulna City’, Volume I, AQUA-SHELTECH CONSORTIUM, Khulna Development Authority, Ministry of Housing and Public Works, Government of the People’s Republic of Bangladesh, Dhaka.
48�Gearing Up for Competitiveness
Investment planning. Competitiveness requires clarity of roles and responsibilities. Local governance across the country, and for Khulna in particular, is in need of simplification. Five main authorities lead physical development in the metropolitan area: KDA, KCC, the Khulna Water Supply and Sewerage Authority (KWASA), the National Housing Authority, and the Roads and Highway Department.19 Both KDA and KCC have the mandate for infrastructure planning and development within their respective jurisdictions. This means that there is an overlap of function in the KCC area.20 KDA does, however, tend to focus its efforts in KCC’s jurisdiction on revenue-generating investments, such as real estate development (both commercial and residential), although it has recently planned and implemented some road improvements within KCC as well. Large investments are typically funded by the central government through KDA or KCC and are for emergency measures like flooding or river erosion mitigation—or for a project that is tied to visibility during the election cycle.
Citywide master plans exist for drainage (prepared by KCC) and water supply (prepared by KWASA). Other subsectors do not have master plans, and investments are piecemeal. KDA and KCC do not have a clear list of investment priorities that gives confidence that they are focused and their priorities are not constantly shifting. Rates of return and net present values are not typically calculated when assessing projects and alternatives. In summary, the process of infrastructure prioritization and approval is highly political and controlled largely by the central government, and not necessarily linked to the longer-term vision as established in key policy and development documents.
Local economic development planning. The spatial planning process should ideally build on local economic development planning, which reflects a city vision and brand. There is no public agency driving local economic development. This is an important staffing issue for the city. The various plans and policies do reflect some economic principles (e.g., there is a chapter on city economy in the structure and master plans), but no agency is taking the driver’s seat to understand Khulna’s comparative and competitive advantages, and to develop a shared and realistic vision for its future that is monitored and revised according to trends or forecasts. There is no clear link between driving the city’s competitiveness and the choice of infrastructure investments. City officials say
19 Under the Ministry of Communications.20 All city corporations in Bangladesh have the same mandate to develop infrastructure, whether
or not there is a development authority such as KDA.

City Competitiveness Profiles�49
they have no clear picture on unemployment, local incomes, or even the nature of private investment. There is no systematic dialogue between the public and private sectors on the current situation, the city’s economic potential, what investments are needed, and what the priorities are, for example. The cascading plans do make some attempts to use land to boost the economy through an export processing zone and the development of a central business district. But the development potential of the east side of the river is ignored. These plans are dependent on other public landowners such as Bangladesh Railway, which tends not to release land, and adequate negotiations are not carried out at the planning stage. The proposed sites for the export processing zone and the central business district are inhabited by squatters and there is no momentum to develop these areas as per KDA plans, and thus the competitive edge they might bring is lost.
Environmental planning. The key development documents do lay out certain environmental objectives such as the preservation of sensitive areas and the reduction of pollution. There is no attempt to reduce carbon emissions through land use (e.g., more compact development) and transport measures (e.g., less reliance on vehicles), but the level of vehicle use is low in Khulna. Environmental impact assessments are carried out for large-scale investments such as the proposed landfill. However, the various plans do not set out targets for improving environmental parameters such as water body quality or increasing green space, and data related to the environment is not systematically collected by KDA, KCC, or the Department of Environment (DOE).
There are some systems in place and efforts for comprehensive planning of major resources, including land and infrastructure, but this is only loosely based on the city’s economic development potential. Investment planning is ad hoc and reactive, except for the water utility, KWASA, which was created in 2008 and has a concerted investment plan. Public agencies like KCC and KDA tend to focus on infrastructure planning for revenue-generating infrastructure like markets and real estate development, rather than the development of important but nonrevenue-generating infrastructure like storm water drainage, roads, and parks. Environmental planning is critical to competitiveness, especially concerning no-development areas, flood control, and disaster preparedness, to raise the comfort level of investors (see Figure 6 for scores in the planning category).

50�Gearing Up for Competitiveness
GOVERNANCEKCC functions under the Ministry of Local Government, Rural Development and Cooperatives. It has an elected mayor with a 4-year term that is supported by a top-level bureaucrat (usually deputy secretary or joint secretary level). KCC’s main functions are investing, operating, and maintaining infrastructure and services related to drainage, on-site sanitation, solid waste, roads, street lighting, parks, and slum improvements. The responsibility for water supply and sewerage was removed from KCC in 2008 with the creation of KWASA, a separate public utility. KCC is also responsible for other typical local government functions like birth and death registration and providing commercial licenses. KCC and other public agencies are struggling on almost all fronts due to their capacity and staffing restrictions. KCC estimates that 60% of development is unauthorized, a clear indicator of staff constraints exacerbated by the lack of political will to enforce development guidelines. About 30% of households have a water connection with about 12 hours of supply per day. There is no sewerage network or wastewater treatment at present. KCC is not providing any public transport services. Only 40% of solid waste generated is collected and disposed of in a central site—but the current facility is substandard.21
21 ADB is supporting the development of a sanitary landfill for Khulna.
Figure 6: Khulna City Corporation’s Score – Planning
Source: Asian Development Bank.
- 1.00 2.00 3.00 4.00 5.00
Spatial
Local EconomicDevelopment
Environmental
Investment
g
Local Panel Score Expert Panel Score

City Competitiveness Profiles�51
KDA investments within KCC’s jurisdiction tend to be made with little participation of the KCC. Any public investments made by KDA in roads or drainage, for example, are handed over to KCC for operation and maintenance, which may not have the budget available to carry out its responsibilities. Major investments by KCC in the last few years have been primarily in roads, drainage, and markets. The funds for investments throughout the metropolitan area originate in large part from the central government, which decides whether to channel the funds through KDA or KCC and thereby maintains its control of the process of building local government capacity.
City-region governance. There are no systems for cross-agency collaboration at the city or the metropolitan level, nor is there leadership to progressively drive this collaboration, in spite of there being areas of overlap between agencies. For example, per section 22(1) of the Khulna Development Authority Ordinance, 1961 and section 105 of the Khulna City Corporation Ordinance, 1991, both KDA and KCC can prepare a master plan for the city of Khulna. Both can also plan for and implement infrastructure projects in the KCC area. However, major decisions are controlled and driven by the center, and local agencies are financially dependent on the center. There is thus little scope for interagency collaboration for service delivery or enforcement in the current framework. This has a direct negative impact on the competitiveness of the city and its ability to design its future.
Transparency and accountability. Pressure and incentives for local government to perform are generally low in Bangladesh. The legal requirements for local government in terms of public disclosure and consultation are low, even with the adoption of the Right to Information Act, 2009. The City Corporation Act does not require local government to disclose its financial reports or external auditor reports, and KCC does not exceed the legal requirements. KCC does not proactively disseminate the budget. Internal accountability is also low—it is not standard practice for KCC staff to have performance targets, although two out of five departments now have departmental targets. The current situation, with both KDA and KCC responsible for infrastructure investments, perhaps dilutes responsibility, as one can always blame the other for the low level of investment. In general, the legal framework and incentive structure makes local government accountable to the ministry, and not citizens, with effects on competitiveness.
Civil engagement. The level of engagement with civil society is low for all phases—e.g., planning, implementation, operations, monitoring, and evaluation of policies, projects, and programs. During the planning phase, civil engagement in the form of public hearings, a legal requirement, is driven by consultants
52�Gearing Up for Competitiveness
without the leadership of KDA as the responsible agency or consultation with the mayor. In fact, these meetings are organized by consultants, and KDA is invited to attend as a participant, rather than as a host. KCC has allocated some of its annual budget for communications campaigns, but these are generally for emergencies like health epidemics and not for two-way dialogue that informs planning and operations. There is currently no space for civil society to be involved in KCC budgeting or expenditure tracking. KCC has succeeded in establishing some partnerships with nongovernment organizations and the private sector for small beautification investments such as fountains and statues, and with community-based organizations for preventing encroachment of rivers and canals. Major development and investment decisions are in any case made at a central level, far from the citizens of Khulna.
E-governance. Khulna scores low in e-governance because it does not have the staff or the authority to hire competent professionals to use new technology to drive efficiency and/or strengthen engagement with citizens. This does not mean it does not use technology; Khulna has computers and a website, but the latest financial reports, policies, and project plans are not regularly uploaded. There is a geographic information system used for analysis and to inform decisions, but it is not linked to the property or tax database. Khulna does not have e-procurement or online grievance or payment systems. However, the land registry was updated recently and is now in electronic form. The next step could be, with the proper staff capacity, to automatically link the land registry with the property tax system.
Development permit process. The development permit process is critical to competitiveness. In Khulna, it is a two-step process. KDA first reviews applications for compliance with regulations: (i) Building Construction Code (1993) (target of 21 days review), and (ii) planning permission (target of 21 days review). Once KDA has approved the application, the developer must also seek approval from the DOE if environmental clearance is required. The fee schedule for permits is published. KDA is not currently overwhelmed by its volume of applications, which is about 1,200 per year. It could reduce the time it takes to review applications, and perhaps also issue a final approval post-construction.
Development controls. The permit process is relatively smooth and straightforward, which is a plus for competiveness. However, many developers bypass the process altogether due to lack of enforcement. Khulna is faring extremely poorly in the enforcement of planning, building, and environmental regulations. Although the relevant ordinances22 define the penalties for different
22 The Khulna Development Authority Ordinance, 1961 defines penalties for a number of situations, including the use of land that contradicts the master plan, failure to remove an illegal wall or building, etc.
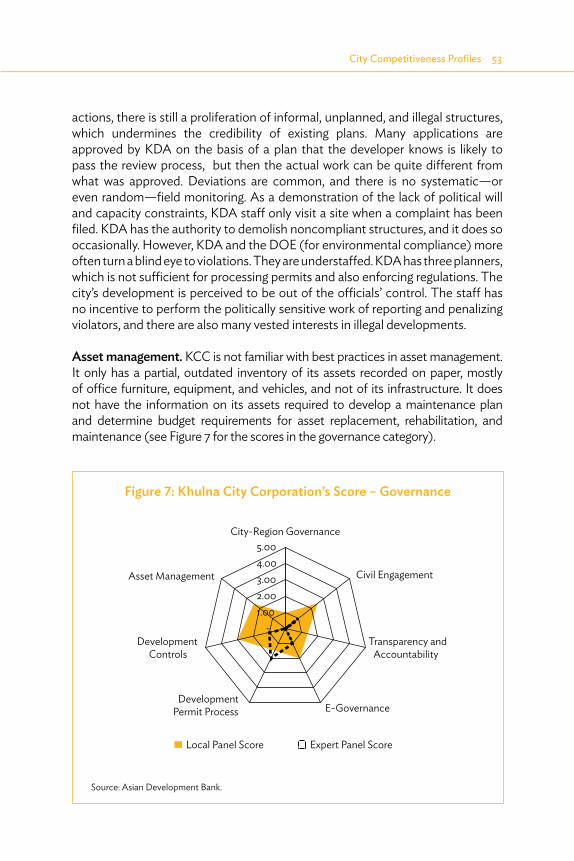
City Competitiveness Profiles�53
actions, there is still a proliferation of informal, unplanned, and illegal structures, which undermines the credibility of existing plans. Many applications are approved by KDA on the basis of a plan that the developer knows is likely to pass the review process, but then the actual work can be quite different from what was approved. Deviations are common, and there is no systematic—or even random—field monitoring. As a demonstration of the lack of political will and capacity constraints, KDA staff only visit a site when a complaint has been filed. KDA has the authority to demolish noncompliant structures, and it does so occasionally. However, KDA and the DOE (for environmental compliance) more often turn a blind eye to violations. They are understaffed. KDA has three planners, which is not sufficient for processing permits and also enforcing regulations. The city’s development is perceived to be out of the officials’ control. The staff has no incentive to perform the politically sensitive work of reporting and penalizing violators, and there are also many vested interests in illegal developments.
Asset management. KCC is not familiar with best practices in asset management. It only has a partial, outdated inventory of its assets recorded on paper, mostly of office furniture, equipment, and vehicles, and not of its infrastructure. It does not have the information on its assets required to develop a maintenance plan and determine budget requirements for asset replacement, rehabilitation, and maintenance (see Figure 7 for the scores in the governance category).
Figure 7: Khulna City Corporation’s Score – Governance
Source: Asian Development Bank.
Local Panel Score Expert Panel Score
- 1.00 2.00 3.00 4.00 5.00
City-Region Governance
Civil Engagement
Transparency andAccountability
E-GovernanceDevelopment
Permit Process
DevelopmentControls
Asset Management
54�Gearing Up for Competitiveness
FINANCEKCC’s own-source revenue as a share of total revenue was 30% in fiscal year (FY) 2012. Its largest source of own-source revenue is from property taxes followed by solid waste collection fees. Khulna’s operating expenditures averaged 69% of total expenditures from FY2010 to FY2012. Government grants accounted for an average of 55% of its total revenue during the same 3-year period. KCC has never borrowed from the market but has taken multiple loans from the Bangladesh Municipal Development Fund23 for capital investments.
Financial management systems. KCC, like all other local governments in Bangladesh, has a cash-based accounting system, which does not reflect future obligations. It has an internal control function, and is audited every year by the Office of the Comptroller and Auditor General of Bangladesh. Real-time financial reporting and expenditure tracking are not possible with its current system. Contrary to best practice, KCC does not disclose its financial reports or the external auditor’s report. For KCC to become competitive, this needs to change.
Budget management. KCC’s budget is developed through four key steps: (i) estimates are provided by each department or section; (ii) figures are compiled and reviewed by the Standing Committee on Finance and Establishments; (iii) figures are then reviewed in the City Council’s budget session; and (iv) the Ministry of Local Government, Rural Development and Cooperatives grants the final approval. KCC’s budget is, however, a political wish list, not based on its vision or brand, and never close to actual revenue and expenses. KCC uses an annual budget and has never prepared a multiyear budget that would allow it to establish and present more realistic assumptions about revenue and expenses. The budget is not based on historical trends, and both expected income and expenses are inflated excessively. The budget is available on request, but KCC is not proactive in sharing it with the public.
Revenue enhancement. KCC is making a concerted effort to increase its own-source revenue through property tax. The last property valuation was completed in 2011. The initiative was accompanied by a public awareness campaign to increase the public’s support for paying taxes, a flat rate of 1.6% of property value. All properties are now included in the tax database, and the collection efficiency rate for property taxes was 75% in FY2013. Neither KDA nor KCC uses instruments such as value capture or betterment taxes, although the latter is allowed within the
23 The Bangladesh Municipal Development Fund is a company formed under the Ministry of Finance to extend financial support to local government.

City Competitiveness Profiles�55
current legal framework. Value capture incentives often provided to developers, such as increased height or density allowance in return for contributing to the cost of infrastructure, are not relevant in Bangladesh since density and height are unregulated (see Figure 8 for the scores in the finance category).
Kurunegala, Sri LankaThe Kurunegala Municipal Council (KMC) is located 100 kilometers northeast of the capital city of Colombo at the crossroads of many of Sri Lanka’s national roads (Figure 9). The small city of about 30,000 people is the capital of Northwestern Province and covers an area of 11 km2 (Table 13). It has become an important transport hub due to its location. The city also has a commercial reputation for the sale of vehicles and spare parts. The city grew slowly but steadily from 2001 to 2012 with an average annual growth rate of 1.4%, which is higher than Kurunegala District’s rate of 0.9%.24 KMC is a vibrant local authority that has made efforts to improve customer service. Its vision as stated in its latest budget is “optimum service to the people within a gracious city.” The city is clean and has an active commercial center, low levels of haphazard development, and notable natural features such as large rock formations and a lake. The majority of the land is used for residential purposes (37%). Industry is located outside the city boundaries.
24 Government of Sri Lanka. 2012. Census of Population and Housing 2011. Colombo.
Figure 8: Khulna City Corporation’s Score – Finance
Source: Asian Development Bank.
Local Panel Score Expert Panel Score
- 1.00 2.00 3.00 4.00 5.00
Financial Management Systems
BudgetManagement
RevenueEnhancement
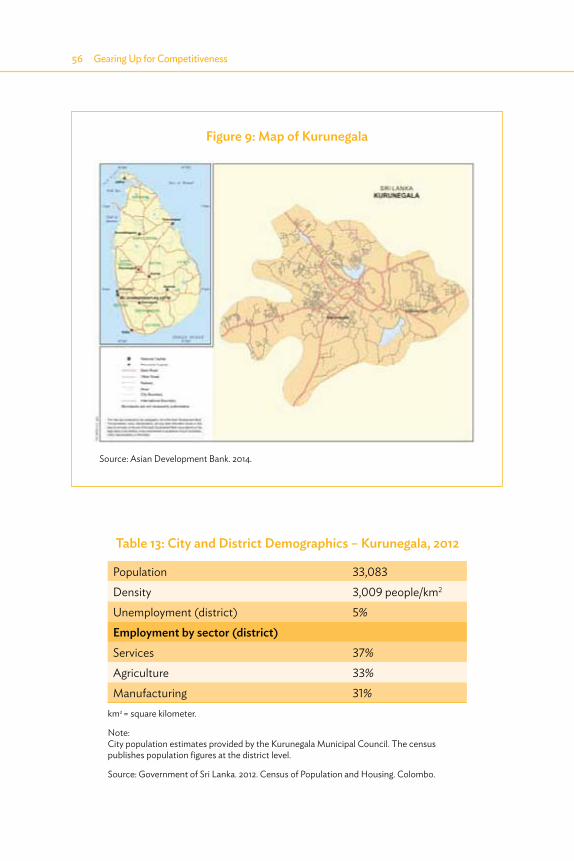
56�Gearing Up for Competitiveness
Table 13: City and District Demographics – Kurunegala, 2012
Population 33,083Density 3,009 people/km2
Unemployment (district) 5%Employment by sector (district)Services 37%Agriculture 33%Manufacturing 31%
km2 = square kilometer.
Note: City population estimates provided by the Kurunegala Municipal Council. The census publishes population figures at the district level.
Source: Government of Sri Lanka. 2012. Census of Population and Housing. Colombo.
Source: Asian Development Bank. 2014.
Figure 9: Map of Kurunegala

City Competitiveness Profiles�57
Box 10: Key Planning Documents – Kurunegala
The Development Plan for the Urban Development Area of Kurunegala, 2006–2015 is organized in two volumes. Volume 1 provides the context and analysis of socioeconomic, spatial, and environmental data. Volume 2 consists of a zoning plan, street and building alignments, planning and building regulations, and procedures for building and planning clearances.
The National Physical Plan and Policy, 2011–2030, prepared by the central government is a broad structure plan for the entire country. It defines metropolitan areas and cities, protected areas, and agricultural areas. It also locates the country’s main economic infrastructure, including airports, railways, ports, power plants, and expressways. Regional plans are meant to be developed in accordance with this national plan, and city development plans should be harmonized with the regional plans. Not all regions have development plans yet.
Source: Urban Development Authority (UDA). 2006. Development Plan for the Urban Development Area of Kurunegala 2006-2015 Urban Development Authority, North Western Provincial Office, Kurunegala.
National Physical Planning Department, 2011. National Physical Planning Policy and Plan 2011-2030, Ministry of Construction, Engineering Services, Housing and Common Amenities, Government of Sri Lanka, Colombo.
KMC is responsible for basic services such as water supply distribution, sanitation, and solid waste management. KMC purchases bulk water supply from the National Water Supply and Drainage Board. KMC also issues building and planning permits and enforces these regulations. The central government, through the regional office of the Urban Development Authority (UDA) prepares the master plan for Kurunegala. KMC is a small, well-managed city making efforts to manage its development and improve the quality of life for its citizens.
PLANNINGSpatial planning. The national Physical Planning Department is responsible for preparation of regional development plans, but the Northwestern Province development plan has not yet been prepared. UDA prepares Kurunegala’s development plans in consultation with KMC. The legal framework allows UDA to revise the master plan in response to changing circumstances although the minister’s approval is required. The Development Plan for the Urban Development Area of Kurunegala, 2006–2015 is comprehensive although the local panel felt that some improvements are still possible, particularly to strengthen the linkages between spatial and economic planning, making plan preparation more participatory, and establishing a means of financing the plan. Still, the plan has provided the city with a blueprint to protect environmentally sensitive areas, provide open space, and restrict industry to outside the city limits (Box 10).
58�Gearing Up for Competitiveness
Investment planning. KMC has a well-defined project pipeline. It is currently preparing detailed engineering designs for a sewerage network, a wastewater treatment plant, and improvements in its water supply system with the financial and technical support of the Government of the People’s Republic of China. In collaboration with UDA, it is in the final stages of developing a lakefront recreation area. It has also developed a composting site in collaboration with the private sector. KMC has demonstrated that it is able to plan and attract finance for its investments although these investments may not always be based on sector strategies. KMC is also planning a number of housing developments, a commercial complex, and a hotel in partnership with private developers. The expert panel did not give full marks in this category because the master plan is a wish list without clear prioritization of investments and not reflected in the KMC project pipeline. KMC’s investments are largely driven by external factors like availability of funds rather than its own defined priorities; and thorough economic and financial assessments are only undertaken for donor-funded projects.
Local economic development planning. The institutional framework in Sri Lanka does not provide local government with the mandate for local economic development planning. Provincial governments look at regional economic issues, and district committees provide some level of coordination on economic development at the district level. However, KMC is a dynamic local government with a number of initiatives planned and under implementation to boost its competitiveness, including quality of life improvements, even if these initiatives are not yet framed in terms of a “competitiveness” strategy. Some of its plans to boost the local economy include incentivizing the expansion of commercial space, with KMC providing the land and the private sector providing investment for select projects; maintaining a relatively low rate of property taxes; and aiming to provide quality municipal services. KMC is not driving local economic development by planning for it in a comprehensive and deliberate manner. Still, a number of its initiatives are a good start for KMC to further take the lead on planning for greater competitiveness.
Environmental planning. The development plan prepared by UDA is strong on environmental protection and conservation. It aims to reduce adverse impacts of the built environment on the town’s natural environment. It defines a number of environmentally sensitive zones where no development is allowed—e.g., rock outcrops, forests, and water bodies. One weakness of the development plan is that it allows for residential developments in the existing rice paddies with the goal of expanding housing stock. However, the rice paddies serve an important function as a floodplain (see Figure 10 for scores in the planning category).
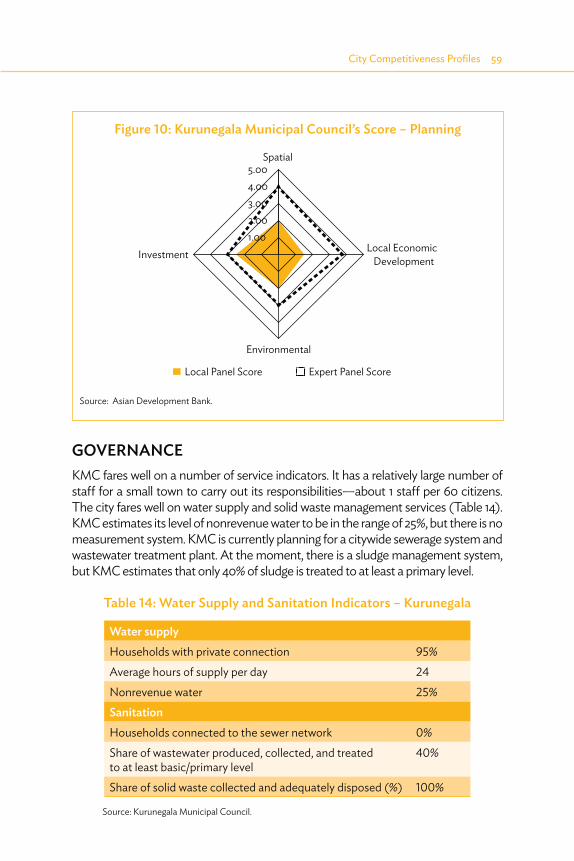
City Competitiveness Profiles�59
GOVERNANCEKMC fares well on a number of service indicators. It has a relatively large number of staff for a small town to carry out its responsibilities—about 1 staff per 60 citizens. The city fares well on water supply and solid waste management services (Table 14). KMC estimates its level of nonrevenue water to be in the range of 25%, but there is no measurement system. KMC is currently planning for a citywide sewerage system and wastewater treatment plant. At the moment, there is a sludge management system, but KMC estimates that only 40% of sludge is treated to at least a primary level.
Table 14: Water Supply and Sanitation Indicators – Kurunegala
Water supply Households with private connection 95%Average hours of supply per day 24Nonrevenue water 25%Sanitation Households connected to the sewer network 0%Share of wastewater produced, collected, and treated to at least basic/primary level
40%
Share of solid waste collected and adequately disposed (%) 100%
Source: Kurunegala Municipal Council.
Figure 10: Kurunegala Municipal Council’s Score – Planning
Source: Asian Development Bank.
Local Panel Score Expert Panel Score
- 1.00 2.00 3.00 4.00 5.00
Spatial
Local EconomicDevelopment
Environmental
Investment
60�Gearing Up for Competitiveness
City-region governance. There is a strong definition of roles and responsibilities for planning, service delivery, and urban management in Kurunegala and its surroundings, and a strong interagency coordination mechanism through the District Coordinating Committee headed by the chief minister and sometimes even presided over by the President. UDA and KMC participate in these meetings. This formal system is effective in monitoring the follow-through on the committee’s decisions. KMC is not driving collaboration with other agencies in a systematic manner, but it has demonstrated its ability to work with other agencies such as the Road Development Authority to develop a multi-use underpass and with UDA to develop the lakefront area. UDA and KMC are not sharing data systematically, but they tend to share data with each other upon request.
Transparency and accountability. There is no right to information in Sri Lanka’s Constitution or separate legislation, but a proposal for such an act is being discussed by the Parliament. Many local governments such as KMC publish their annual budgets, and UDA-prepared plans are also in the public domain. Citizens may lodge complaints or share feedback with KMC through writing, e-mail, and in person. KMC does not produce an annual plan or disseminate performance indicators. However, it does make an effort to make its budget and external audit reports available to the public in its office and the public library in Kurunegala. Like many local governments, its organizational targets are generally framed in terms of inputs rather than outputs and performance benchmarks (e.g., reducing level of nonrevenue water or reducing average time to process permits).
Civil engagement. KMC’s civil engagement is at the stage of information gathering and sharing and some limited consultation. It has ward officers to communicate with the public, particularly during the preparation of the budget when public views are sought. Key committees such as budget or finance do not include members from civil society, although the public is represented by the elected officials on the municipal council. In general, the role of civil society in informing policies, plans, and operations is limited.
E-governance. KMC has not adopted an e-governance approach per se, but it has made efforts to improve customer service through the “Front Office,” its professional customer service window. KMC does not have a website, e-payment systems, dedicated information and communication technology staff, or in-house geographic information system capacity, and does not use e-procurement. Its land registry is not fully digitized. E-governance is not a priority for now but may be in the future as the city grows.
City Competitiveness Profiles�61
Development permit process. UDA has developed the planning and building regulations and delegated the issuance of permits to KMC. KMC’s Planning Committee may refer complex applications to UDA, if needed. Most applications are, however, processed by KMC. Citizens submit their application through KMC’s efficient “Front Office.” The process takes an estimated 1 month if no problems are encountered during the review. KMC’s technical officers undertake a site inspection and prepare a report that is reviewed by KMC’s Planning Committee. Large-scale developments require a separate approval from the Central Environmental Authority. The expert panel did not provide full marks in this category because KMC does not have a list of minor works that do not require approval—even minor works require permission.
Planning regulations in Sri Lanka have clear policies on public benefits from subdivision development. Where the parcel of land to be subdivided exceeds 1 hectare, at least 10% shall be reserved for community recreation and open space (excluding streets).
Development control. UDA has also delegated development controls to local government. KMC is able to effectively control development within its area with very low levels of illegal or haphazard development. Efforts are made to identify violations of planning and building regulations and oblige violators to regularize their structures or face penalties. If compliance is not possible, KMC demolishes the structure. For environmental compliance issues, Kurunegala is looked after by the Central Environmental Authority, which has a reputation for strict enforcement. Public acceptance of building and planning regulations is high in Sri Lanka relative to other countries in South Asia. The requirement for developers to engage professionals—e.g., a qualified town planner to certify land subdivision plans or a structural engineer to certify buildings over four stories—is followed and enforced.
Asset management. KMC has an inventory of its assets, which is partially computerized. The inventory includes equipment, water meters, and infrastructure such as water pipes. The description of its assets is partially complete—e.g., the age and location of assets are indicated but not the condition. There is no separate fund for asset replacement, but KMC spent an average of 4% of its recurrent expenditure on repairs and maintenance from 2011 to 2013 (see Figure 11 for scores in the governance category).

62�Gearing Up for Competitiveness
FINANCEFinancial management systems. KMC has strong financial management systems that have been strengthened over the years through support from the government and the Sri Lanka Institute of Local Governance. KMC uses an accrual accounting system. Real-time financial reporting is not possible due to use of offline systems (e.g., Microsoft Excel), but it does have an internal control function as well as annual external audits conducted by the Sri Lankan auditor general. At present, KMC does not practice ring fencing of resources for any of its services—e.g., its revenue from water sales goes into the general account. However, given the city’s relatively small scale, its current systems seem to be adequate in helping KMC manage its resources.
Budget management. KMC maintains a healthy operating ratio and practices multiyear fiscal planning with a 4-year rolling budget, which allows for better medium-term planning and more realistic projections. The main weakness in its budget practices is the lack of integration between the Development Plan, 2006–2015 and the budget.
Figure 11: Kurunegala Municipal Council’s Score – Governance
Source: Asian Development Bank.
Local Panel Score Expert Panel Score
- 1.00 2.00 3.00 4.00 5.00
City-Region Governance
Civil Engagement
Transparency andAccountability
E-GovernanceDevelopmentPermit Process
DevelopmentControls
Asset Management

City Competitiveness Profiles�63
Revenue enhancement. KMC’s own-source revenue as a proportion of total revenue is high—an average of 72% from 2011 to 2013 with an upward trend. Own-source revenue as a proportion of total recurrent expenditure is also high—an average of 91% from 2011 to 2013. Property tax is the largest source of its own-source revenue, averaging 44% of the total amount it collected from taxes, fees, licenses, rents, and fines during this same period. The property valuation was updated in 2012, and all taxable properties are registered in the tax database. Property tax collection efficiency averaged over 100% from 2011 to 2013 due to its success in collecting arrears through a dedicated cell. KMC also provides financial incentives to tax collectors and rebates to citizens who pay in advance. Revenues from leasing properties accounted for about one-fifth of its own-source revenue from 2011 to 2013. This revenue is used to construct and maintain public facilities such as its bus park. KMC has made an effort to improve the customer experience with the opening of a payment center with attractive facilities, low waiting times, and a bank branch in the same premises for making all payments to KMC. A frontier area for KMC would be land-based financing such as value capture (see Figure 12 for scores in the finance category).
Figure 12: Kurunegala Municipal Council’s Score – Finance
Source: Asian Development Bank.
Local Panel Score Expert Panel Score
-
1.00
2.00
3.00
4.00
5.00Financial Management Systems
BudgetManagement
RevenueEnhancement
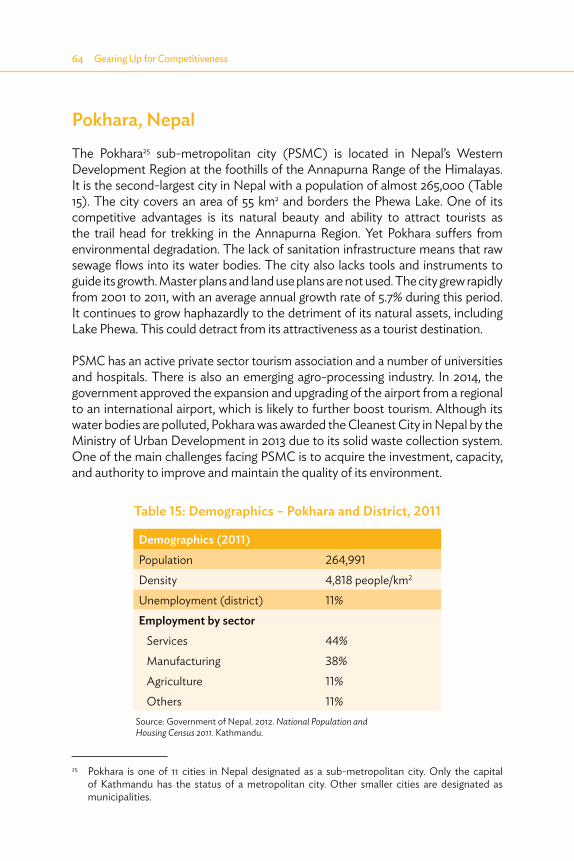
64�Gearing Up for Competitiveness
Pokhara, NepalThe Pokhara25 sub-metropolitan city (PSMC) is located in Nepal’s Western Development Region at the foothills of the Annapurna Range of the Himalayas. It is the second-largest city in Nepal with a population of almost 265,000 (Table 15). The city covers an area of 55 km2 and borders the Phewa Lake. One of its competitive advantages is its natural beauty and ability to attract tourists as the trail head for trekking in the Annapurna Region. Yet Pokhara suffers from environmental degradation. The lack of sanitation infrastructure means that raw sewage flows into its water bodies. The city also lacks tools and instruments to guide its growth. Master plans and land use plans are not used. The city grew rapidly from 2001 to 2011, with an average annual growth rate of 5.7% during this period. It continues to grow haphazardly to the detriment of its natural assets, including Lake Phewa. This could detract from its attractiveness as a tourist destination.
PSMC has an active private sector tourism association and a number of universities and hospitals. There is also an emerging agro-processing industry. In 2014, the government approved the expansion and upgrading of the airport from a regional to an international airport, which is likely to further boost tourism. Although its water bodies are polluted, Pokhara was awarded the Cleanest City in Nepal by the Ministry of Urban Development in 2013 due to its solid waste collection system. One of the main challenges facing PSMC is to acquire the investment, capacity, and authority to improve and maintain the quality of its environment.
Table 15: Demographics – Pokhara and District, 2011
Demographics (2011)Population 264,991Density 4,818 people/km2
Unemployment (district) 11%Employment by sector
Services 44%Manufacturing 38%Agriculture 11%Others 11%
Source: Government of Nepal. 2012. National Population and Housing Census 2011. Kathmandu.
25 Pokhara is one of 11 cities in Nepal designated as a sub-metropolitan city. Only the capital of Kathmandu has the status of a metropolitan city. Other smaller cities are designated as municipalities.
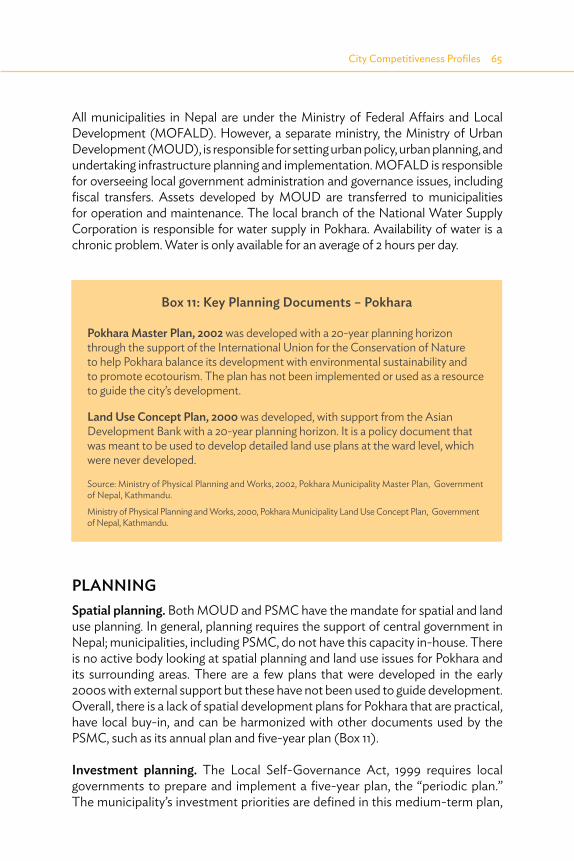
City Competitiveness Profiles�65
Box 11: Key Planning Documents – Pokhara
Pokhara Master Plan, 2002 was developed with a 20-year planning horizon through the support of the International Union for the Conservation of Nature to help Pokhara balance its development with environmental sustainability and to promote ecotourism. The plan has not been implemented or used as a resource to guide the city’s development.
Land Use Concept Plan, 2000 was developed, with support from the Asian Development Bank with a 20-year planning horizon. It is a policy document that was meant to be used to develop detailed land use plans at the ward level, which were never developed.
Source: Ministry of Physical Planning and Works, 2002, Pokhara Municipality Master Plan, Government of Nepal, Kathmandu.
Ministry of Physical Planning and Works, 2000, Pokhara Municipality Land Use Concept Plan, Government of Nepal, Kathmandu.
All municipalities in Nepal are under the Ministry of Federal Affairs and Local Development (MOFALD). However, a separate ministry, the Ministry of Urban Development (MOUD), is responsible for setting urban policy, urban planning, and undertaking infrastructure planning and implementation. MOFALD is responsible for overseeing local government administration and governance issues, including fiscal transfers. Assets developed by MOUD are transferred to municipalities for operation and maintenance. The local branch of the National Water Supply Corporation is responsible for water supply in Pokhara. Availability of water is a chronic problem. Water is only available for an average of 2 hours per day.
PLANNINGSpatial planning. Both MOUD and PSMC have the mandate for spatial and land use planning. In general, planning requires the support of central government in Nepal; municipalities, including PSMC, do not have this capacity in-house. There is no active body looking at spatial planning and land use issues for Pokhara and its surrounding areas. There are a few plans that were developed in the early 2000s with external support but these have not been used to guide development. Overall, there is a lack of spatial development plans for Pokhara that are practical, have local buy-in, and can be harmonized with other documents used by the PSMC, such as its annual plan and five-year plan (Box 11).
Investment planning. The Local Self-Governance Act, 1999 requires local governments to prepare and implement a five-year plan, the “periodic plan.” The municipality’s investment priorities are defined in this medium-term plan,
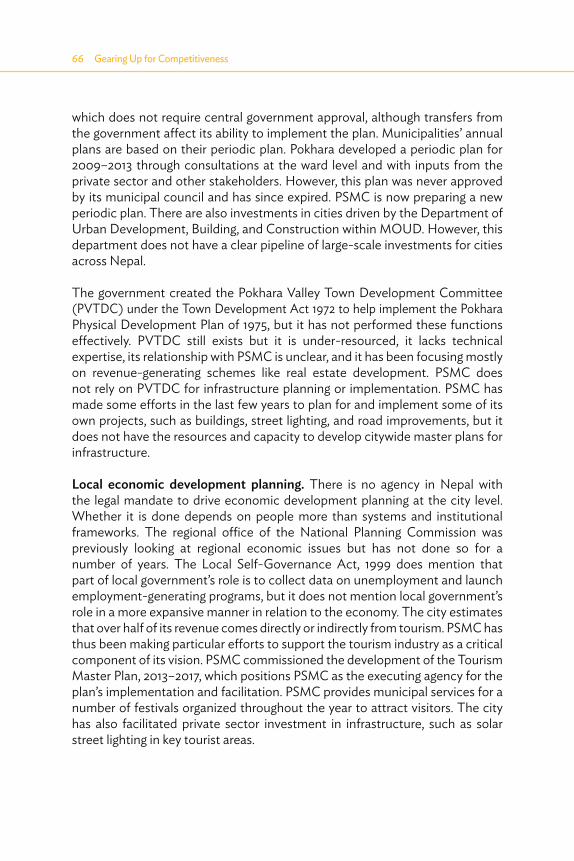
66�Gearing Up for Competitiveness
which does not require central government approval, although transfers from the government affect its ability to implement the plan. Municipalities’ annual plans are based on their periodic plan. Pokhara developed a periodic plan for 2009–2013 through consultations at the ward level and with inputs from the private sector and other stakeholders. However, this plan was never approved by its municipal council and has since expired. PSMC is now preparing a new periodic plan. There are also investments in cities driven by the Department of Urban Development, Building, and Construction within MOUD. However, this department does not have a clear pipeline of large-scale investments for cities across Nepal.
The government created the Pokhara Valley Town Development Committee (PVTDC) under the Town Development Act 1972 to help implement the Pokhara Physical Development Plan of 1975, but it has not performed these functions effectively. PVTDC still exists but it is under-resourced, it lacks technical expertise, its relationship with PSMC is unclear, and it has been focusing mostly on revenue-generating schemes like real estate development. PSMC does not rely on PVTDC for infrastructure planning or implementation. PSMC has made some efforts in the last few years to plan for and implement some of its own projects, such as buildings, street lighting, and road improvements, but it does not have the resources and capacity to develop citywide master plans for infrastructure.
Local economic development planning. There is no agency in Nepal with the legal mandate to drive economic development planning at the city level. Whether it is done depends on people more than systems and institutional frameworks. The regional office of the National Planning Commission was previously looking at regional economic issues but has not done so for a number of years. The Local Self-Governance Act, 1999 does mention that part of local government’s role is to collect data on unemployment and launch employment-generating programs, but it does not mention local government’s role in a more expansive manner in relation to the economy. The city estimates that over half of its revenue comes directly or indirectly from tourism. PSMC has thus been making particular efforts to support the tourism industry as a critical component of its vision. PSMC commissioned the development of the Tourism Master Plan, 2013–2017, which positions PSMC as the executing agency for the plan’s implementation and facilitation. PSMC provides municipal services for a number of festivals organized throughout the year to attract visitors. The city has also facilitated private sector investment in infrastructure, such as solar street lighting in key tourist areas.
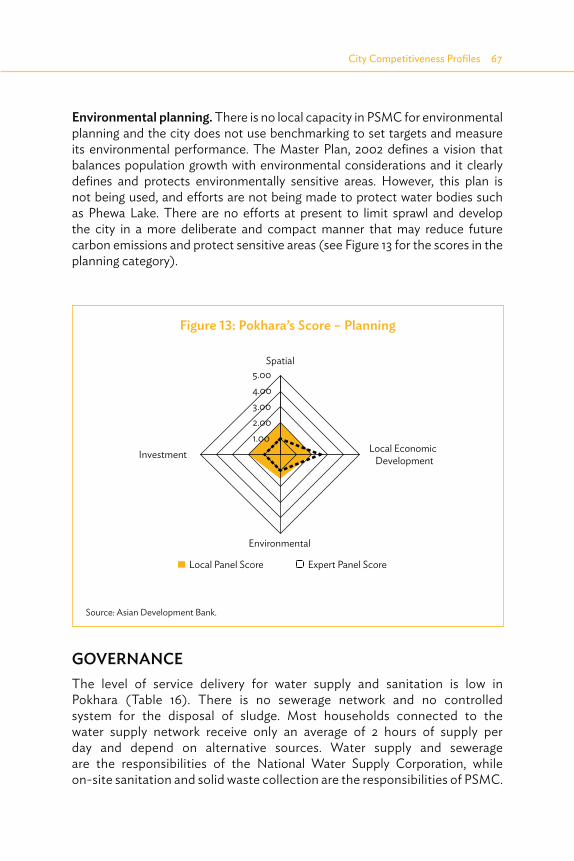
City Competitiveness Profiles�67
Environmental planning. There is no local capacity in PSMC for environmental planning and the city does not use benchmarking to set targets and measure its environmental performance. The Master Plan, 2002 defines a vision that balances population growth with environmental considerations and it clearly defines and protects environmentally sensitive areas. However, this plan is not being used, and efforts are not being made to protect water bodies such as Phewa Lake. There are no efforts at present to limit sprawl and develop the city in a more deliberate and compact manner that may reduce future carbon emissions and protect sensitive areas (see Figure 13 for the scores in the planning category).
GOVERNANCEThe level of service delivery for water supply and sanitation is low in Pokhara (Table 16). There is no sewerage network and no controlled system for the disposal of sludge. Most households connected to the water supply network receive only an average of 2 hours of supply per day and depend on alternative sources. Water supply and sewerage are the responsibilities of the National Water Supply Corporation, while on-site sanitation and solid waste collection are the responsibilities of PSMC.
Figure 13: Pokhara’s Score – Planning
Source: Asian Development Bank.
Local Panel Score Expert Panel Score
- 1.00 2.00 3.00 4.00 5.00
Spatial
Local EconomicDevelopment
Environmental
Investment
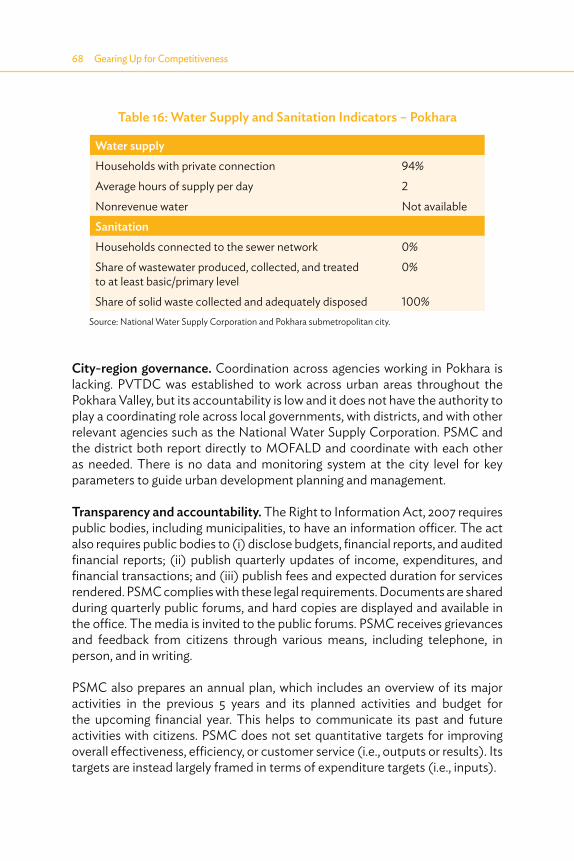
68�Gearing Up for Competitiveness
Table 16: Water Supply and Sanitation Indicators – Pokhara
Water supply Households with private connection 94%Average hours of supply per day 2Nonrevenue water Not availableSanitation Households connected to the sewer network 0%Share of wastewater produced, collected, and treated to at least basic/primary level
0%
Share of solid waste collected and adequately disposed 100%Source: National Water Supply Corporation and Pokhara submetropolitan city.
City-region governance. Coordination across agencies working in Pokhara is lacking. PVTDC was established to work across urban areas throughout the Pokhara Valley, but its accountability is low and it does not have the authority to play a coordinating role across local governments, with districts, and with other relevant agencies such as the National Water Supply Corporation. PSMC and the district both report directly to MOFALD and coordinate with each other as needed. There is no data and monitoring system at the city level for key parameters to guide urban development planning and management.
Transparency and accountability. The Right to Information Act, 2007 requires public bodies, including municipalities, to have an information officer. The act also requires public bodies to (i) disclose budgets, financial reports, and audited financial reports; (ii) publish quarterly updates of income, expenditures, and financial transactions; and (iii) publish fees and expected duration for services rendered. PSMC complies with these legal requirements. Documents are shared during quarterly public forums, and hard copies are displayed and available in the office. The media is invited to the public forums. PSMC receives grievances and feedback from citizens through various means, including telephone, in person, and in writing.
PSMC also prepares an annual plan, which includes an overview of its major activities in the previous 5 years and its planned activities and budget for the upcoming financial year. This helps to communicate its past and future activities with citizens. PSMC does not set quantitative targets for improving overall effectiveness, efficiency, or customer service (i.e., outputs or results). Its targets are instead largely framed in terms of expenditure targets (i.e., inputs).
City Competitiveness Profiles�69
Civil engagement. The Local Self-Governance Act specifies that consultations must take place during the planning process—e.g., in the development of the master plan. However, there is not much large-scale planning that has taken place in Pokhara in the last decade due to the conflict, political instability, and capacity issues. The quarterly public forums continue to be an effective mechanism to gather public feedback, and there are some examples of PSMC working with the private sector and citizens on cost-sharing for capital investments. Civil society is not, however, involved in ongoing and deeper collaboration and partnership, such as membership in budget or planning committees. PSMC’s information officer is tasked with disseminating information, and not leading consultations. Civil engagement remains largely at a consultative level, particularly through PSMC ward officers, and PSMC allocates internal funds for communications activities.
E-governance. PSMC has not yet adopted an e-governance approach and there is a lot of progress to be made in this area. Its information technology function is outsourced, and in-house capacity is weak. Its website is currently a shell with very little information. Citizens cannot lodge grievances through e-mail or the website. Computers are not connected to a central server that might facilitate information sharing. Its land database is not yet digitized. There is room for substantial improvement.
Development permit process. PSMC has made a concerted effort to streamline the process of issuing building permits. PSMC’s customer charter defines a period of 17 days to process a building permit application. It has been able to deliver on this promise. The time and cost of processing an application is predictable. Applicants are only required to visit one “window” in PSMC. In addition, PSMC has a published list of minor works that do not require a permit. PSMC only checks for building code compliance and not land use compliance, as there are no zoning regulations in Nepal.
Development control. Although the permitting process is effective and efficient, PSMC is unable to fully control and steer development. It does not have the zoning regulations to be able to reject development on the basis of land use incompatibility nor does it have adequate staff for site inspections. PSMC estimates that at least 20% of buildings violate height restrictions, the most common violation. PSMC is not actively penalizing violators, but it sometimes withholds the issuance of new permits for developers with clear violations elsewhere. Violations of development in the lakeshore buffer zone are evident.
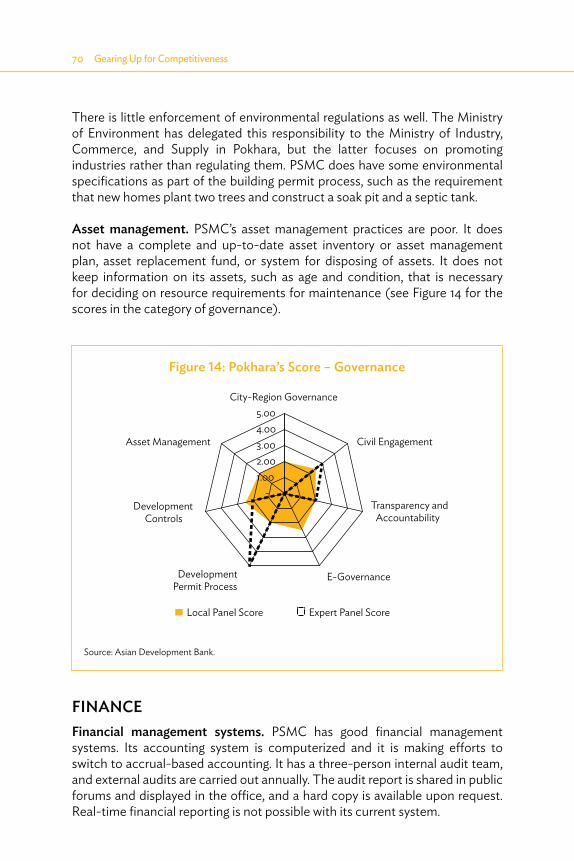
70�Gearing Up for Competitiveness
There is little enforcement of environmental regulations as well. The Ministry of Environment has delegated this responsibility to the Ministry of Industry, Commerce, and Supply in Pokhara, but the latter focuses on promoting industries rather than regulating them. PSMC does have some environmental specifications as part of the building permit process, such as the requirement that new homes plant two trees and construct a soak pit and a septic tank.
Asset management. PSMC’s asset management practices are poor. It does not have a complete and up-to-date asset inventory or asset management plan, asset replacement fund, or system for disposing of assets. It does not keep information on its assets, such as age and condition, that is necessary for deciding on resource requirements for maintenance (see Figure 14 for the scores in the category of governance).
FINANCEFinancial management systems. PSMC has good financial management systems. Its accounting system is computerized and it is making efforts to switch to accrual-based accounting. It has a three-person internal audit team, and external audits are carried out annually. The audit report is shared in public forums and displayed in the office, and a hard copy is available upon request. Real-time financial reporting is not possible with its current system.
Figure 14: Pokhara’s Score – Governance
Source: Asian Development Bank.
Local Panel Score Expert Panel Score
- 1.00 2.00 3.00 4.00 5.00
City-Region Governance
Civil Engagement
Transparency andAccountability
E-GovernanceDevelopmentPermit Process
DevelopmentControls
Asset Management

City Competitiveness Profiles�71
Budget management. PSMC does not use multiyear fiscal planning for better planning and greater continuity in the implementation of medium- to long-term projects and programs. There is little integration between spatial plans and the budget, because the former are not used, but the budget is linked to the annual plan. Cities in Nepal do have the autonomy to prepare and approve their own budgets and share them with MOFALD for information, and to request central government budgetary support. PSMC maintains a healthy operating ratio.
Revenue enhancement. PSMC has been making a concerted effort to increase its own-source revenue. It is no longer running a deficit as of fiscal year (FY) 2013. The share of own-source revenue grew from 41% in FY2011 to 82% in FY2014, largely as a result of its campaign to increase its property tax base. Property tax collection efficiency averaged 120% between FY2011 and FY2014 due to its success in collecting arrears as well as current collectibles. The formation of local committees and public awareness campaigns has helped convince citizens to pay, and PSMC actually reduced the tax rate but increased absolute collection figures by expanding the tax base. It is progressively adding all properties to its tax database, including idle land, which was previously not taxed. Still, it estimates that only about 60% of properties are registered in its tax database. PSMC also charges betterment fees to beneficiaries of improvements such as road widening. Its successful initiative to increase its revenue base shows promise for PSMC’s ability to deliver on its vision of competitiveness (see Figure 15 for the scores in the category of finance).
Figure 15: Pokhara’s Score – Finance
Source: Asian Development Bank.
-
1.00
2.00
3.00
4.00
5.00Financial Management Systems
BudgetManagement
RevenueEnhancement
Local Panel Score Expert Panel Score

CHAPTER 4
Insights and the Way Forward
This report advocates strengthened understanding of the relevance of planning, governance, and finance for city competitiveness in small and medium-sized cities. The findings reflect the need to improve the integration of the three functions to address the circumstances that small and medium-sized cities face.
The two-pronged assessment by local and expert panels shows that a city’s perception of its own performance differs from that of the external panel. In Kurunegala, the local panel underestimates the city’s performance compared with the expert panel, and the opposite is true in Gazipur. This may be because these cities’ reference points are other cities within their respective countries, while the expert panel has a more regional and global perspective.
The case studies also show that the context of the four cities differs in terms of their institutional frameworks, assets, and capacity. Nevertheless, some trends can be observed. In general, the planning function has not been devolved. It remains traditional, with limited integration of land use, transport, and land as a means of financing. There is also a need throughout the region to devolve more functions to local bodies while strengthening their capacities through induction or third-party support such as through service and management contracts to build on-the-job capacity over time. Options in the interim could be (i) the use of intermediaries to bridge the planning, design, financing, and implementation gaps; or (ii) strengthening coordination and collaboration between local government and parastatals to meet local development needs.
The study shows that some small and medium-sized cities are taking steps to improve their competitiveness, and can do more. Some broad directions to increase their role in improving the investment climate are shared below.
Understand city strengths. A city needs to understand its strengths—its comparative advantages and capacities—and develop its vision accordingly.
Create a brand. Cities need to develop a recognizable “brand” that articulates their vision and is reflected in their priorities and strategies. This requires self-awareness to understand their unique identity and potential—and how this can ultimately position the city for greater competitiveness.

Insights and the Way Forward �73
Align plans, strategies, and actions with the brand. Cities should orient their plans, strategies, and actions to (i) promote economic growth; (ii) develop required infrastructure; (iii) enhance institutional effectiveness; and (iv) improve quality of life in order to attract businesses, investment, talent, and visitors (e.g., for tourism or transit).
Strengthen the planning process. Critical considerations for improving the planning process are highlighted below.
Long-term master plans are still necessary for guiding a city’s growth but need to be complemented with (i) more flexible review mechanisms, such as for promoting higher-density, mixed-use development and land use changes; (ii) shorter-term action plans; and (iii) annual budgetary allocations that offer the flexibility to include new opportunities through the budgetary process. An urban database with spatial, social, economic, physical, and environmental information is critical for developing and updating integrated plans.Use of technology to capture, monitor, and share data and to inform decisions is important.Planning instruments, such as transfer of development rights, should support acquisition of land for public purposes. Land-based financing instruments, such as premium floor space index, betterment levies, development charges, etc., should be made available to implement priority projects.
Strengthen management. To improve growth management, service delivery, and finance, local government must be at the center of the planning process, even if the preparation of the master plan, or other functions, has not been delegated to them or is carried out by other entities until local governments can manage the process themselves. This is possible through a coordination process driven by the local government and supported by the central government. Otherwise, the priorities of the master plan may not reflect the local government’s vision—and local governments are ultimately responsible for plan implementation. Local government involvement in the planning process helps to bridge the current disconnect between planning and implementation. Lessons from past efforts to strengthen local government management include the following measures:
Ensure that tenures of local officials are appropriate to ensure continuity, and that the systems and processes are strong enough to ensure continuity in implementing the city’s priorities as articulated in the plan or strategies.
74�Gearing Up for Competitiveness
Evolve a cadre of urban management professionals in the civil service structure.Articulate local government’s functions and powers to plan, finance, and implement its competitiveness strategy in consultation with central government.
In cases where powers have not been delegated to local government, a legal mechanism such as a district- or metropolitan-level committee is needed to facilitate and coordinate implementation of the development agenda.
Strengthen financial management. There are a number of critical considerations for cities to strengthen their investment planning and finance:
Cities need multiyear investment plans and budgets in order to implement a longer-term vision. Investment and project planning will likely continue to be a mix of bottom-up and top-down approaches in medium-sized cities, but this should not prevent cities from building their internal capacity and making efforts to increasingly drive the process while also being opportunistic and cooperating with (and shaping) externally driven investments.Local governments need support to translate their priorities into investment plans and identify potential sources of finance. This may require the initial support of an intermediary to convert priorities into implementable programs. Medium-sized cities currently have little capacity for investment planning. Local governments should develop strategies to maximize and leverage their existing resources, set targets, and develop budgets accordingly. At the moment, budgets are instead largely based on historical trends and political considerations. Cities need adequate powers to raise finances for investment, operations, and maintenance through revised lease rates of commercial properties, land-based financing, expansion of their property tax base, and improving collection efficiency.
To compete, connect. Physical connections through road, rail, and air are of course important for competitiveness. Competitive cities also understand that they must tap into a wide range of financial, human, and intellectual capital and networks in order to continuously learn, grow, and leverage their resources. This includes establishing strategic relationships and partnerships with different levels of government, other agencies, the private sector, and civil society. Finally, competitive cities are able to integrate planning, governance, and finance toward a common purpose of improving the investment climate.
References
ADB. 2008. City Cluster Development. Manila. ___. 2011. Competitive Cities in the 21st Century. Manila.American Planning Association. What Is Planning? https://www.planning.org/
aboutplanning/whatisplanning.htm A.T. Kearney. 2012. Global Cities Index and Emerging Cities Outlook. www.
atkearney.com/documents/10192/dfedfc4c-8a62-4162-90e5-2a3f14f0da3aE.J. Blakely and N.G. Leigh. 2010. Planning Local Economic Development: Theory
and Practice. Los Angeles: Sage Publications.B. Bosworth and S. Milusheva. 2011. Innovations in U.S. Infrastructure Financing:
An Evaluation. www.brookings.edu/research/papers/2011/10/20-infrastructure-financing-bosworth-milusheva
Center for Transit-Oriented Development. 2008. Capturing the Value of Transit. http://reconnectingamerica.org/resource-center/books-and-reports/2008/capturing-the-value-of-transit-3
B. Dahiya. 2012. Cities in Asia, 2012: Demographics, Economics, Poverty, Environment and Governance. Volume 29 (Supplement 2). pp. S44–S61.
The Economist. 2014. A Long and Winding Road. www.economist.com/news/finance-and-economics/21599394-world-needs-more-infrastructure-how-will-it-pay-it-long-and-winding
Economist Intelligence Unit. 2013. Hot Spots 2025: Benchmarking the Future Competitiveness of Cities. Commissioned by Citi. www.citigroup.com/citi/citiforcities/pdfs/hotspots2025.pdf
C. Eiser. 2004. Children with Cancer: The Quality of Life. First ed. Mahwah, NJ: Lawrence Erlbaum Associates. p. 344.
Federation of Indian Chambers of Commerce and Industry. 2011. Urban Infrastructure in India. www.ficci.com/spdocument/20122/Urban_infra.pdf
J. Felipe. 2012. Tracking the Middle-Income Trap: What is It, Who is in It, and Why? Part 1. ADB Economics Working Paper Series. No. 306. Manila: Asian Development Bank.
E. Ghani et al. 2012. What Makes Cities More Competitive? Spatial Determinants of Entrepreneurship in India. World Bank Policy Research Working Paper Series. No. 6198. Washington, DC: World Bank.
Government of India, High Powered Expert Committee for Estimating the Investment Requirements for Urban Infrastructure Services. 2011. Report on Indian Urban Infrastructure and Services. Delhi.
Government of Singapore, Urban Redevelopment Authority. 2013. Draft Master Plan 2013. Singapore.
76�References
Government of Sri Lanka. 2011. National Physical Planning Policy and Plan 2011–2030. Colombo.
J. Huxley. 2009. Value Capture Finance: Making Urban Development Pay its Way. Urban Land Institute. http://uli.org/wp-content/uploads/ULI-Documents/Value-Capture-Finance-Report.pdf
IMD. World Competitiveness Yearbook. www.imd.org/research/publications/wcy/index.cfm
Indian Institute for Human Settlements. 2011. Urban India 2011: Evidence. https://www.citiesalliance.org/sites/citiesalliance.org/files/IUC%20Booklet%20on%20Indian%20cities.pdf
A. Kapit and S. Mann. 2008. 10 Most Competitive Cities in India. India: Institute for Competitiveness.
D. Kaufmann et al. 2010. The Worldwide Governance Indicators: Methodology and Analytical Issues. World Bank Policy Research Working Paper Series. No. 5430. Washington, DC: World Bank.
McKinsey Global Institute. 2010. India’s Urban Awakening: Building Inclusive Cities, Sustaining Economic Growth. www.mckinsey.com/insights/urbanization/urban_awakening_in_india
___. 2011. Urban World: Mapping the Economic Power of Cities. www.mckinsey.com/insights/urbanization/urban_world
___. 2013. Infrastructure Productivity: How to Save $1 Trillion a Year. www.mckinsey.com/insights/engineering_construction/infrastructure_productivity
A. Moore et al. 2001. Competitive Cities: A Report Card on Efficiency in Service Delivery in America’s Largest Cities. Reason Public Policy Institute.
Organisation for Economic Co-operation and Development (OECD). 2012. Redefining Urban: A New Way to Measure Metropolitan Areas. Paris: OECD Publishing.
___. 2006. OECD Territorial Reviews: Competitive Cities in the Global Economy. Paris: OECD Publishing.
N. Pengfei et al. 2008. 2007–2008 Global Urban Competitiveness Report. Beijing: Social Sciences Academic Press.
M.E. Porter. 1990. The Competitive Advantage of Nations. New York: The Free Press.
___. 1998. Clusters and the New Economics of Competition. Harvard Business Review. 1998 Nov–Dec 6 (6). pp. 77–90.
A. Shlomo. 2012. Planet of Cities. Cambridge, MA: Lincoln Institute of Land Policy.
Site Selection Magazine and IBM Global Business Services. 2013. The World’s Most Competitive Cities: A Global Investor’s Perspective on True City

References�77
Competitiveness. http://siteselection.com/promos/IBM/IBM_CompCities.pdf
UN-Habitat. 2009. Guide to Municipal Finance, Human Settlements Financing Tools and Best Practices Series. Nairobi.
UNICEF and World Health Organization. 2012. Progress on Drinking Water and Sanitation 2012 Update. www.unicef.org/media/files/JMPreport2012.pdf
United Nations Conference on Trade and Development. 2011. FDI Potential Index. World Investment Report 2012. http://unctad.org/en/PublicationsLibrary/wir2012_embargoed_en.pdf
United Nations Department of Economic and Social Affairs. 2007. World Population Prospects: The 2006 Revision. New York: United Nations.
United Nations Development Programme. 2013. Human Development Report. New York.
United States Environmental Protection Agency. 2013. Infrastructure Financing Options for Transit-Oriented Development. www.epa.gov/dced/pdf/2013-0122-TOD-infrastructure-financing-report.pdf
Urban Land Institute and Ernst & Young. 2013. Infrastructure 2013. Global Priorities, Global Insights. Washington, DC: Urban Land Institute.
___. 2014. Infrastructure 2014: Shaping the Competitive City. Washington, DC: Urban Land Institute.
A.J. Venables. 2005. New Economic Geography. London: London School of Economics.
Water and Sanitation Program. 1999. Willing to Pay but Unwilling to Charge. https://www.wsp.org/sites/wsp.org/files/publications/94200711902_sawilling.pdf
World Bank. 2008. Exploring Urban Growth Management: Insights from Three Cities. Washington, DC.
___. 2012. Worldwide Governance Indicators. www.govindicators.orgWorld Bank and UN-Habitat. 2012. Turning Sri Lanka’s Vision into Policy and
Action. Colombo: World Bank.World Economic Forum. 2014. The Competitiveness of Cities. http://www3.
weforum.org/docs/GAC/2014/WEF_GAC_CompetitivenessOfCities_Report_2014.pdf
World Bank. n.d. Summary of Urban Competitive Assessment. http://info.worldbank.org/etools/docs/library/166856/UCMP/UCMP/step_two_urban_competitiveness.html (accessed 25 May 2014).
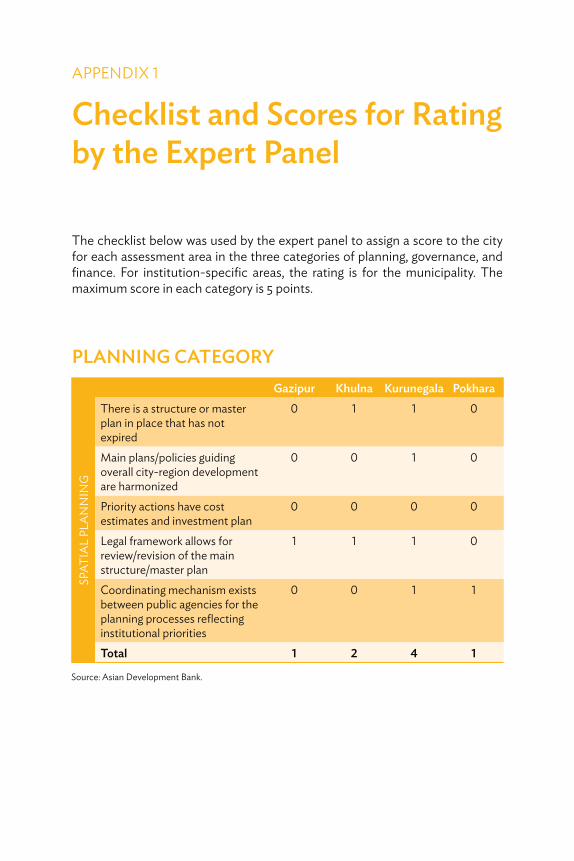
APPENDIX 1
Checklist and Scores for Rating by the Expert Panel
The checklist below was used by the expert panel to assign a score to the city for each assessment area in the three categories of planning, governance, and finance. For institution-specific areas, the rating is for the municipality. The maximum score in each category is 5 points.
PLANNING CATEGORYGazipur Khulna Kurunegala Pokhara
SPAT
IAL
PLA
NN
ING
There is a structure or master plan in place that has not expired
0 1 1 0
Main plans/policies guiding overall city-region development are harmonized
0 0 1 0
Priority actions have cost estimates and investment plan
0 0 0 0
Legal framework allows for review/revision of the main structure/master plan
1 1 1 0
Coordinating mechanism exists between public agencies for the planning processes reflecting institutional priorities
0 0 1 1
Total 1 2 4 1
Source: Asian Development Bank.

Checklist and Scores for Rating by the Expert Panel�79
Gazipur Khulna Kurunegala Pokhara
INVE
STM
ENT
PLA
NN
ING
Citywide master plans are available for at least two subsectors (e.g., transport, sanitation, drainage, solid waste)
0 1 1 0
Models or surveys are used the majority of the time to try and assess/predict future demand
0 1 1 0
Investment priorities are defined for 5+ years in a document (e.g., corporate plan, business plan, etc.)
0 0 1 1
Project appraisal typically includes an economic and financial/sustainability assessment
0 1 0 0
Majority of investments are selected on the basis of relevant sector strategies
0 0 0 0
Total 0 3 3 1
Gazipur Khulna Kurunegala Pokhara
LOCA
L EC
ON
OM
IC D
EVEL
OPM
ENT
PLA
NN
ING Local economic development
planning is undertaken0 0 1.25 1.25
Comparative/competitive advantages and local economic vision, strategy are defined and reflected in key development documents that include specific priority activities
0 0 1.25 0
City/regional level economic data is systematically collected and monitored by a public agency
0 0 0 0
Capital investment needs to support key economic sectors have been identified and prioritized
0 0 1.25 1.25
Total 0 0 3.75 2.50
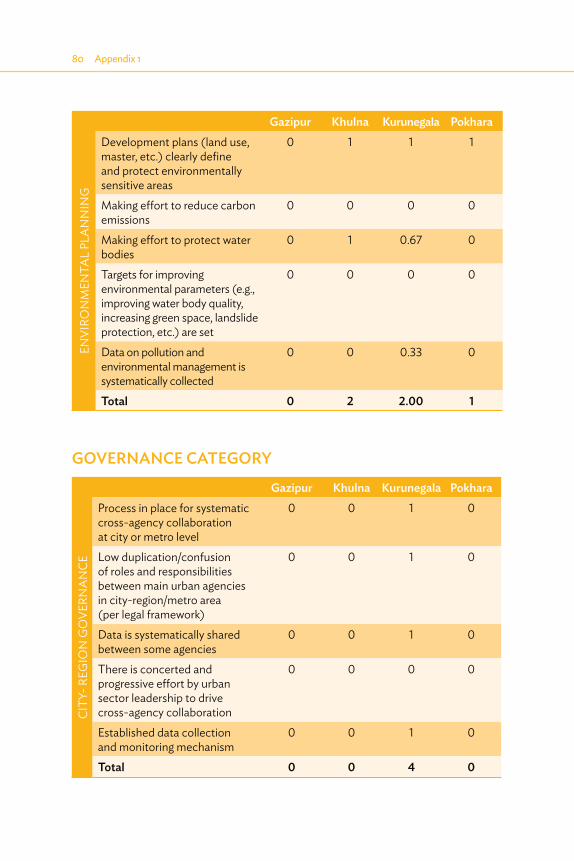
80�Appendix 1
Gazipur Khulna Kurunegala Pokhara
ENVI
RON
MEN
TAL
PLA
NN
ING
Development plans (land use, master, etc.) clearly define and protect environmentally sensitive areas
0 1 1 1
Making effort to reduce carbon emissions
0 0 0 0
Making effort to protect water bodies
0 1 0.67 0
Targets for improving environmental parameters (e.g., improving water body quality, increasing green space, landslide protection, etc.) are set
0 0 0 0
Data on pollution and environmental management is systematically collected
0 0 0.33 0
Total 0 2 2.00 1
GOVERNANCE CATEGORY
Gazipur Khulna Kurunegala Pokhara
CITY
- REG
ION
GO
VERN
AN
CE
Process in place for systematic cross-agency collaboration at city or metro level
0 0 1 0
Low duplication/confusion of roles and responsibilities between main urban agencies in city-region/metro area (per legal framework)
0 0 1 0
Data is systematically shared between some agencies
0 0 1 0
There is concerted and progressive effort by urban sector leadership to drive cross-agency collaboration
0 0 0 0
Established data collection and monitoring mechanism
0 0 1 0
Total 0 0 4 0
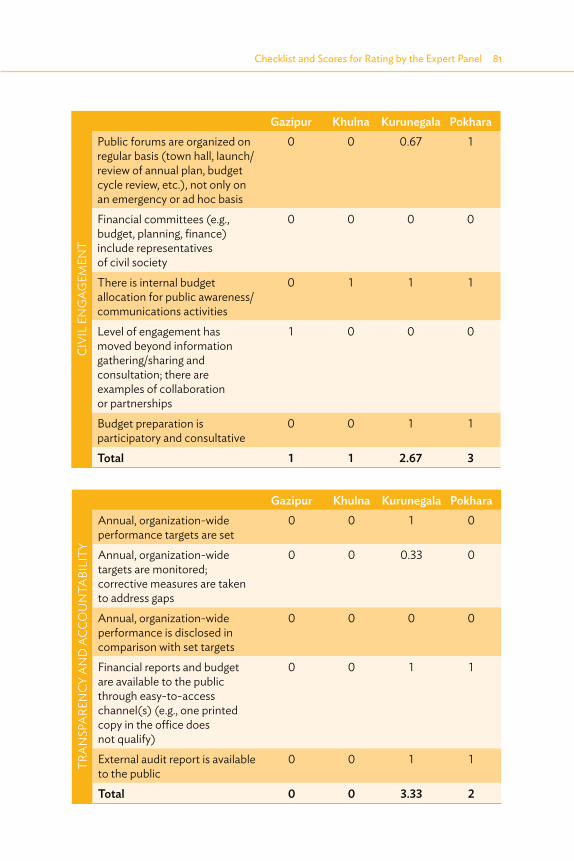
Checklist and Scores for Rating by the Expert Panel�81
Gazipur Khulna Kurunegala Pokhara
CIVI
L EN
GAG
EMEN
T
Public forums are organized on regular basis (town hall, launch/review of annual plan, budget cycle review, etc.), not only on an emergency or ad hoc basis
0 0 0.67 1
Financial committees (e.g., budget, planning, finance) include representatives of civil society
0 0 0 0
There is internal budget allocation for public awareness/communications activities
0 1 1 1
Level of engagement has moved beyond information gathering/sharing and consultation; there are examples of collaboration or partnerships
1 0 0 0
Budget preparation is participatory and consultative
0 0 1 1
Total 1 1 2.67 3
Gazipur Khulna Kurunegala Pokhara
TRA
NSP
ARE
NCY
AN
D A
CCO
UN
TABI
LITY
Annual, organization-wide performance targets are set
0 0 1 0
Annual, organization-wide targets are monitored; corrective measures are taken to address gaps
0 0 0.33 0
Annual, organization-wide performance is disclosed in comparison with set targets
0 0 0 0
Financial reports and budget are available to the public through easy-to-access channel(s) (e.g., one printed copy in the office does not qualify)
0 0 1 1
External audit report is available to the public
0 0 1 1
Total 0 0 3.33 2

Gazipur Khulna Kurunegala Pokhara
E-G
OVE
RNA
NCE
Website includes latest financial reports, plans, and policies
0 0 1 0
Uses an e-procurement system for recruitments of consultants, contractors, suppliers
0 0 0 0
Has online payment system for citizens (e.g., bills, taxes, fees)
0 0 0 0
Has online feedback/grievance system
0 0 0 0
Land registry is electronic 0 1 0 0Total 0 1 1 0
Gazipur Khulna Kurunegala Pokhara
DEV
ELO
PMEN
T PE
RMIT
PRO
CESS
Efforts have been made to streamline the process (e.g., have reforms been implemented to reduce the number of steps and processing time)?
0 1 0 1
One-stop shop in place (i.e., not necessary to visit multiple agencies)
0 0 0 1
The processing time is considered predictable and acceptable
0 1 1 1
The processing cost is considered predictable and acceptable
1 1 1 1
Has an established list of minor works that do not require approval
1 1 0 1
Total 2 4 2 5
82�Appendix 1
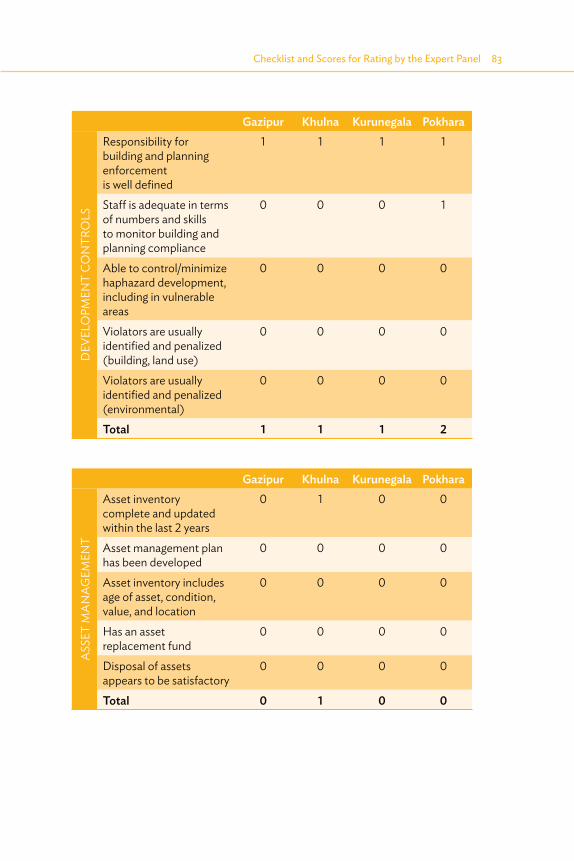
Checklist and Scores for Rating by the Expert Panel�83
Gazipur Khulna Kurunegala Pokhara
DEV
ELO
PMEN
T CO
NTR
OLS
Responsibility for building and planning enforcement is well defined
1 1 1 1
Staff is adequate in terms of numbers and skills to monitor building and planning compliance
0 0 0 1
Able to control/minimize haphazard development, including in vulnerable areas
0 0 0 0
Violators are usually identified and penalized (building, land use)
0 0 0 0
Violators are usually identified and penalized (environmental)
0 0 0 0
Total 1 1 1 2
Gazipur Khulna Kurunegala Pokhara
ASS
ET M
AN
AGEM
ENT
Asset inventory complete and updated within the last 2 years
0 1 0 0
Asset management plan has been developed
0 0 0 0
Asset inventory includes age of asset, condition, value, and location
0 0 0 0
Has an asset replacement fund
0 0 0 0
Disposal of assets appears to be satisfactory
0 0 0 0
Total 0 1 0 0
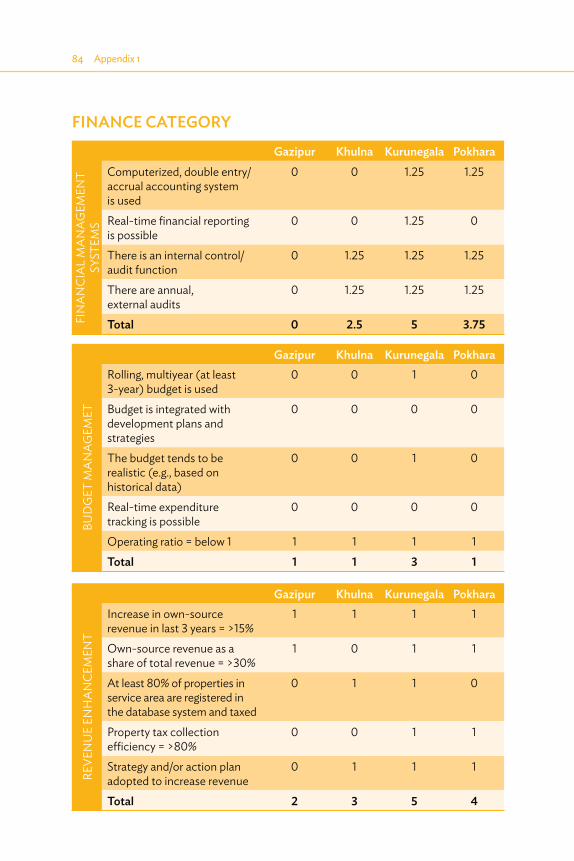
FINANCE CATEGORY
Gazipur Khulna Kurunegala Pokhara
FIN
AN
CIA
L M
AN
AGEM
ENT
SYST
EMS
Computerized, double entry/accrual accounting system is used
0 0 1.25 1.25
Real-time financial reporting is possible
0 0 1.25 0
There is an internal control/audit function
0 1.25 1.25 1.25
There are annual, external audits
0 1.25 1.25 1.25
Total 0 2.5 5 3.75
Gazipur Khulna Kurunegala Pokhara
BUD
GET
MA
NAG
EMET
Rolling, multiyear (at least 3-year) budget is used
0 0 1 0
Budget is integrated with development plans and strategies
0 0 0 0
The budget tends to be realistic (e.g., based on historical data)
0 0 1 0
Real-time expenditure tracking is possible
0 0 0 0
Operating ratio = below 1 1 1 1 1Total 1 1 3 1
Gazipur Khulna Kurunegala Pokhara
REVE
NU
E EN
HA
NCE
MEN
T
Increase in own-source revenue in last 3 years = >15%
1 1 1 1
Own-source revenue as a share of total revenue = >30%
1 0 1 1
At least 80% of properties in service area are registered in the database system and taxed
0 1 1 0
Property tax collection efficiency = >80%
0 0 1 1
Strategy and/or action plan adopted to increase revenue
0 1 1 1
Total 2 3 5 4
84�Appendix 1
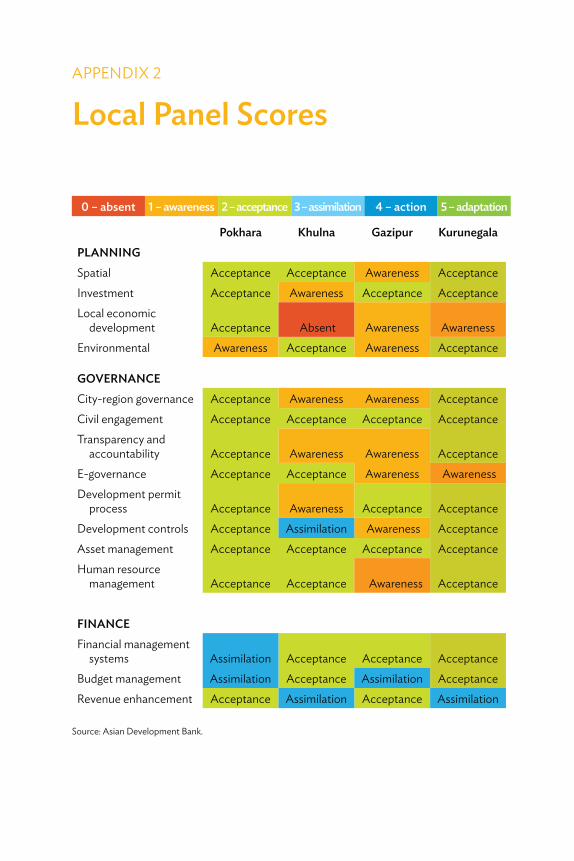
APPENDIX 2
Local Panel Scores
0 – absent 1 – awareness 2 – acceptance 3 – assimilation 4 – action 5 – adaptation
Pokhara Khulna Gazipur KurunegalaPLANNINGSpatial Acceptance Acceptance Awareness AcceptanceInvestment Acceptance Awareness Acceptance AcceptanceLocal economic development Acceptance Absent Awareness Awareness Environmental Awareness Acceptance Awareness Acceptance
GOVERNANCECity-region governance Acceptance Awareness Awareness AcceptanceCivil engagement Acceptance Acceptance Acceptance AcceptanceTransparency and accountability Acceptance Awareness Awareness AcceptanceE-governance Acceptance Acceptance Awareness Awareness Development permit process Acceptance Awareness Acceptance AcceptanceDevelopment controls Acceptance Assimilation Awareness AcceptanceAsset management Acceptance Acceptance Acceptance AcceptanceHuman resource management Acceptance Acceptance Awareness Acceptance
FINANCEFinancial management systems Assimilation Acceptance Acceptance AcceptanceBudget management Assimilation Acceptance Assimilation AcceptanceRevenue enhancement Acceptance Assimilation Acceptance Assimilation
Source: Asian Development Bank.
Index
Boxes, figures, notes, and tables are indicated by “b,” “f,” “n,” and “t” following page numbers.
AAccess to finance, 23–26Accountability. See Transparency and accountabilityAccounting, 26–27, 54, 70Actual capacity, 30t, 31, 31fADB. See Asian Development BankAdministrative skills, 21Asian Development Bank city competitiveness measurements by, 3, 3t study methodology and, 29Asset management as assessment area, 34, 34t in Gazipur, 43 in Khulna, 53 in Kurunegala, 61 in Pokhara, 70 service delivery and, 22 skills and systems for, 20Audit/auditing, 26–27, 44, 54, 62, 70
BBangladesh, xi. See also Gazipur City Corporation; Khulna City Corporation;
Rajdhani Unnayan Kartripakkhya central government of, 45, 48, 51, 52 governance and, 40–43 infrastructure development in, 48, 48n20 local economic development planning in, 38–39 planning in, 46–47 poverty in, 45, 45n15 service delivery in, 21–22 urbanization rates in, 1, 2tBangladesh Municipal Development Fund, 54, 54n23Bangladesh Railway, 46–47, 49Bangladesh Road Transport Authority, 40
Index�87
Basel 3, 24n8Betterment taxes, 54–55, 70, 73Bonds, infrastructure financing and, 24Branding, 5, 48, 72–73Budget management, 26–27 as assessment area, 35, 35t in Gazipur, 41, 42, 44 in Khulna, 54 in Kurunegala, 60, 62 in Pokhara, 71Building permits. See Development permit processBuilding regulations enforcement, 18–20. See also Development controls
CCadastral data, 28, 37Capacity assessments of, 30–31, 30t capacity-building programs, 22 constraints, 22, 52, 53 institutional effectiveness, 12t, 18t, 51, 73 investment planning, 74 physical planning and, 14 Pokhara planning and, 67, 69 service delivery, 22 of staff, 15, 16, 34, 34t, 42, 50, 52, 59Carbon emissions, 39, 49, 67Central Environmental Authority (Sri Lanka), 61Central/regional governments, role of, xi, 4. See also specific countries and citiesChina, People’s Republic of infrastructure investment and, 23–24, 24n9 Kurunegala water supply improvements and, 58Citizen involvement. See Civil engagementCity, classification of, 2, 2n2City competitiveness, x–xi, 9–28. See also Local government city profiles. See Gazipur City Corporation; Khulna City Corporation;
Kurunegala Municipal Council; Pokhara sub-metropolitan city finance and, 23–28. See also Finance governance and, 17–23. See also Governance indexes on, 3, 3t planning, governance and finance effects on, 6–7, 6–7t planning and, 9–17. See also Planning recommendations for, 72–74
88�Index
City Corporation Act (2011; Gazipur, Bangladesh), 40–42, 41tCity management/manager, 18–19, 21–22City-region governance as assessment area, 34, 34t in Gazipur, 40–41 in Khulna, 51 in Kurunegala, 60 in Pokhara, 68City selection, methodology of, 29Civil engagement as assessment area, 34, 34t in Gazipur, 42 in Khulna, 51–52 in Kurunegala, 60 in Pokhara, 68, 69Collaboration and cross-agency coordination, xi, 5 Gazipur and lack of, 38, 40–41 importance of, 22 Khulna and lack of, 46–47, 51 in Kurunegala, 58, 60 Pokhara and lack of, 68 recommendations for, 72, 74Commercial banks, 23, 27Comptroller and Auditor General, Office of the (Bangladesh), 54Computerization and technology. See also E-governance asset management and, 43, 61 financial systems and, 44, 70 in planning process, 73Coordination. See Collaboration and cross-agency coordinationCost recovery, 22Customer service, 55, 60, 68. See also Civil engagement; Transparency and
accountability
DDAP. See Detailed area planData collection methodology, 30Data needs for economic development, 15Decentralization, 17n5Delegation, xi, 38, 61, 70Democracy, 17, 17n5
Index�89
Department of Environment (DOE; Bangladesh), 43, 49, 52, 53Detailed area plan, 37, 37b, 47bDeveloping vs. developed economies, 4Development controls as assessment area, 34, 34t in Gazipur, 43 in Khulna, 52–53 in Kurunegala, 57, 61 in Pokhara, 69–70Development permit process as assessment area, 34, 34t in Gazipur, 42 in Khulna, 52 in Kurunegala, 61 permit applications, 20 in Pokhara, 69Development Plan for the Urban Development Area of Kurunegala (2006-
2015), 57, 57b, 62Devolution, 17, 17n5, 72Dhaka (Bangladesh), 21–22, 36, 45Dhaka Metropolitan Development Plan (Bangladesh), 36 governance structure and, 40 Structure Plan (1995–2015), 37, 37b Structure Plan (2016–2035), 38, 39DMDP. See Dhaka Metropolitan Development PlanDOE. See also Department of EnvironmentDrainage flooding and, 5 Gazipur and, 38, 40 Khulna and, 48–51
EEconomic vision and growth, 10–11. See also Local economic development
planning city’s branding and, 73 infrastructure planning and, 14–15 Khulna’s lack of, 48–49 land use planning and, 13 recommendations for, 74Economist Intelligence Unit, 3, 3t, 19n6, 20Educational facilities, 36, 45, 64

90�Index
E-governance as assessment area, 34, 34t in Gazipur, 42, 44 in Khulna, 52 in Kurunegala, 60 in Pokhara, 69Enforcement of plans, policies, and regulations. See also Environmental
regulations enforcement as constraint in planning phase, 16 in Gazipur, 43 governance and, 17–21, 18t in Khulna, 51, 52–53 in Kurunegala, 61 in Pokhara, 69–70Environmental Conservation Act (1997; Bangladesh), 43Environmental planning as assessment area, 32, 33t in Gazipur, 39 in Khulna, 49 in Kurunegala, 58 in Pokhara, 64, 67Environmental regulations enforcement, 18–20, 43, 52–53, 61, 70Ernst & Young 2013, 4, 24n9Excess appropriation, in value capture, 25bExpert panels. See Methodology
FFederation of Indian Chambers of Commerce and Industry, 21Finance. See also Governance; Planning access to, 23–26 assessment topics for, 35, 35t as building block with planning and governance, x, 6–7, 6–7t financial autonomy, 27 financial management systems, 26–28, 44, 54, 62, 70 in Gazipur, 44–45, 44f in Khulna, 54–55, 55f in Kurunegala, 62–63, 63f in Pokhara, 70–71, 71f recommendations for, 74 revenue streams, 26 South Asia and current situation in, 27–28 value capture and, 16, 23b, 25b. See also Value captureFlooding and flood control, 5, 48, 49
Index�91
GGarment industry, 5, 36, 42Gazipur City Corporation (Bangladesh), 29, 36–45 asset management, 43 budget management, 41, 42, 44 city-region governance, 40–41 civil engagement, 42 demographics, 36, 36t development controls, 43 development permit process, 42 e-governance, 42, 44 environmental planning, 39 finance, 44–45, 44f governance, 40–43, 43f investment planning, 38 key planning documents, 37b local economic development planning, 38–39 overview, 36–37 planning, 37–39, 39f revenue enhancement, 45 spatial planning, 37–38 transparency and accountability, 41 water supply and sanitation, 38, 40, 40tGCC. See Gazipur City CorporationGlobal financial crisis (2008), 24, 24n8Governance, 1, 17–23 assessment areas for, 34, 34t as building block with planning and finance, x, 6–7, 6–7t. See also Finance;
Planning city management and effective service delivery and enforcement, 18–19 competitiveness and, 19–21 in Gazipur, 40–43, 43f in Khulna, 50–53, 53f in Kurunegala, 59–62, 62f links with competitiveness, 18t local government, key services provided by, 19b overview, 17–18 in Pokhara, 67–70, 70f recommendations for, 73–74 South Asia’s current situation, 21–23Grants and subsidies, 26, 54Green space, 5, 13, 19. See also Parks and recreation areas
92�Index
HHelsinki strategic spatial plan, 13bHot Spots 2025 index (2013), 3, 3t, 19n6, 20Housing development, 12, 58Human resources development, 20. See also Staff capacity as assessment area, 34, 34t
IIBM (International Business Machines Corp.), 3, 3tICT See Information and communication technology sectorImplementation civil engagement in Khulna and, 51 funding and, 16 infrastructure planning and, 15 infrastructure planning and, in Pokhara, 65, 66 investment planning in Gazipur and, 38 local government and, 73India Bangladesh port use, 46 governance system study in, 21 infrastructure financing in, 1n1, 27, 27n12 service delivery in, 21, 22 urbanization rates in, 1, 2tIndustrial estates, 26Industrial growth expansion, 37Information and communication technology sector, 5Information management, 20Infrastructure, 3–5, 18t as assessment area, 32, 33t asset management and, 53 city management and, 18, 19n6 city’s branding and, 73 constraints in planning process and, 16 financing and investment in, 1n1, 14–15, 23–28, 24nn8–9, 27n12 in Gazipur, 38–39, 42, 43 in Khulna, 48, 48n20, 49 in O&M cycle, 19–20 in Pokhara, 64, 66 service delivery and, 22Institutional effectiveness, 11, 12t, 17, 18t, 73
Index�93
Institutional framework for accountability, 21 city selection and, 29, 72 for planning enforcement, 16 Sri Lanka economic development and, 58International finance institutions, 24Investment planning, 10 in Gazipur, 38 in Khulna, 48 in Kurunegala, 58 in Pokhara, 65–66Investments/investors city management and, 18 infrastructure and, 14, 23–26, 24nn8–9, 28 land value capture and, 16
JJawaharlal Nehru National Urban Renewal Mission, 22Jute industry, 45
KKathmandu (Nepal), 64n25KCC. See Khulna City CorporationKDA. See Khulna Development AuthorityKhanjahan Ali Bridge (Bangladesh), 46Khulna City Corporation (Bangladesh), 29, 45–55 asset management, 53 budget management, 54 city-region governance, 51 civil engagement, 51–52 development controls, 52–53 development permit process, 52 e-governance, 52 environmental planning, 49 finance, 54–55, 55f governance, 50–53, 53f investment planning, 48 key planning documents, 47b, 49 local economic development planning, 48–49 overview, 45–46, 46n18 planning, 46–50, 50f revenue enhancement, 54–55
94�Index
spatial planning, 46–47 transparency and accountability, 51 water supply and sanitation, 48Khulna City Corporation Ordinance (1991), 51Khulna Development Authority (Bangladesh), 46n18. See also Khulna City
Corporation in development permit process and controls, 52–53 infrastructure planning and development, 48, 49, 51 key planning documents and, 47b, 49 overlap with KCC, 51 spatial planning and, 46Khulna Development Authority Ordinance (1961), 46, 51, 52n22Khulna Metropolitan Area, 46Khulna Water Supply and Sewerage Authority (KWASA; Bangladesh), 48–50KMC. See Kurunegala Municipal CouncilKurunegala Municipal Council (KMC; Sri Lanka), 29, 55–63 asset management, 61 budget management, 60, 62 city-region governance, 60 civil engagement, 60 demographics, 55, 56t development controls, 57, 61 development permit process, 61 e-governance, 60 environmental planning, 58 finance, 62–63, 63f governance, 59–62, 62f investment planning, 58 key planning documents, 57b local economic development planning, 58 map of, 56f overview, 55–57 planning, 57–58, 59f revenue enhancement, 63 spatial planning, 57 transparency and accountability, 60 water supply and sanitation, 58, 59, 59tKWASA. See also Khulna Water Supply and Sewage Authority
LLalon Shah Bridge (Bangladesh), 45–46Land-based revenue maximization, 12
Index�95
Landfills in Gazipur, 38, 42 in Khulna, 49 O&M cycle and, 19 in Sri Lanka, 21Land pooling, 25b, 26Land registry, access to, 52, 60, 69Land transfers, 25bLand use and planning city competitiveness and, 11 constraints in planning process and, 15–16 defined, 12 in Gazipur, 36–38, 42 infrastructure and, 15 in Khulna, 47, 49 links between competitiveness and economic, land use, and physical
planning, 11–12t as quality of life issue, 4, 5 regulations and enforcement of, 18–19, 61Land Use Concept Plan (2000; Pokhara, Nepal), 65bLatent capacity, 30t, 31, 31fLaws. See Legal frameworkLED. See Local economic developmentLegal framework for Bangladesh governance, 41–42 for Khulna master plan, 47, 51 for Khulna revenue enhancement, 54–55 for Kurunegala master plan, 57Local economic development, x, 5–6, 9–11 as assessment area, 32, 33t constraints in planning process and, 15 in Gazipur, 38–39 in Khulna, 48–49 in Kurunegala, 58 links between competitiveness and economic, land use, and physical
planning, 11–12t in Pokhara, 66Local government, x–xi, 1–7. See also Gazipur City Corporation;
Khulna City Corporation; Kurunegala Municipal Council; Pokhara sub-metropolitan city
access to finance and, 23
96�Index
accountability and, 20–21 Bangladesh governance, 41–42 city competitiveness and, 2–5, 3, 3t, 10, 19–21, 19b defined, 4b enforcement and, 20 financial autonomy and, 27 importance of, 4–5 investors and, 10 overview, 1 planning process of, 6–7, 6–7t, 73 recommendations for, 74 revenue streams of, 26 service delivery and, 22Local officials, tenure length of, 73Local panels. See MethodologyLocal Self-Governance Act (1999; Pokhara, Nepal), 65, 66, 69
MMacroeconomic planning, 15, 38Maharashtra Slum Areas Act (1971), 25n11Master plans for Helsinki, 13b for Khulna, 46–47, 47b, 48, 51 for Kurunegala, 57, 58 for Pokhara, 65b, 66, 67 recommendations for, 73 weaknesses in, 13, 16Mayors, 9, 40, 50, 52 city managers vs., 21McKinsey Global Institute, 21Methodology, xi, 29–35 city selection, 29 data collection, 30 example of scores of local panel and expert panel, 33f expert panel discussion and scores, 30–31, 30n13, 78–84 finance, assessment topics for, 35, 35t governance, assessment topics for, 34, 34t independent expert panel and analysis by, 30–32 local panel discussions and scores, 30t, 31–32, 85 perceptions of local panel vs. expert panel, 72 planning, assessment topics for, 32–33, 33t scoring framework for local panel assessments, 30–31, 31f, 33f
Index�97
Migration, 29, 36Ministry of Federal Affairs and Local Development (MOFALD; Nepal), 65,
68, 71Ministry of Housing and Public Works (Bangladesh), 40, 46n18Ministry of Industry, Commerce, and Supply (Nepal), 70Ministry of Local Government, Rural Development and Cooperatives
(Bangladesh), 40, 44, 46n18, 50, 54Ministry of Urban Development (MOUD; Nepal), 64–66MOFALD. See also Ministry of Federal Affairs and Local DevelopmentMongla (Bangladesh), 45–46MOUD. See also Ministry of Urban Development
NNational Housing Authority (Bangladesh), 48National Physical Plan and Policy (2011–2030; Sri Lanka), 57bNational Planning Commission (Nepal), 66National Water Supply and Drainage Board (Sri Lanka), 57National Water Supply Corporation (NWSC; Nepal), 65, 67, 68Nepal, xi. See also Pokhara sub-metropolitan city Bangladesh port use, 46 planning and central government in, 65–66 service delivery in, 21 urbanization rates in, 1–2, 2n3, 2tNew York City Economic Development Corporation, 9bNorthwestern Province (Sri Lanka), 55, 57NWSC. See also National Water Supply Corporation
OOperation and maintenance (O&M), 14 in Gazipur, 38 infrastructure and, 19–20 in Khulna, 50 planning and, 16 revenue streams and, 26Operations systems, 15, 16, 18Own-source revenue growth, 35, 45, 54, 63, 71
PPanels. See MethodologyParks and recreation areas in Kurunegala, 58, 60, 61 O&M cycle and, 19, 19b as quality of life issue, 3
98�Index
Permits and licenses. See Development permit processPhewa Lake (Nepal), 64, 67Physical planning, 11, 11–12t, 14–15. See also InfrastructurePlanning, 1, 9–17 assessment topics for, 32–33, 33t as building block with governance and finance, x, 6–7, 6–7t. See also
Finance; Governance constraints on use of planning process, 15–17 in Gazipur, 37–39, 39f in Khulna, 46–50, 50f in Kurunegala, 57–58, 59f land use planning, 12–13 links between competitiveness and economic, land use, and physical
planning, 11–12t local economic development planning, 9–11, 38–39, 48–49, 58, 66 physical planning, 11, 14–15 in Pokhara, 65–67, 67f recommendations for, 72, 73 wider role for, 11bPlanning regulations and enforcement of, 20, 43, 52–53, 57, 61Pokhara Master Plan (2002), 65b, 67Pokhara Physical Development Plan (1975), 66Pokhara sub-metropolitan city (Nepal), 29, 64–71 asset management, 70 budget management, 71 city-region governance, 68 civil engagement, 68, 69 demographics, 64, 64t development controls, 69–70 development permit process, 69 e-governance, 69 environmental planning, 64, 67 finance, 70–71, 71f governance, 67–70, 70f investment planning, 65–66 key planning documents, 65b local economic development planning, 66 overview, 64–65, 64n25 planning, 65–67, 67f revenue enhancement, 71 spatial planning, 65 transparency and accountability, 68 water supply and sanitation, 64, 65, 67, 68t
Index�99
Pokhara Valley Town Development Committee (PVTDC), 66, 68PRC. See China, People’s Republic ofPrivate sector, value capture and, 25bProperty taxes. See Taxes and tariffsPSMC. See Pokhara sub-metropolitan cityPublic hearings and input, 42, 51–52, 69. See also Civil engagement;
Transparency and accountabilityPublic land use, 12Public-private partnerships, 10, 23. See also Collaboration and cross-agency
coordination city competitiveness and, 74 for Khulna beautification projects, 52 in Kurunegala, 58 O&M cycle and, 19Public safety, 3, 19Public sector. See also Governance local economic development and, 15 value capture and, 16, 23b, 25b, 26Public spaces. See Parks and recreation areasPVTDC. See also Pokhara Valley Town Development Committee
QQuality of life city’s competitiveness and, 3, 10, 13, 18t, 73 infrastructure and, 4–5 in Kurunegala, 57, 58 service delivery and, 19–20
RRajdhani Unnayan Kartripakkhya (RAJUK; Bangladesh), 36–43.
See also Gazipur City Corporation civil engagement and, 42 development permit process and, 42 e-governance and, 42 environmental planning and, 39 governance and, 40–41 investment planning and, 38 local economic development planning and, 39 spatial planning and, 37–38 tensions with GCC, 40 transparency and accountability and, 41 urban planning and, 40, 42RAJUK. See also Rajdhani Unnayan Kartripakkhya

100�Index
Real estate development, 26, 48, 49, 66Recreation. See Parks and recreation areasRegulations. See Development permit process; specific typesReporting in financial management, 26–27Resiliency, environmental planning and, 39Revenue enhancement as assessment area, 35, 35t in Gazipur, 45 in Khulna, 54–55 in Kurunegala, 63 in Pokhara, 71Revenue streams, 26Right to Information Act (2007; Nepal), 68Right to Information Act (2009; Bangladesh), 51Roads. See TransportRoads and Highway Department (Bangladesh), 48Rupsha River (Bangladesh), 46–47
SSanitation. See Water supply and sanitationScoring framework, 30–31, 30t, 31fService delivery, x, 1–5. See also Governance; specific services constraints in planning phase and, 16 in Gazipur, 40, 40t, 41 governance and, 17–22, 18t in Khulna, 50–51 in Kurunegala, 57, 59–60 in Pokhara, 67–68 US study on governance systems and, 21Sewerage. See Water supply and sanitationSingapore, vision for growth in, 10bSolid waste management city’s competitiveness and, 4, 19–20, 19b in Gazipur, 38, 40 in Khulna, 50, 54 in Kurunegala, 59 in Pokhara, 64, 67South Asia, x. See also Gazipur City Corporation; Khulna City Corporation;
Kurunegala Municipal Council; Pokhara sub-metropolitan city economic variances in, 4–5 finance and current situation in, 27–28
Index�101
governance and current situation in, 21–23 urbanization rates in, 1–2 urban planning and constraints in, 15–17Spatial planning, 13, 13b as assessment area, 32, 33t in Gazipur, 37–38 in Khulna, 46–47 in Kurunegala, 57 in Pokhara, 65 South Asian cities’ need for, 15Sri Lanka, xi. See also Kurunegala Municipal Council Board of Investment of, xi planning and central government of, 57 service delivery in, 21 urbanization rates in, 1, 2tSri Lanka Institute of Local Governance, 62Staff capacity, 15, 16, 34, 34t, 42, 50, 52, 59Standing Committee on Finance and Establishments (Bangladesh), 44Strategic Transport Plan for Dhaka (2005), 37b, 38Street lights, 20, 38, 66Sundarban (Bangladesh and India), 46
TTaxes and tariffs databases and, 52, 54, 63 financial autonomy and, 27 in Gazipur, 45 infrastructure financing and, 27–28 property taxes, 27–28, 54–55, 63, 71 as revenue stream, 26Tax-increment financing (TIF), 24–25, 25n11Technology. See Computerization and technologyTongi (Bangladesh), 36Tourism, 5, 46, 64, 66Tourism Master Plan (2013–2017; Pokhara, Nepal), 66Transparency and accountability, 18, 20–22 as assessment area, 34, 34t in Gazipur, 41 in Khulna, 51 in Kurunegala, 60 in Pokhara, 68

102�Index
Transport, 4, 5 Bangladesh Railway, 46–47, 49 commute times, 13 constraints in planning phase and, 16 in Gazipur, 37b, 38, 40 investments in mass transit systems, 16 in Khulna, 49, 50 O&M cycle and, 19, 19b as quality of life issue, 20 value capture and transportation projects, 26Twelfth Five Year Plan (2012–2017; India), 27n12
UUDA. See also Urban Development AuthorityUnited Kingdom, planning system in, 11bUnited States governance systems study in, 21 infrastructure financing in, 27 tax-increment financing in, 25, 25n11Urban database, 73Urban Development Authority (UDA; Kurunegala, Sri Lanka), 57–61. See also
Kurunegala Municipal CouncilUrban Competitive Assessment, 3, 3tUrban Land Institute, 4, 24n9Urbanization, 1–2 urban development cycle, 15 urbanization rates in South Asia, 1–2, 2n3, 2tUser fees, 23, 27, 28

Index�103
VValue capture access to finance and, 23–26, 24n10 in Bangladesh, 54–55 constraints in planning process and, 16 defined, 23b in Kurunegala, 63 in South Asia, 28 types of, 25b
WWastewater management, 19–20, 21, 50, 58Water supply and sanitation, 1. See also Service delivery in Gazipur, 38, 40, 40t, 45 in Khulna, 48–50 in Kurunegala, 57–59, 59t O&M cycle and, 19, 19b in Pokhara, 64, 65, 67, 68t in South Asia, 21–22 taxes and, 28World Bank, 3, 3tWorld Economic Forum, 3, 3t

Gearing Up for CompetitivenessThe Role of Planning, Governance, and Finance in Small and Medium-sized Cities in South Asia
This book focuses on local government’s role in increasing city competitiveness through planning, governance, and finance, particularly in small to medium-sized cities in South Asia. Existing studies on city competitiveness tend to focus on megacities, and yet smaller cities house an increasingly large portion of South Asia’s population. This study seeks to initiate a more systematic thinking on the role of planning, governance, and finance to overcome the challenges of urbanization, improve the investment climate, and provide greater opportunities for more people, especially in small to medium-sized cities.
About the Asian Development Bank
ADB’s vision is an Asia and Pacific region free of poverty. Its mission is to help its developing member countries reduce poverty and improve the quality of life of their people. Despite the region’s many successes, it remains home to half of the world’s extreme poor. ADB is committed to reducing poverty through inclusive economic growth, environmentally sustainable growth, and regional integration.
Based in Manila, ADB is owned by 67 members, including 48 from the region. Its main instruments for helping its developing member countries are policy dialogue, loans, equity investments, guarantees, grants, and technical assistance.
ASIAN DEVELOPMENT BANK6 ADB Avenue, Mandaluyong City1550 Metro Manila, Philippineswww.adb.org