GE Capital Investor Meeting - General Electric Capital Investor Meeting July 28, 2009 "Results are...
32
GE Capital Investor Meeting July 28, 2009 "Results are preliminary and unaudited. This document contains “forward-looking statements”- that is, statements related to future, not past, events. In this context, forward-looking statements often address our expected future business and financial performance and financial condition, and often contain words such as “expect,” “anticipate,” “intend,” “plan,” “believe,” “seek,” “see,” or “will.” Forward-looking statements by their nature address matters that are, to different degrees, uncertain. For us, particular uncertainties that could cause our actual results to be materially different than those expressed in our forward-looking statements include: the severity and duration of current economic and financial conditions, including volatility in interest and exchange rates, commodity and equity prices and the value of financial assets; the impact of U.S. and foreign government programs to restore liquidity and stimulate national and global economies; the impact of conditions in the financial and credit markets on the availability and cost of GE Capital’s funding and on our ability to reduce GE Capital’s asset levels and commercial paper exposure as planned; the impact of conditions in the housing market and unemployment rates on the level of commercial and consumer credit defaults; our ability to maintain our current credit rating and the impact on our funding costs and competitive position if we do not do so; the soundness of other financial institutions with which GE Capital does business; the adequacy of our cash flow and earnings and other conditions which may affect our ability to maintain our quarterly dividend at the current level; the level of demand and financial performance of the major industries we serve, including, without limitation, air and rail transportation, energy generation, network television, real estate and healthcare; the impact of regulation and regulatory, investigative and legal proceedings and legal compliance risks, including the impact of proposed financial services regulation; strategic actions, including acquisitions and dispositions and our success in integrating acquired businesses; and numerous other matters of national, regional and global scale, including those of a political, economic, business and competitive nature. These uncertainties may cause our actual future results to be materially different than those expressed in our forward-looking statements. We do not undertake to update our forward-looking statements.” “This document may also contain non-GAAP financial information. Management uses this information in its internal analysis of results and believes that this information may be informative to investors in gauging the quality of our financial performance, identifying trends in our results and providing meaningful period-to-period comparisons. For a reconciliation of non-GAAP measures presented in this document, see the accompanying supplemental information posted to the investor relations section of our website at www.ge.com .” “In this document, “GE” refers to the Industrial businesses of the Company including GECS on an equity basis. “GE (ex. GECS)” and/or “Industrial” refer to GE excluding Financial Services.” 2 Key Messages GE Capital well run thru this recession, will provide attractive long term returns Funding and liquidity dramatically improved and future profile very manageable Portfolios performing as expected or slightly better, most below Fed Base Case 2010 stress test loss scenarios show losses similar to 2009 Historically, new regulation included grandfathering … believe we have strong support for our business model and will defend vigorously We don't see the need to raise external capital, even under adverse scenarios Post this cycle, GE Capital will emerge as competitively advantaged $400B business with attractive returns (2%+ ROI) 1 2 3 4 5 6 Much better Early in cycle, but OK Challenging • U.S. Consumer • U.K. Mortgage • Commercial loans and leases • Global Banking • Commercial Real Estate 7
Transcript of GE Capital Investor Meeting - General Electric Capital Investor Meeting July 28, 2009 "Results are...
GE Capital
Investor Meeting
July 28, 2009"Results are preliminary and unaudited. This document contains “forward-looking statements”- that is, statements related to future, not past, events. In this context, forward-looking statements often address our expected future business and financial performance and financial condition, and often contain words such as “expect,” “anticipate,” “intend,” “plan,” “believe,”“seek,” “see,” or “will.” Forward-looking statements by their nature address matters that are, to different degrees, uncertain. For us, particular uncertainties that could cause our actual results to be materially different than those expressed in our forward-looking statements include: the severity and duration of current economic and financial conditions, including volatility in interest and exchange rates, commodity and equity prices and the value of financial assets; the impact of U.S. and foreign government programs to restore liquidity and stimulate national and global economies; the impact of conditions in the financial and credit markets on the availability and cost of GE Capital’s funding and on our ability to reduce GE Capital’s asset levels and commercial paper exposure as planned; the impact of conditions in the housing market and unemployment rates on the level of commercial and consumer credit defaults; our ability to maintain our current credit rating and the impact on our funding costs and competitive position if we do not do so; the soundness of other financial institutions with which GE Capital does business; the adequacy of our cash flow and earnings and other conditions which may affect our ability to maintain our quarterly dividend at the current level; the level of demand and financial performance of the major industries we serve, including, without limitation, air and rail transportation, energy generation, network television, real estate and healthcare; the impact of regulation and regulatory, investigative and legal proceedings and legal compliance risks, including the impact of proposed financial services regulation; strategic actions, including acquisitions and dispositions and our success in integrating acquired businesses; and numerous other matters of national, regional and global scale, including those of a political, economic, business and competitive nature. These uncertainties may cause our actual future results to be materially different than those expressed in our forward-looking statements. We do not undertake to update our forward-looking statements.”
“This document may also contain non-GAAP financial information. Management uses this information in its internal analysis of results and believes that this information may be informative to investors in gauging the quality of our financial performance, identifying trends in our results and providing meaningful period-to-period comparisons. For a reconciliation of non-GAAP measures presented in this document, see the accompanying supplemental information posted to the investor relations section of our website at www.ge.com.”
“In this document, “GE” refers to the Industrial businesses of the Company including GECS on an equity basis. “GE (ex. GECS)” and/or “Industrial” refer to GE excluding Financial Services.”
2
Key MessagesGE Capital well run thru this recession, will provide attractive long term returns
Funding and liquidity dramatically improved and future profile very manageable
Portfolios performing as expected or slightly better, most below Fed Base Case
2010 stress test loss scenarios show losses similar to 2009
Historically, new regulation included grandfathering … believe we have strong support for our business model and will defend vigorously
We don't see the need to raise external capital, even under adverse scenarios
Post this cycle, GE Capital will emerge as competitively advantaged $400B business with attractive returns (2%+ ROI)
11
22
33
44
55
66
Much better Early in cycle, but OK Challenging
• U.S. Consumer • U.K. Mortgage
• Commercial loansand leases
• Global Banking
• Commercial Real Estate
77
3
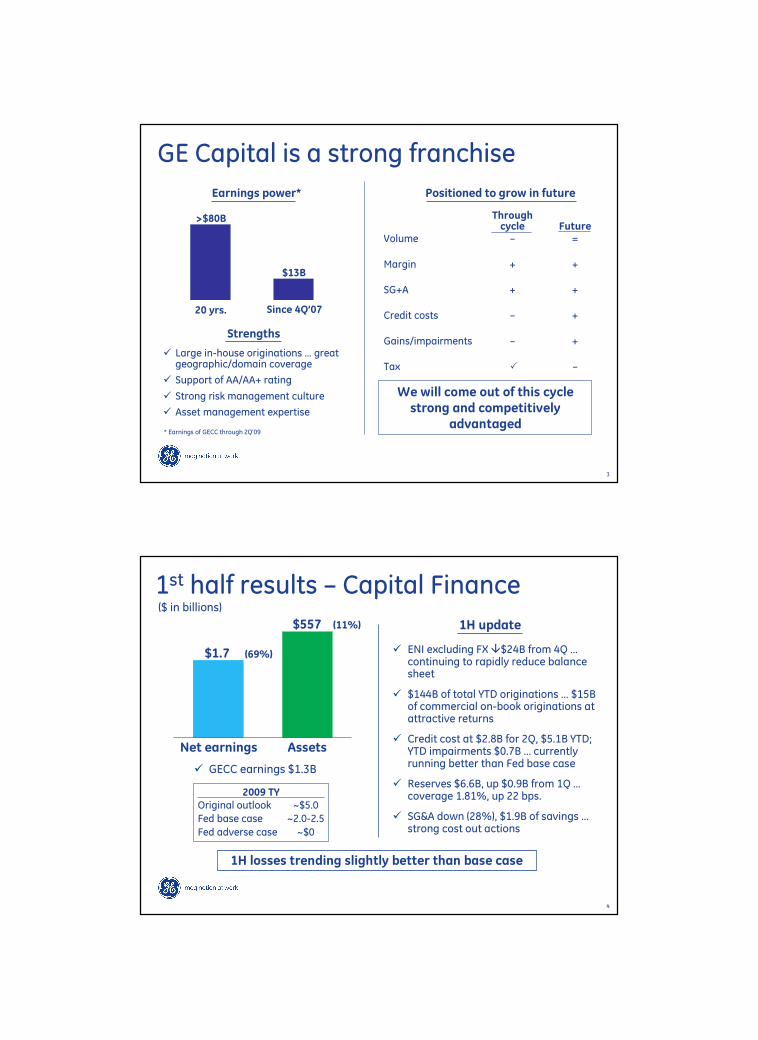
GE Capital is a strong franchise
Earnings power*
� Large in-house originations … great geographic/domain coverage
� Support of AA/AA+ rating
� Strong risk management culture
� Asset management expertise
>$80B
$13B
20 yrs. Since 4Q’07
Strengths
Throughcycle Future
Volume – =
Margin + +
SG+A + +
Credit costs – +
Gains/impairments – +
Tax � –
Positioned to grow in future
We will come out of this cycle strong and competitively
advantaged* Earnings of GECC through 2Q’09
4
1st half results – Capital Finance($ in billions)
1H update
� ENI excluding FX �$24B from 4Q …continuing to rapidly reduce balance sheet
� $144B of total YTD originations … $15B of commercial on-book originations at attractive returns
� Credit cost at $2.8B for 2Q, $5.1B YTD; YTD impairments $0.7B … currently running better than Fed base case
� Reserves $6.6B, up $0.9B from 1Q …coverage 1.81%, up 22 bps.
� SG&A down (28%), $1.9B of savings …strong cost out actions
$1.7
$557
Net earnings Assets
� GECC earnings $1.3B
(69%)
(11%)
1H losses trending slightly better than base case
2009 TYOriginal outlook ~$5.0
Fed base case ~2.0-2.5
Fed adverse case ~$0
5
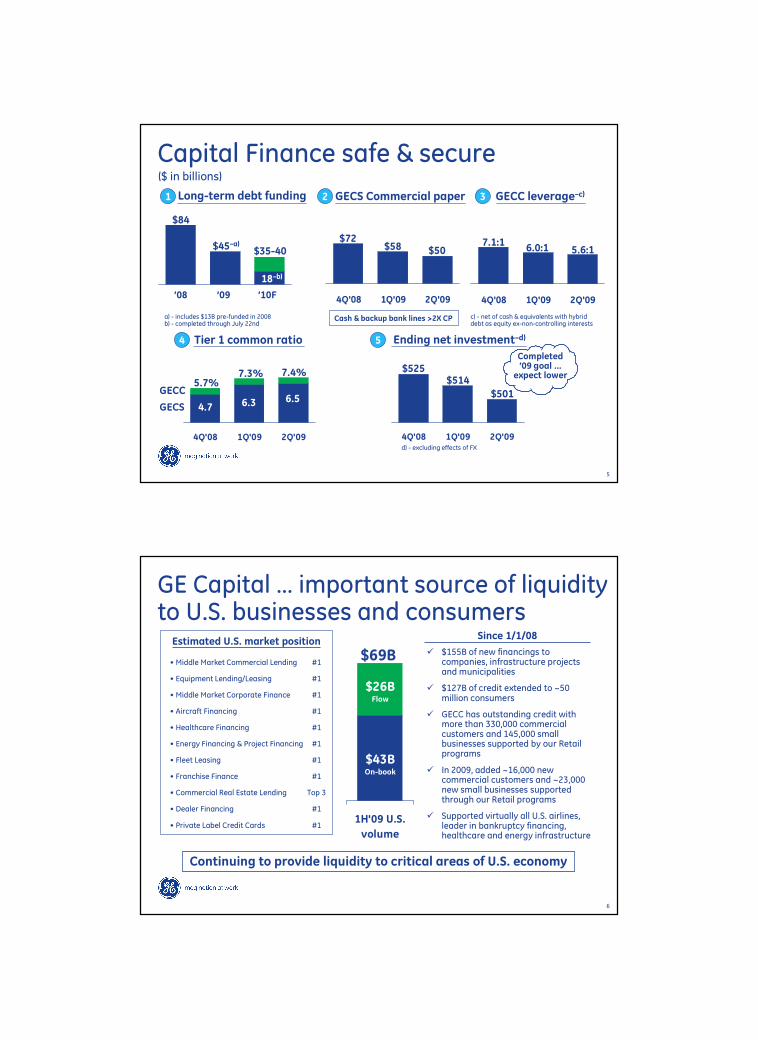
Capital Finance safe & secure
GECS Commercial paper
4Q'08 1Q'09 2Q'09
$72$58 $50
GECC leverage–c)
4Q'08 1Q'09 2Q'09
7.1:16.0:1 5.6:1
Long-term debt funding
’08 ’09 ’10F
$84
$45–a) $35-40
18–b)
4Q'08 1Q'09 2Q'09
Tier 1 common ratio
5.7%7.3% 7.4%
4.7 6.3 6.5GECC
GECS
1 2
4 5
3
c) - net of cash & equivalents with hybrid debt as equity ex-non-controlling interests
Ending net investment–d)
$525$514
$501
4Q'08 1Q'09 2Q'09
Completed’09 goal …
expect lower
Cash & backup bank lines >2X CPa) - includes $13B pre-funded in 2008b) - completed through July 22nd
($ in billions)
d) - excluding effects of FX
6
GE Capital … important source of liquidity to U.S. businesses and consumers
1H'09 U.S.
volume
Continuing to provide liquidity to critical areas of U.S. economy
$69B � $155B of new financings to companies, infrastructure projects and municipalities
� $127B of credit extended to ~50 million consumers
� GECC has outstanding credit with more than 330,000 commercial customers and 145,000 small businesses supported by our Retail programs
� In 2009, added ~16,000 new commercial customers and ~23,000 new small businesses supported through our Retail programs
� Supported virtually all U.S. airlines, leader in bankruptcy financing, healthcare and energy infrastructure
Since 1/1/08
$43BOn-book
$26BFlow
Estimated U.S. market position
• Middle Market Commercial Lending #1
• Equipment Lending/Leasing #1
• Middle Market Corporate Finance #1
• Aircraft Financing #1
• Healthcare Financing #1
• Energy Financing & Project Financing #1
• Fleet Leasing #1
• Franchise Finance #1
• Commercial Real Estate Lending Top 3
• Dealer Financing #1
• Private Label Credit Cards #1
7
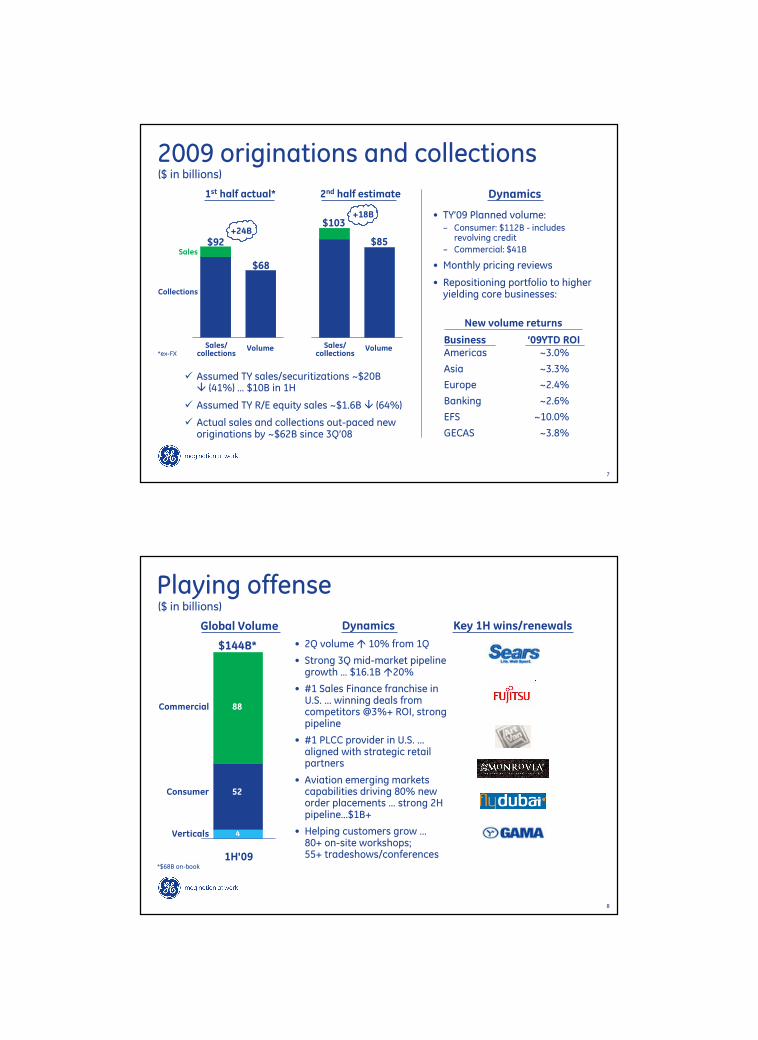
2009 originations and collections
Dynamics
$92
$68
+24B
� Assumed TY sales/securitizations ~$20B� (41%) … $10B in 1H
� Assumed TY R/E equity sales ~$1.6B � (64%)
� Actual sales and collections out-paced new originations by ~$62B since 3Q’08
• TY’09 Planned volume:– Consumer: $112B - includes revolving credit
– Commercial: $41B
• Monthly pricing reviews
• Repositioning portfolio to higher yielding core businesses:
Sales/collections
Volume
$103
$85
+18B
Volume
1st half actual* 2nd half estimate
($ in billions)
Sales/collections
Sales
Collections
Business ’09YTD ROIAmericas ~3.0%
Asia ~3.3%
Europe ~2.4%
Banking ~2.6%
EFS ~10.0%
GECAS ~3.8%
*ex-FX
New volume returns
8
Playing offense
1H'09
$144B*
($ in billions)
Commercial
Consumer
Verticals
88
52
Dynamics
• 2Q volume � 10% from 1Q
• Strong 3Q mid-market pipeline growth … $16.1B �20%
• #1 Sales Finance franchise in U.S. ... winning deals from competitors @3%+ ROI, strong pipeline
• #1 PLCC provider in U.S. ... aligned with strategic retail partners
• Aviation emerging markets capabilities driving 80% new order placements … strong 2H pipeline…$1B+
• Helping customers grow …80+ on-site workshops;55+ tradeshows/conferences
Key 1H wins/renewalsGlobal Volume
*$68B on-book
4
9
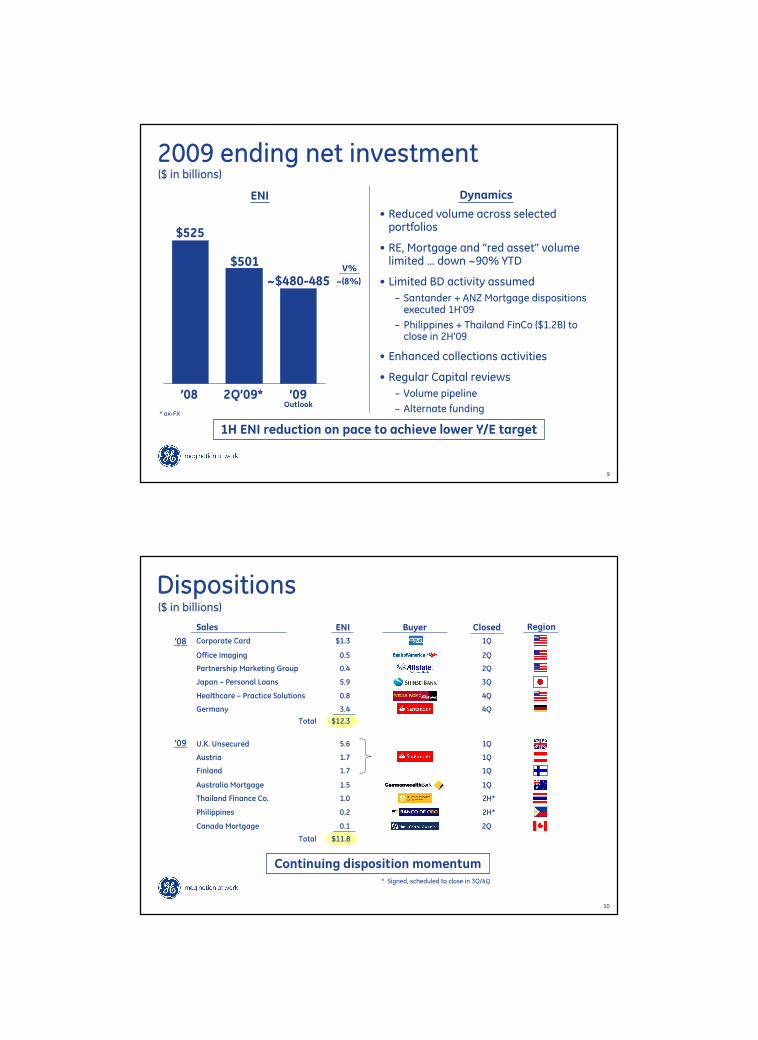
2009 ending net investment
Dynamics
($ in billions)
$525
ENI
V%
~(8%)~$480-485
• Reduced volume across selected portfolios
• RE, Mortgage and “red asset” volume limited … down ~90% YTD
• Limited BD activity assumed
– Santander + ANZ Mortgage dispositions executed 1H’09
– Philippines + Thailand FinCo ($1.2B) to close in 2H’09
• Enhanced collections activities
• Regular Capital reviews
– Volume pipeline
– Alternate fundingOutlook
1H ENI reduction on pace to achieve lower Y/E target
$501
’08 ’092Q’09*
* ex-FX
10
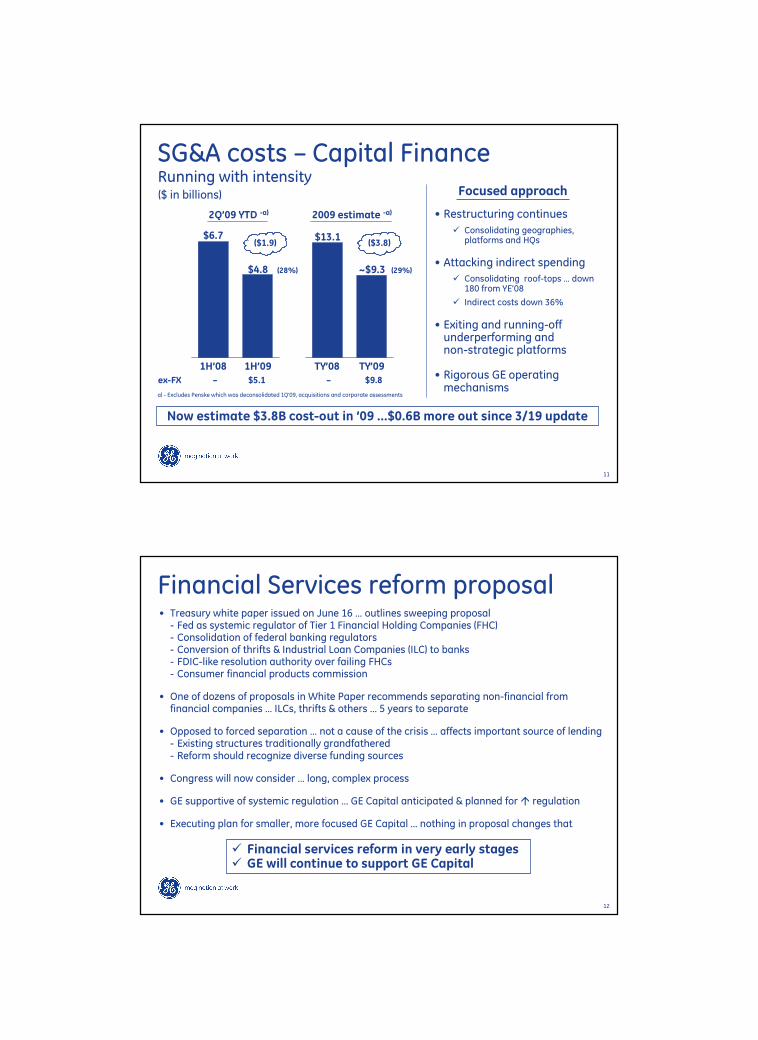
Dispositions($ in billions)
Sales ENI Buyer Closed
Japan – Personal Loans 5.9 3Q
Office Imaging 0.5 2Q
Healthcare – Practice Solutions 0.8 4Q
Corporate Card $1.3 1Q
Australia Mortgage 1.5 1Q
Partnership Marketing Group 0.4 2Q
Region
Continuing disposition momentum
Austria 1.7 1Q
Finland 1.7 1Q
U.K. Unsecured 5.6 1Q
Germany 3.4 4Q
Philippines 0.2 2H*
Thailand Finance Co. 1.0 2H*
* Signed, scheduled to close in 3Q/4Q
Canada Mortgage 0.1 2Q
Total $12.3
Total $11.8
’08
’09
11
SG&A costs – Capital Finance Running with intensity
Focused approach
• Restructuring continues
� Consolidating geographies, platforms and HQs
• Attacking indirect spending
� Consolidating roof-tops … down 180 from YE’08
� Indirect costs down 36%
• Exiting and running-off underperforming andnon-strategic platforms
• Rigorous GE operating mechanisms
1H’09
$4.8
a) - Excludes Penske which was deconsolidated 1Q’09, acquisitions and corporate assessments
$6.7
2Q’09 YTD -a) 2009 estimate -a)
1H’08
($1.9)
ex-FX – $5.1 – $9.8
TY’09
~$9.3
$13.1
TY’08
($3.8)
(28%) (29%)
Now estimate $3.8B cost-out in ’09 …$0.6B more out since 3/19 update
($ in billions)
12
Financial Services reform proposal• Treasury white paper issued on June 16 … outlines sweeping proposal - Fed as systemic regulator of Tier 1 Financial Holding Companies (FHC)- Consolidation of federal banking regulators- Conversion of thrifts & Industrial Loan Companies (ILC) to banks- FDIC-like resolution authority over failing FHCs- Consumer financial products commission
• One of dozens of proposals in White Paper recommends separating non-financial from financial companies … ILCs, thrifts & others … 5 years to separate
• Opposed to forced separation … not a cause of the crisis … affects important source of lending- Existing structures traditionally grandfathered- Reform should recognize diverse funding sources
• Congress will now consider … long, complex process
• GE supportive of systemic regulation … GE Capital anticipated & planned for � regulation
• Executing plan for smaller, more focused GE Capital … nothing in proposal changes that
� Financial services reform in very early stages� GE will continue to support GE Capital

13
Update from March 19thmeeting
� Commercial Real Estate <Fed base case; Difficult environment
� U.K. Mortgage ~Fed base case; HPI trending better … early
� Global banks and Eastern Europe ~Fed base case; Profitable
� U.S. Consumer Better than Fed base case; Outperforming unemployment
� Total Losses/impairments <Fed base case; Continued reserve increases
Capital adequacy and funding Ratios strong and improving; Funding well ahead of plan
Other:
– Investment securities • Investment securities unrealized loss $2.0B lower• than 1Q
– Associated companies • JVs performing, $126MM associated companyimpairment (Cosmos $110MM)
– Goodwill • Goodwill tested 1Q; Annual update in 2H
Areas of interest 1H’09 loss update; Outlook
1st half losses slightly below Fed base case
14
Agenda
Funding & Liquidity
Portfolio Quality & Reserves
Business Reviews & Stress Testing
– Overview
– Real Estate
– Mortgage/U.S. Consumer
– Banks and JVs
GE Context
Q&A
Kathy Cassidy – GECC Treasurer
Jeff Bornstein – GECC CFO
Jim Colica
Ron Pressman
Mark Begor
Bill Cary
Keith Sherin – GE Vice Chairman & CFO
15
Funding & Liquidity
16
GECS funding
• Global debt markets recovering ... exiting government programs
• Received FDIC approval for TLGP exit plan … new CP issuance will benon-guaranteed & TLGP LT debt remaining capacity will be ~$14B
• ’09 long-term funding plan complete ($45B) … mid-way through ’10 plan ($18B of $35-$40B)
• Issued $12B non-guaranteed debt … largest non-guaranteed issuer YTD
• CP balance @ ~$50B as of 6/’09 … ahead of plan by 6 months
• Strong GECC capital ratios … Tier 1 common ratio at 7.4% (2Q’09) vs. 5.7% (4Q’08) & leverage at 5.6 (2Q’09) vs. 7.1 (4Q’08)
• Strong cash and liquidity position … $50B cash, $55B bank lines
• Funding cost remains competitive
17
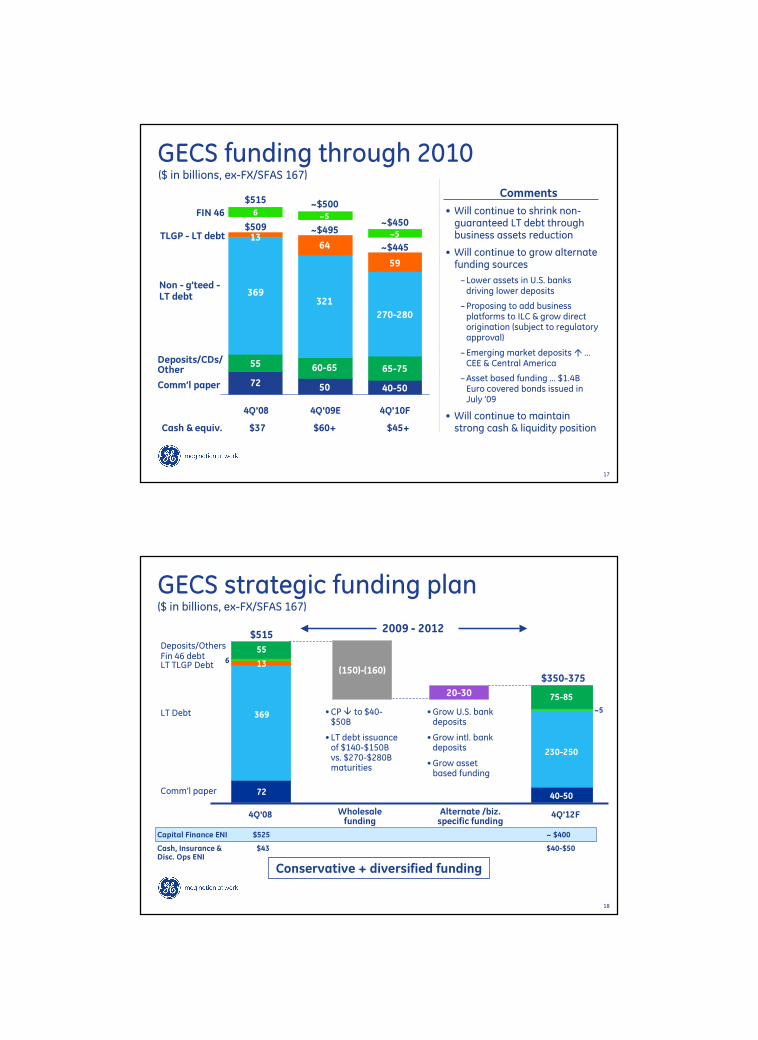
4Q'08 4Q'09E 4Q'10F
GECS funding through 2010($ in billions, ex-FX/SFAS 167)
Cash & equiv. $37 $60+ $45+
Comm’l paper
Deposits/CDs/ Other
Non - g’teed -LT debt
FIN 46
~$495
~$500~5
50
60-65
321
$509
$515
6
72
55
369
~$445
~$450~5
40-50
65-75
270-280
1364
59
TLGP - LT debt
• Will continue to shrink non-guaranteed LT debt through business assets reduction
• Will continue to grow alternate funding sources
–Lower assets in U.S. banks driving lower deposits
–Proposing to add business platforms to ILC & grow direct origination (subject to regulatory approval)
–Emerging market deposits � … CEE & Central America
–Asset based funding … $1.4B Euro covered bonds issued in July ’09
• Will continue to maintain strong cash & liquidity position
Comments
18
GECS strategic funding plan($ in billions, ex-FX/SFAS 167)
4Q'08
$515
20-30
(150)-(160)
Wholesale funding
Alternate /biz. specific funding
•CP � to $40-$50B
• LT debt issuance of $140-$150B vs. $270-$280B maturities
•Grow U.S. bank deposits
•Grow intl. bank deposits
•Grow asset based funding
369
2009 - 2012
Conservative + diversified funding
4Q'12F
$350-375
230-250
Deposits/OthersFin 46 debtLT TLGP Debt
LT Debt
Comm’l paper 72
556 13
75-85
40-50
~5
Capital Finance ENI $525 ~ $400
Cash, Insurance & $43 $40-$50Disc. Ops ENI

19
Beginning cash balance
Sources
LT debt issuances – TLGP
LT debt issuances – non-guaranteed
Alternate funding
Collections > originations
Capital infusion from GE
Total sources
Uses
TLGP LT debt maturities
CP reduction
Others incl. non-guaranteed LT debt maturities
Total uses
Ending cash balance
� ~2% of unsecured debt market� Conservative plan to diversify funding� TLGP maturity profile very manageable� Maintaining strong liquidity position
($ in billions, ex-FX)’09E
$37
52
15-20
5-10
40-45
10
~127-132
(1)
(22)
~(78)
~(101)
~$63-68
’10F
~$63-68
–
20
5-10
25-30
–
~55
(5)
0-(10)
(60)-(65)
(65)-(80)
~$45-60
GECS strategic funding plan by year
Notes:• Funding plan assumes outstanding commercial paper of $40-50B• Pre-funding : ’09 ($13.4B completed in ’08), ’10 (100%: ~$35-$40B in ’09), ’11 (50%: ~$20B in ’10) & ’12 (15%: ~$6B in ’11)
’11F
~$45-60
–
26
5-10
25-30
~2
~63
(20)
–
(40)-(45)
(60)-(65)
~$40-55
’12F
~$40-55
–
34
5-10
25-30
–
~69
(39)
–
(40)-(45)
(79)-(84)
~$25-40
20
GECC & GECS capital metricsTCE/TA ratio -a)
GECS
4Q’08 1Q’09 2Q’09
4Q’09E
Base Adv
4Q’10F
Base Adv
GECC
3.9
5.45.9 5.9
5.6
6.9
5.6
4.9%
6.6% 6.9% ~6.9%~6.6%
~8.1%
~6.9%
Tier 1 common ratio
GECS
4Q’08 1Q’09 2Q’09
4Q’09E
Base Adv
4Q’10F
Base
GECC
4.7
6.36.5
6.9
6.6
7.8
6.5
5.7%
7.3% 7.4%~8.0%~7.7%
~9.0%
~7.7%
Leverage -b)
GECC
4Q’08 1Q’09 2Q’09
4Q’09E
Base Adv
4Q’10F
Base
GECS
7.16.0 5.6
5.35.4 4.8 5.2
7.7
6.45.9 ~5.7 ~5.9
~5.1~5.7
• Strong tangible common equity ratios even in adverse case … well positioned relative to peer average
• Leverage commitments ahead of plan … GECC ~6:1 since 1Q’09 and can be maintained even in Fed adverse scenario
a) -Tangible Common Equity (TCE): Shareholders’ equity less goodwill & intangibles; Tangible Assets (TA): Total assets less goodwill & intangibles
b) -Net of cash & equivalents with hybrid debt as equity ex. non-controlling interests
Adv
Adv
• 2010 likely to be impacted by SFAS 167 requiring to account for securitizations on-book
• 2010 adverse case Tier 1 common ratio well above 4% threshold defined by the Fed as part of SCAP
21
Portfolio Quality& Reserves
22
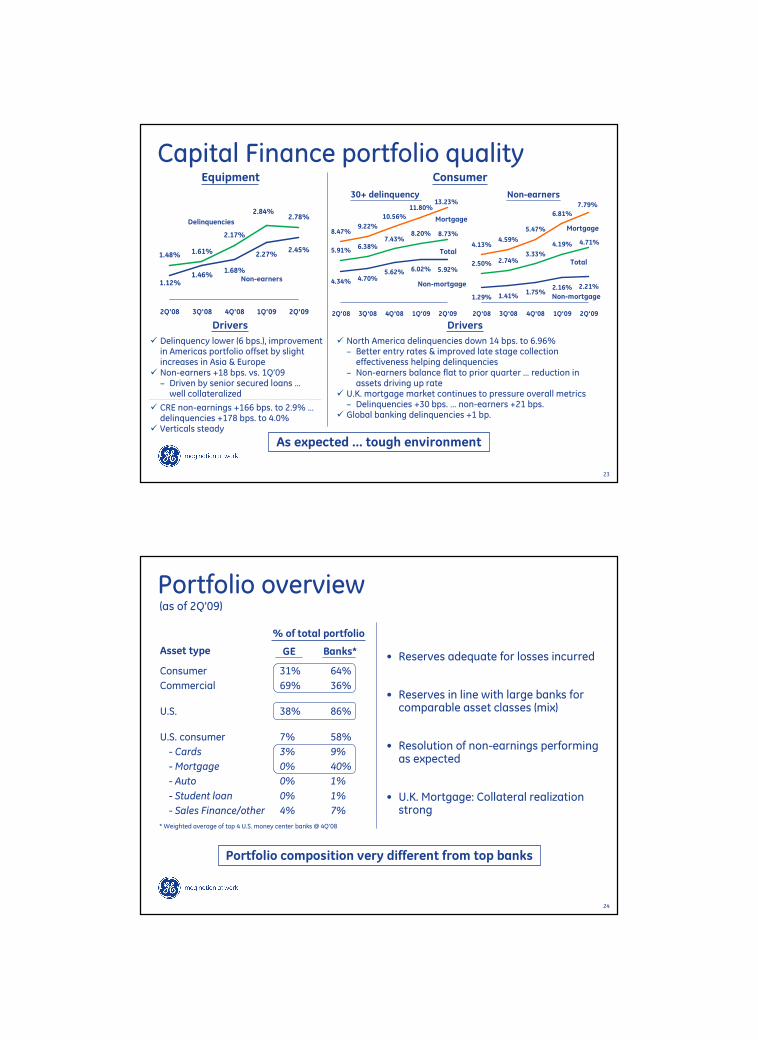
Commercial portfolio
- Real Estate –a) $0.7 $2.4 $3.6 $0.6
- Aviation and Energy 0.3 0.4 0.7 0.1
- Mid-market lease/lend 1.5 2.0 2.6 1.1
- Other Commercial 0.3 0.5 1.5 0.2
Consumer portfolio
- U.S. 4.3 5.1 5.7 1.9
- Non-U.S. Mortgage 0.6 1.2 1.6 0.6
- Other Consumer 1.9 2.2 2.7 1.3
Management planning 1.0 – – –
Total ~$10.6 ~$13.8 ~$18.4 $5.8
Summary losses and impairments($ in billions)
Originaloutlook
Estimated Fedbase case
Estimated Fedadverse case 1H’09A
Original 3/19 update – TY’09
a) – Equity impairment multi-year. ’09 revised view: Fed base case $1.6B, Fed adverse case $2.1B.Total revised view: Fed base case ~$13.0B, Fed adverse case ~$16.9B
–a)
23
1.48% 1.61%
2.17%
2.78%
1.46%
2.45%
1.12%
1.68%
2.27%
2.84%
2Q'08 3Q'08 4Q'08 1Q'09 2Q'09
Capital Finance portfolio qualityEquipment Consumer
Delinquencies
Non-earners 4.34%
5.62% 6.02% 5.92%
5.91%6.38%
7.43%8.20%8.47%
9.22%
10.56%
11.80%
4.70%
8.73%
13.23%
2Q'08 3Q'08 4Q'08 1Q'09 2Q'09
� North America delinquencies down 14 bps. to 6.96%‒ Better entry rates & improved late stage collection effectiveness helping delinquencies
‒ Non-earners balance flat to prior quarter … reduction in assets driving up rate
� U.K. mortgage market continues to pressure overall metrics‒ Delinquencies +30 bps. … non-earners +21 bps.
� Global banking delinquencies +1 bp.
Total
Non-mortgage
� Delinquency lower (6 bps.), improvement in Americas portfolio offset by slight increases in Asia & Europe
� Non-earners +18 bps. vs. 1Q’09‒ Driven by senior secured loans … well collateralized
� CRE non-earnings +166 bps. to 2.9% … delinquencies +178 bps. to 4.0%
� Verticals steady
Drivers
Mortgage
1.75%2.16% 2.21%
2.50% 2.74%3.33%
4.19%4.13%4.59%
5.47%
6.81%
1.29% 1.41%
4.71%
7.79%
2Q'08 3Q'08 4Q'08 1Q'09 2Q'09
Drivers
Total
Non-mortgage
Mortgage
30+ delinquency Non-earners
As expected … tough environment
24
Portfolio overview
Asset type
Consumer 31% 64%
Commercial 69% 36%
U.S. 38% 86%
U.S. consumer 7% 58%
- Cards 3% 9%
- Mortgage 0% 40%
- Auto 0% 1%
- Student loan 0% 1%
- Sales Finance/other 4% 7%
* Weighted average of top 4 U.S. money center banks @ 4Q’08
• Reserves adequate for losses incurred
• Reserves in line with large banks for comparable asset classes (mix)
• Resolution of non-earnings performing as expected
• U.K. Mortgage: Collateral realization strong
Portfolio composition very different from top banks
% of total portfolio
(as of 2Q’09)
GE Banks*

25
4Q'08 1Q'09 2Q'09
Capital Finance reserve coverage($ in billions)
$5.3$5.7
$6.6
Allowancefor losses
Consumer
� Increased coverage to 2.91%
� U.S. Card & Sales Finance
– Coverage rate steady at 6.6%
– Reserves/non-earnings 192%
� Mortgage
– Coverage rate � 44% to 1.32%
– Reserves/non-earnings 17%
– Average LTV at origination 75%
� Reserves increased by $0.5B in 2Q’09 … coverage rate to 1.13%
– Coverage at RE +37 bps. to 1.24%
– Strong collateral will lead to ultimate loss significantly below non-earners
Commercial
Reserve coverage +$0.9B, +22 bps. vs. prior quarter
Comm’l.
Consumer 3.6
1.7
3.7
2.0
4.1
2.5
Reservecoverage 1.42% 1.59% 1.81%
* 2Q’09 write-offs annualized/2Q’09 allowance
17 mos.write-offsin reserves*
8 mos.write-offsin reserves*
26
U.S. Consumer- U.S. credit cards $10.1 6.18% 8% $178 10.3% 7% 10.3% x 10.1- Residential mortgages none 1,011 3.3% 43%
- Sales finance/other 14.9 6.83% 13% 285 3.3% 8% 3.3% x 14.9
25.0 6.57% 21% 1,474 4.5% 62% 6.11%
U.S. Commercial- Real Estate debt 27.6 1.47% 23% 43.1 0.67% 0.67% x 27.6- Real Estate construction 0.6 4.46% 0.5% 13.1 9.37% 9.37% x 0.6- Commercial loans 27.1 1.84% 23% 229.3 1.35% 1.35% x 27.1- Commercial leases 37.7 1.30% 32% 22.4 1.14% 1.14% x 37.7
$93.1 1.53% 79% $914 2.18% 38% 1.12%
Total $118.1 2.60% 100% $2.4T 3.60% 2.17%
U.S. financing receivables vs. topU.S. banks
GECCReservecoverageReceivables
%Portfolio
($ in billions, as of 2Q’09)Top banks average
ReservecoverageReceivables
%Portfolio
Top bankscoverageGECC assetcomposition
a)- Consumer data avg. of Top 3 Banksb)- Real estate data source Top 5 Bank as of 4Q’08, loss coverage est. split construction vs. non-constructionc) - Commercial loans and leases data source Top 5 Bank
17%
27%
U.S. reserves in line
b)
- (a
c)

27
Non-earnings
4Q'07 1Q'08 2Q'08 3Q'08 4Q'08 1Q'09 2Q'09
Capital Finance
$13.0B1.47%
3.59%
Non-earnings %financing receivables
2.80%
1Q’09 $10.0 $5.7 57%
Walk
Interbanca 0.4 – 0% (2)
Real Estate 0.8 0.2 23% (2)
Mortgage 1.0 0.3 30% (2)
Comm’l lending& leasing 0.7 0.4 48% –
U.S. Consumer – (0.1) n/a (1)
Banks andnon-mortgage 0.1 0.2 129% 1
2Q’09 $13.0 $6.6 51%
1.41%
• U.S. Consumer non-earning flat; reserves �due to � in 30+ and � collection effectiveness on 90+
Coverage walk ($MM)
Non-earners Reserves
Non-earnerscoverage %
Consumer
Commercial
Total
2.13%
1.73%1.53%
$10.0B
$8.0B$7.3B
$6.5B$6.1B
$5.4B
50.5%56.9%66.6%63.4%69.4%70.8%78.1%
6.4
4.53.2
2.51.91.91.7
6.6
5.5
4.74.8
4.64.23.7
ex-FX $12.1B
Non-earnings coverage %
28
Non-earnings definitions
Non-earning Est. lossexposure
1
2
4
3
Non-earnings: Receivables 90 days or more past due (or where collection has become doubtful)
100% recovery: 100% collateral coverage
Workout/cure: In active restructuring/ negotiation with our customer (often timing/technical default issues) … expect full recovery
Remaining collateral: Recovery based on enterprise values, liens on assets or other sources of recovery (guarantees, etc.) but less than 100% collateral coverage
Mortgage insurance: Partial recovery of loss on sale of assets from insurance
Estimated loss exposure: Exposure at risk in excess of collateral
5
6
Remainingcollateral/Mortgageinsurance
Workout/cure
Exposureafter fullrecovery
100%recovery
1
2
3
4
5
6

29
Non-earnings coverage
•100% collateral recovery
• Typically no specific reserve required
100% recovery Workout/cureCollateral on
remaining exposure
•Accounts in active restructuring/negotiation
• Typically no specific reserve required
• Typically requires a specific reserve to cover collateral gap
ExampleCompany “B”
•U.S. real estate industry
• Senior-secured loan
• $13MM non-earning @ 12/’08
• Property value $20MM+
•Loan restructured at higher pricing and enhanced foreclosure rights in 2Q’09
ExampleCompany “A”
•U.S. retailer
•ABL facility – A/R + inventory
•GE commitment $150MM
•Filed bankruptcy 3Q’08
•Business sold 3Q’08
•GE fully recovered outstandings
ExampleCompany “C”
•U.S. home security industry
•Corporate loan
•$34MM non-earning @ 12/’08
•$10MM specific reserve
•Business sold and proceeds of $25MM received in 2Q’09
24
3
30
Commercial non-earnings($ in billions)
Payoffs/payments $0.6
Cured 0.2
Foreclosed/recovery 0.2
Write-off 0.4
$1.4
Bankruptcy proceedings $0.4Customer paying 0.5Negotiation/restructure 0.3In process of liquidating collateral 0.3All other, net 0.3
$1.8Paying customer (0.5)
$1.3
Real Estate $0.1EFS 0.2GECAS 0.2CLL 1.3
$1.8
• Semgroup
• Balli
• Business Prop. loans
• Loans and leases
159
Non-earning reserve coverage
Commercial
4Q’08Non-earning
4Q’08Reserves
Exposure
Collateralvalue onremainingexposure
Loans inrecovery/workout
Expect fullrecovery
100%recovery
($ in billions)
$3.2
$1.7
228%coverage
1.1
0.5
0.8
0.8
Estimatedloss exposure
100% recovery $1.1 $0.5 ($0.6)
Loss in recovery/workout 0.5 0.4 (0.1)
Collateral onremaining exp. 0.8 0.5 (0.3)
Est. loss exposure 0.8 0.4 (0.4)
$3.2 $1.8 ($1.4)
Balance@ 4Q’08
Remaining@ 2Q’09 ∆∆∆∆
March 19 presentation (p. 159)
2Q’09 composition
Non-earnings roll-forward
1H reduction
• $3.2B reduced to $1.8B• Estimate $400MM remaining loss exposure
31
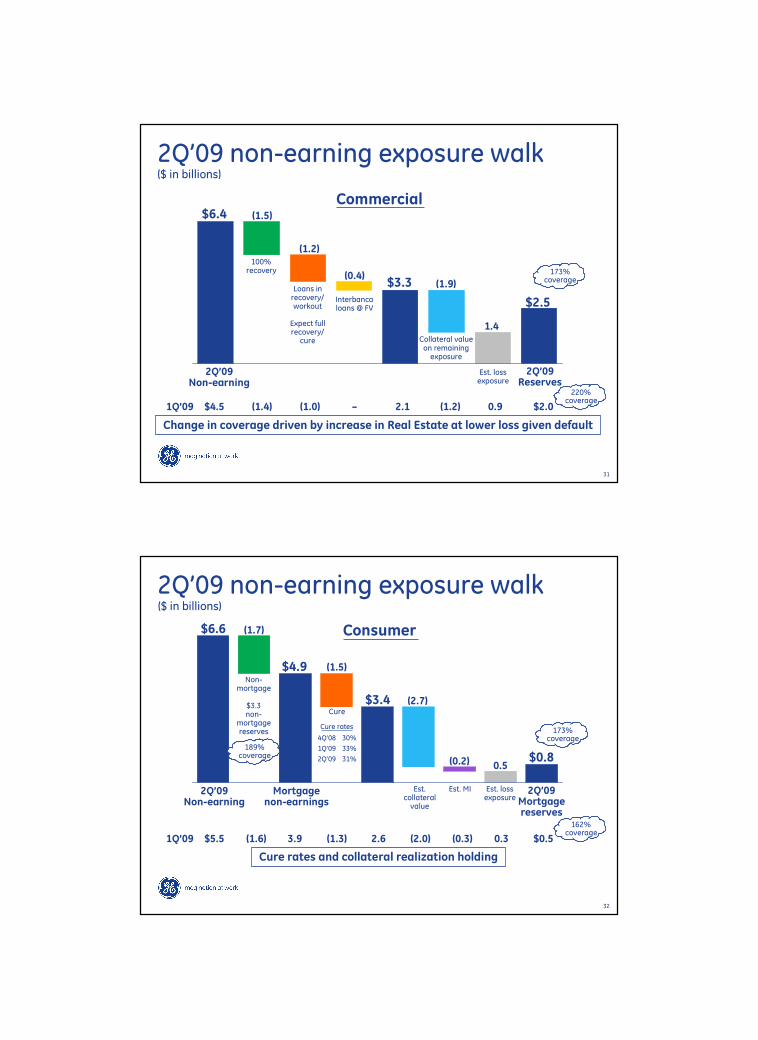
2Q’09 non-earning exposure walk($ in billions)
2Q’09Non-earning
2Q’09Reserves
Collateral value on remainingexposure
Loans inrecovery/workout
Expect fullrecovery/cure
100%recovery
$6.4
$2.5
(1.5)
(1.2)
(1.9)
1.4
Est. lossexposure
Commercial
173%coverage
1Q’09 $4.5 (1.4) (1.0) – 2.1 (1.2) 0.9 $2.0
$3.3
220%coverage
Interbancaloans @ FV
(0.4)
Change in coverage driven by increase in Real Estate at lower loss given default
32
2Q’09 non-earning exposure walk($ in billions)
2Q’09Non-earning
2Q’09Mortgagereserves
$6.6
$0.8
(1.7)
(1.5)
(2.7)
0.5
Consumer
173%coverage
$4.9
(0.2)
Mortgagenon-earnings
Est. MIEst.collateralvalue
Non-mortgage
$3.3non-
mortgagereserves
Cure rates
Est. lossexposure
189%coverage
1Q’09 $5.5 (1.6) 3.9 (1.3) 2.6 (2.0) (0.3) 0.3 $0.5
$3.4
162%coverage
4Q’08 30%
1Q’09 33%
2Q’09 31%
Cure
Cure rates and collateral realization holding
33
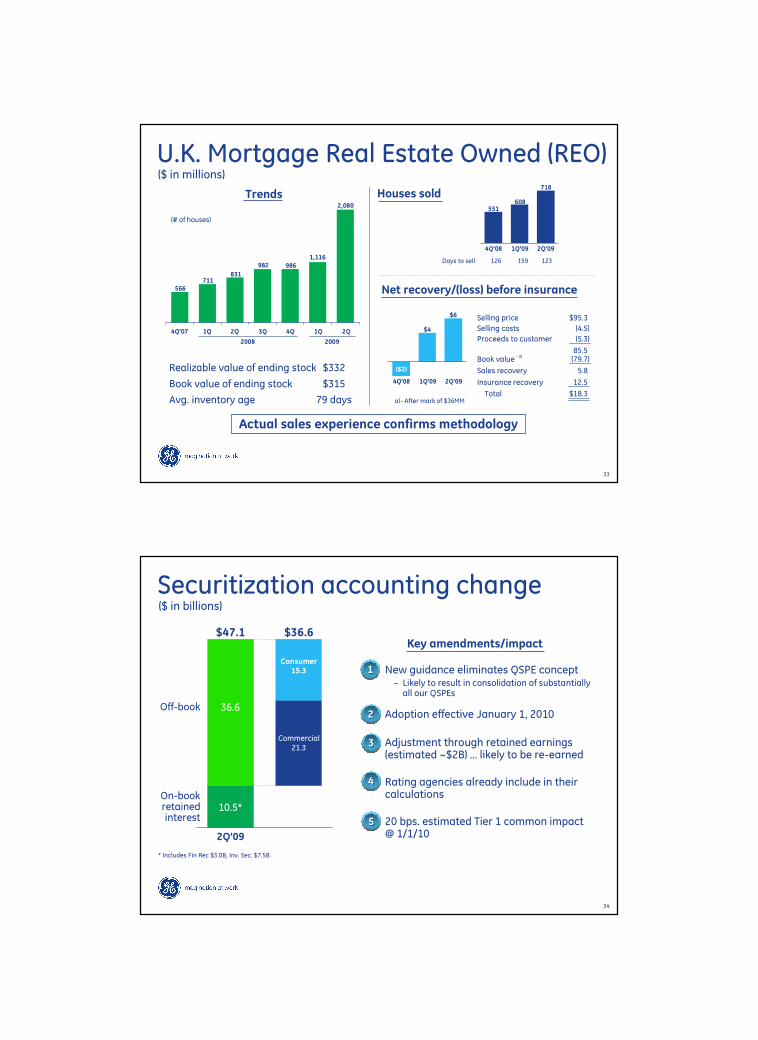
U.K. Mortgage Real Estate Owned (REO)
Trends
($ in millions)
2008
Days to sell 126 159 123
4Q’08 2Q’091Q’09
551
718
608
566
2,080
986
2Q1Q4Q3Q2Q1Q4Q’07
1,116982
831711
(# of houses)
2009
Selling price $95.3
Selling costs (4.5)
Proceeds to customer (5.3)
85.5Book value (79.7)
Sales recovery 5.8
Insurance recovery 12.5
Total $18.3
Net recovery/(loss) before insurance
Actual sales experience confirms methodology
Houses sold
Realizable value of ending stock $332
Book value of ending stock $315
Avg. inventory age 79 days
4Q’08 2Q’091Q’09
($2)
$6
$4
a)- After mark of $36MM
- a)
34
Securitization accounting change
$47.1
Consumer15.3 • New guidance eliminates QSPE concept
– Likely to result in consolidation of substantiallyall our QSPEs
– Adoption effective January 1, 2010
– Adjustment through retained earnings (estimated ~$2B) … likely to be re-earned
• Rating agencies already include in their calculations
• 20 bps. estimated Tier 1 common impact@ 1/1/102Q’09
($ in billions)
On-bookretainedinterest
Off-book
10.5*
36.6
Commercial21.3
Key amendments/impact
22
33
11
$36.6
* Includes Fin Rec $3.0B, Inv. Sec. $7.5B
44
55

35
Business Reviews& Stress Testing
36
Overview

37
Stress testing approach 2010
Consumer
• Mortgages, credit cards, auto, personal loans and sales credit financing
– By product, by geography – market specific macro assumptions for non-U.S. markets based on 3rd party or regulatory guidelines
– Consistent methodology applied across product types globally
Commercial
• Commercial Loans and Leases: Stress probabilities of default, recovery rates
• Commercial Real Estate: By market and property type
• Commercial Aircraft: Valuation by equipment type
• Energy loans and leases: Stress obligor ratings, increase severity, based on outlook
Bottoms up – asset by asset, business by business•Base case is business teams’ assumptions on losses and impairments
•Under Fed “Adverse” Case assumptions: 10.3% avg. unemployment, 10.7% peak unemployment (implied),
0.5% GDP growth
38
Commercial loans and leases – stress testing($ in millions)
Macro • GDP, unemployment
• Liquidity
Portfolio • Senior diversified positions
• Borrow leverage
• Sector diversification
• Asset value of collateral
Key drivers:
Base
Americas equipment $41 $458 1.1% $642 1.6%
Leveraged loans 40 743 1.9 1,093 2.8
Franchise finance 9 94 1.0 182 2.1
EU equipment 9 181 2.0 320 3.4
Asia Pacific 15 214 1.4 300 2.0
U.S. asset-based loans 9 73 0.8 122 1.3
All other 42 203 0.5 481 1.2
Total $165 $1,966 1.2% $3,140 1.9%
AdversePortfolio
2010 stress – credit costs2010 stress - key assumptions
GDP 0.5%
U/E avg. 10.3%
Defaults
Severity
• Two-year cumulative default rate of 15%
• Increased model LGD’s by 25%. Higher for certain products(e.g., Corporate Air)
Fed Adverse 4Q’09 est. fin. rec. ($B)
Lossrate %
Lossrate %

39
Losses and impairments outlook($ in billions)
Commercial portfolio
- Real Estate
Credit costs $0.9 $1.0 $0.5 $1.4
Impairments 0.7 1.1 1.4 1.5
- Aviation and Energy 0.4 0.7 0.2 1.0
- Mid-market lease/lend 2.0 2.6 2.0 3.1
- Other commercial 0.5 1.5 0.5 1.0
Consumer portfolio
- U.S. 5.1 5.7 4.8 5.0
- Non-U.S. mortgage 1.2 1.6 0.7 1.3
- Other consumer 2.2 2.7 2.1 3.2
Total ~$13.0 ~$16.9 ~$12.1 ~$17.5
Estimated base case
Estimated adverse case
2009 –a)
Estimated base case
Estimated adverse case
2010
a) – Adjusted for Real Estate equity impairments
40
Real Estate
41
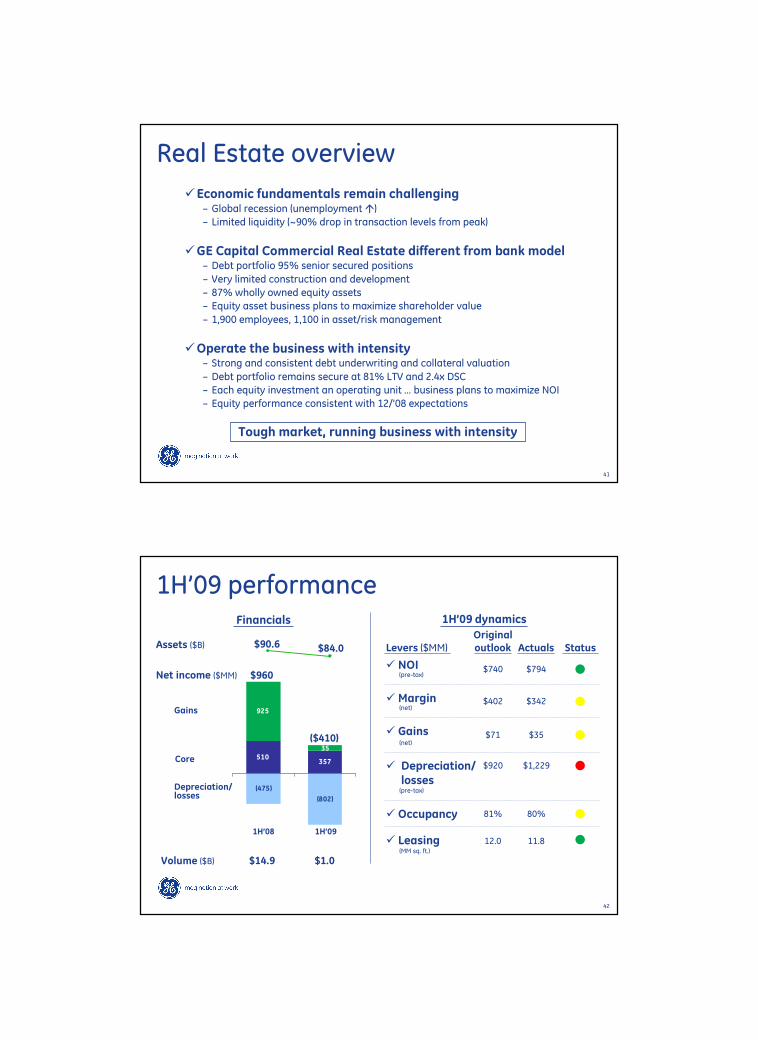
Real Estate overview
Tough market, running business with intensity
�Economic fundamentals remain challenging– Global recession (unemployment �)
– Limited liquidity (~90% drop in transaction levels from peak)
�GE Capital Commercial Real Estate different from bank model– Debt portfolio 95% senior secured positions
– Very limited construction and development
– 87% wholly owned equity assets
– Equity asset business plans to maximize shareholder value
– 1,900 employees, 1,100 in asset/risk management
�Operate the business with intensity– Strong and consistent debt underwriting and collateral valuation
– Debt portfolio remains secure at 81% LTV and 2.4x DSC
– Each equity investment an operating unit … business plans to maximize NOI
– Equity performance consistent with 12/’08 expectations
42
510
925
(475)
(802)
357
35
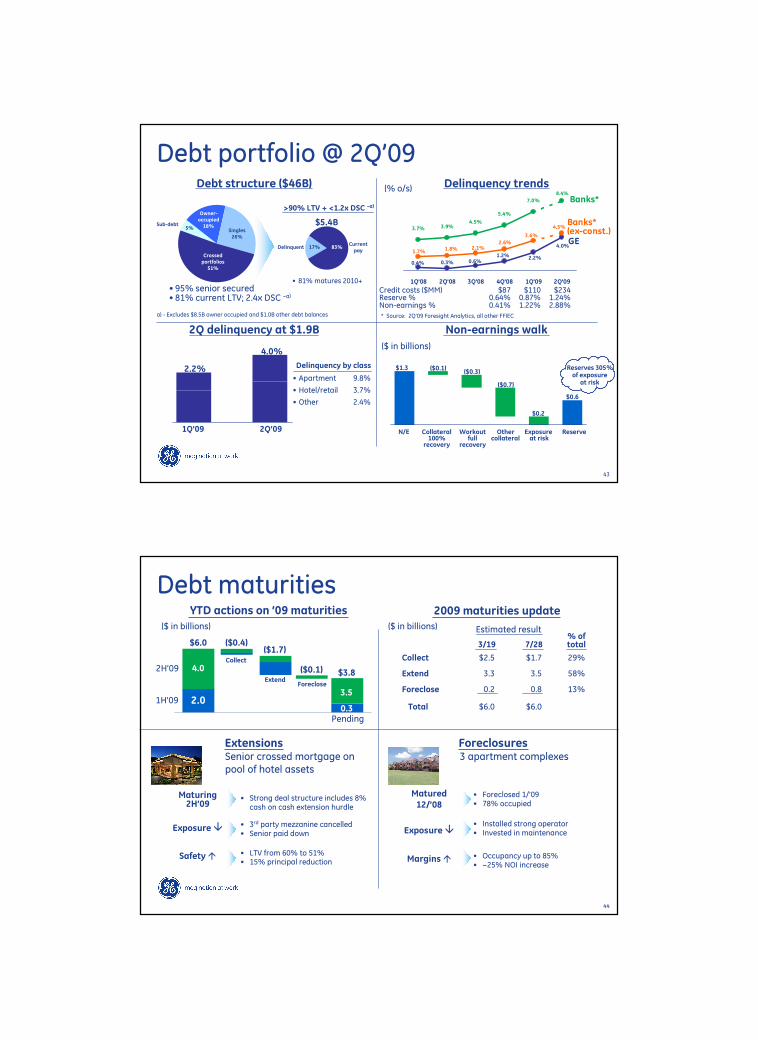
1H’09 performance
Assets ($B)
1H’09 dynamics
1H’091H’08
Net income ($MM)
$90.6 $84.0
$960
($410)
Gains
Depreciation/ losses
Financials
� NOI
�Margin
� Gains
� Depreciation/losses
� Occupancy
(pre-tax)
(net)
(net)
(pre-tax)
Levers ($MM)Originaloutlook Actuals Status
$740 $794
$402 $342
$71 $35
$920 $1,229
81% 80%
Volume ($B) $14.9 $1.0
Core
� Leasing(MM sq. ft.)
12.0 11.8
43
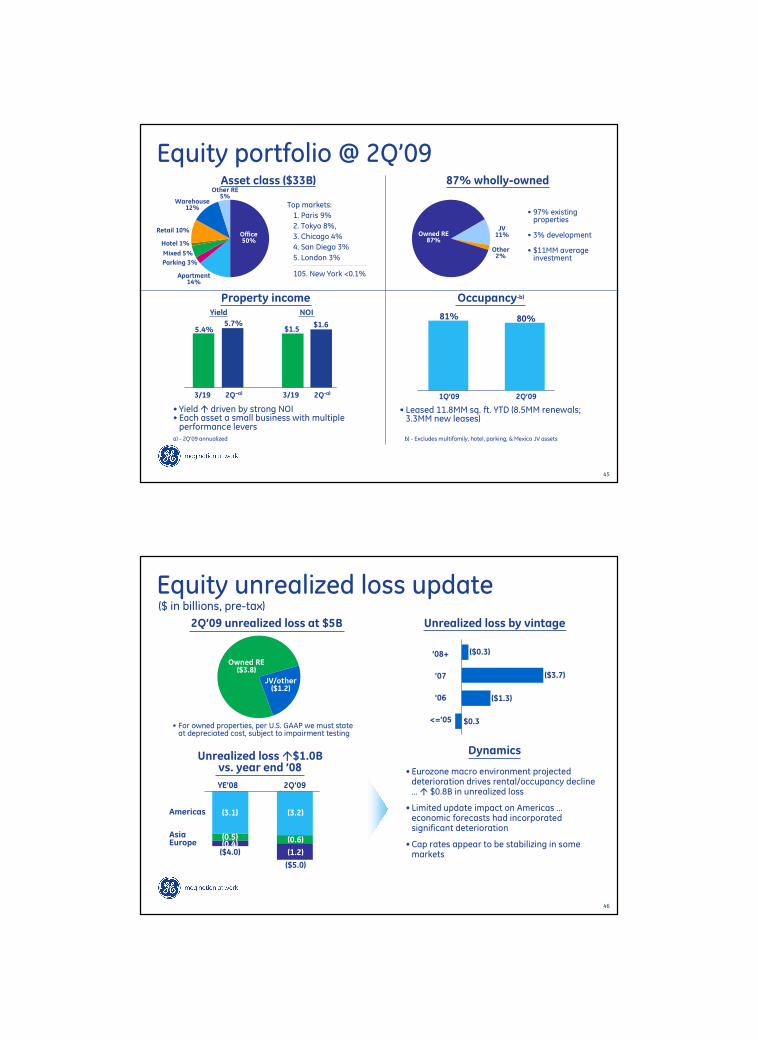
Debt portfolio @ 2Q’09
• Apartment 9.8%
• Hotel/retail 3.7%
• Other 2.4%
2.2%
4.0%
2Q’091Q’09
Non-earnings walk2Q delinquency at $1.9B
Reserves 305% of exposure
at risk
($ in billions)
3.7% 3.9%4.5%
5.4%
7.0%
0.4% 0.3% 0.6%1.2% 2.2%
4.0%1.7% 1.8% 2.1%
2.6%
3.6%
4.5%
1Q'08 2Q'08 3Q'08 4Q'08 1Q'09 2Q'09
(% o/s)
GE
Banks*
Delinquency trendsDebt structure ($46B)
Banks*(ex-const.)
* Source: 2Q’09 Foresight Analytics, all other FFIEC
Credit costs ($MM) $87 $110 $234Reserve % 0.64% 0.87% 1.24%Non-earnings % 0.41% 1.22% 2.88%
8.4%
• 81% matures 2010+• 95% senior secured• 81% current LTV; 2.4x DSC –a)
>90% LTV + <1.2x DSC –a)
DelinquentCurrentpay
$5.4B
17% 83%
a) - Excludes $8.5B owner occupied and $1.0B other debt balances
Sub-debt
$1.3 ($0.1)($0.3)
$0.6
$0.2
($0.7)
N/E Collateral Workout Other Exposure Reserve100% full collateral at risk
recovery recovery
5%
Owner-occupied18%
Singles26%
Crossedportfolios51%
Delinquency by class
44
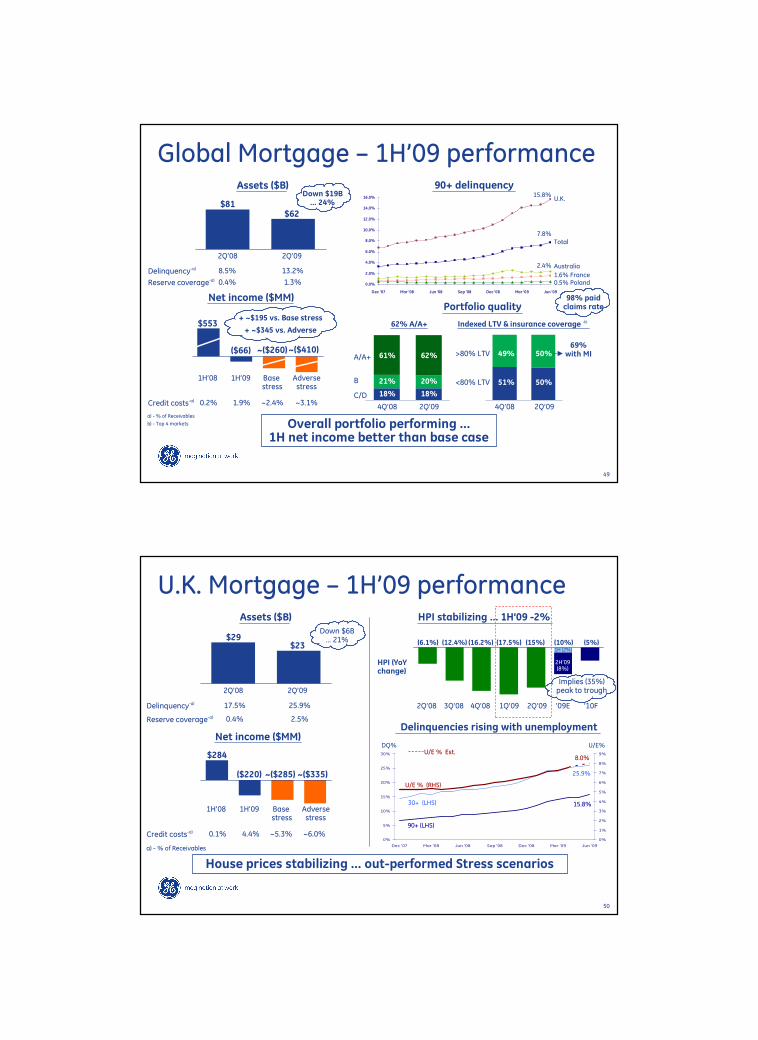
Debt maturities2009 maturities update
$6.0
$0.2
$3.3
$2.5
3/19
$6.0Total
13%$0.8Foreclose
58%$3.5Extend
29%$1.7Collect
% of total7/28
Estimated result($ in billions)
$6.0
$3.8
3.5
0.3
2H’09
1H’09
($0.4)
2.0
Collect
YTD actions on ’09 maturities
4.0
($1.7)
Extend
Extensions
($0.1)
Foreclose
($ in billions)
Pending
Maturing2H’09
Safety �
Exposure �
Senior crossed mortgage on pool of hotel assets
• Strong deal structure includes 8% cash on cash extension hurdle
• 3rd party mezzanine cancelled• Senior paid down
• LTV from 60% to 51%• 15% principal reduction
Foreclosures3 apartment complexes
Matured12/’08
Exposure �
Margins �
• Foreclosed 1/’09• 78% occupied
• Occupancy up to 85%• ~25% NOI increase
• Installed strong operator• Invested in maintenance
45
• Leased 11.8MM sq. ft. YTD (8.5MM renewals;3.3MM new leases)
Equity portfolio @ 2Q’09
NOI
2Q-a)
$1.6
Yield
2Q–a)
5.7%
3/19 3/19
5.4% $1.5
Property income
a) - 2Q’09 annualized
1Q’09
81%
2Q’09
Occupancy-b)
80%
b) - Excludes multifamily, hotel, parking, & Mexico JV assets
• Yield � driven by strong NOI• Each asset a small business with multiple performance levers
Asset class ($33B) 87% wholly-owned
Top markets:
1. Paris 9%
2. Tokyo 8%,
3. Chicago 4%
4. San Diego 3%
5. London 3%
• 97% existing properties
• 3% development
• $11MM average investment
Owned RE87%
JV11%
Other RE5%
Warehouse12%
Retail 10%
Hotel 1%
Mixed 5%
Parking 3%
Apartment 14%
Other2%
Office50%
105. New York <0.1%
46
Equity unrealized loss update
Dynamics
• Eurozone macro environment projected deterioration drives rental/occupancy decline … � $0.8B in unrealized loss
• Limited update impact on Americas …economic forecasts had incorporated significant deterioration
• Cap rates appear to be stabilizing in some markets
2Q’09 unrealized loss at $5B Unrealized loss by vintage
($0.3)’08+
’07
’06
<=’05
($3.7)
($1.3)
$0.3
($ in billions, pre-tax)
Unrealized loss �$1.0Bvs. year end ’08
Americas
AsiaEurope
YE’08 2Q’09
($4.0)
($5.0)
(3.1) (3.2)
(0.5) (0.6)
(1.2)(0.4)
JV/other($1.2)
Owned RE($3.8)
• For owned properties, per U.S. GAAP we must state at depreciated cost, subject to impairment testing

47
Stress test update
� Macro environment continues to be challenging� We are committed to providing investor transparency� Losses will materialize over time, should outperform peers� Results remain manageable for GE Capital and GE
($ in billions, pre-tax)
• Goal to outperform Fed adverse losses through strong property level execution
• Highly experienced global team focused on maximizing asset values
Unrealized equity loss over time (est.)
$0.0$1.0
($5.0) $1.4
$2.6
b) - Owner occupied reported separately ($0.1B)c) - Amounts derived from current estimate
Unrealizedequity loss (5.0) (4.7) (5.9) (5.0) (7.7)
(Afterimpairments) n/a (4.0) (4.8) (3.1) (5.1)
Implied loss onaffected assets 26% 28% 31% 26% 34%
Adversecase
Basecase
Loss views
Adversecase
Basecase-c)
2009E-b) 2010F
3/19 7/28
$0.5
$1.9 1.5
1.4EquityDebt
0.9 1.0
1.4
0.5
$2.9
1H’09
$1.6$2.1
1.10.7
a) - Fed adverse case
Depreciation/potential impairment-a)
Current 2H’09E ’10F ’11F Staticloss 2011 YE
estimate view
48
Mortgage/U.S. Consumer
49
69% with MI
Overall portfolio performing …1H net income better than base case
Global Mortgage – 1H’09 performance
a) - % of Receivables
b) - Top 4 markets
+ ~$195 vs. Base stress
+ ~$345 vs. Adverse
Down $19B … 24%
2Q’08 2Q’09
$81$62
Net income ($MM)
Reserve coverage-a) 0.4% 1.3%
1H’08 1H’09 Base stress
Adversestress
$553
($66)
Delinquency-a) 8.5% 13.2%
Credit costs-a) 0.2% 1.9% ~2.4% ~3.1%
~($260)~($410)
0.0%
2.0%
4.0%
6.0%
8.0%
10.0%
12.0%
14.0%
16.0%
Dec '07 Mar '08 Jun '08 Sep '08 Dec '08 Mar '09 Jun '09
90+ delinquency
Total
0.5% Poland
Australia
1.6% France
U.K.15.8%
7.8%
2.4%
Portfolio quality
4Q’08 2Q’09
61% 62%
21% 20%
18% 18%
A/A+
B
C/D
62% A/A+ Indexed LTV & insurance coverage -b)
>80% LTV
<80% LTV
50%
50%
2Q’094Q’08
49%
51%
98% paidclaims rate
Assets ($B)
50
Implies (35%) peak to trough
HPI (YoYchange)
2Q’08 3Q’08 4Q’08 1Q’09 2Q’09 ’09E ’10F
(6.1%) (12.4%) (16.2%) (17.5%) (15%) (10%) (5%)
2H’09(8%)
1H (2%)
0%
5%
10%
15%
20%
25%
30%
Dec '07 Mar '08 Jun '08 Sep '08 Dec '08 Mar '09 Jun '09
0%
1%
2%
3%
4%
5%
6%
7%
8%
9%
Down $6B … 21%
House prices stabilizing … out-performed Stress scenarios
Assets ($B)
2Q’08 2Q’09
$29$23
Net income ($MM)
Reserve coverage-a) 0.4% 2.5%
1H’08 1H’09 Base stress
Adversestress
$284
($220)
Delinquency-a) 17.5% 25.9%
Credit costs-a) 0.1% 4.4% ~5.3% ~6.0%
HPI stabilizing … 1H’09 -2%
~($285) ~($335)
a) - % of Receivables
U.K. Mortgage – 1H’09 performance
Delinquencies rising with unemployment
30+ (LHS)
90+ (LHS)
U/E % (RHS)
25.9%
15.8%
8.0%
DQ% U/E%U/E % Est.

51
Portfolio overview ($22.7B) –a)
A 20%
B 37%
C 25%
D 12%
2009/2010 stressed scenarios
Indexed LTV distribution
Pre 200749%
‘08 17%
2007 34%
>100%28%
<80%38%
80-90%17%
90-100%17%
A+ 6%
Credit distribution(internal GE Scores)
a) - Financing receivablesb) - 87% mortgage insured
Aggressive REO, loss mitigation & collections actions producing results
7.4% 10%Unemployment(average)
Home price change �10%
Key assumptions
$472Credit cost $ $530$995
�29%
8.5%
1H’09ABase
Peak to trough(home price change)
�42%�43%
2009E 2010F
$1,125
�35%
9.0%
Adverse
�48%
10.5%
�25%
$800
�54%
Adverse
�9%
�28%
U.K. Mortgage ’09-’10 Stress scenarios
4.4%Credit cost % 3.1%4.8% 5.4% 4.6%
($ in millions)
–b)
Base
52
Retail Finance – 1H’09 performanceKey actions
1H’09 plan
1H’08 act.
$261 $252+245% V plan & $541 V adverse
1H’09 act.
1H’09 adverse
$73$(289)
Net income ($MM)
Strong 1H’09 performance … $179 above plan & $541 above stress
2Q’09 plan
2Q’08 act.
$54.7
$49.5
$(3.6B) V plan & $(5.2B) YoY
2Q’09 act.
$53.1
Served receivables ($B)
53.4
Controlled credit lines
$1,581
$932
Revolving$5,059
$3,877
Sales Finance
Raised cut-offs & tightened approvals
728 730744
Oct.’08 June ’09
Previous Year
Current Year
Risk adjusted open to buy ($B)$372
’07 NewVolume
$41
’08 Red.
($200)
2Q’09
$198
Net 1H Red.
($15)
($215B)
+20 FICO
750Avg. U.S. FICO: 693
Avg. FICO Approval rates %
’08
$213
(575 bps.)
48.3 52.446.6
(41%) (23%)
730768
51.346.7
Feb. ’09 Oct. ’08 June ’09Feb. ’09
$1,610
$990
$4,953$3,984
June ’09Feb. ’09 June ’09Feb. ’09
11
22
33
Increased collections intensity …Collectors per DQ accounts up 15% vs ’08
44
53
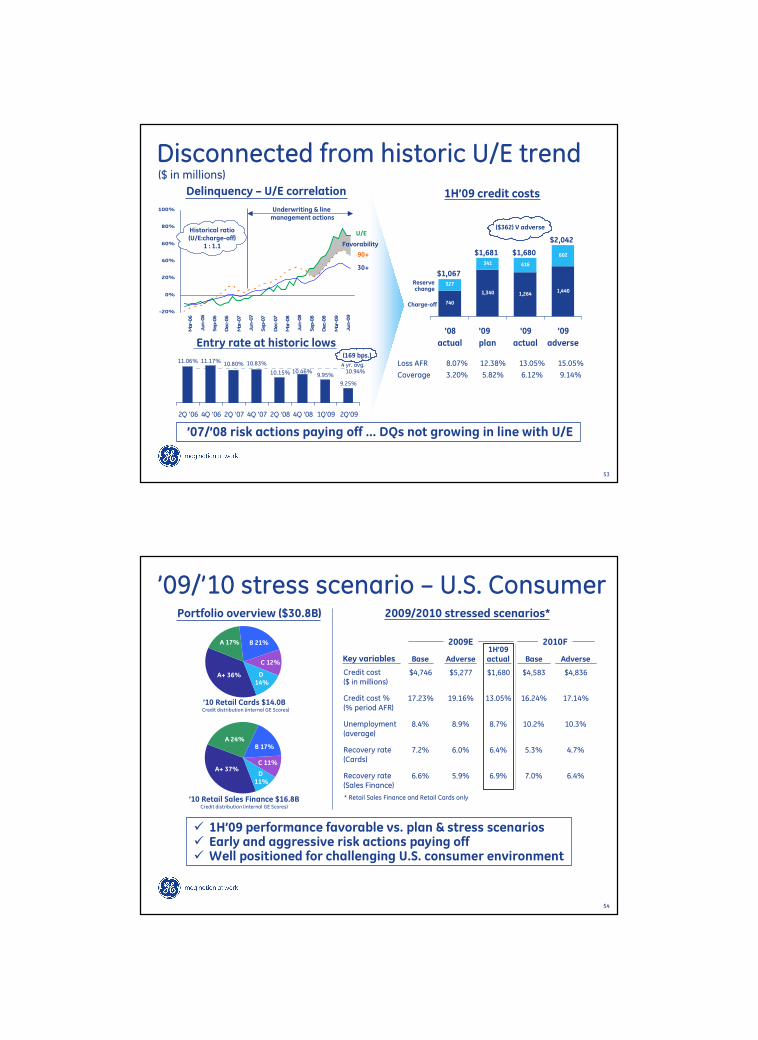
Disconnected from historic U/E trend($ in millions)
’07/’08 risk actions paying off … DQs not growing in line with U/E
-20%
0%
20%
40%
60%
80%
100%
Mar-06
Jun-06
Sep-06
Dec-06
Mar-07
Jun-07
Sep-07
Dec-07
Mar-08
Jun-08
Sep-08
Dec-08
Mar-09
Jun-09
Favorability
Underwriting & line management actions
Historical ratio(U/E:charge-off)
1 : 1.1
U/E
90+
30+
Reserve change
Charge-off
Delinquency – U/E correlation 1H’09 credit costs
Entry rate at historic lows
10.80% 10.83%
9.25%
9.95%
11.06% 11.17%
10.46%10.15%
2Q '06 4Q '06 2Q '07 4Q '07 2Q '08 4Q '08 1Q'09 2Q'09
(169 bps.)
4 yr. avg.10.94%
Loss AFR 8.07% 12.38% 13.05% 15.05%
Coverage 3.20% 5.82% 6.12% 9.14%
740
1,340 1,2641,440
327
341 416
602
'08
actual
'09
plan
'09
actual
'09
adverse
$1,067
$1,681 $1,680
$2,042
($362) V adverse
54
’09/’10 stress scenario – U.S. ConsumerPortfolio overview ($30.8B)
’10 Retail Cards $14.0B
Key variables
2009/2010 stressed scenarios*
’10 Retail Sales Finance $16.8B
A+ 36%
A 17% B 21%
C 12%
D 14%
A+ 37%
A 24%B 17%
C 11%
D 11%
Credit distribution (internal GE Scores)
Credit distribution (internal GE Scores)
Adverse Base AdverseBase
Credit cost %(% period AFR)
19.16% 16.24% 17.14%17.23% 13.05%
Unemployment(average)
8.9% 10.2% 10.3%8.4% 8.7%
1H’09actual
Recovery rate (Sales Finance)
5.9% 7.0% 6.4%6.6% 6.9%
Recovery rate (Cards)
6.0% 5.3% 4.7%7.2% 6.4%
2009E 2010F
� 1H’09 performance favorable vs. plan & stress scenarios� Early and aggressive risk actions paying off� Well positioned for challenging U.S. consumer environment
Credit cost($ in millions)
$5,277 $4,583 $4,836$4,746 $1,680
* Retail Sales Finance and Retail Cards only
55
Banks and JVs
56
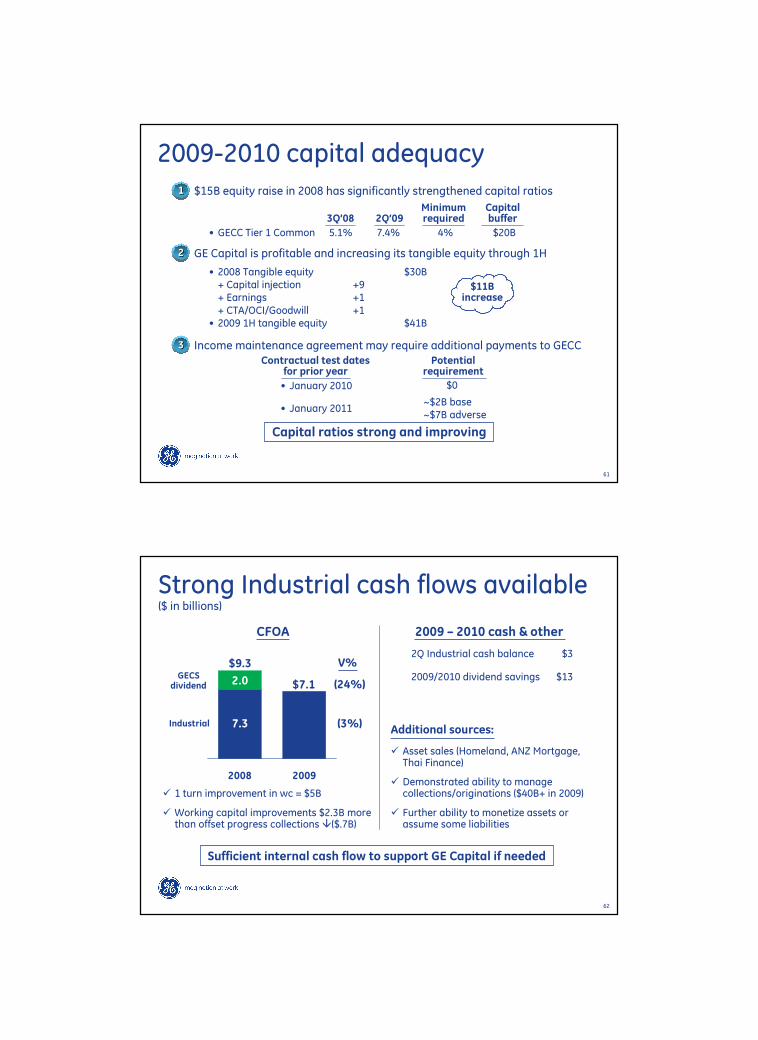
CEE Bank update
Assets ($B) $32.9 $27.7 (16)% 12%Deposits ($B) 11.2 12.1 8% 40%Loss/ANI % 1.48% 2.76% 128 bps.
1H’09
$240
1H’08
$501
VPY%
Net Income
Tough economic environment … but strong franchises
+$47MMvs. plan
($ in millions)
Diversified product portfolio
$20.2B 2Q’09 receivables (%)
Credit performance
Mortgages
Cards
SME
Personal Loans
Sales FinanceAuto
A+ 51%
A 17%
B 17%
C 9%
D 6%
30+%
90+%
9%4%
20%
22%
5%
40%
2.48% 2.89%
4.17%
0.76% 1.02%1.63%
2Q’08 3Q’08 4Q’08 1/’09 2/’09 3/’09 4/’09 5/’09 6/’09
• Adjusted originations:
� Mortgage originations �83% and Auto originations �66%
� Higher grade credit originations only
V ex-FX
Stress loss summary
’09 base ’09 adverse 1H’09A ’10 base ’10 adverse
$716 $1,043 $344 $573 $949
Delinquencies

57
GECC JVs and partnerships
Investment%
Ownership
2Q’09Inv.($B)
1H’09 GEearnings Strategic rationale/Performance comment
Penske Truck Leasing 50% $6.1 + 21 year partnership; strong brand/franchise
Hyundai – Korea 43% 3.5 + Performance above plan; gaining market share
Garanti Bank – Turkey 21% 2.2 + #3 bank in Turkey; strong margins and loss performance in 1H’09
Bank of Ayudhya – Thailand 33% 1.2 + #4 bank in Thailand; performing above plan
CAMGE – Spain 50% 0.9 + Profitable YTD with lower costs and better loss performance
GE Nissen – Japan 50% 0.8 + Challenged but performing
Dogus GE BV – Romania 50% 0.5 – Banking start-up partnership with Dogus/Garanti in Romania
Colpatria – Colombia 50% 0.4 + Performing above plan
AsiaSat – Hong Kong 37% 0.3 + Steady performance in ’09
Cosmos Bank – Taiwan 23% 0.2 – Remains challenged, performance improvement in 2Q from lowercosts; $110MM 1H impairment recorded
EFS project investments Various 6.5 + Structured equity in energy producing projects; performing to plan
Others Various 3.1 + ~60 small partnerships; ~$55MM avg. investment; $16MM1H impairment recorded
Total associated companies $25.7
� Solid strategic rationale
– Market entry into emerging markets
– Partners bring distribution, domain and capital
(Associated companies)
58
SummaryEnvironment remains challenging – GECC is prepared– Strong funding/liquidity actions and plans
Granular view of stressed losses … working aggressively. Reserves are appropriate and in line with bank peers
Expect profitable 2009 … losses better than Fed base case, more cost-out
Intense focus on risk management,work-out and restructuring– Rigorous GE Capital asset management
Playing offense … originations/margins increasing
GE Capital business model robust … earnings rebound as the economy recovers
22
33
44
11
55
FutureToday
ENI $540B ~$400B
Core55%
Global banks15%
Verticals15%
Restructuring15%
Core &verticals85%
Global banks15%
•More focused GE Capital - competitively advantaged
•Diversified portfolio and funding
66
2%+ ROI

59
GE Context
60
GE 2Q reported results vs. peers
Peer comparison
� Cash flow ahead of plan … $7.1B
� Aggressive cost out … $.06 EPS restructuring and other YTD
� Infrastructure backlog steady at $169B
� Services and global revenues strong
� Margins holding from 1 year ago
� GE Capital safe and secure
2Q V%
GE Infrastructure
S&P Industrials
2Q Highlights
GE Capital
S&P Financials
NBCU
Media peers
Flat
(35%)
(85%)
(75%)
(41%)/(24%)
(42%)
Execution through the recession and positioning for reset economy
a) – 2Q’09 estimated consensus
- a)
61
2009-2010 capital adequacy
• $15B equity raise in 2008 has significantly strengthened capital ratios11
3Q’08
• GECC Tier 1 Common 5.1% 7.4% 4% $20B
• January 2010
2Q’09Minimumrequired
Capitalbuffer
• GE Capital is profitable and increasing its tangible equity through 1H22
• 2008 Tangible equity $30B+ Capital injection +9+ Earnings +1+ CTA/OCI/Goodwill +1• 2009 1H tangible equity $41B
$11Bincrease
• Income maintenance agreement may require additional payments to GECC 33
Contractual test datesfor prior year
Potentialrequirement
Capital ratios strong and improving
• January 2011
$0
~$2B base~$7B adverse
62
Strong Industrial cash flows available($ in billions)
2008 2009
CFOA
$9.3
$7.1
7.3
GECSdividend
Industrial (3%)
(24%)
V%
2.0
� 1 turn improvement in wc = $5B
� Working capital improvements $2.3B more than offset progress collections �($.7B)
2009 – 2010 cash & other
Sufficient internal cash flow to support GE Capital if needed
� Asset sales (Homeland, ANZ Mortgage, Thai Finance)
� Demonstrated ability to manage collections/originations ($40B+ in 2009)
� Further ability to monetize assets or assume some liabilities
Additional sources:
2Q Industrial cash balance $3
2009/2010 dividend savings $13

63
Key Messages
GE Capital executing well in difficult environment
• Funding and liquidity are in great shape
– 2009 complete, ~45% of 2010 funding complete, exiting TLGP program
– $50B of cash and CP at $50B is six months ahead of schedule
• Our reserving is adequate and compares to banks when adjusted for mix
– Our reserve coverage is increasing and compares well to ultimate expected loss
– 1H nonearning experience supports our reserving assumptions
• 1H losses below Fed base case and overall cycle losses are manageable
– 2010 loss scenarios could be similar to 2009
– Any additional capital needs at GECC are very manageable with industrial cash flows
• GE is committed to GE Capital business model
– Investors can expect a conservative, focused and competitively advantaged GECC
– Financial services “white paper” does not change our strategy


![Investor Presentation - Analyst / Institutional Investor Meeting [Company Update]](https://static.fdocuments.in/doc/165x107/577c98301a28ab163a8b4855/investor-presentation-analyst-institutional-investor-meeting-company-update.jpg)