Economic Freedom of the World Index: A Comparative Examination
GDP Growth and the Index of Economic Freedom Analysis
September 2012
Summer 2012

22Proprietary & Confidential. © 2011, glendonTodd Capital LLC
Project Overview
Introduction to the Index
The Index of Economic Freedom
Changes in the Index
Other Metrics to Consider
Analysis of Existing Research
Data Collection Process
Data Analysis Process
GDP Forecast Models
Results and Conclusions
Agenda

33Proprietary & Confidential. © 2011, glendonTodd Capital LLC
Project Overview
We observe that macroeconomic predictions are based on linear applications of growth factors to prior period
GDP
We believe this is a fundamentally flawed approach, only made worse as the projection extends further from
the date on which the projection is released
Our goal is to determine whether or not we can create a better lens through which to make forecasts by using
the Heritage Foundation’s Index of Economic Freedom (“The Index”) to project economic outcomes
Through our research and application of The Index, we seek to answer three questions:
Can we predict GDP growth by applying The Index as a contextual measure with predictive value?
If not, can we augment The Index with other indicators in order to create a greater correlation to GDP growth, and therefore predict GDP growth based on this modified index?— For example, does adding personal credit and the velocity of money make a material difference in the
quality of the projections?
If we cannot affirmatively answer either of the previous questions, can we predict dislocations in GDP
growth by developing a continuum of performance for each indicator ranging from green to yellow to red to indicate that one or more of the indicators has, given the size or growth rate of the GDP under analysis, moved from an acceptable range into a range suggesting dislocation is increasingly probable
Source: International Monetary Fund, World Economic Outlook April 2012

44Proprietary & Confidential. © 2011, glendonTodd Capital LLC
Project Overview
Introduction to the Index
The Index of Economic Freedom
Changes in the Index
Other Metrics to Consider
Analysis of Existing Research
Data Collection Process
Data Analysis Process
GDP Forecast Models
Results and Conclusions
Agenda

55Proprietary & Confidential. © 2011, glendonTodd Capital LLC
The Index was created by the Heritage Foundation and is published by The Wall Street Journal
It was created in 1995, and is a series of ten economic factors, which group countries into five categories, ranging from repressed to free
The Index is an essential measurement used to determine the level of autonomy within a country and quantify it’s relative freedom
The map below illustrates the 2012 world map of The Index:
The Index of Economic Freedom: Background
Source: Heritage Foundation’s 2012 Index of Economic Freedom, Executive Highlights

66Proprietary & Confidential. © 2011, glendonTodd Capital LLC
Why is it important?
“To be controlled in our economic pursuits means to be controlled in everything.”—Friedrich Hayek
The Index promotes economic growth and well-being in countries due to it’s proven correlation with several economic factors of prosperity and wealth
The relationship between support for innovative ideas and sustained economic growth demonstrated by trends in The Index would ideally result in government implementation of policies to increase individual freedom
Economic Freedom is “a condition or state of livelihood in which individuals can act with autonomy while in the pursuit of livelihood”
Contrasting economic freedom is economic contraction, which according to Antony Davies is when, “someone tells you you must spend your resources in a way that you would not choose to spend of your own volition”
The importance of measuring these freedoms is derived from their correlation with the following: Prosperity in terms of GDP
Reductions in poverty Higher levels of per capita income Income growth rates
Entrepreneurial activity
The Index measures the economic freedom of nations to demonstrate the correlation between the results and
the prosperity of countries
Source: Heritage Foundation’s 2012 Index of Economic Freedom, Executive Highlights; “Does Government Spending Create Economic Growth?” By Antony Davies
77Proprietary & Confidential. © 2011, glendonTodd Capital LLC
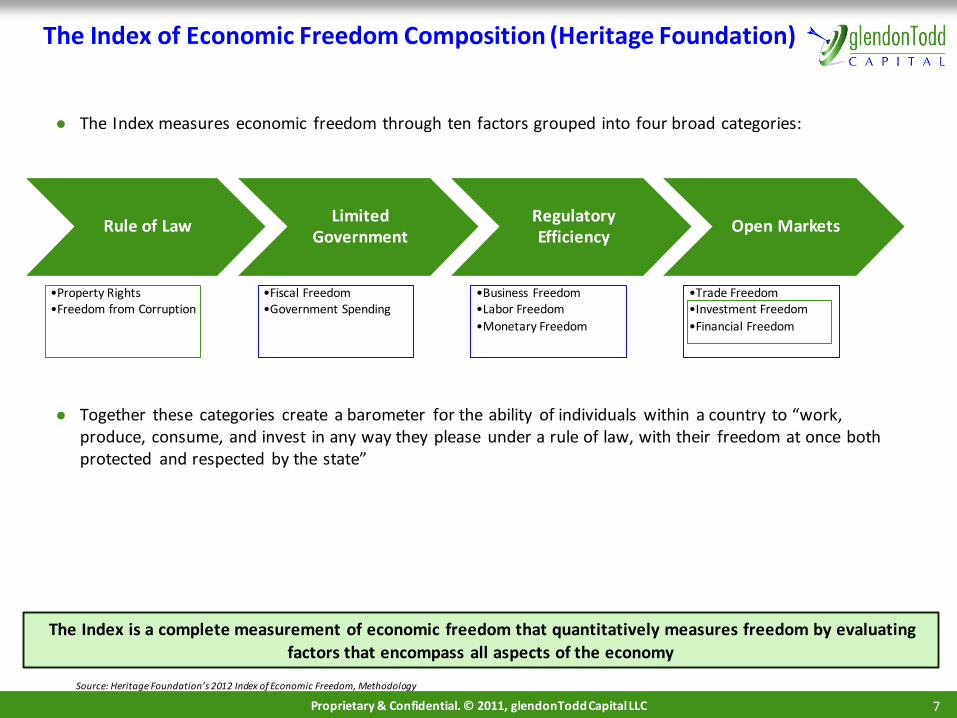
The Index measures economic freedom through ten factors grouped into four broad categories:
Together these categories create a barometer for the ability of individuals within a country to “work, produce, consume, and invest in any way they please under a rule of law, with their freedom at once both protected and respected by the state”
Rule of Law
•Property Rights•Freedom from Corruption
Limited Government
•Fiscal Freedom•Government Spending
Regulatory Efficiency
•Business Freedom•Labor Freedom
•Monetary Freedom
Open Markets
•Trade Freedom•Investment Freedom
•Financial Freedom
The Index of Economic Freedom Composition (Heritage Foundation)
The Index is a complete measurement of economic freedom that quantitatively measures freedom by evaluating
factors that encompass all aspects of the economy
Source: Heritage Foundation’s 2012 Index of Economic Freedom, Methodology

88Proprietary & Confidential. © 2011, glendonTodd Capital LLC
Economic Freedom of the World (Fraser Institute)
The Economic Freedom of the World (“EFW”), produced by the Fraser Institute, is another index that measures
economic freedom, much like The Index. It is based upon the following “key ingredients of economic freedom”: Personal choice Voluntary exchange coordinated by markets
Freedom to enter and compete in markets Protection of persons and their property from aggression by others
In this index, there are five broad areas of measurement that reflect the “key ingredients of economic freedom.” These five areas of measurement encompass 23 categories and include 42 variables
Each variable/sub-category score is determined on a scale of 0 to 10, which are then averaged together to
determine category scores, averaged once again to determine area scores, and each of the 5 area scores are averaged to get a total score
Source: Economic Freedom of the World 2011, Annual Report
Size of Government
•Government consumption spending
•Transfers and subsidies•Government enterprise
and investment•Top marginal tax rate
Legal Structure and Security of Property Rights
•Judicial independence•Impartial courts
•Property rights
•Military interference
•Integrity of legal system
•Legal enforcement of contracts
•Restrictions on sale property
Access to Sound Money
•Money growth•Standard deviation of
inflation•Current inflation
•Freedom to own foreign bank accounts
Freedom to Trade
•Taxes on international trade
•Regulatory trade barriers•Size of trade sector
•Black-market exchange rates
•International capital market controls
Regulation of Credit, Labor and Business
•Credit market regulation•Labor market regulations
•Business regulations

99Proprietary & Confidential. © 2011, glendonTodd Capital LLC
The Index (Heritage) vs. Economic Freedom of the World (Fraser)
What are the similarities and differences?
Both indices measure economic freedom using similar categories and variables, having the same ultimate goal of determining the relative economic freedom of nations in hopes of promoting economic growth
These measures utilize much of the same data and philosophies to determine their scores, but the
differences arise in the sources of data and how each uses the initial variables to convert them and obtain a final score
The final calculation of both indices involve a simple average of the factors. However, the EFW has five
broad areas of measurement compared to the ten factors used in The Index— This makes it difficult to reconcile the two, as many of the factors in The Index may be included in one
factor in the EFW
The EFW uses factors that are primarily outcome variables, while The Index focuses on policy variables that governments can actually control
The EFW is measured over five year time intervals, where as The Index is recorded annually
The EFW extended their data sets back in time, while The Index does not
Why The Index?
Considering the EFW is only recorded every five years and we have a limited time span of data available, it is better to use the annual Index scores to account for more true fluctuations in the data over time
The EFW has a lot of missing data for its five underlying indexes, which prevents a constant aggregation of
the summary score The Index keeps its categories separate until the final score calculation. This makes it much easier for us to
manipulate their final calculation by changing the significance of each factor
The flexibility built into this model enables The Index to be altered by using weights for each factor based on the impact and correlation with GDP that we determine by analyzing data
Source: Economic Freedom of the World 2011, Annual Report; Index of Economic Freedom 2012 and “Economic Freedom and Economic Growth: A Short-Run Causal Investigation” by J. Heckelman

1010Proprietary & Confidential. © 2011, glendonTodd Capital LLC
Project Overview
Introduction to the Index
The Index of Economic Freedom
Changes in the Index
Other Metrics to Consider
Analysis of Existing Research
Data Collection Process
Data Analysis Process
GDP Forecast Models
Results and Conclusions
Agenda

1111Proprietary & Confidential. © 2011, glendonTodd Capital LLC
Rule of Law
•Property Rights•Description
•Scoring
•Milestones
•Freedom from Corruption
•Description•Scoring
•Milestones
Limited Government
•Fiscal Freedom•Description
•Scoring
•Milestones
•Government Spending
•Description•Scoring
•Milestones
Regulatory Efficiency
•Business Freedom•Description
•Scoring
•Milestones
•Labor Freedom
•Description•Scoring
•Milestones
•Monetary Freedom
•Description
•Scoring•Milestones
Open Markets
•Trade Freedom•Description
•Scoring
•Milestones
•Investment Freedom
•Description•Scoring
•Milestones
•Financial Freedom
•Description
•Scoring•Milestones

1212Proprietary & Confidential. © 2011, glendonTodd Capital LLC
The Index: Rule of Law
The Rule of Law category within The Index measures the abilities of a nation’s government to protect and
respect the rights of its citizens
There are two metrics within this category:
1. Property Rights2. Freedom From Corruption
Property Rights measures the ability of individuals to own private property This factor determines the degree to which the laws of a nation protect private property, the regularity with
which those laws are enforced, and the efficiency of the court system
Freedom from Corruption measures the level of perceived corruption in a nation’s government This factor uses Transparency International’s Corruption Perceptions Index (“CPI”) to rank nations based on
their perceived corruption
Together, these two scores measure Rule of Law by determining the protections of the law, the efficiency and
effectiveness of the court system, and the level of corruption in the government
Source: Index of Economic Freedom, Methodology
Rule of Law Limited Government Regulatory Efficiency Open Markets

1313Proprietary & Confidential. © 2011, glendonTodd Capital LLC
Property Rights are fundamental to economic freedom because they create an environment that fosters
investment, business transactions, and economic growth
By defining ownership of land, capital, and objects, Property Rights form the backbone of a capitalist society
With ownership defined, individuals have more incentive to buy, sell, trade, and invest in assets because they are more confident in their ability to reap a required rate of return
Strong Property Rights and an efficient legal system create environments in which ideas can be capitalized Economic growth depends not only on ideas, but on ideas that can be shared and capitalized. “Ideas are
best generated and shared in an environment where they can be protected and financed”
When Property Rights are not protected by the state, individuals have little incentive to trade or invest in their
property because they are uncertain as to whether they will own the property in the future
Even if Property Rights are defined, without legal protection of those rights, individuals with power can simply
take property from the people, preventing the democratization of property and therefore stagnating the economic development of the country
Rule of Law: Property Rights
Sources: Heritage Foundation’s 2012 Index of Economic Freedom Methodology, “Strengthening Globalization’s Invisible Hand: What Matters Most?” by Siems and Ratner, and “Property Rights: The Key
to Economic Development” by O’Driscoll and Hoskins
Rule of Law Limited Government Regulatory Efficiency Open Markets

1414Proprietary & Confidential. © 2011, glendonTodd Capital LLC
Property Rights: Scoring
The Index measures Property Rights based on the following four factors:
The ability of individuals to accumulate private property The degree to which the state protects those rights The likelihood of expropriation
The ability of individuals to enforce contracts
These measurements are taken and compared to the final score (between 0 and 100) that the nation receives
for Property Rights, determined by the following scale:
Source: Heritage Foundation’s 2012 Index of Economic Freedom, Methodology
Rule of Law Limited Government Regulatory Efficiency Open Markets
Score Description
0 All property is state owned and corruption is rampant
10 Most property is state owned and private property is rarely protected by the state, corruption is rampant and expropriation regular
20Private property is weakly protected, the legal system is inefficient and corrupt and so contracts are difficult to enforce and most disputes are settled outside the legal system. Expropriation is frequent
30 Private property is weakly protected, the legal system is inefficient, corruption exists, the judiciary is not independent, and expropriation is possible
40 The courts are highlyefficient, the judiciary is not independent, and expropriation is possible
50 The court system is inefficient, corruption likely exists, the judiciary is no independent, but expropriation is rare
60 The judiciary is not independent, corruption is rare but possible, rights enforcement is inefficient and delays are frequent, expropriation is rare
70Private property is guaranteed by the government, courts are lax in enforcing contracts and experience delays, corruption rarely exists, and expropriation is unlikely to happen
80 Private property is guaranteed by the government, the courts are efficient but some delays still exist, corruption is rare, and expropriation is highly unlikely
90Private property is guaranteed by the government, courts enforce contracts without delays, justice system is efficient, corruption barely exists, and expropriation is highly unlikely
100Private property is guaranteed by the government, court system is effective and efficient, justice system is effective and efficient, and no corruption or expropriation exists
1515Proprietary & Confidential. © 2011, glendonTodd Capital LLC
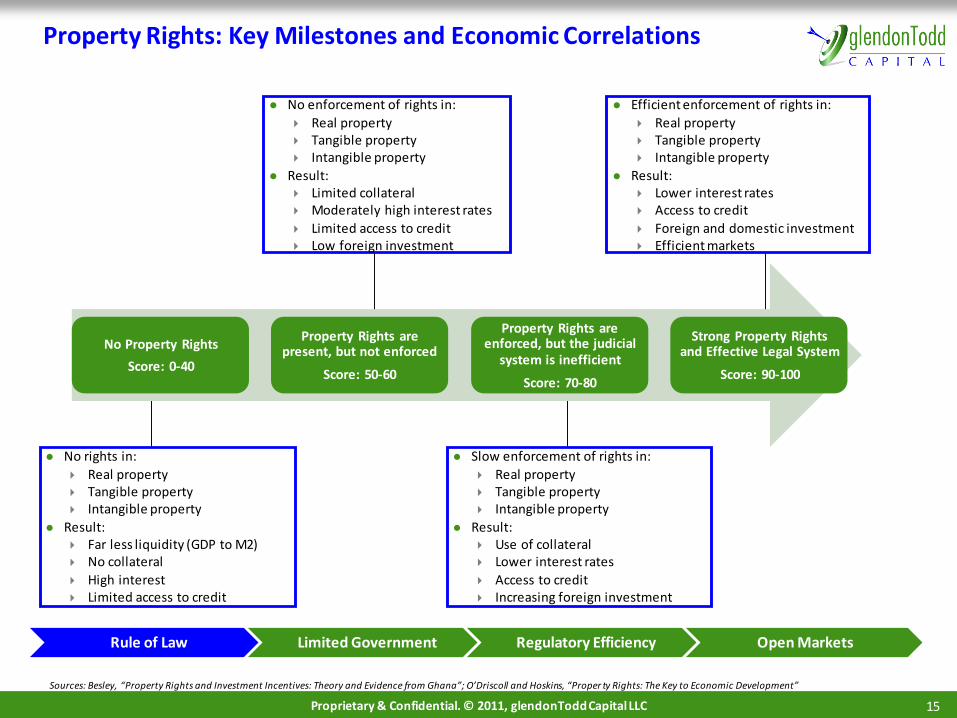
Property Rights: Key Milestones and Economic Correlations
No rights in:
Real property Tangible property Intangible property
Result: Far less liquidity (GDP to M2) No collateral
High interest Limited access to credit
Slow enforcement of rights in:
Real property Tangible property Intangible property
Result: Use of collateral Lower interest rates
Access to credit Increasing foreign investment
Sources: Besley, “Property Rights and Investment Incentives: Theory and Evidence from Ghana”; O’Driscoll and Hoskins, “Proper ty Rights: The Key to Economic Development”
Rule of Law Limited Government Regulatory Efficiency Open Markets
Efficient enforcement of rights in:
Real property Tangible property Intangible property
Result: Lower interest rates Access to credit
Foreign and domestic investment Efficient markets
No enforcement of rights in:
Real property Tangible property Intangible property
Result: Limited collateral Moderately high interest rates
Limited access to credit Low foreign investment
No Property Rights
Score: 0-40
Property Rights are present, but not enforced
Score: 50-60
Property Rights are enforced, but the judicial
system is inefficient
Score: 70-80
Strong Property Rights and Effective Legal System
Score: 90-100

1616Proprietary & Confidential. © 2011, glendonTodd Capital LLC
Freedom from Corruption is a direct measure of a population’s perception of corruption in a country’s
governing body and an important factor in determining economic freedom Corruption is defined as “abuse of public power for private benefit”
National corruption causes heightened insecurity and uncertainty within economic relationships, decreasing public perception of the economy, and therefore driving down the economic freedom of the nation
Over the life of The Index (1995-2012), increased government regulation or activity in the economy is positively correlated with high levels of national corruption. Conversely, heightened transparency of the government is negatively correlated with high levels of national corruption
While the significance of the Freedom from Corruption score, as a factor in determining economic freedom, is apparent, the difficulty in obtaining reliable input data on Corruption must be addressed
Rule of Law: Freedom from Corruption
Sources: Heritage Foundation’s 2012 Index of Economic Freedom Methodology and Influence of Corruption on Economic Growth Rate and Foreign Investment by Podobnik, et. al
Rule of Law Limited Government Regulatory Efficiency Open Markets

1717Proprietary & Confidential. © 2011, glendonTodd Capital LLC
The Heritage Foundation utilizes data collected by Transparency International, the global organization leading
the fight against corruption, in calculating the Freedom from Corruption score in The Index
The CPI was first calculated by Transparency International in 1995 to expose and rank the countries of the
world based on their level of current corruption in order to promote transparency within governing bodies
The CPI measures the perception of a country’s overall corruption in 178 countries on a scale from 0-10, with
0 being the most corrupt and 10 being the least
Transparency International draws information from 17 different distributed surveys and assessments that
measure the overall opinions and specific experiences people have had related to bribery among government officials, embezzlement of public funds, and the existence and extent of national anti-corruption efforts
The following map depicts CPI variations in each continent (yellow—10; red—0):
Corruption Perceptions Index
Sources: Hardoon, Deborah. "Corruption Perceptions Index 2011: What’s in a number?” and "Corruptions Perceptions Index 2011.” by Transparency International
Rule of Law Limited Government Regulatory Efficiency Open Markets

1818Proprietary & Confidential. © 2011, glendonTodd Capital LLC
“Cases of corruption, that we know or have evidence of, make up just a fraction of the full extent of corruption
across society” –Deborah Hardoon
Although corruption is a key factor in a country’s overall economic freedom, it is difficult to measure due to the high level of concealment of data regarding national corruption
Because of corruption’s hidden nature, our ability to obtain information regarding its scale depends on three factors: Freedom of information
Quality of anti-corruption legislation Effectiveness of the laws and institutions holding guilty parties accountable
It is crucial to the accuracy of The Index that researchers obtain these perceptions from a large distribution of surveys and reliable sources
The CPI is used as the data for Freedom from Corruptions scores for 178 of the 184 countries included in The Index Multiply CPI by 10 to get the score used in calculating The Index
Freedom from Corruption: Scoring
Sources: Hardoon, Deborah. "Corruption Perceptions Index 2011: What’s in a number?”
Rule of Law Limited Government Regulatory Efficiency Open Markets

1919Proprietary & Confidential. © 2011, glendonTodd Capital LLC
CPI’s method of ranking and measuring corruption based on perceptions is heavily disputed, raising questions
regarding its accuracy and validity
Studies comparing past perceptions of corruption to actual, exposed corruption supports the validity of the
CPI For example, when compared to the number of families in 86 countries who had admittedly paid a bribe
for public services, the trend line (below) displayed a strong negative correlation between the CPI and the
percentage of households paying bribes
*Source: “Corruptions Perceptions Index 2011: What’s in a number?” 1
Freedom from Corruption: Scoring Concerns
Sources: Hardoon, Deborah. "Corruption Perceptions Index 2011: What’s in a number?”; Heritage Foundation’s 2012 Index of Economic Freedom Methodology
Rule of Law Limited Government Regulatory Efficiency Open Markets

2020Proprietary & Confidential. © 2011, glendonTodd Capital LLC
Greater confidence in the
security of both the public and private sectors will result in increased private investment and
trade
Freedom from Corruption: Key Milestones and Economic Correlations
High levels of corruption
increase the cost of doing business, stifling investment and economic growth
There will be little or no foreign investment, which is key to developing nations
Anti-corruption laws expose and
reallocate the power structure, allowing the lower and middle classes to participate more freely in the economy
Accurate distributions of wealth among constituents will empower more individuals to participate freely in the
economy
A transparent and uncorrupt
country will attract foreign direct investments
Investors will have the
knowledge they need to make good investment decision
Sources: Influence of Corruption on Economic Growth Rate and Foreign Investment by Podobnik, et. al; 2Heritage Foundation’s 2012 Index of Economic Freedom Methodology
Rule of Law Limited Government Regulatory Efficiency Open Markets
No anti-corruption policies, bribery is rampant
Score: below 40
Anti-corruption laws are passed and enforced
Score: above 40
Government Transparency
Score: above 40
System of laws and regulations monitoring
governments and public companies
Score: above 60

2121Proprietary & Confidential. © 2011, glendonTodd Capital LLC
Rule of Law
•Property Rights•Description
•Scoring
•Milestones
•Freedom from Corruption
•Description•Scoring
•Milestones
Limited Government
•Fiscal Freedom•Description
•Scoring
•Milestones
•Government Spending
•Description•Scoring
•Milestones
Regulatory Efficiency
•Business Freedom•Description
•Scoring
•Milestones
•Labor Freedom
•Description•Scoring
•Milestones
•Monetary Freedom
•Description
•Scoring•Milestones
Open Markets
•Trade Freedom•Description
•Scoring
•Milestones
•Investment Freedom
•Description•Scoring
•Milestones
•Financial Freedom
•Description
•Scoring•Milestones

2222Proprietary & Confidential. © 2011, glendonTodd Capital LLC
The Index: Limited Government
The Limited Government category within The Index measures the size of government and the resulting burden
on the nation’s economy. It rewards those governments that place little burden on their citizens and interfere little with their lives while at the same time penalizing those that severely burden their citizens and constantly interfere in the market
There are two metrics within this category:1. Fiscal Freedom
2. Government Spending
Fiscal Freedom measures the tax burden within a country, placing equal emphasis on personal income taxes,
corporate income taxes, and the overall tax burden This factor gives high scores to governments with low taxes, and low scores to governments with high taxes
Government Spending measures the amount of government spending relative to GDP This factor gives low scores to governments that spend large amounts relative to their GDP, and high scores
to governments that spend small amounts relative to their GDP
Source: Index of Economic Freedom, Methodology
Rule of Law Limited Government Regulatory Efficiency Open Markets
2323Proprietary & Confidential. © 2011, glendonTodd Capital LLC
Limited Government: Fiscal Freedom
The Index calculates Fiscal Freedom in order to measure the burden the government places upon its citizens and
businesses through taxation. This value is important because taxation removes income from citizens and limits their ability to make economic decisions
Higher tax rates result in a lower score for Fiscal Freedom, moving the country from a free a more repressed economy
Tax rates indicate the percentage of income collected from individuals and business by the government. This is the percentage of income earned that citizens and companies are no longer free to use at their own discretion
Tax policies serve as either incentives or disincentives to individuals and businesses. Higher tax rates disincentivize the action being taxed, whether that be work, investment, or the buying of cigarettes
These tax policies induce individuals and businesses to invest differently than they would in an otherwise free market
Source: Heritage Foundation’s 2012 Index of Economic Freedom, Methodology
Rule of Law Limited Government Regulatory Efficiency Open Markets

2424Proprietary & Confidential. © 2011, glendonTodd Capital LLC
There are three factors in the Fiscal Freedom calculation:
1. The top income tax rate2. The top corporate tax rate3. The overall tax burden as a percentage of GDP
— This is the total amount of tax revenue collected by the government
The following quadratic model is used to determine Fiscal Freedom:
Factori represents the value for each of the three factors α is a coefficient set to 0.03 to account for variation
Fiscal Freedomi is the Fiscal Freedom score for each factor i (FFi) The factor value is squared, making the function quadratic, to reflect the “diminishing revenue returns
from very high rates of taxation”
These three values for Fiscal Freedomi are then averaged together to obtain the final Fiscal Freedom score by using the following formula:
Fiscal Freedom: Scoring
Source: Heritage Foundation’s 2012 Index of Economic Freedom, Methodology
3
321 FFFFFFFreedom Fiscal
2100 ii factorFreedom Fiscal
Rule of Law Limited Government Regulatory Efficiency Open Markets

2525Proprietary & Confidential. © 2011, glendonTodd Capital LLC
Fiscal Freedom: Key Milestones and Economic Correlations
High levels of individual taxation
decrease incentives for individuals to work, lowering productivity and economic output
High corporate tax rates put that country’s corporations at a competitive disadvantage compared to their foreign
competitors and disincentivize foreign companies to enter the country
Lower corporate tax rates relative to
similarly positioned countries will increase the attractiveness and competitive advantage of a nation
Progressive tax codes create a disincentive for individuals to earn the next dollar when they are close to the
next bracket, therefore decreasing output in the economy
Low levels of taxation lead to an
efficient economy in which individuals and companies can take on profitable projects, spurring economic growth
Increased employment levels, increased saving and increased investment
A broader tax base creates a more
efficient economy in which only projects that truly add value are taken on, as distortions in incentives are
removed from the tax code Confidence in future tax policy allows
individuals and businesses to make
informed decisions and serves to stabilize the economy
Source: Heritage Foundation’s 2012 Index of Economic Freedom, Methodology; American Economic Journal, The Effect of Corpora te Taxes on Investment and Entrepreneurship; Rizzi and Sallet,
“Corporate Tax Reform and Innovation”; Shultz, Boskin, Cogan and Taylor “Principals for Economic Revival”; Rivlin, Testimony before the Senate Finance Committee
Rule of Law Limited Government Regulatory Efficiency Open Markets
High levels of taxation in all areas
Score: below 60
Moderate and progressive tax codes
Score: 60-75
Moderate tax rates, but broad bases
Score: 75-90
Very low levels of taxation on all levels
Score: above 90
2626Proprietary & Confidential. © 2011, glendonTodd Capital LLC
Excessive levels of government spending lead to immense public debts that severely limit the freedom of
countries’ economies unless that country’s economy is severely repressed
Studies show negative correlations between total government expenditures and economic growth
According to Fölster and Henrekson’s study of a sample of wealthy nations from 1970-1995, there is a strong negative correlation between total government expenditures and economic growth, as well as a less robust negative correlation between total tax revenue and economic growth
While there is no ideal level of government expenditure, it is evident that high government spending decreases the rate of economic growth and the level of economic freedom
For repressed nations, government spending stimulates the economy by providing public goods such as infrastructure and national defense. However, at a certain point, government spending decreases economic freedom by driving up public debt and crowding out private sector investment
The inverse relationship between government spending and economic freedom is contrary to the policies of many governments, including the United States, and the beliefs of many people in our world today
Government Spending is included as a factor in The Index in order to account for this observed negative correlation
Limited Government: Government Spending
Sources: Heritage Foundation’s 2012 Index of Economic Freedom Methodology and Government Size and Growth by Bergh & Karlsson
Rule of Law Limited Government Regulatory Efficiency Open Markets
2727Proprietary & Confidential. © 2011, glendonTodd Capital LLC
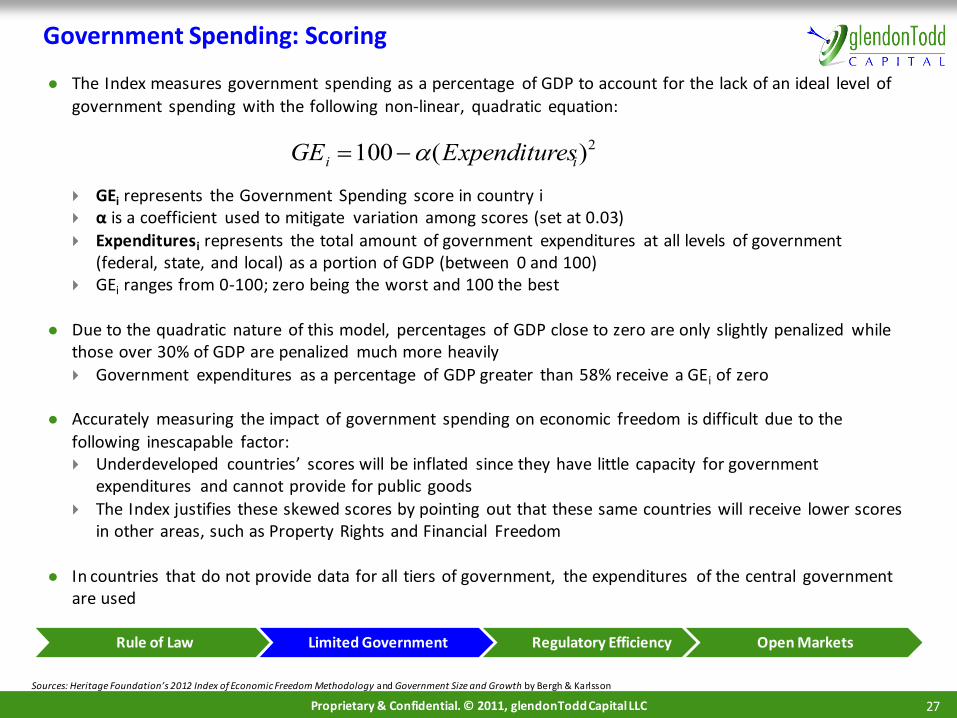
The Index measures government spending as a percentage of GDP to account for the lack of an ideal level of
government spending with the following non-linear, quadratic equation:
GEi represents the Government Spending score in country i α is a coefficient used to mitigate variation among scores (set at 0.03)
Expendituresi represents the total amount of government expenditures at all levels of government (federal, state, and local) as a portion of GDP (between 0 and 100)
GEi ranges from 0-100; zero being the worst and 100 the best
Due to the quadratic nature of this model, percentages of GDP close to zero are only slightly penalized while those over 30% of GDP are penalized much more heavily
Government expenditures as a percentage of GDP greater than 58% receive a GEi of zero
Accurately measuring the impact of government spending on economic freedom is difficult due to the
following inescapable factor: Underdeveloped countries’ scores will be inflated since they have little capacity for government
expenditures and cannot provide for public goods
The Index justifies these skewed scores by pointing out that these same countries will receive lower scores in other areas, such as Property Rights and Financial Freedom
In countries that do not provide data for all tiers of government, the expenditures of the central government are used
Government Spending: Scoring
Sources: Heritage Foundation’s 2012 Index of Economic Freedom Methodology and Government Size and Growth by Bergh & Karlsson
GEi 100(Expendituresi)2
Rule of Law Limited Government Regulatory Efficiency Open Markets

2828Proprietary & Confidential. © 2011, glendonTodd Capital LLC
Government Spending: Key Milestones and Economic Correlations
Severely repressed countries have low
government spending. However, this lack of government spending hurts economic growth because the country does not
have the mechanisms in place to foster investment
Foreign investment will be low or non-
existent as foreign investors will look for stable countries to invest in
Countries are saddled with large liabilities
that necessarily result in high levels of taxation, leading to decreased investment and slowed growth
Government-controlled economies also have high levels of government spending, resulting in low investment and restricted access to
capital High levels of unemployment are present, as
investment and expansion is stifled
Low government spending allows the
private sector to function efficiently, allocating resources appropriately, and spurring investment and economic
growth Low levels of unemployment
Government spending hinders economic
growth as it crowds out private investment, reducing new capital formation, and causing interest rates to
rise, but the effect is not as pronounced Increased ability of companies to invest
leads to lower levels of unemployment
Sources: Heritage Foundation’s 2012 Index of Economic Freedom Methodology and Does Government Spending Create Economic Growth? By Antony Davies
Rule of Law Limited Government Regulatory Efficiency Open Markets
Government spending is too low to provide for a
functioning governmentScore: above 90 and a total
rank of over 100
Over 45% of GDP is comprised of government spending:
Score: Below 40
Moderate levels of government spending
Score: 40-80
Little government spending
Score: 80 -100

2929Proprietary & Confidential. © 2011, glendonTodd Capital LLC
Rule of Law
•Property Rights•Description
•Scoring
•Milestones
•Freedom from Corruption
•Description•Scoring
•Milestones
Limited Government
•Fiscal Freedom•Description
•Scoring
•Milestones
•Government Spending
•Description•Scoring
•Milestones
Regulatory Efficiency
•Business Freedom•Description
•Scoring
•Milestones
•Labor Freedom
•Description•Scoring
•Milestones
•Monetary Freedom
•Description
•Scoring•Milestones
Open Markets
•Trade Freedom•Description
•Scoring
•Milestones
•Investment Freedom
•Description•Scoring
•Milestones
•Financial Freedom
•Description
•Scoring•Milestones

3030Proprietary & Confidential. © 2011, glendonTodd Capital LLC
The Index: Regulatory Efficiency
The Regulatory Efficiency category measures the burden and efficiency of regulation on a country’s economy by
evaluating the amount of regulation and the effects that result
There are three metrics within this category:
1. Business Freedom2. Labor Freedom3. Monetary Freedom
Business Freedom measures the burden and efficiency of government regulation on starting, operating, and closing a business
This factor includes ten individual factors covering the entire scope of the ease of doing business
Labor Freedom determines the regulatory burden on the labor force
This factor includes six factors that include both employee and employer freedoms
Monetary Freedom measures the stability of prices and the presence and level of price controls
This factor includes inflation metrics and price control penalties
Together, these three measures determine the regulatory burden on all components of the market
Source: Index of Economic Freedom, Methodology
Rule of Law Regulatory EfficiencyLimited Government Open Markets

3131Proprietary & Confidential. © 2011, glendonTodd Capital LLC
The Index calculates Business Freedom in order to measure the ease of starting and operating a
business in each nation
This metric measures the regulatory burden placed upon existing businesses, reflecting the ease of
continuing to do business, and therefore, the businesses’ ability to operate and expand
It measures how easily an individual can close a business, and the cost incurred in doing so
This factor scores based on the amount of regulation that exists and the efficiency of that regulationby not only punishing the existence of regulation, but also measuring the amount and costs (in time
and money) incurred
Business Freedom is important because it measures the ease with which entrepreneurial activity can
occur in a country, a major impetus for economic growth
This measure is an attempt to determine the ability of individuals to start, operate, and close a
business, and through that measure, gain insight into the government regulation in a country
Regulatory Efficiency: Business Freedom
Source: Heritage Foundation’s 2012 Index of Economic Freedom, Methodology
Rule of Law Regulatory EfficiencyLimited Government Open Markets

3232Proprietary & Confidential. © 2011, glendonTodd Capital LLC
1. Number of procedures required to start a business2. Number of days it takes to start a business3. Cost to start a business (percentage of income per
capita)4. Minimum capital needed to start a business
(percentage of income per capita)5. Number of procedures to obtain a license
6. Number of days to obtain a license7. Cost to obtain a license (percentage of income per
capita)8. Number of years to close a business9. Cost to close a business (percentage of estate)10. Recovery rate from closing a business (cents on
the dollar)
Business Freedom: Scoring
The following ten factors are included in the Business Freedom score, each rated on a scale from 0 to 100, with
100 being the most free:
These scores are combined into the following model to determine the final factor score for each value:
Factori is the initial rating which the nation received for the factor on a scale of 0 to 100 Factoraverage is the average of all initial ratings for the factor for the year
The average, initial score is divided by the initial factor score for the nation and multiplied by 50 to compute the final Factor Scorei. This is done for each factor i
These ten values for Factor Scorei are then averaged together to obtain the final Business Freedom score by using the following formula:
Source: Heritage Foundation’s 2012 Index of Economic Freedom, Methodology
Factor Scorei 50 Factoraverage
Factori
Rule of Law Regulatory EfficiencyLimited Government Open Markets
10
10987654 FSFSFSFSFSFSFSFSFSFSFreedom Business 321

3333Proprietary & Confidential. © 2011, glendonTodd Capital LLC
Business Freedom: Key Milestones and Economic Correlations
Bottom Quartile in Starting a BusinessLower costs and greater access to
resources (median scores)Top Quartile in Starting a Business
Bottom Quartile in LicensingProperty rights protected (median
scores)Top Quartile in Licensing
Bottom Quartile in Resolving Insolvency
Established laws protecting creditors (median scores)
Top Quartile in Resolving Insolvency
High barriers to entry limit
investment in new businesses and push more business into the informal sector
High regulations increase costs, decreasing investment in otherwise profitable projects
High exit costs lead companies in business to stay in business even when not profitable
Individuals can start businesses
quickly and easily, encouraging investment and innovation leading to economic growth
Lower costs of doing business allow for more efficient allocation of assets
Higher recovery rates reduce the barriers to exit
As economies develop, they make
access to necessary resources such as electricity available, lowering the cost of starting and doing
business, therefore enabling more business growth
Increases in property rights and
protection of creditors allow for access to credit and increasing foreign and domestic investment
Source: Doing Business 2012 by The World Bank Group
Rule of Law Regulatory EfficiencyLimited Government Open Markets
Ease of Starting a Business
Dealing with Licensing
Resolving Insolvency
3434Proprietary & Confidential. © 2011, glendonTodd Capital LLC
Regulatory Efficiency: Labor Freedom
The Labor Freedom factor of The Index is included to measure elements of the labor market such as “the hiring
and redundancy of workers and the rigidity of working hours“ and their impacts on economic growth
The labor market is no different from the market for goods; free and voluntary exchange is key
The legal and regulatory aspects of a nation that impact the freedom in the labor market include: Minimum wage
Laws inhibiting layoffs Severance requirements Unions
Regulatory burdens on hiring/hours/etc.
Labor laws restrict labor freedom by reducing employees’ and employers’ abilities to bargain their own terms of
employment For example, labor unions, which originally formed to enhance working conditions, protect workers, and
ultimately increase freedom in the labor market, are now using their power to dictate collective bargaining
conditions to employees
Productivity is enhanced not only by individuals’ abilities to work when and where they want, but also by
employers’ ability to contract and dismiss workers as they are needed
Source: Heritage Foundation’s 2012 Index of Economic Freedom, Ch. 1 and Methodology and Unions, Economic Freedom, and Growth
Rule of Law Regulatory EfficiencyLimited Government Open Markets

3535Proprietary & Confidential. © 2011, glendonTodd Capital LLC
Labor Freedom: Scoring
The Labor Freedom score is measured according to six quantitative factors:
Each score is converted to a scale of 10 based on the following equation:
— Factori is the data from country i from each of the six factors— Factoraverage is the relative world average of the respective factor being measured
— Each ratio is then multiplied by 50
These six values for Factor Scorei are then averaged together to obtain the final Labor Freedom score by using the
following formula:
The data for these factors is drawn from The World Bank’s Doing Business 2012 report These six factors are not grouped in Doing Business 2012, but The Index analyzes their data in this way
For the eight countries not included in the Doing Business 2012 report, data regarding labor market flexibility is drawn from other reliable and internationally recognized sources
Source: Heritage Foundation’s 2012 Index of Economic Freedom, Ch. 1 and Methodologyand Unions, Economic Freedom, and Growth
Factor Scorei 50 Factoraverage
Factori
6
654 FSFSFSFSFSFSFreedom Labor 321
Rule of Law Regulatory EfficiencyLimited Government Open Markets
1. Ratio of minimum wage to the
average value added per worker2. Hindrance to hiring additional workers3. Rigidity of hours
4. Difficulty of firing redundant
employees5. Legally mandated notice period6. Mandatory severance pay
3636Proprietary & Confidential. © 2011, glendonTodd Capital LLC
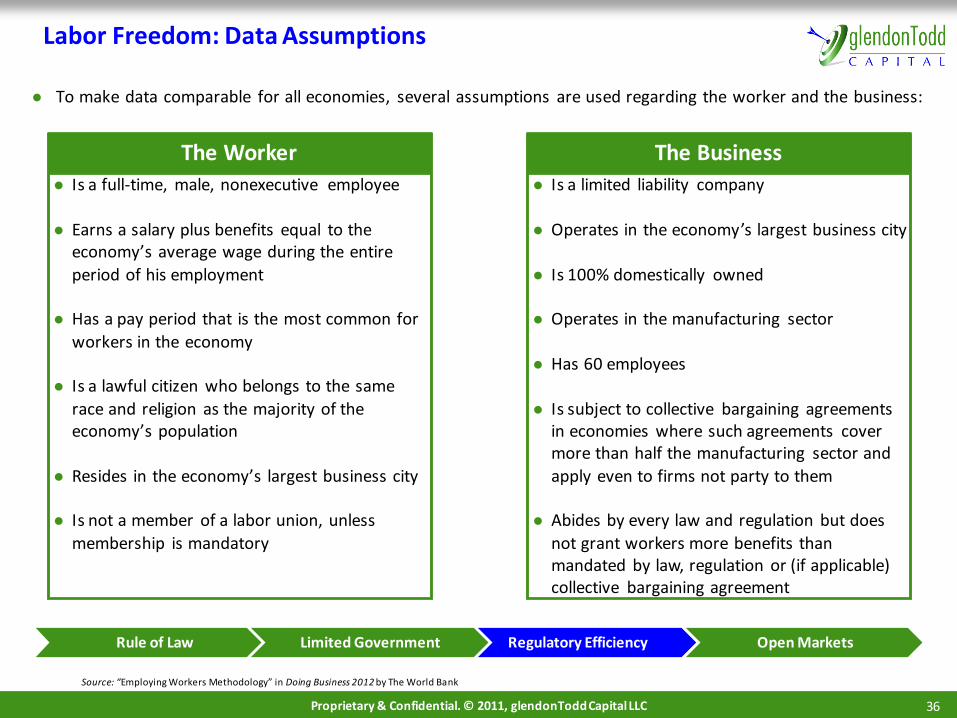
Labor Freedom: Data Assumptions
To make data comparable for all economies, several assumptions are used regarding the worker and the business:
Source: “Employing Workers Methodology” in Doing Business 2012 by The World Bank
Is a full-time, male, nonexecutive employee
Earns a salary plus benefits equal to the economy’s average wage during the entire
period of his employment
Has a pay period that is the most common for
workers in the economy
Is a lawful citizen who belongs to the same
race and religion as the majority of the economy’s population
Resides in the economy’s largest business city
Is not a member of a labor union, unless
membership is mandatory
The Worker
Is a limited liability company
Operates in the economy’s largest business city
Is 100% domestically owned
Operates in the manufacturing sector
Has 60 employees
Is subject to collective bargaining agreements in economies where such agreements cover more than half the manufacturing sector and
apply even to firms not party to them
Abides by every law and regulation but does
not grant workers more benefits than mandated by law, regulation or (if applicable) collective bargaining agreement
The Business
Rule of Law Regulatory EfficiencyLimited Government Open Markets
3737Proprietary & Confidential. © 2011, glendonTodd Capital LLC
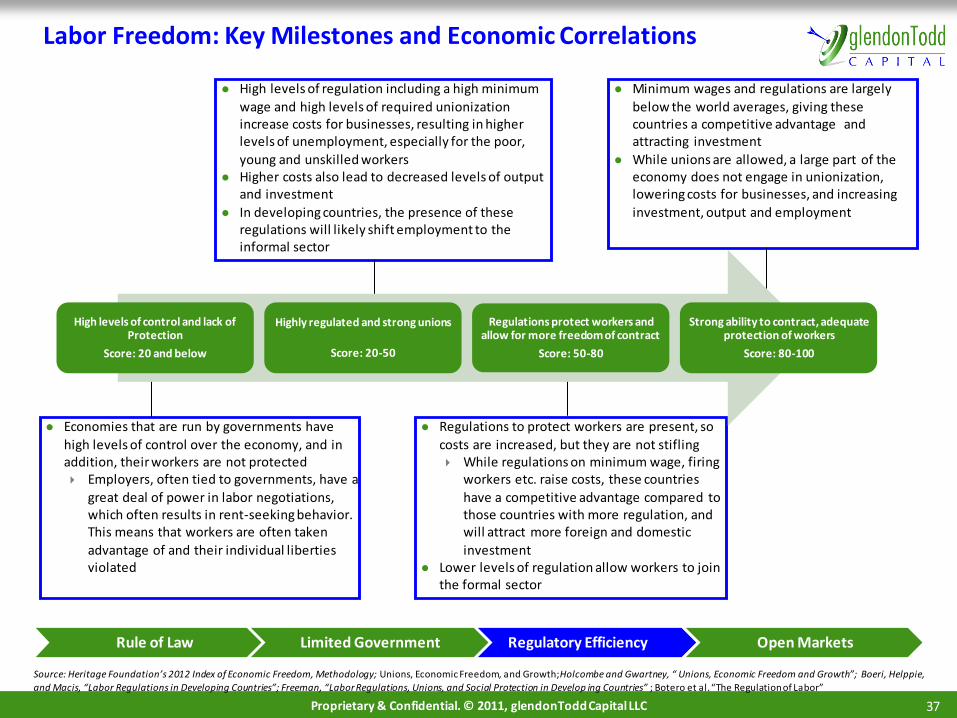
Labor Freedom: Key Milestones and Economic Correlations
Economies that are run by governments have
high levels of control over the economy, and in addition, their workers are not protected Employers, often tied to governments, have a
great deal of power in labor negotiations, which often results in rent-seeking behavior. This means that workers are often taken
advantage of and their individual liberties violated
High levels of regulation including a high minimum
wage and high levels of required unionization increase costs for businesses, resulting in higher levels of unemployment, especially for the poor,
young and unskilled workers Higher costs also lead to decreased levels of output
and investment
In developing countries, the presence of these regulations will likely shift employment to the informal sector
Regulations to protect workers are present, so
costs are increased, but they are not stifling While regulations on minimum wage, firing
workers etc. raise costs, these countries
have a competitive advantage compared to those countries with more regulation, and will attract more foreign and domestic
investment Lower levels of regulation allow workers to join
the formal sector
Minimum wages and regulations are largely
below the world averages, giving these countries a competitive advantage and attracting investment
While unions are allowed, a large part of the economy does not engage in unionization, lowering costs for businesses, and increasing
investment, output and employment
Source: Heritage Foundation’s 2012 Index of Economic Freedom, Methodology; Unions, Economic Freedom, and Growth; Holcombe and Gwartney, “ Unions, Economic Freedom and Growth”; Boeri, Helppie,
and Macis, “Labor Regulations in Developing Countries”; Freeman, “Labor Regulations, Unions, and Social Protection in Develop ing Countries” ; Botero et al. “The Regulation of Labor”
Rule of Law Regulatory EfficiencyLimited Government Open Markets
High levels of control and lack of Protection
Score: 20 and below
Highly regulated and strong unions
Score: 20-50
Regulations protect workers and allow for more freedom of contract
Score: 50-80
Strong ability to contract, adequate protection of workers
Score: 80-100

3838Proprietary & Confidential. © 2011, glendonTodd Capital LLC
Monetary Freedom measures both price stability with an assessment of price controls
Price controls distort the allocation of resources in a nation by creating shortages in the presence of price ceilings and surpluses in the presence of price floors
The inability of the price system to ration the available supply leads to one or more of the following: queues, quality deterioration of goods, tie-in sales, black-markets, or rationing
Price stability without government regulation or intervention is the ideal state for a free market and is a key factor in creating economic freedom
Regulatory Efficiency: Monetary Freedom
Sources: Price Controls in The Concise Encyclopedia of Economics and Heritage Foundation’s 2012 Index of Economic Freedom Methodology
Rule of Law Regulatory EfficiencyLimited Government Open Markets

3939Proprietary & Confidential. © 2011, glendonTodd Capital LLC
The monetary freedom score is based on two factors:
1. Price Stability: The weighted average inflation rate for the most recent three years2. Price controls
The Weighted Average Inflation rate (WAI) is calculated with the following equation:
θ1 through θ3 represent the three weights for the inflation in the past three years— The values sum to one and are 0.665, 0.245, and 0.090, respectively
Inflationit is the absolute value of the annual inflation rate in country i during year t as measured by the
consumer price index
This WAI value is then used in the following equation to calculate Monetary Freedom:
α represents the coefficient that stabilizes the variance of scores
— The value of α is set to equal 6.333, which converts a 10% inflation rate into a score of 80.0 and a 2% inflation rate into a score of 91.0
Price Control (PC) penalty is a value ranging from 0–20 based on the level of price controls in the country
The convex square-root function was chosen to create separation among countries with low inflation rates A concave function would treat all hyperinflations as equally bad, no matter if it were 100 or 1,000 percent
price increases per year, while the square-root function is much more gradual
Monetary Freedom: Scoring
Sources: Heritage Foundation’s 2012 Index of Economic Freedom Methodology
2321 -it1-ititit InflationInflationInflationWAI
iii penalty PCWAIFreedomMonetary 100
Rule of Law Regulatory EfficiencyLimited Government Open Markets

4040Proprietary & Confidential. © 2011, glendonTodd Capital LLC
Monetary Freedom: Key Milestones and Economic Correlations
With the central bank closely tied to the
government, it will have little credibility A lack of credibility can lead to high inflation
and unrealistically low unemployment. This
unrealistically low unemployment will eventually have to be corrected, often resulting in recession
Limited investment due to high inflation expectations
Low foreign investment
Strong and stable monetary policy gives
investors confidence in future outcomes, allowing them to invest in profitable projects and allocate their
resources effectively
Sources: Inflation: Inflation And Investments at investopedia.com and Monetary stability and economic growth or: Why stable prices are good for private enterprise in France and the Netherlands by European
Central Bank; Andres and Hernando, “Does inflation harm economic growth? Evidence for the OECD”; Blinder, “Central Bank Credibility: Why do we care? How do we build it?”
Rule of Law Regulatory EfficiencyLimited Government Open Markets
A central bank that is not influenced by
the politics of the country will gain credibility and control inflation
Low and stable levels of inflation
provide certainty to the market, fostering domestic and foreign investment
Price controls cause shortages and
surpluses resulting from prices not being allowed to adjust to meet demand
Central banking system is closely tied to the government
Score: below 40
Price Controls
Score: 40-60
Price Stability
Score: 60-80
Credible central bank and little monetary regulation
Score: Above 80

4141Proprietary & Confidential. © 2011, glendonTodd Capital LLC
Rule of Law
•Property Rights•Description
•Scoring
•Milestones
•Freedom from Corruption
•Description•Scoring
•Milestones
Limited Government
•Fiscal Freedom•Description
•Scoring
•Milestones
•Government Spending
•Description•Scoring
•Milestones
Regulatory Efficiency
•Business Freedom•Description
•Scoring
•Milestones
•Labor Freedom
•Description•Scoring
•Milestones
•Monetary Freedom
•Description
•Scoring•Milestones
Open Markets
•Trade Freedom•Description
•Scoring
•Milestones
•Investment Freedom
•Description•Scoring
•Milestones
•Financial Freedom
•Description
•Scoring•Milestones`
4242Proprietary & Confidential. © 2011, glendonTodd Capital LLC
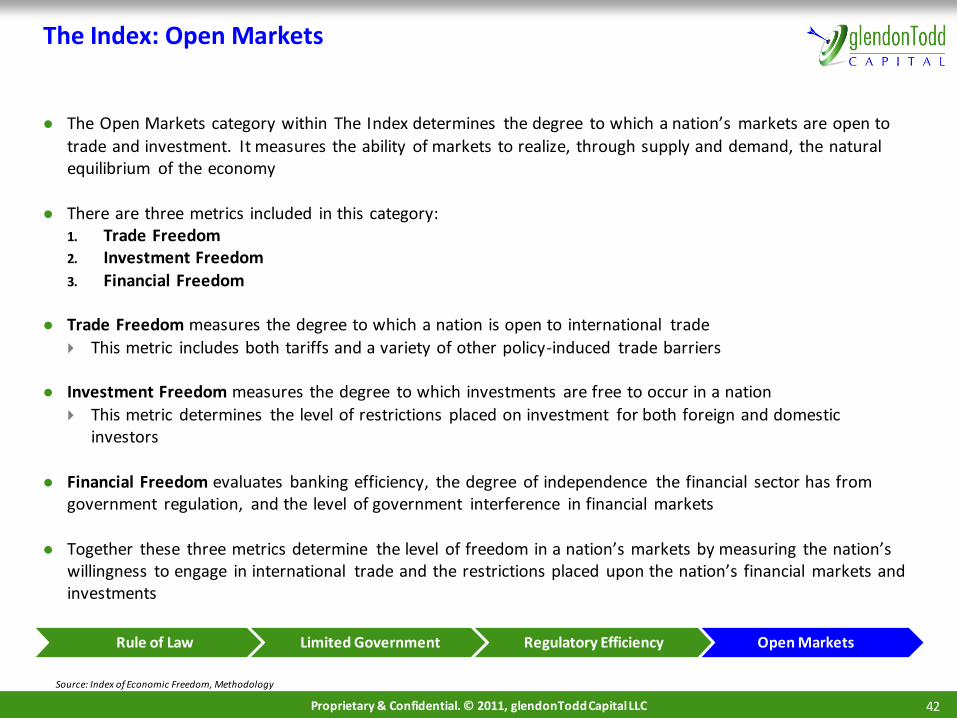
The Index: Open Markets
The Open Markets category within The Index determines the degree to which a nation’s markets are open to
trade and investment. It measures the ability of markets to realize, through supply and demand, the natural equilibrium of the economy
There are three metrics included in this category:1. Trade Freedom2. Investment Freedom
3. Financial Freedom
Trade Freedom measures the degree to which a nation is open to international trade
This metric includes both tariffs and a variety of other policy-induced trade barriers
Investment Freedom measures the degree to which investments are free to occur in a nation
This metric determines the level of restrictions placed on investment for both foreign and domestic investors
Financial Freedom evaluates banking efficiency, the degree of independence the financial sector has from government regulation, and the level of government interference in financial markets
Together these three metrics determine the level of freedom in a nation’s markets by measuring the nation’s willingness to engage in international trade and the restrictions placed upon the nation’s financial markets and investments
Source: Index of Economic Freedom, Methodology
Rule of Law Open MarketsLimited Government Regulatory Efficiency

4343Proprietary & Confidential. © 2011, glendonTodd Capital LLC
Open Markets: Trade Freedom
The Trade Freedom metric is a measure of the degree to which a nation allows or impedes international trade
Government impede international trade through the imposition of tariffs or other Non-Tariff Barriers (“NTBs”) Tariffs restrict the import and export of goods and services between nations
NTBs include various ways in which the government implements policies to stop international trade without directly levying a tax
The Index measures six broad categories of NTBs:1. Price Restrictions2. Regulatory Restrictions
3. Quantity Restrictions4. Investment Restrictions5. Customs Restrictions
6. Direct Government Intervention
Descriptions of each category of NTB, provided by the Heritage Foundation, are included in the appendix
Source: Heritage Foundation’s 2012 Index of Economic Freedom, Methodology
Rule of Law Open MarketsLimited Government Regulatory Efficiency

4444Proprietary & Confidential. © 2011, glendonTodd Capital LLC
The initial Tariff Score is calculated using the following equation:
1. Tariffmax is the maximum tariff a country levies (tariff upper bound)2. Tariffmin is the minimum tariff a country levies (tariff lower bound)3. Tariffaverage is the trade-weighted average tariff rate
— This is the ratio of total tariff revenue over the total value of imports— If the Tariffaverage was not available, the average tariff rate or the Most Favored Nation (“MFN”)
average tariff rate was used
NTBs can result in deductions of 0, 5, 10, 15, or 20 points from the score based upon the following scale:
To calculate the total score for Trade Freedom, the Tariff Score and NTB penalty are combined in the
final equation:
Trade Freedom: Scoring
Source: Heritage Foundation’s 2012 Index of Economic Freedom, Methodology
100
minmax
averagemax
TariffTariff
TariffTariffScoreTariff
Rule of Law Open MarketsLimited Government Regulatory Efficiency
Trade FreedomTariff ScoreNTB penalty

4545Proprietary & Confidential. © 2011, glendonTodd Capital LLC
Trade Freedom: Key Milestones and Economic Correlations
Protectionist measures hurt
economies because they support inefficient industries, increasing costs and decreasing investment and
economic output
Inefficient industries are forced out of
business causing realignment of economies to more efficient production measures
Countries focus on the industries in which they excel, thus increasing output and trade
Active globalization policies seen in
these countries, promote trade further stimulate the economy through encouraging the free-flow of
information, goods, and services
The world economy as a whole benefits
from such policies, as each country uses its comparative advantage, making the country and all other countries
participating in trade better off
Source: Heritage Foundation’s 2012 Index of Economic Freedom, Methodology; OECD, Protectionism: The Case Against; The World Trade Organization, “10 benefits of the WTO trading system”
Rule of Law Open MarketsLimited Government Regulatory Efficiency
High Tariffs and NTBs (above 12%)
Score: Below 60
Moderate Tariffs (7-12%) and some NTBs
Score: 60-75
Low Tariffs (2-6%) and few NTBs
Score: 75-85
Low Tariffs (below 2%) and few NTBs
Score: above 85

4646Proprietary & Confidential. © 2011, glendonTodd Capital LLC
Open Markets: Investment Freedom
The Investment Freedom metric measures the degree to which investment capital can flow unimpeded throughout a nation and across borders by evaluating the laws and the extent to which these laws impede investment
Nations inhibit investment with rules and regulations on foreign investment, domestic investment, foreign exchange, payments, transfers, and capital transactions
Investment control measures are implemented by the government to restrict foreign investment, protect industries, and restrict the scope of domestic investments
Labor regulations, corruption, “red tape,” weak infrastructure, political conditions, and national security conditions can also affect the freedom of investors
The majority of the metric is based upon the rules and regulations concerning investment that a nation has in place, but in addition, The Index looks at indirect factors that influence investment, even though not implemented by the government
Source: Heritage Foundation’s 2012 Index of Economic Freedom, Methodology
Rule of Law Open MarketsLimited Government Regulatory Efficiency

4747Proprietary & Confidential. © 2011, glendonTodd Capital LLC
The Investment Freedom score covers seven categories that measure the degree to which a nation’s laws
and regulations restrict investment and the movement of capital:
1. National Treatment of Foreign Investment: Rules for foreign investors based upon their nationality
2. Foreign Investment Code: Rules determining the manner of foreign investment3. Restrictions on Land Ownership: Rules determining property purchases for foreigners and residents4. Sectoral Investment Restrictions: Regulations preventing foreign investment in certain industries
5. Expropriation of Investments Without Fair Compensation: Government seizure of investments 6. Foreign Exchange Controls: Regulations meant to restrict the purchase and sale of foreign currencies7. Capital Controls: Variety of regulations to regulate the capital account of a nation, namely to restrict
capital from leaving the country
The metric also includes General Penalties, a more broad category, that covers security problems, lack of
basic investment infrastructure, and other government policies that limit investment freedom indirectly
Each country’s score starts at 100 and is then deducted according to the degree to which it restricts
investment in each of the seven categories
Each category has different criteria for restricting points that are specified on the following slides; different
levels of points may be deducted in each category
Investment Freedom: Scoring
Source: Heritage Foundation’s 2012 Index of Economic Freedom, Methodology
Rule of Law Open MarketsLimited Government Regulatory Efficiency
4848Proprietary & Confidential. © 2011, glendonTodd Capital LLC
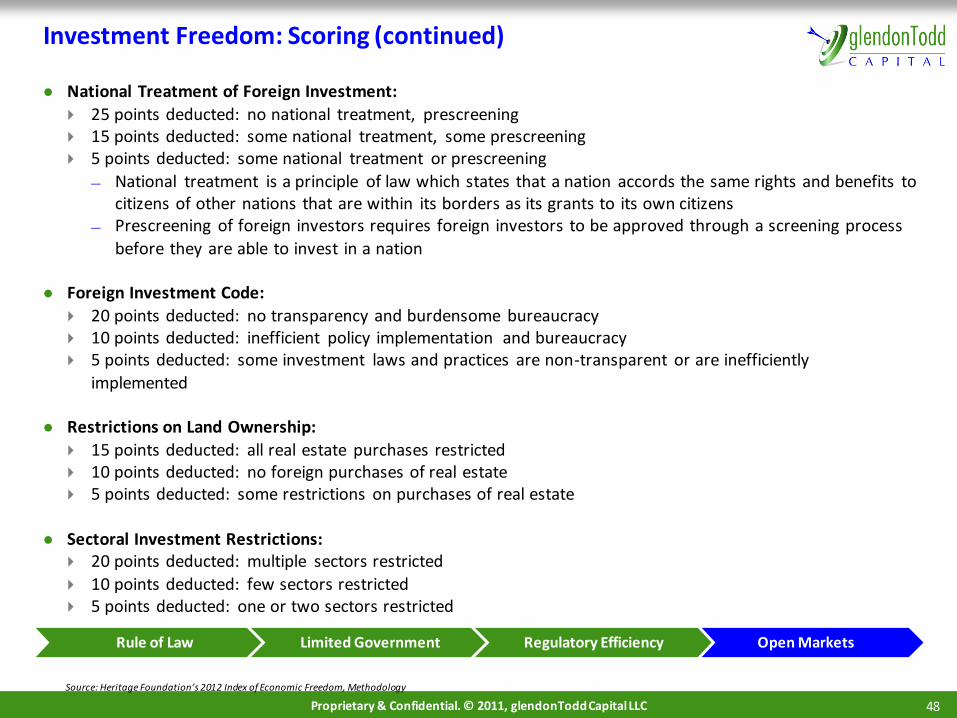
Investment Freedom: Scoring (continued)
National Treatment of Foreign Investment:
25 points deducted: no national treatment, prescreening 15 points deducted: some national treatment, some prescreening 5 points deducted: some national treatment or prescreening
— National treatment is a principle of law which states that a nation accords the same rights and benefits to citizens of other nations that are within its borders as its grants to its own citizens
— Prescreening of foreign investors requires foreign investors to be approved through a screening process
before they are able to invest in a nation
Foreign Investment Code:
20 points deducted: no transparency and burdensome bureaucracy 10 points deducted: inefficient policy implementation and bureaucracy 5 points deducted: some investment laws and practices are non-transparent or are inefficiently
implemented
Restrictions on Land Ownership:
15 points deducted: all real estate purchases restricted 10 points deducted: no foreign purchases of real estate 5 points deducted: some restrictions on purchases of real estate
Sectoral Investment Restrictions: 20 points deducted: multiple sectors restricted
10 points deducted: few sectors restricted 5 points deducted: one or two sectors restricted
Source: Heritage Foundation’s 2012 Index of Economic Freedom, Methodology
Rule of Law Open MarketsLimited Government Regulatory Efficiency

4949Proprietary & Confidential. © 2011, glendonTodd Capital LLC
Investment Freedom: Scoring (continued)
Expropriation of Investments Without Fair Compensation
25 points deducted: common with no legal recourse 15 points deducted: common with some legal recourse 5 points deducted: uncommon but occurs
Foreign Exchange Controls 25 points deducted: no access by foreigners or residents
15 points deducted: access available but heavily restricted 5 points deducted: access available with few restrictions
Capital Controls 25 points deducted: no repatriation of profits; all transactions require government approval 15 points deducted: inward and outward capital movements require approval and face some restrictions
5 points deducted: most transfers approved with some restrictions
General Penalties
Up to 20 points deducted due to:— Security problems— Lack of basic investment infrastructures
— Government policies that indirectly burden the investment process and limit investment freedom
With these deductions, the Investment Freedom score is tabulated
Source: Heritage Foundation’s 2012 Index of Economic Freedom, Methodology
Rule of Law Open MarketsLimited Government Regulatory Efficiency

5050Proprietary & Confidential. © 2011, glendonTodd Capital LLC
Investment Freedom: Key Milestones and Economic Correlations
Investment is key to economic growth,
and without the necessary infrastructure, investors will not invest their capital
High levels of restriction on investment
keep individuals and companies from using their resources efficiently and in ways that promote growth
Less regulation of foreign investment
draws greater foreign investment capital, spurring economic growth. The lack of basic infrastructure in these countries,
however, still deters foreign and domestic investment and inhibits economic growth
Allowing capital to flow freely in
and out of the country allows individuals to invest where they believe they will receive the
highest returns
Strong infrastructure leads to confidence in the
financial system and greater access to capital for individuals and businesses, therefore fostering investment
Increased foreign investment, as regulations decrease and infrastructure improves
Deregulation of investment in certain sectors,
reduces barriers to entry and encourages a more efficient allocation of assets
Source: Heritage Foundation’s 2012 Index of Economic Freedom, Methodology ; Center for Global Development, Foreign Investment and Economic Development: Evidence from Private Firms in East
Africa; Foreign Investment: A Big Boost for Small Business; Alesina, Ardagna, Nicoletti, Schiantarelli, “Regulation and Inves tment”
Rule of Law Open MarketsLimited Government Regulatory Efficiency
High amounts of regulation in all areas measured and
lack of infrastructure
Score: below 30
Lack of infrastructure, but less regulation
Score: 30-60
Strong infrastructure, but continued regulation of
foreign investments
Score 60-80
Strong infrastructure and low regulation
Score: above 80

5151Proprietary & Confidential. © 2011, glendonTodd Capital LLC
Financial Freedom is a measure of banking efficiency and government control & interference in the financial
sector
Government ownership of banks, insurers, or capital markets reduces competition and lowers available
services from such financial institutions
The ideal banking and financing environment in a nation would:
Minimize the level of government interference Allocate credit on market terms Prohibit government ownership of financial institutions
Allow financial institutions to provide various financial services to individuals and companies more freely Allow banks to conduct operations in foreign currencies Treat foreign institutions as if they were domestic institutions
Financial Freedom measures the feasibility and access to financing opportunities in the private sector of the economy based on the following five areas:
1. The extent of government regulation of financial services2. The degree of state intervention in banks and financial firms through ownership
3. The extent of financial and capital market development4. Government influence on the allocation of credit5. Openness to foreign competition
Open Markets: Financial Freedom
Sources: Heritage Foundation’s 2012 Index of Economic Freedom Methodology
Rule of Law Open MarketsLimited Government Regulatory Efficiency

5252Proprietary & Confidential. © 2011, glendonTodd Capital LLC
Financial Freedom: Scoring
Government regulation of
financial institutions
Financial Freedom ScoreFocus
Area
50 60 70 80 900 10 20 30 40 100
State intervention in banks
and firms through ownership
TextFinancial and capital market
development
Government influence on
the allocation of credit
Openness to foreign
competition
A score on a scale of 0 to 100 is given to assess Financial Freedom based on the levels of the following five areas:
Sources: Heritage Foundation’s 2012 Index of Economic Freedom Methodology
Rule of Law Open MarketsLimited Government Regulatory Efficiency

5353Proprietary & Confidential. © 2011, glendonTodd Capital LLC
Financial Freedom: Scoring (continued)
Sources: Heritage Foundation’s 2012 Index of Economic Freedom Methodology
Rule of Law Open MarketsLimited Government Regulatory Efficiency
5454Proprietary & Confidential. © 2011, glendonTodd Capital LLC
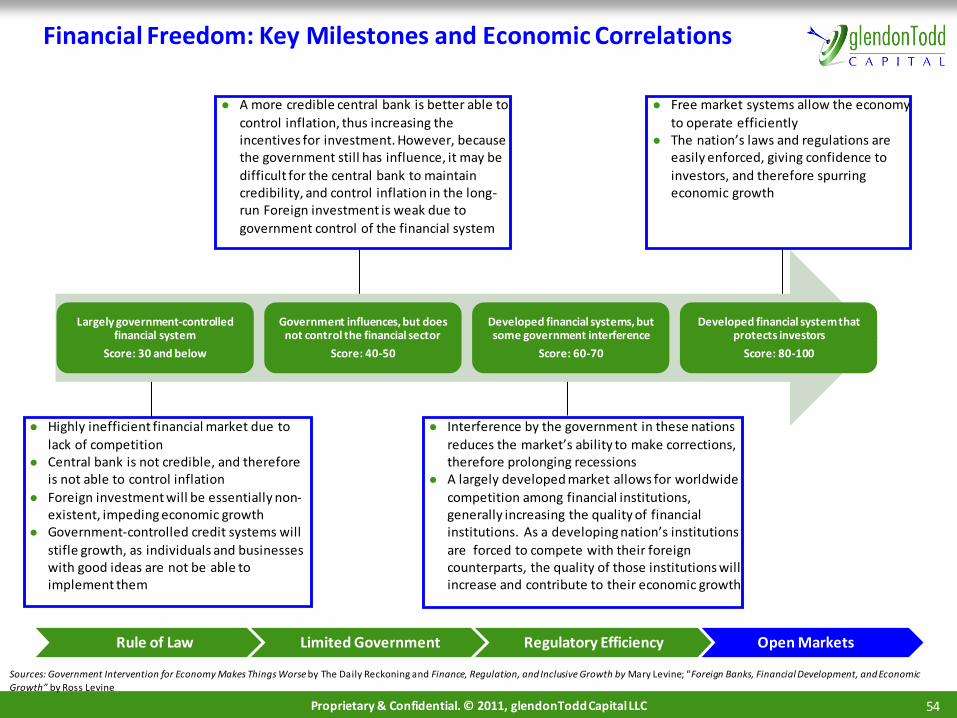
Financial Freedom: Key Milestones and Economic Correlations
Highly inefficient financial market due to
lack of competition Central bank is not credible, and therefore
is not able to control inflation
Foreign investment will be essentially non-existent, impeding economic growth
Government-controlled credit systems will
stifle growth, as individuals and businesses with good ideas are not be able to implement them
Interference by the government in these nations
reduces the market’s ability to make corrections, therefore prolonging recessions
A largely developed market allows for worldwide
competition among financial institutions, generally increasing the quality of financial institutions. As a developing nation’s institutions
are forced to compete with their foreign counterparts, the quality of those institutions will increase and contribute to their economic growth
Free market systems allow the economy
to operate efficiently The nation’s laws and regulations are
easily enforced, giving confidence to
investors, and therefore spurring economic growth
Sources: Government Intervention for Economy Makes Things Worse by The Daily Reckoning and Finance, Regulation, and Inclusive Growth by Mary Levine; “Foreign Banks, Financial Development, and Economic
Growth” by Ross Levine
Rule of Law Open MarketsLimited Government Regulatory Efficiency
A more credible central bank is better able to
control inflation, thus increasing the incentives for investment. However, because the government still has influence, it may be
difficult for the central bank to maintain credibility, and control inflation in the long-run Foreign investment is weak due to
government control of the financial system
Largely government-controlled financial system
Score: 30 and below
Government influences, but does not control the financial sector
Score: 40-50
Developed financial systems, but some government interference
Score: 60-70
Developed financial system that protects investors
Score: 80-100

5555Proprietary & Confidential. © 2011, glendonTodd Capital LLC
Project Overview
Introduction to the Index
The Index of Economic Freedom
Changes in the Index
Other Metrics to Consider
Analysis of Existing Research
Data Collection Process
Data Analysis Process
GDP Forecast Models
Results and Conclusions
Agenda

5656Proprietary & Confidential. © 2011, glendonTodd Capital LLC
Changes to The Index
The Index was introduced in 1995 and over the next several years expanded to include 184 countries
Throughout The Index’s history, there have been a few changes that have improved it’s methodology through increases in accuracy, specificity, and breadth of data
Regardless of the changes to The Index since its inception, the Heritage Foundation recalculates the data from past years to ensure consistency of year-on-year comparisons
In 2007, the Labor Freedom was given its own score Prior to 2007 there was no sufficient, reliable data source for labor data The labor component was then fine-tuned over the next several years in order to properly integrate this
data component With the introduction of Labor Freedom to The Index, it was retroactively calculated and added for the years
1995-2006
In 2012, The Index recorded public debt as a statistic for the first time Debt was not included directly in The Index calculations but was included indirectly in through the factors of
Monetary Freedom, Government Spending, Fiscal Freedom, Financial Freedom, and Investment Freedom
Over the past 18 years, The Index has made changes to more accurately measure economic freedom. Economic
freedom has increase in most of the world, but has been hindered recently by increased Government Spending
Source: Heritage Foundation’s 2012 Index of Economic Freedom, Preface, Executive Highlights, and Chapter 3

5757Proprietary & Confidential. © 2011, glendonTodd Capital LLC
The Index: Concerns
The current academic literature questions whether Fiscal Freedom and Government Spending accurately
accounts for the fundamental necessity of a government within a country Recommended Approach: Our team will examine the weights of the data included in The Index, and create
our own weights of each value to determine their relative importance in the final overall score
Data sourcing across the 184 countries is an issue due to restraints on the scope of the data from the Heritage Foundation’s underlying sources
Certain scores are forced to use alternate sources for a small portion of the countries because the main source doesn’t encompass all 184 countries included in The Index
Recommended Approach: Our team will only include the countries with the best quality of data
The data in The Index is lagged, with data for the 2012 Index obtained from July 1, 2010 through June 30, 2011 While most factors are based on only one year, some contain metrics from multiple years. This results in
different data collection periods for certain factors The set time period ensures that there is consistency for each factor so that world events are accurately
accounted for in each countries’ score
Recommended Approach: Our team will need to focus on the periodicity of the data for GDP and potential additional variables
The presence of qualitative data in The Index, particularly factors regarding perceptions, introduces an element of subjectivity, however this may more accurately depict the state of the economy in certain situations Recommended Approach: We cannot change the data, so we will be sure to note the effects of this in our
overall analysis
Source: Dawson, Causality in the freedom-growth relationship; Gordillo and Alvarez-Arce, The Chicken and the Egg: Economic Growth and Freedom; De Haan and Siermann, Further
Evidence on the Relationship Between Economic Freedom and Economic Growth; Wu, Economic Freedom, Economic Growth, and China; De Haan and Sturm, On the Relationship Between Economic Freedom and Economic Growth; Gwartney, Holcombe, and Lawson, Economic Freedom, Institutional Quality, and Cross-Country Differences in Income and Growth
5858Proprietary & Confidential. © 2011, glendonTodd Capital LLC
The Index: Concerns on the Weighting of Factors
The Index averages the ten factors “so that the overall score will not be biased toward any one component or
policy direction” Also, all variables within each factor are given equal weight except for Investment Freedom
The Index considers this approach to be a fair way to measure economic freedom because each factor is thought to be of equal importance
When the factors are averaged together, the scores are not normalized, inherently weighting the various factors because of the large variation in means For example, the mean scores range from 39.3 to 74.8 for Freedom from Corruption and Fiscal Freedom,
respectively
This raises the following questions regarding the validity of equally weighing all variables and the reasoning
behind each factor’s inclusion: Is the value of each factor really the same? Do they interact in ways that The Index does not account for?
Given these concerns, the validity of The Index is unaltered due to the fact that it was not “designed specifically to explain economic growth or any other dependent variable… the raw data for each component are provided
so that others can study, weight, and integrate as they see fit”
The Heritage Foundation is not attempting to make any statements about specific correlations with The Index,
but rather are simply rating economic freedom and leaving the correlations and causations to third parties
Source: Heritage Foundation’s 2012 Index of Economic Freedom, Methodology

5959Proprietary & Confidential. © 2011, glendonTodd Capital LLC
Project Overview
Introduction to the Index
The Index of Economic Freedom
Changes in the Index
Other Metrics to Consider
Analysis of Existing Research
Data Collection Process
Data Analysis Process
GDP Forecast Models
Results and Conclusions
Agenda

6060Proprietary & Confidential. © 2011, glendonTodd Capital LLC
Velocity of Money
Velocity of Money is a metric that attempts to measure how often money is spent in the economy
When a dollar (or other unit of currency) is introduced to the economy, it is used multiple times for various transactions
For example, when someone is paid by an employer and then purchases a bag of chips, the money spent on the chips does not simply sit in a cash register for all eternity. Instead the money spent is used again. This process is repeated throughout the economy
In this way, GDP is much larger than the money supply. Multiple transactions allow the same set of money to be used in the creation of a much larger GDP value
The Velocity of Money is determined in order to see how many times each dollar in the money supply is used in transactions of new goods and services It does not include money spent on used goods as they do not contribute to GDP
GDP data is already required and so it does not present an issue, therefore nominal transactions data is unnecessary
The required money supply data is not consistent or easily accessed, and therefore also presents an issue: Some nations use foreign currencies (the U.S. Dollar) as either official currency or there de facto primary
currency This data is not easily accessible, especially not on a historic basis
Because of complications around obtaining the required data, Velocity of Money is not a good metric to be included in the analysis
Source: http://www.econbrowser.com/archives/2010/12/velocity_of_mon.html
Percentage of Population Paying Income Taxes
Velocity of Money Public Debt-to-GDP Ratio Household Debt

6161Proprietary & Confidential. © 2011, glendonTodd Capital LLC
Percentage of Population Paying Income Taxes
Another metric that may be useful to add to The Index is the percentage of the population paying income taxes
This figure is readily available in the United States and has been the subject of much political discourse
In other nations, the figure is not recorded or discussed so regularly
Nations do publish their income tax data, and so it is theoretically possible to use the published income tax rates
with published earnings of the population to determine the percentage of population that pays income taxes
This presents a great degree of difficulty in accurately measuring the data for each nation, which is compounded
when the number of years of data required is considered (1995-2012)
It is possible to gather this data, but there is a two-fold question as to whether we should
Can we gather this data, while accomplishing our other research, within the time frame of the summer? If we can gather this data, is it worth it to sacrifice time spent on other projects to find this income tax data?
Furthermore, the likelihood of finding a significant amount of accurate data is low. For instance, the IMF only publishes employment figures for 34 nations. Determining the amount of the population not paying taxes in the remaining countries becomes much more difficult without data from which to determine it
Source: International Monetary Fund, World Economic Outlook April 2012
Velocity of MoneyPercentage of Population
Paying Income TaxesPublic Debt-to-GDP Ratio Household Debt
6262Proprietary & Confidential. © 2011, glendonTodd Capital LLC
Public Debt-to-GDP Ratio
The public debt-to-GDP ratio should be considered as another factor to include in our predictive analysis of GDP
Public debt negatively impacts GDP by raising interest rates, crowding out private investment, and limiting the flexibility of government to respond to future economic or national security crises
In particular, public debt is a threat to the economic freedom of future generations The future generation is obligated to pay off past debt which leads to an increase in the ratio of government
spending to GDP and reduces economic freedom
The correlation between public debt-to-GDP ratios and economic freedom in advanced and developing economies
is noted through the findings of many recent studies There is a much stronger negative correlation between the debt-to-GDP ratio and economic freedom of
advanced economies (-0.48) than there is for the debt-to-GDP ratio and economic freedom for developing
economies (-0.29) Reinhart & Rogoff and Kumar & Woo found insignificant and inconsistent impacts for low and moderate levels
of debt but a significant impact for debt exceeding 90% of GDP in advanced economies, or 60% of GDP in
developing economies
The level of economic freedom in a country plays a critical role in determining the impact of debt
When economic freedom is high, debt may be sustainable even at higher levels When economic freedom is low, the impact of even moderate levels of debt is likely to be negative
Source: International Monetary Fund, World Economic Outlook April 2012
Velocity of Money Public Debt-to-GDP RatioPercentage of Population
Paying Income TaxesHousehold Debt
6363Proprietary & Confidential. © 2011, glendonTodd Capital LLC
Public Debt-to-GDP Ratio: Issues
Although the relationship between the public debt-to-GDP ratio and economic freedom is quite apparent, public
debt-to-GDP ratio is already accounted for by five of the ten factors in The Index:
1. Monetary Freedom:
— Inflation is a result of high levels of public debt in a nation and is a direct factor in the score for Monetary Freedom
2. Government Spending:
— Increases in government spending as a result of increasing public debt will directly lower the Government Spending scores in The Index
3. Fiscal Freedom
— In order to reduce public debt, the government may increase taxes to finance debt service payments, which would directly lower the Fiscal Freedom scores in The Index
4. Financial Freedom
— Financial Freedom scores will be negatively impacted since public debt crowds out private-sector access to credit and raises interest rates
5. Investment Freedom
— The potential positive effects of high levels of investment freedom can be undercut if government borrowing to finance public debt siphons funds from the economy which would otherwise find their way into private-sector enterprises
While the impact of public debt-to-GDP ratios on economic freedom and growth are substantial, the fact that public debt is accounted for by the five factors above would decrease the value of adding this ratio as a variable
The information added by the ratio would not significantly improve our analysis of GDP in the presence of these other variables due to multicollinearity
Source: International Monetary Fund, World Economic Outlook April 2012
Velocity of Money Public Debt-to-GDP RatioPercentage of Population
Paying Income TaxesHousehold Debt

6464Proprietary & Confidential. © 2011, glendonTodd Capital LLC
Household Debt
Household Debt is another metric that can be considered for linkage to GDP growth and The Index
The data for Household Debt, much like other kinds of debt, indicates that household debt is both good and bad for an economy
The IMF suggests that excessive amounts of household debt during economic booms increase the depth of the trough during recessions
Small amounts of Household Debt help the economy grow, but amounts of Household Debt in excess of 85% of GDP in aggregate can stall or reverse economic growth
Accordingly, Household Debt may be either a positive force or a negative force in the economy. Debt leads to growth, but too much debt
The data on Household Debt is available for many of the countries in the Organisation for Economic Co-operation and Development (“OECD”), along with Taiwan
This would provide data for 35 developed economies
There is data available for this statistic in much less volume than the size of The Index
Due to the lack of data across developing nations and the world, Household Debt does not appear to be a viable metric to augment The Index
Source: International Monetary Fund: World Economic Outlook, April 2012; Cecchetti, Mohanty, and Zampolli, The Real Effects of Debt
Velocity of Money Household DebtPercentage of Population
Paying Income TaxesPublic Debt-to-GDP Ratio

6565Proprietary & Confidential. © 2011, glendonTodd Capital LLC
Project Overview
Introduction to the Index
The Index of Economic Freedom
Changes in the Index
Other Metrics to Consider
Analysis of Existing Research
Data Collection Process
Data Analysis Process
GDP Forecast Models
Results and Conclusions
Agenda
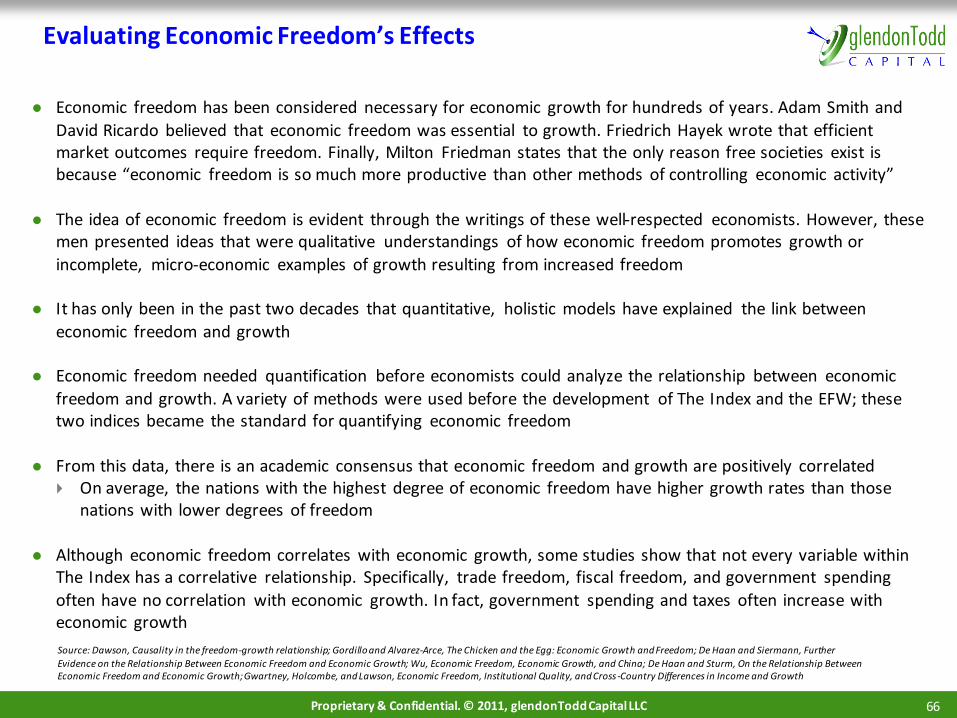
6666Proprietary & Confidential. © 2011, glendonTodd Capital LLC
Evaluating Economic Freedom’s Effects
Economic freedom has been considered necessary for economic growth for hundreds of years. Adam Smith and
David Ricardo believed that economic freedom was essential to growth. Friedrich Hayek wrote that efficient market outcomes require freedom. Finally, Milton Friedman states that the only reason free societies exist is because “economic freedom is so much more productive than other methods of controlling economic activity”
The idea of economic freedom is evident through the writings of these well-respected economists. However, these men presented ideas that were qualitative understandings of how economic freedom promotes growth or
incomplete, micro-economic examples of growth resulting from increased freedom
It has only been in the past two decades that quantitative, holistic models have explained the link between
economic freedom and growth
Economic freedom needed quantification before economists could analyze the relationship between economic
freedom and growth. A variety of methods were used before the development of The Index and the EFW; these two indices became the standard for quantifying economic freedom
From this data, there is an academic consensus that economic freedom and growth are positively correlated On average, the nations with the highest degree of economic freedom have higher growth rates than those
nations with lower degrees of freedom
Although economic freedom correlates with economic growth, some studies show that not every variable within The Index has a correlative relationship. Specifically, trade freedom, fiscal freedom, and government spending
often have no correlation with economic growth. In fact, government spending and taxes often increase with economic growth
Source: Dawson, Causality in the freedom-growth relationship; Gordillo and Alvarez-Arce, The Chicken and the Egg: Economic Growth and Freedom; De Haan and Siermann, Further
Evidence on the Relationship Between Economic Freedom and Economic Growth; Wu, Economic Freedom, Economic Growth, and China; De Haan and Sturm, On the Relationship Between Economic Freedom and Economic Growth; Gwartney, Holcombe, and Lawson, Economic Freedom, Institutional Quality, and Cross -Country Differences in Income and Growth

6767Proprietary & Confidential. © 2011, glendonTodd Capital LLC
Causality Between Economic Freedom and Economic Growth
Correlation does not imply causation. Most of the literature available only concerns correlation between
economic growth and economic freedom, and does not address causation
When correlative models are adjusted for causality, they produce different results
Various models have been used to determine the causal relationship between economic freedom and growth. These models produce similar results about the causality of the relationship:
Increases in overall economic freedom lead to increases economic growth Not all the categories of economic freedom directly cause economic growth, instead there are several
different types of relationships between elements of economic freedom and economic growth
— Causal: An increase in freedom results in an increase in growth— Endogenous: Freedom and growth increase together— Complex: The factor is endogenous with growth but such endogeneity is an incomplete explanation
— Non-Correlative (further inquiry): The data shows that growth is not related to freedom for all or part of the data range
The elements of The Index can be divided into these three categories: Causal: Property Rights, Business Freedom, Labor Freedom, and Financial Freedom Complex/Endogenous: Monetary Freedom, Investment Freedom, and Freedom from Corruption
Further Inquiry: Trade Freedom, Fiscal Freedom, and Government Spending
Source: Dawson, Causality in the freedom-growth relationship; Gordillo and Alvarez-Arce, The Chicken and the Egg: Economic Growth and Freedom; De Haan and Siermann, Further
Evidence on the Relationship Between Economic Freedom and Economic Growth; Wu, Economic Freedom, Economic Growth, and China; De Haan and Sturm, On the Relationship Between Economic Freedom and Economic Growth; Gwartney, Holcombe, and Lawson, Economic Freedom, Institutional Quality, and Cross-Country Differences in Income and Growth

6868Proprietary & Confidential. © 2011, glendonTodd Capital LLC
Causality Between Economic Freedom and Economic Growth
Factor Causal Complex/Endogenous Further Inquiry
Property Rights ✔
Freedom From Corruption ✔
Fiscal Freedom ✔
Government Spending ✔
Business Freedom ✔
Labor Freedom ✔
Monetary Freedom ✔
Trade Freedom ✔
Investment Freedom ✔
Financial Freedom ✔
Source: Dawson, Causality in the freedom-growth relationship; Gordillo and Alvarez-Arce, The Chicken and the Egg: Economic Growth and Freedom; De Haan and Siermann, Further Evidence on the
Relationship Between Economic Freedom and Economic Growth; Wu, Economic Freedom, Economic Growth, and China; De Haan and Sturm, On the Relationship Between Economic Freedom and Economic Growth; Gwartney, Holcombe, and Lawson, Economic Freedom, Institutional Quality, and Cross-Country Differences in Income and Growth ; Bengoa and Sanchez-Robles; Foreign Direct Investment, Economic Freedom and Growth: New Evidence from Latin America; Swaleheen and Stansel, Economic Freedom, Corruption, and Growth

6969Proprietary & Confidential. © 2011, glendonTodd Capital LLC
Causality Between Economic Freedom and Economic Growth
The classification of The Index’s ten factors as causal, complex/endogenous, and non-correlative provides
insight into how The Index can be re-weighted to provide a better model for predicting economic growth
The causal relationship is non-linear and non-specific
For example, the effects of an increase in Property Rights do not necessarily occur in the next year or even the next five years. Changes in institutions require time to take full effect in the economy
Although the causal relationship between elements of economic freedom and growth is present, there is no
quantitative formula for a change in an element of freedom resulting in economic growth. For example, increasing property rights will improve growth, but the extent to which growth changes depends on the nation and its developmental state
Understanding the true impact of these variables is difficult because different literature suggests causal, correlative, or reverse causal relationships depending upon the analysis used and the source of the data
The relationships between different types of factors and growth is complicated, the categories do not explain the nuances between the factors and economic growth
Variables are classified as endogenous because they trend with economic growth. Studies show that they are positively correlated with economic growth
Non-correlative variables present much the same problem as endogenous variables in that they are still
linked to economic freedom, just not by causation or direct correlation
Source: Dawson, Causality in the freedom-growth relationship; Gordillo and Alvarez-Arce, The Chicken and the Egg: Economic Growth and Freedom; De Haan and Siermann, Further
Evidence on the Relationship Between Economic Freedom and Economic Growth; Wu, Economic Freedom, Economic Growth, and China; De Haan and Sturm, On the Relationship Between Economic Freedom and Economic Growth; Gwartney, Holcombe, and Lawson, Economic Freedom, Institutional Quality, and Cross-Country Differences in Income and Growth
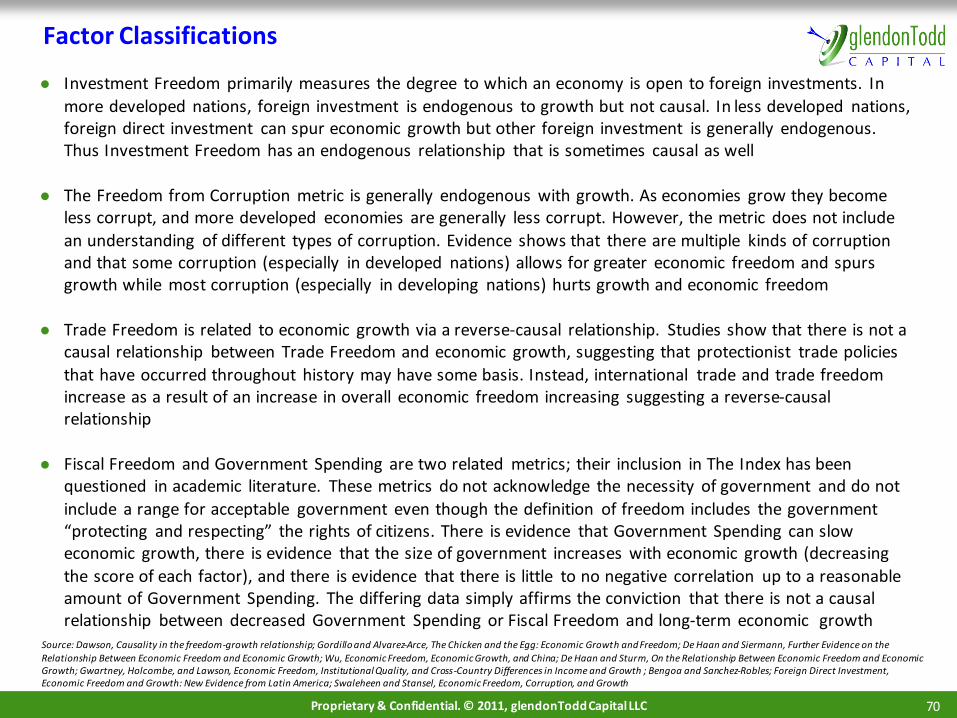
7070Proprietary & Confidential. © 2011, glendonTodd Capital LLC
Factor Classifications
Investment Freedom primarily measures the degree to which an economy is open to foreign investments. In
more developed nations, foreign investment is endogenous to growth but not causal. In less developed nations, foreign direct investment can spur economic growth but other foreign investment is generally endogenous. Thus Investment Freedom has an endogenous relationship that is sometimes causal as well
The Freedom from Corruption metric is generally endogenous with growth. As economies grow they become less corrupt, and more developed economies are generally less corrupt. However, the metric does not include
an understanding of different types of corruption. Evidence shows that there are multiple kinds of corruption and that some corruption (especially in developed nations) allows for greater economic freedom and spurs growth while most corruption (especially in developing nations) hurts growth and economic freedom
Trade Freedom is related to economic growth via a reverse-causal relationship. Studies show that there is not a causal relationship between Trade Freedom and economic growth, suggesting that protectionist trade policies
that have occurred throughout history may have some basis. Instead, international trade and trade freedom increase as a result of an increase in overall economic freedom increasing suggesting a reverse-causal relationship
Fiscal Freedom and Government Spending are two related metrics; their inclusion in The Index has been questioned in academic literature. These metrics do not acknowledge the necessity of government and do not
include a range for acceptable government even though the definition of freedom includes the government “protecting and respecting” the rights of citizens. There is evidence that Government Spending can slow economic growth, there is evidence that the size of government increases with economic growth (decreasing
the score of each factor), and there is evidence that there is little to no negative correlation up to a reasonable amount of Government Spending. The differing data simply affirms the conviction that there is not a causal relationship between decreased Government Spending or Fiscal Freedom and long-term economic growth
Source: Dawson, Causality in the freedom-growth relationship; Gordillo and Alvarez-Arce, The Chicken and the Egg: Economic Growth and Freedom; De Haan and Siermann, Further Evidence on the
Relationship Between Economic Freedom and Economic Growth; Wu, Economic Freedom, Economic Growth, and China; De Haan and Sturm, On the Relationship Between Economic Freedom and Economic Growth; Gwartney, Holcombe, and Lawson, Economic Freedom, Institutional Quality, and Cross-Country Differences in Income and Growth ; Bengoa and Sanchez-Robles; Foreign Direct Investment, Economic Freedom and Growth: New Evidence from Latin America; Swaleheen and Stansel, Economic Freedom, Corruption, and Growth

7171Proprietary & Confidential. © 2011, glendonTodd Capital LLC
Past Research
There have been many academic studies on the relationship between GDP and an assortment of economic and political indicators:
— Most have determined that there is no “robust” linear relationship between these indicators and GDP growth.
— Many of the studies agree that “events” or “thresholds” have some affect on long run average GDP growth rates including Reinhart & Rogoff (2009), Altman (2008), and Barro(2003).
— Some suggestions made in the conclusions involve studying the interdependencies of the variables and thresholds.
Changes in variables have varying effects depending on profile of the country, magnitutdeof the change and ability of internal or external market participants to capitalize on a positive change in Freedom.
Studies by Morris Altman have shown that below certain thresholds, long run GDP growth rates are negatively impacted by poor Freedom Scores and a country’s GDP can be predicted within a range depending on those scores. Above a certain level of Freedom, ranges of GDP growth rates can vary greatly.
Source: International Monetary Fund, World Economic Outlook April 2012

7272Proprietary & Confidential. © 2011, glendonTodd Capital LLC
Democratic Events Roll & Talbott (2001)Why Many Developing Countries Just Aren’t
Roll & Talbott(2001):
— Split countries into three groups based on presence of democratic events: (1) Countries with democratic events in past 50 years and no subsequent non-democratic
event (2) Countries with no democratic event and no long history of democracy (3) Long term democracies
— Determine relationship between per capita income and factors based on cross section of countries: Property Rights, black market activity and regulation have a strong relationship with per
capita income A system for transferring and protecting property and the trade of goods and
services increases economic activity both internally and externally through the development of domestic businesses and investments and trade involving foreign companies.
In general, stronger systems, fewer trade barriers and more democratic countries tend to have higher GDP per capita.

7373Proprietary & Confidential. © 2011, glendonTodd Capital LLC
Democratic Events Roll & Talbott (2001)Why Many Developing Countries Just Aren’t
Countries with anti-democratic events:
— Saw significant declines in their GDP growth rate following these events
— In no sub-period did their growth reach the average growth rate experienced by countries with positive democratic events
There are countries with low Freedom Index Scores but high growth:
— China, since Deng Xiaoping instituted market reforms in 1978 has seen a number of changes that while not necessarily democratic or lead to major increases in Freedom Index scores, has improved the functioning of trade and industry in the country.

7474Proprietary & Confidential. © 2011, glendonTodd Capital LLC
Democratic EventsWhy Many Developing Countries Just Aren’t
Countries with anti-democratic events:
— Saw significant declines in their GDP growth rate following these events
— In no sub-period did their growth reach the average growth rate experienced by countries with positive democratic events
The change in growth rates for both groups:
— Shows that Democratic Events are a cause of an increase in a country’s GDP growth rate
— Anti-Democratic events cause a decrease in a country’s GDP growth rate.

7575Proprietary & Confidential. © 2011, glendonTodd Capital LLC
Project Overview
Introduction to the Index
The Index of Economic Freedom
Changes in the Index
Other Metrics to Consider
Analysis of Existing Research
Data Collection Process
Data Analysis Process
GDP Forecast Models
Results and Conclusions
Agenda

7676Proprietary & Confidential. © 2011, glendonTodd Capital LLC
We reduced the universe of countries being analyzed and grouped them
In addition to the Economic Freedom data, our analysis requires GDP data, which we collected from the
International Monetary Fund (“IMF”) and the Economic Research Service (“ERS”) GDP growth data came from the IMF and real GDP per capita from the ERS
After collecting all the data, we pared our country list down to 91 from 184 by removing those countries that do not have Index data for all the years (1995-2012), those that were not included in the CPI, those that are not included in The World Bank’s Doing Business 2012 Report, and those that are not included in the IMF data
We also excluded the Labor Freedom factor from our analysis because the scores begin in 2005
In addition to preparing the data for general analysis, we divided the data into three different categories to run analysis on a smaller scale on. We based our division on The World Bank’s economic and geographic classifications
1. We used The World Bank Data to classify the nations as low income, lower middle income, upper middle income, and high income to achieve Income Classification
2. We divided the nations into the groups based upon location to achieve Geographic Classification
3. We classified the OECD nations and other developed nations as “developed,” and classified the developing nations by geography to achieve Semi-Geographic Classification
4. We divided the nations by their primary colonizer, focusing on influence of law. Those nations that were
colonizers or not colonized are grouped together, to achieve a Colonization Classification— England’s colonies are divided into categories to reflect the different colonization strategies in each area.
Group (1) follows the extractive patterns typical of colonization while Group (2) colonies developed more
inclusive institutions

7777Proprietary & Confidential. © 2011, glendonTodd Capital LLC
Project Overview
Introduction to the Index
The Index of Economic Freedom
Changes in the Index
Other Metrics to Consider
Analysis of Existing Research
Data Collection Process
Data Analysis Process
GDP Growth Forecast Models
Results and Conclusions
Agenda
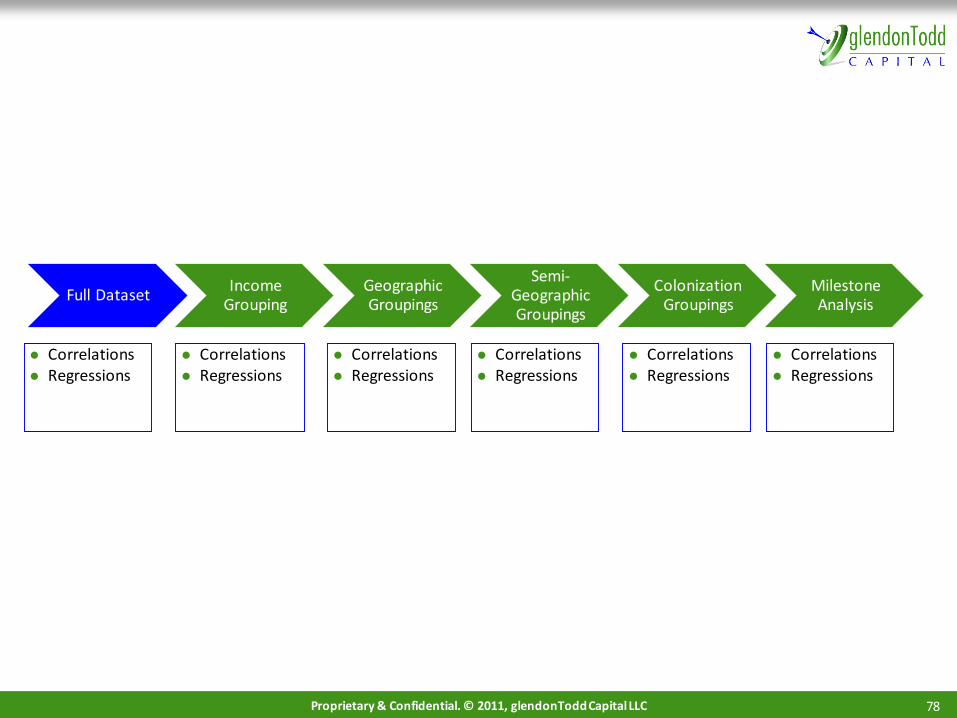
7878Proprietary & Confidential. © 2011, glendonTodd Capital LLC
Full DatasetIncome
GroupingGeographic Groupings
Semi-Geographic Groupings
Colonization Groupings
Milestone Analysis
Correlations Regressions
Correlations Regressions
Correlations Regressions
Correlations Regressions
Correlations Regressions
Correlations Regressions

7979Proprietary & Confidential. © 2011, glendonTodd Capital LLC
High positive correlations with real GDP per capita suggest that this is the metric we should use in our analysis
There are high correlations between real GDP per capita and the factor scores. High correlations are not
found with either GDP growth or the change in real GDP per capita This indicates that real GDP per capita should be used in our analysis
We note that there are high correlations between real GDP per capita and Property Rights, as well as between GDP per capita and Freedom from Corruption These two factors are highly correlated themselves
Overall
Score
Business
Freedom
Trade
Freedom
Fiscal
Freedom
Government
Spending
Monetary
Freedom
Investment
Freedom
Financial
Freedom
Property
Rights
Freedom
from
Corruption GDP Growth
Real GDP Per
Capita
Real GDP per
capita
change
Overall Score 1.000
Business Freedom 0.771 1.000
Trade Freedom 0.570 0.418 1.000
Fiscal Freedom 0.160 (0.068) 0.054 1.000
Government Spending (0.022) (0.253) (0.289) 0.561 1.000
Monetary Freedom 0.591 0.355 0.225 0.036 0.011 1.000
Investment Freedom 0.699 0.557 0.336 (0.078) (0.207) 0.274 1.000
Financial Freedom 0.731 0.520 0.400 (0.027) (0.180) 0.345 0.597 1.000
Property Rights 0.783 0.730 0.418 (0.254) (0.377) 0.349 0.618 0.567 1.000
Freedom from Corruption 0.753 0.694 0.473 (0.242) (0.432) 0.412 0.485 0.513 0.804 1.000
GDP Growth (0.064) (0.115) (0.115) 0.150 0.143 0.097 (0.125) (0.117) (0.132) (0.111) 1.000
Real GDP Per Capita 0.628 0.628 0.512 (0.374) (0.503) 0.382 0.451 0.482 0.733 0.805 (0.147) 1.000
Real GDP per capita change 0.276 0.253 0.220 (0.156) (0.209) 0.176 0.185 0.188 0.328 0.368 0.406 0.407 1.000
Positive correlation greater than 0.7
Negative correlation greater than 0.7
Full DatasetIncome
GroupingGeographic Groupings
Semi-Geographic Groupings
Colonization Groupings
Milestone Analysis

8080Proprietary & Confidential. © 2011, glendonTodd Capital LLC
Low correlations of factor growth rates resulted in their exclusion from the analysis
Growth rates of factors tend to be less correlated. Here, we see that there are no high correlations between
the factors or with real GDP per capita or the change in real GDP per capita
As a result of the low correlations with GDP growth, real GDP per capita and the change in real GDP per capita,
we decided to focus on factor scores instead of factor growth rates
Overall
Score
Business
Freedom
Trade
Freedom
Fiscal
Freedom
Government
Spending
Monetary
Freedom
Investment
Freedom
Financial
Freedom
Property
Rights
Freedom
from
Corruption GDP Growth
Real GDP Per
Capita
Real GDP per
capita
change
Overall Score 1.000
Business Freedom 0.252 1.000
Trade Freedom 0.406 0.007 1.000
Fiscal Freedom 0.374 0.018 0.118 1.000
Government Spending (0.007) (0.001) (0.002) 0.003 1.000
Monetary Freedom 0.253 0.010 0.003 0.058 0.009 1.000
Investment Freedom 0.363 0.021 0.029 0.076 (0.002) (0.003) 1.000
Financial Freedom 0.524 0.071 0.182 0.187 0.050 0.014 0.219 1.000
Property Rights 0.309 0.074 0.002 0.014 0.005 (0.005) 0.071 0.083 1.000
Freedom from Corruption 0.344 (0.005) 0.091 0.106 (0.060) 0.082 0.018 0.127 0.057 1.000
GDP Growth 0.003 0.034 0.029 0.010 (0.013) (0.020) (0.019) (0.017) 0.006 (0.002) 1.000
Real GDP Per Capita (0.003) 0.038 (0.072) (0.020) 0.051 (0.059) 0.035 (0.015) 0.061 (0.072) (0.153) 1.000
Real GDP per capita change 0.025 0.044 (0.027) 0.005 0.025 (0.017) 0.002 (0.010) 0.033 (0.029) 0.406 0.407 1.000
Positive correlation greater than 0.7
Negative correlation greater than 0.7
Full DatasetIncome
GroupingGeographic Groupings
Semi-Geographic Groupings
Colonization Groupings
Milestone Analysis

8181Proprietary & Confidential. © 2011, glendonTodd Capital LLC
In order to obtain models that have a good fit we need to look at the data in groups of similar countries
Our initial regression analysis confirmed that factor scores and real GDP per capita would yield the best
models. We will use this approach to look for predictive value when we create our model “Factor scores” exclude the Overall Score and Labor Freedom
Using the factor scores, we ran pooled regressions with real GDP per capita as the dependent variable This analysis yielded a model with a good fit, indicated by the R2 of .74 Investment Freedom was the only factor that was not significant
Using the fixed effect regression approach we started with the real GDP per capita as the dependent variable and the factor scores as the independent variables
The model found that Property Rights, Monetary Freedom, Trade Freedom, Fiscal Freedom and Investment Freedom were all significant
The model was not a particularly good fit, with an R2 of 0.5
The relatively poor fit of the model is likely due to the large number of countries we used in the analysis. The results show that we are likely to find good results, but that we need to have smaller and more homogeneous
groups in order to obtain those results
Full DatasetIncome
GroupingGeographic Groupings
Semi-Geographic Groupings
Colonization Groupings
Milestone Analysis

8282Proprietary & Confidential. © 2011, glendonTodd Capital LLC
Full DatasetIncome
GroupingGeographic Groupings
Semi-Geographic Groupings
Colonization Grouping
Milestone Analysis
Correlations Regressions
Correlations Regressions
Correlations Regressions
Correlations Regressions
Correlations Regressions
Correlations Regressions
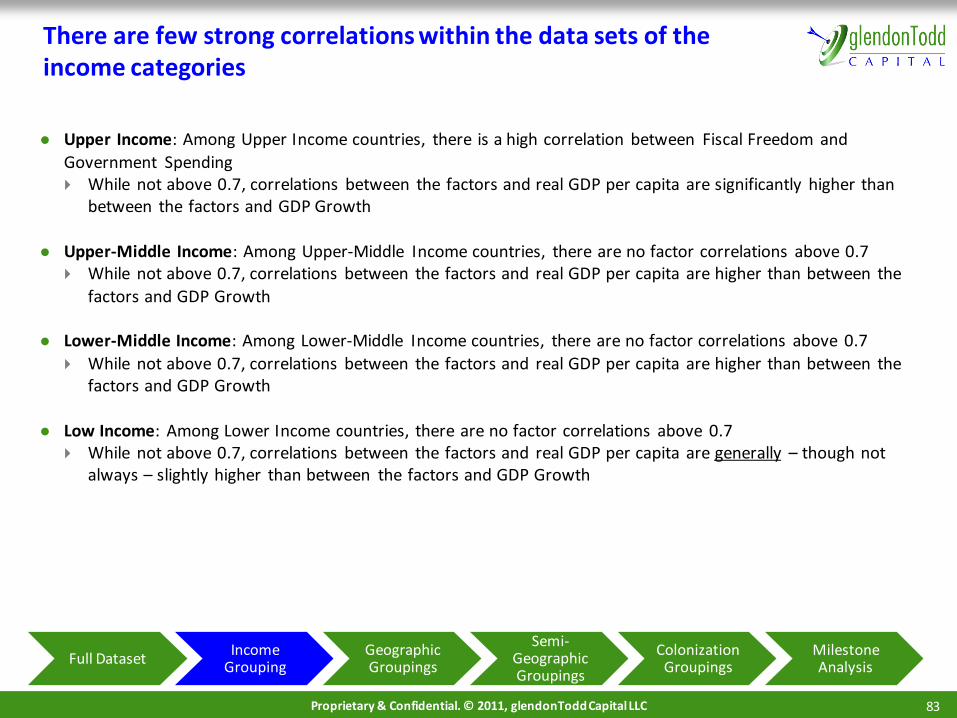
8383Proprietary & Confidential. © 2011, glendonTodd Capital LLC
There are few strong correlations within the data sets of the income categories
Upper Income: Among Upper Income countries, there is a high correlation between Fiscal Freedom and
Government Spending While not above 0.7, correlations between the factors and real GDP per capita are significantly higher than
between the factors and GDP Growth
Upper-Middle Income: Among Upper-Middle Income countries, there are no factor correlations above 0.7 While not above 0.7, correlations between the factors and real GDP per capita are higher than between the
factors and GDP Growth
Lower-Middle Income: Among Lower-Middle Income countries, there are no factor correlations above 0.7
While not above 0.7, correlations between the factors and real GDP per capita are higher than between the factors and GDP Growth
Low Income: Among Lower Income countries, there are no factor correlations above 0.7 While not above 0.7, correlations between the factors and real GDP per capita are generally – though not
always – slightly higher than between the factors and GDP Growth
Full DatasetIncome
GroupingGeographic Groupings
Semi-Geographic Groupings
Colonization Groupings
Milestone Analysis

8484Proprietary & Confidential. © 2011, glendonTodd Capital LLC
real GDP per capita Regressions
The upper income grouping had the best fitting model of the income groups, with an R2 of 0.96
All the factors were found to be significant in this model
There are a 28 upper-middle income countries, and the grouping includes a wide range of geographic areas and cultures. This could contribute to the lower R2 of 0.92 Trade Freedom, Fiscal Freedom, Monetary Freedom, Investment Freedom, Property Rights, and Freedom from
Corruption are all significant
The lower-middle income produced a model with a good fit, with an R2 of 0.96 Trade Freedom, Fiscal Freedom, Government Spending, Monetary Freedom, Investment Freedom, Property
Rights, and Freedom from Corruption are significant
The lower income grouping had the worst fitting model. This is likely a result of the vast differences in these
countries Business Freedom and Financial Freedom are the only two factors that are not significant in determining real
GDP per capita in this grouping
On the whole, we see that income groupings could prove to be a useful grouping, however, the lower income
grouping may be excluded due to the difficulty in finding a model with a good fit
Most of the factors prove to be significant in these models, but Business Freedom and Financial Freedom are
found to be significant in only the upper income grouping
Full DatasetIncome
GroupingGeographic Groupings
Semi-Geographic Groupings
Colonization Groupings
Milestone Analysis

8585Proprietary & Confidential. © 2011, glendonTodd Capital LLC
Business Freedom and Financial Freedom are less important than the other factors among the income classification group
Upper IncomeUpper-Middle
IncomeLower-Middle
Income Lower Income
Property Rights
Freedom from Corruption
Fiscal Freedom
Government Spending
Business Freedom
Monetary Freedom
Trade Freedom
Investment Freedom
Financial Freedom
Full DatasetIncome
GroupingGeographic Groupings
Semi-Geographic Groupings
Colonization Groupings
Milestone Analysis

8686Proprietary & Confidential. © 2011, glendonTodd Capital LLC
Full DatasetIncome
GroupingGeographic Groupings
Semi-Geographic Groupings
Colonization Grouping
Milestone Analysis
Correlations Regressions
Correlations Regressions
Correlations Regressions
Correlations Regressions
Correlations Regressions
Correlations Regressions

8787Proprietary & Confidential. © 2011, glendonTodd Capital LLC
Property Rights and Freedom from Corruption tend to be highly correlated in these groupings
Asia and the Pacific: We see many strong correlations in the Asia Pacific Region. Business Freedom, Property
Rights, and Freedom from Corruption are the factors most positively correlated with real GDP per capita We see stronger correlations between real GDP per capita and the factors, than we do between GDP growth
and the factors
Europe: Again, Property Rights and Freedom from Corruption have significant correlations with real GDP per capita. We also see that Property Rights and Freedom from Corruptions are correlated themselves
There is once again, no significant correlation between GDP Growth and any of the factors, while there are two significant correlations between real GDP per capita and the factors
The Americas: We see significant correlations between Freedom from Corruption and real GDP per capita. We also see that Property Rights and Freedom from Corruptions are correlated themselves There is once again, no significant correlation between GDP Growth and any of the factors, while there is a
significant correlation between real GDP per capita and Freedom from Corruption
Middle East & North Africa: There are not many significant correlations between the freedom factors and real
GDP per capita and GDP growth Perhaps this says something about the effectiveness of the geographic grouping method
Sub-Saharan Africa: We see no significant correlations in the Sub-Saharan African region. This leads us to believe that this group is not cohesive or that the information obtained from these countries is not as indicative of economic growth due to the inconsistency of these results from the results of other groups
Full DatasetIncome
GroupingGeographic Groupings
Semi-Geographic Groupings
Colonization Groupings
Milestone Analysis

8888Proprietary & Confidential. © 2011, glendonTodd Capital LLC
Geographic groupings proved less helpful due to the vast differences in sizes of the economies and freedom levels of the groups
The regression models for the geographic groups, yielded significantly lower R2 values, and therefore poorly fit
models, in comparison to other grouping methods As a result, we will likely choose other groupings to use for the ultimate model The geographic groupings do not separate out the developed countries from the undeveloped, and therefore the
poor fit is likely due to the fact that each geographic grouping has a wide range of freedom scores and real GDP per capita levels
The Asia and the Pacific region had an R2 of 0.82 and many significant factor scores
Europe had the best fitting model of the grouping, likely due to the fact that most European countries are developed
and thus more homogeneous
The variation between North, Central, and South American countries in terms of development led to a less fit model
with an R2 of 0.69. It is interesting that Property Rights was the only factor that was not found to be significant. This is the only geographic group to have this result
Middle East and North Africa model resulted in an R2 of 0.79
Sub-Saharan Africa yielded the worst fitting R2 of 0.6. Similar to the lower income grouping, these countries may be
too varied in their development and freedom scores to produce a model with a good fit
Full DatasetIncome
GroupingGeographic Groupings
Semi-Geographic Groupings
Colonization Groupings
Milestone Analysis

8989Proprietary & Confidential. © 2011, glendonTodd Capital LLC
Freedom from Corruption, Fiscal Freedom, and Government Spending are the most important factors in determining real GDP per capita across geographic classifications
Asia and the Pacific Europe Americas
Middle East and North
AfricaSub-Saharan
Africa
Property Rights
Freedom from Corruption
Fiscal Freedom
Government Spending
Business Freedom
MonetaryFreedom
Trade Freedom
Investment Freedom
Financial Freedom
Full DatasetIncome
GroupingGeographic Groupings
Semi-Geographic Groupings
Colonization Groupings
Milestone Analysis

9090Proprietary & Confidential. © 2011, glendonTodd Capital LLC
Full DatasetIncome
GroupingGeographic Groupings
Semi-Geographic Groupings
Colonization Grouping
Milestone Analysis
Correlations Regressions
Correlations Regressions
Correlations Regressions
Correlations Regressions
Correlations Regressions
Correlations Regressions

9191Proprietary & Confidential. © 2011, glendonTodd Capital LLC
Property Rights and Freedom from Corruption tend to be highly correlated in these groupings Developed Nations: Among developed nations we see high correlations between Fiscal Freedom and
Government Spending as well as between Property Rights and Freedom from Corruption Correlations between the factors and real GDP per capita is higher than the factors and GDP growth
Sub-Saharan Africa: There are no strong correlations between factors among the Sub-Saharan African countries. Additionally, there is not a strong correlation between GDP growth and the factors
East Asia: In the East Asia countries, Business Freedom is highly correlated with Property Rights and Freedom from Corruption. Government Spending and Freedom from Corruption have a strong negative correlation We see mostly negative correlations between GDP growth and the factors, but some high correlations
between the factors and real GDP per capita
Middle East: The Middle East countries’ factors are not highly correlated with one another, and their
correlation with GDP growth is almost zero across the board, but correlations to real GDP per capita are higher
Eastern Europe & Central Asia: There are no significant correlations between the factors in the Eastern Europe
and Central Asia Countries Neither correlations between real GDP per capita nor GDP growth are significant and there is a surprisingly
high negative correlation between Property Rights and real GDP per capita
Americas: Again, we see strong correlations between Property Rights and Freedom from Corruption GDP growth is not highly correlated with any of the factors, but similar to the other semi-geographic
groupings, we see stronger correlations between real GDP per capita and the than factors than between GDP growth and the factors, with Property Rights and Freedom from Corruption being particularly strong
Full DatasetIncome
GroupingGeographic Groupings
Semi-Geographic Groupings
Colonization Groupings
Milestone Analysis

9292Proprietary & Confidential. © 2011, glendonTodd Capital LLC
Groupings comprised of homogeneous countries and a small number of countries yielded the best fitting models The developed nations grouping consisted of a 23 countries that are at different stages in development. This is
likely why the model was not a very good fit and why all the factor scores save Freedom from Corruption were found to be significant
Sub-Saharan Africa grouping is also large, including 20 countries. This model was also a poor fit, which could, in part, be a result of the vast underdevelopment of these countries. This is consistent with what we have seen in
the geographic and income classifications
Middle East included a smaller number and much more homogeneous group of countries, which led to a model that had a good fit, with an R2 of 0.99
East Asia has a small number of homogeneous countries that allowed for a model with a good fit
Eastern Europe and Central Asia is a small grouping, but has countries that differ greatly in size, which could be why we see a lower R2 of 0.93
The Americas grouping resulted in a model with a good fit and only two significant variables: Trade Freedom and
Property Rights Trade Freedom may be particularly important in these countries due to NAFTA
Overall, the semi-geographic groupings provided betting fitting models than using the entire dataset and than the purely geographic grouping, likely due to the fact that developed nations comprised their own group
A smaller number of significant factors in these groupings compared to the others allows for more parsimonious models
Full DatasetIncome
GroupingGeographic Groupings
Semi-Geographic Groupings
Colonization Groupings
Milestone Analysis
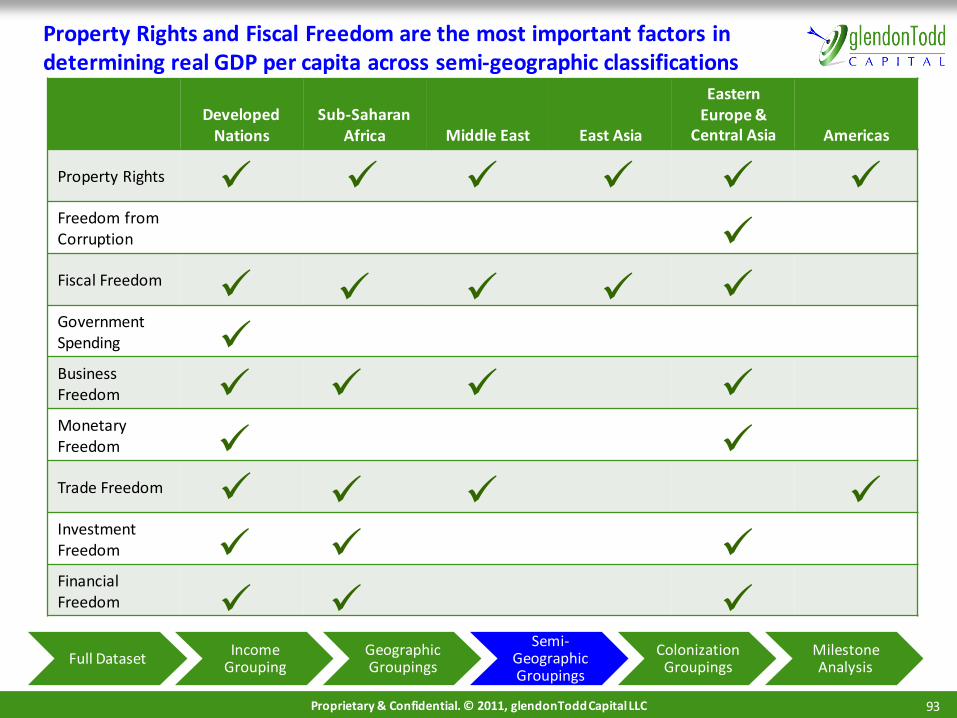
9393Proprietary & Confidential. © 2011, glendonTodd Capital LLC
Property Rights and Fiscal Freedom are the most important factors in determining real GDP per capita across semi-geographic classifications
Developed Nations
Sub-Saharan Africa Middle East East Asia
Eastern Europe &
Central Asia Americas
Property Rights
Freedom from Corruption
Fiscal Freedom
Government Spending
Business Freedom
MonetaryFreedom
Trade Freedom
Investment Freedom
Financial Freedom
Full DatasetIncome
GroupingGeographic Groupings
Semi-Geographic Groupings
Colonization Groupings
Milestone Analysis
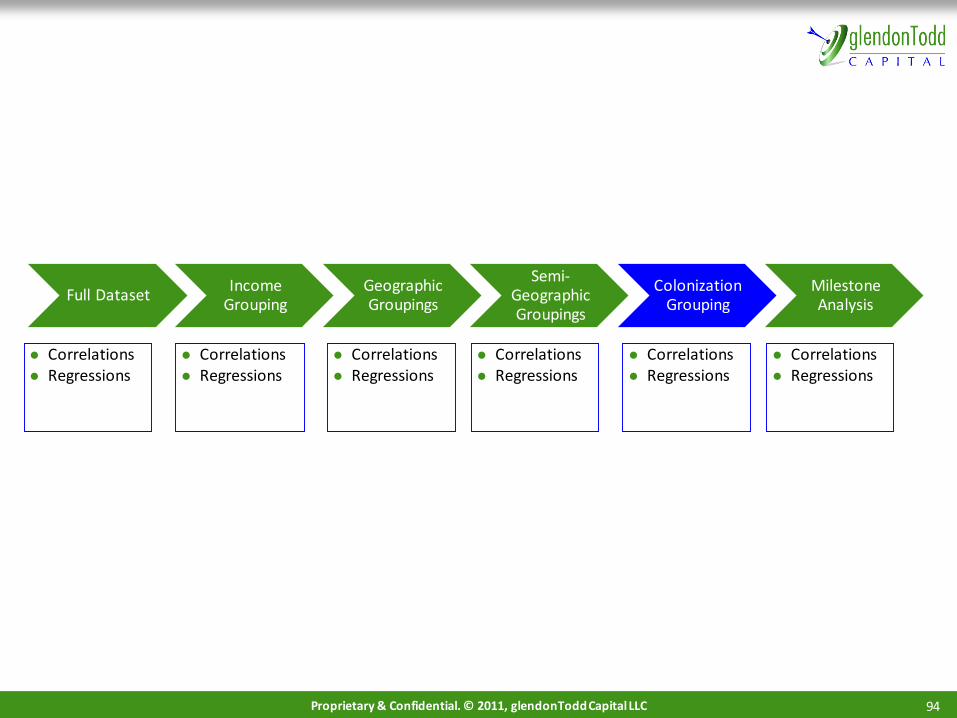
9494Proprietary & Confidential. © 2011, glendonTodd Capital LLC
Full DatasetIncome
GroupingGeographic Groupings
Semi-Geographic Groupings
Colonization Grouping
Milestone Analysis
Correlations Regressions
Correlations Regressions
Correlations Regressions
Correlations Regressions
Correlations Regressions
Correlations Regressions

9595Proprietary & Confidential. © 2011, glendonTodd Capital LLC
Freedom from Corruption and Property Rights are the most highly correlated with real GDP per capita in the colonization grouping
UK (1): In this grouping, real GDP per capita correlates strongly with Freedom from Corruption. Business
Freedom and Fiscal Freedom also have high correlations with real GDP per capita, but there is little correlation with GDP growth
UK (2): In these countries, Property Rights correlates most strongly with real GDP per capita, but we also see high correlations with Freedom from Corruption, Trade Freedom, and Monetary Freedom
Spain: There are no significant correlations with real GDP per capita, but Freedom from Corruption, Property Rights and Business Freedom show the highest correlations with real GDP per capita
France: There are no significant correlations between any factor and the real GDP per capita, but again we see that Freedom from Corruption and Property rights are the most correlated
Portugal: Property Rights and Freedom from Corruption both have significant correlations with real GDP per capita
USSR: In former USSR nations, Investment Freedom, and Freedom from Corruption all significantly correlate with real GDP per capita. There are also a number of high correlations between factors
Netherlands: Indonesia is the only country in this grouping, and therefore the results are not useful
Self-Ruling: In self-ruling nations, we once again see that Property Rights and Freedom from Corruption have
the most significant correlations with real GDP per capita
Full DatasetIncome
GroupingGeographic Groupings
Semi-Geographic Groupings
Colonization Groupings
Milestone Analysis

9696Proprietary & Confidential. © 2011, glendonTodd Capital LLC
Colonization routes proved to be a helpful way to look at the data and resulted in strong models
The UK groupings resulted in the best fitting models of the colonization groupings
UK (1) includes a large number of countries, including some in the Sub-Saharan and low income groupings, but still yields a model with a good fit, suggesting that colonization route may be the best way to group the countries
— Trade Freedom, Fiscal Freedom, Government Spending, Monetary Freedom, Financial Freedom, Property Rights, Freedom from Corruption, and Labor Freedom are significant
UK (2) also results in a model with a good fit
— Trade Freedom, Government Spending, Financial Freedom, Labor Freedom, and Freedom from Corruption are significant
The model for the countries colonized by Spain also resulted in a model with a good fit, though it the R2 was not
quite as high at 0.96. Only one factor was significant, Fiscal Freedom, which may result in less predictive value for the overall model
The grouping of countries colonized by France resulted in a model with an R2 0f 0.98. The model is also
parsimonious with Property Rights, Labor Freedom, and Investment Freedom being found to be significant
The USSR grouping resulted in a model with a good fit likely due to small number of homogeneous countries that comprised the group
Fiscal Freedom, Monetary Freedom, Investment Freedom, Labor Freedom, and Property Rights are significant
Portugal and the Netherlands do not have enough nations (1 and 2) to obtain meaningful results
The Self-Ruling grouping proved to be unhelpful as it consisted of such a wide variety of countries
Full DatasetIncome
GroupingGeographic Groupings
Semi-Geographic Groupings
Colonization Groupings
Milestone Analysis

9797Proprietary & Confidential. © 2011, glendonTodd Capital LLC
The UK and USSR colonization routes resulted in the strongest models, and Property Rights is the most important factor across the groupings
UK (1) UK (2) Spain France USSR Self-Ruling
Property Rights
Freedom from Corruption
Fiscal Freedom
Government Spending
Business Freedom
MonetaryFreedom
Trade Freedom
Investment Freedom
Financial Freedom
Full DatasetIncome
GroupingGeographic Groupings
Semi-Geographic Groupings
Colonization Groupings
Milestone Analysis

9898Proprietary & Confidential. © 2011, glendonTodd Capital LLC
Project Overview
Introduction to the Index
The Index of Economic Freedom
Changes in the Index
Other Metrics to Consider
Analysis of Existing Research
Data Collection Process
Data Analysis Process
GDP Forecast Models
Results and Conclusions
Agenda

9999Proprietary & Confidential. © 2011, glendonTodd Capital LLC
There is strong predictive value for real GDP per capita, but this does not translate into good predictive value of GDP growth
We used neural networks analysis to predict real GDP per capita for each country over the period from 1995 to
2012
We have used the analysis for the whole dataset, but have not yet run the analysis on the groupings
Using this analysis, the real GDP per capita predictions are within 5% of the actual value 84.5% of the time and within 2.5% 71.4% of the time
While you can back GDP growth out of the predictions of real GDP per capita, the predictions have much greater error
If GDP only grows by 2.0% and your error is 2.5%, your prediction could be off by over 100% of the actual growth
This could be a result of the large differences in the scale of the countries’ GDPs We moved away from growth because of the lower correlation to the factors and the lower predictive results,
so looking at absolute values may be a better way to find predictive value
We found better results for the GDP per capita growth when we used the groupings. The developed nations and the UK 2 groupings were particularly strong

100100Proprietary & Confidential. © 2011, glendonTodd Capital LLC
We will attempt to connect The Index and GDP growth by using Regression Trees and Nearest Neighbor
We will use our initial statistical discoveries as a foundation and attempt to implement new statistical techniques
to connect The Index and GDP growth
Instead of Neural Networks, we are now attempting to use two other statistical methods to predict GDP, Nearest
Neighbor and Regression Trees Nearest Neighbor takes the entire dataset and compares each country every year, looks at the current year for
predicting the next year’s GDP, and then determines if it is similar to and the level of similarity with a nation in
the dataset Regression Trees split the data into nodes based upon the predictor variables inputted prior to regressing the
data and output a value of the target variable based upon the input variables. They are “learned” by splitting
the source data into subsets based on an attribute value test and repeat on all derived subsets in a manner called recursive partitioning
The optimal regression tree for the target Total PPP Adjusted Value Added had an R2 of .776 with four terminal nodes The most significant input variables in this tree were Country, Business Freedom, Property Rights, GDP lag, and
Labor Freedom (in regressing order)
The optimal regression tree for the target Total GDP per Capita Valued Added had an R2 of 0.7 with 16 terminal
nodes The most significant input variables in this tree were Country, Year, Corruption, Semi-Geographical grouping,
Property Rights, Trade Freedom, GDP lag, and Government Spending (in regressing order)
The optimal regression tree for the target PPP Adjusted Value Added had an R2 of 0.76 with 15 terminal nodes The most significant input variables in this tree were Country, Semi-Geographic, Income, Property
101101Proprietary & Confidential. © 2011, glendonTodd Capital LLC
Project Overview
Introduction to the Index
The Index of Economic Freedom
Changes in the Index
Other Metrics to Consider
Analysis of Existing Research
Data Collection Process
Data Analysis Process
GDP Forecast Models
Results and Conclusions
Agenda

102102Proprietary & Confidential. © 2011, glendonTodd Capital LLC
Review of the Index and initial conclusions
Index Overview
The Index measures Economic Freedom through ten factors grouped into four broad categories:
Rule of Law— Property Rights— Freedom from Corruption
Limited Government— Fiscal Freedom— Government Spending
Regulatory Efficiency— Business Freedom— Labor Freedom
— Monetary Freedom Open Markets
— Investment Freedom
— Financial Freedom
Initial Conclusions
Our analysis is consistent with academic literature and shows that there is a connection
between economic growth and Economic Freedom that can be qualitatively and quantitatively measured
Long-term economic growth and Economic Freedom are clearly linked. However, our efforts
have not yet produced a model to quantitatively predict GDP

103103Proprietary & Confidential. © 2011, glendonTodd Capital LLC
We have seen a link between Economic Freedom and GDP growth and hope to be able to quantitatively predict this relationship
Our experiments agree with academic literature and show that there is a connection between economic growth
and Economic Freedom that can be qualitatively and quantitatively measured Elements of The Index correlate with growth as do the overall scores
Long-term economic growth and Economic Freedom are clearly linked. However, our efforts have not yet produced a model to quantitatively predict GDP
This lack of results is likely due to The Index’s short time-span and our limited knowledge of statistics. Measureable economic effects from political change often take years to be fully realized and short term growth can be spurred at the expense of economic freedom
Hopefully, with our new statistical methods, we will be able to achieve our goal. Regardless though, we have seen the linked relationship between Economic Freedom and economic growth
In order to accomplish these statistical concepts, we will need to outsource the statistical work on regression trees, neural networks, nearest neighbor and principle components
Once the appropriate person has been found, it will likely take a couple of weeks to perform the final analysis

104104Proprietary & Confidential. © 2011, glendonTodd Capital LLC
Regression analysis confirms that there is a correlation between GDP and the factors in the Index
Our initial regression analysis confirmed that factor scores and real GDP per capita would yield the best
models. We have used this approach to look for predictive value in attempting to create our model “Factor scores” exclude the Overall Score and Labor Freedom
The best way to test the type of data we have is to use a fixed effect model that can account for the fact that we have both multiple years and multiple countries The regression using the entire dataset was not very useful because it had a low R2
To attempt to correct this, we took the groupings we made during the Data Collection stage and applied correlations and regressions to them
On the whole, Property Rights and Freedom from Corruption tend to be the most frequent highly correlated factors to real GDP per capita in the different country groupings The smaller groupings resulted in better fitting models, with the more developed nations tending to have
better fitting models Overall, the Semi-geographic and Colonization groupings were the most useful
Our initial correlations and regressions focused on GDP growth and we found that the results were not very useful; our second set of regressions focused on actual Per Capita GDP numbers and we found significance. The issue with this analysis is that the academic consensus is to use GDP growth, since using actual levels
of GDP is considered less accurate Additionally, this analysis did not account for the momentum factor of GDP growth, thus overstating the
effect of the factors
Regression Analysis
Neural Networks
Regression Tree Analysis
Lagged Regression
Analysis
Principal Component
Analysis
Nearest Neighbor Analysis
Dislocation Analysis
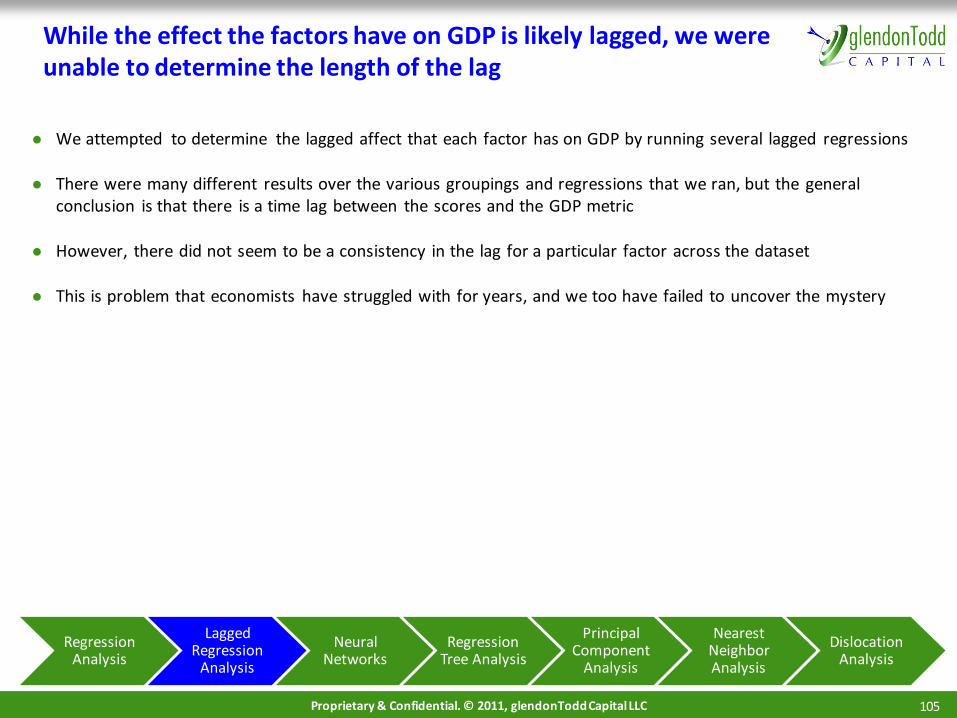
105105Proprietary & Confidential. © 2011, glendonTodd Capital LLC
While the effect the factors have on GDP is likely lagged, we were unable to determine the length of the lag
We attempted to determine the lagged affect that each factor has on GDP by running several lagged regressions
There were many different results over the various groupings and regressions that we ran, but the general conclusion is that there is a time lag between the scores and the GDP metric
However, there did not seem to be a consistency in the lag for a particular factor across the dataset
This is problem that economists have struggled with for years, and we too have failed to uncover the mystery
Regression Analysis
Neural Networks
Regression Tree Analysis
Lagged Regression
Analysis
Principal Component
Analysis
Nearest Neighbor Analysis
Dislocation Analysis

106106Proprietary & Confidential. © 2011, glendonTodd Capital LLC
While Neural Networks provided interesting results for absolute values of GDP per capita, the results for GDP growth did not prove useful
We used Neural Networks to predict real GDP per capita within 5% error 84.5% of the time and within 2.5% error
71.4% of the time
This data appears less useful when we “back-out” GDP growth rates from the GDP data. When growth rates are
determined, we see the percent growth is much less accurate For example, if GDP only grows at 2%, then a 5% error on the actual GDP number is not very useful
We did find some better results when we ran Neural Networks on the grouped datasets rather than the full data set For example, in Developed Nations we predicted GDP growth within 5%, 84% of the time
However, our approach here is flawed because the Neural Networks model, like your brain, learns and can memorize. We used the same dataset to both train and test, which gave us positively skewed results
When we had a training set and a testing set, the results had a much higher error rate. This is likely partly due to the fact that there was a much smaller amount of data for the model to train on
Finally, even if we obtain good results from this approach, it is ultimately a black box, and therefore will not be as useful going forward as some other type of numerical model
Regression Analysis
Neural Networks
Regression Tree Analysis
Lagged Regression
Analysis
Principal Component
Analysis
Nearest Neighbor Analysis
Dislocation Analysis

107107Proprietary & Confidential. © 2011, glendonTodd Capital LLC
Regression Trees did not prove to be as useful as we had anticipated in finding the milestones
The reason for using the regression trees was to find at what point a factor would be significant in predicting GDP.
This would give us insight into where the milestones may actually be
We ran several versions of the regression trees
The optimal regression tree for the target Total PPP Adjusted Value Added had an R2 of .77 with four terminal nodes— The most significant input variables in this tree were Country, Business Freedom, Property Rights, GDP lag,
and Labor Freedom (in regressing order) The optimal regression tree for the target Total GDP per Capita Valued Added had an R2 of 0.7 with 16 terminal
nodes
— The most significant input variables in this tree were Country, Year, Corruption, Semi-Geographical grouping, Property Rights, Trade Freedom, GDP lag, and Government Spending (in regressing order)
In summary, after running a number of Regression Trees we observe that predictions have large errors and groupings tend to simply fall along size creating a constant in the equation that dominates the model
Regression Analysis
Neural Networks
Regression Tree Analysis
Lagged Regression
Analysis
Principal Component
Analysis
Nearest Neighbor Analysis
Dislocation Analysis

108108Proprietary & Confidential. © 2011, glendonTodd Capital LLC
PCA confirms that the factors are correlated with GDP, but it does not result in a predictive model
Principal Component Analysis (PCA) attempts to identify the independent variables that explain the majority of the
variation in a dataset. It allows us to identify significant factors and countries that are outliers
Property Rights and Freedom from Corruption were found to be highly correlated, but all other factor scores were
found to be descriptive of the variation in the The high correlation between Property Rights and Freedom from Corruption suggests that we may need to
drop one of them from the analysis
PCA also allows for a visual analysis by plotting the distribution of the data This allows us to identify any outliers that may be throwing off the data
For example, when we use the whole dataset, the United States, China, and Japan, the countries with the highest GDP, tend to be outliers
After running it again without these outliers, we see that Zimbabwe and Belarus tend to be outliers in this new
dataset
While this does not give us any concrete way to proceed it does confirm our prior conclusions
Regression Analysis
Neural Networks
Regression Tree Analysis
Lagged Regression
Analysis
Principal Component
Analysis
Nearest Neighbor Analysis
Dislocation Analysis
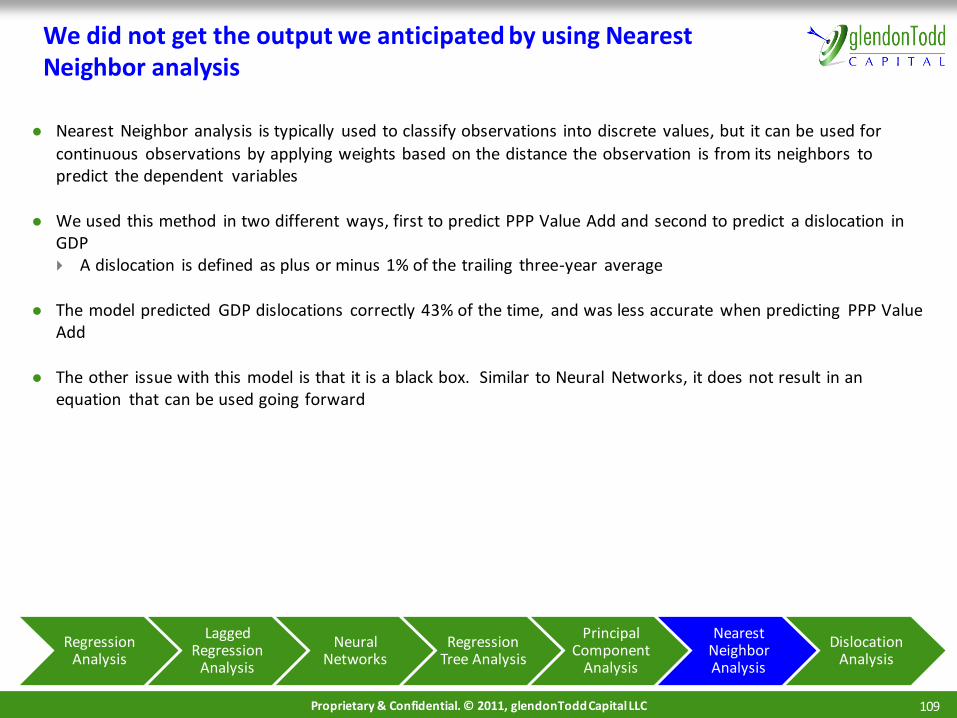
109109Proprietary & Confidential. © 2011, glendonTodd Capital LLC
We did not get the output we anticipated by using Nearest Neighbor analysis
Nearest Neighbor analysis is typically used to classify observations into discrete values, but it can be used for
continuous observations by applying weights based on the distance the observation is from its neighbors to predict the dependent variables
We used this method in two different ways, first to predict PPP Value Add and second to predict a dislocation in GDP A dislocation is defined as plus or minus 1% of the trailing three-year average
The model predicted GDP dislocations correctly 43% of the time, and was less accurate when predicting PPP Value Add
The other issue with this model is that it is a black box. Similar to Neural Networks, it does not result in an equation that can be used going forward
Regression Analysis
Neural Networks
Regression Tree Analysis
Lagged Regression
Analysis
Principal Component
Analysis
Nearest Neighbor Analysis
Dislocation Analysis

110110Proprietary & Confidential. © 2011, glendonTodd Capital LLC
Dislocation analysis has had the most promising results, though more analysis needs to be done
We have defined a dislocation as plus or minus 1% of the trailing 3-year average, trailing 5-year average or long-
term average
Then using the full dataset we looked at the changes in the factor scores to determine whether a positive or
negative change in the score resulted in a dislocation Using the whole dataset we have not found any significant patterns
Looking at the groupings, we got slightly better results In general, positive factor score changes tended to lead to positive dislocations more frequently than a
negative score led to a negative dislocation
Property Rights was one of the most consistent in predicting a dislocation above the long-term average In the Middle East grouping, a negative change in Financial Freedom results in a negative dislocation 62% of the
time
— This is the only case in where a negative change is significant
Many of the types of analysis we have used throughout the process are better suited for categorizing data, and
therefore may be more useful for analyzing the dislocations in GDP than they were for actually predicting a GDP metric This week we have made some progress using classification trees to “predict” a positive or negative dislocation
Regression Analysis
Neural Networks
Regression Tree Analysis
Lagged Regression
Analysis
Principal Component
Analysis
Nearest Neighbor Analysis
Dislocation Analysis
111111Proprietary & Confidential. © 2011, glendonTodd Capital LLC
Having found a link between economic freedom and GDP, we need to further look into dislocations in GDP
Our analysis is consistent with academic literature and shows that there is a connection between economic
growth and Economic Freedom that can be qualitatively and quantitatively measured
Long-term economic growth and Economic Freedom are clearly linked. However, our efforts have not yet
produced a model to quantitatively predict GDP or dislocations in GDP
The most promising aspects so far have been looking at dislocations in order to classify the data
Many of the tools we have been using were originally designed for classification, so we may be able to re-run some of the analysis and look for dislocations
This lack of results may be due to the Index’s short time-span and lack of granularity in the data, that measureable economic effects from political change often take years to be fully realized, and/or short term growth can be spurred at the expense of economic freedom
112112Proprietary & Confidential. © 2011, glendonTodd Capital LLC
Next steps include finishing the classification tree analysis, analyzing the Frasier Index, and utilizing Enterra Solutions
The focus going forward will be on dislocations We may need to look into different ways of defining the dislocation in order to determine what the best
definition
Determine if there is anything else we could use to augment the index We have considered adding political or financial stability, but have as of yet been unable to find a good data
source
The Frasier Index may provide a way for us to test the robustness of our analysis
Additionally, one of the founders of the Frasier Index is now at SMU and may prove to be a very useful resource if we choose to use the Frasier Index for further analysis
Partnering with Enterra may be able to create a mosaic that would be useful to glendonTodd, CPGs, the Commerce Department, and others The system could comb the laws, media, social media, consumer behavior and other things in order to look
at the milestones in each factor and gain insights on the trends that we are not able to obtain through our simple statistical analysis
Ideally we would have a product that would enable us to better judge which countries to enter and when to
exit a particular country

113113Proprietary & Confidential. © 2011, glendonTodd Capital LLC
Appendix

114114Proprietary & Confidential. © 2011, glendonTodd Capital LLC
Research Phase Appendix
115115Proprietary & Confidential. © 2011, glendonTodd Capital LLC
Property Rights: Sourcing
The Index uses three primary sources for determining its data on Property Rights (in order of priority):
Economist Intelligence Unit: Country Report 2008-2011 Economist Intelligence Unit: Country Commerce 2008-2011 U.S. Department of Commerce: Commercial Guide 2008-2011
U.S. Department of State: Country Reports on Human Rights Practices 2008-2011
The Index also uses various news and magazine articles to supplement these sources
As such, even though the score for this section is scored on a 0 to 100 basis, as every factor in The Index is, the data gathered here is difficult to quantify. These reports state the degree to which Property Rights exist and are
enforced and it is The Index that synthesizes the information and gives it a quantitative value

116116Proprietary & Confidential. © 2011, glendonTodd Capital LLC
Freedom From Corruption: Sourcing
The Index uses several sources to obtain data for its Freedom from Corruption metric:
Transparency International, Corruption Perceptions Index 2010 U.S. Department of Commerce, Country Commercial Guide 2008-2011 Economist Intelligence Unit, Country Commerce 2008-2011
Economist Intelligence Unit, Country Report 2008-2011 Office of the U.S. Trade Representative, 2011 National Trade Estimate on Foreign Trade Barriers Official government publications
The following nine nations are excluded from the CPI index and require the use of the other sources: Belize
Burma The Bahamas Fiji
Micronesia North Korea Saint Lucia
Saint Vincent and the Grenadines Suriname

117117Proprietary & Confidential. © 2011, glendonTodd Capital LLC
Fiscal Freedom: Sourcing
The following sources were used to determine tax data (in order of priority):
Deloitte: International Tax and Business Guide Highlights International Monetary Fund: Staff Country Report, “Selected Issues and Statistical Appendix” 2008-2011 International Monetary Fund: Staff Country Report, “Article IV Consultation” 2008-2011
PricewaterhouseCoopers: Worldwide Tax Summaries 2008-2011 Countries’ Investment Agencies Embassy Confirmations
Countries’ Treasury or Tax Authority Economist Intelligence Unit: Country Report 2008-2011 Economist Intelligence Unit: Country Profile 2008-2011
Economist Intelligence Unit: Country Commerce 2008-2011 Economist Intelligence Unit: Country Finance 2008-2011
The following sources were used to determine tax revenue as a percentage of GDP (in order of priority): Organisation for Economic Co-operation and Development Data Eurostat, Government Finance Statistics Data
African Development Bank and Organisation for Economic CO-operation and Development, African Economic Outlook 2011
International Monetary Fund, Staff Country Report “Selected Issues” 2008-2011
International Monetary Fund, Staff Country Report “Article IV Consultation) 2008-2011 Asian Development Bank, Key Indicators for Asia and the Pacific 2008-2011 World Trade Organization, Trade Policy Reviews 2008-2011
Official Government Publications of each country Individual Contacts from government agencies and multinational organizations (IMF/World Bank)
Source: Heritage Foundation’s 2012 Index of Economic Freedom, Methodology

118118Proprietary & Confidential. © 2011, glendonTodd Capital LLC
Government Spending: Sourcing
The following sources were used to determine Government Spending data (in order of priority):
Organisation for Economic Co-operation and Development data Eurostat data African Development Bank and Organisation for Economic Co-operation and Development, African Economic
Outlook 2011 International Monetary Fund, Staff Country Report “Selected Issues and Statistical Appendix” 2008-2011 International Monetary Fund, Staff Country Report “Article IV Consultation” 2008-2011
Asian Development Bank, Key Indicators for Asia and the Pacific 2008-2011 African Development Bank, Selected Statistics on African Countries 2010 Official government publications of each country
Economist Intelligence Unit, Country Report 2008-2011 Economist Intelligence Unit, Country Profile 2008-2011

119119Proprietary & Confidential. © 2011, glendonTodd Capital LLC
Business Freedom: Ease of Starting a Business
Procedures (number)
Time (days)Cost (% of income
per capita)
Paid-in Min. Capital (% of income per
capita)
Mean 7.4 30.6 36.0 48.8
Median 7.0 18.0 12.7 0.0
Minimum 1.0 1.0 0.0 0.0
Maximum 21.0 694.0 551.4 584.2
Bottom Quartile 10.0 39.0 48.6 35.8
Top Quartile 5.0 8.0 3.1 0.0

120120Proprietary & Confidential. © 2011, glendonTodd Capital LLC
Business Freedom: Dealing with Licensing
Procedures (number) Time (days)Cost (% of income per
capita)
Mean 15.8 192.6 389.3
Median 14.5 169.0 107.8
Minimum 5.0 26.0 1.1
Maximum 51.0 1129.0 6154.3
Bottom Quartile 19.6 246.6 459.5
Top Quartile 11.0 109.6 29.3

121121Proprietary & Confidential. © 2011, glendonTodd Capital LLC
Business Freedom: Resolving Insolvency
Time (years) Cost (% of estate)Recovery rate (cents on the
dollar)
Mean 2.9 16.3 34.5
Median 2.8 15.0 30.6
Minimum 0.4 1.0 0.0
Maximum 8.0 76.0 92.7
Bottom Quartile 4.0 23.0 14.8
Top Quartile 1.7 8.0 52.4

122122Proprietary & Confidential. © 2011, glendonTodd Capital LLC
Non-Tariff Barriers
Price Restrictions: Price Fixing: The government sets a certain price floor or ceiling for a product, or it sets a specific price for which the good or
service must be sold Antidumping Duties: Taxes levied on imports to prevent imports with lower prices than the industry within the nation is able
to produce the same good or service for Countervailing Duties: Import taxes levied to neutralize foreign subsidies used to produce imports at a lower cost Border Tax Adjustments: Taxes levied in carbon-taxing countries on imports from non-carbon-taxing countries to tax carbon
use in production Variable Levies: A variable levy on imports that raises the price of the important to at least the domestic price Variable Tariff Rate Quotas: Combines variable levies and quotas, the tariff rate changes depending upon the number of
imported goods; it is generally lower for a certain quota of imports and rises with an increase in imports to protect the nat ional industry
Regulatory Restrictions: Licensing: Regulations require businesses producing or importing a good or service to obtain a license certifying their ability to
do so Domestic Content and/or Mixing Requirements: Requirements that foreign producers maintain a certain level of production
within the nation Sanitary and Phytosanitary Standards: Regulation concerning sanitation during production and transportation, can be applied
to imports, requiring importing producers to comply with the same rules as internal producers Safety and Industrial Standards Regulations: Safety regulations on production and business practices within a nation can be
levied on importing producers Packaging Regulations: Regulations controlling packaging within a nation apply to internal and importing producers Labeling Regulations: Regulations controlling labeling within a nation apply to internal and importing producers Trademark Regulations: Trademark regulations award trademarks to individuals and companies and are enforced on all
imports as well as domestic production Advertising and Media Regulations: Advertising and media regulations restrict the actions that can be taken by national and
importing producers to advertise their product
Source: Heritage Foundation’s 2012 Index of Economic Freedom, Methodology
Rule of Law Open MarketsLimited Government Regulatory Efficiency

123123Proprietary & Confidential. © 2011, glendonTodd Capital LLC
Non-Tariff Barriers
Quantity Restrictions: Import Quotas: A numerical limit on the amount of a good or service that can be imported Export Limitations: A numerical limit on the amount of a good or service that can be exported to specific nations Export Restraints: A numerical limit on the amount of a good or service that can be exported Trade Embargoes or Bans: Bans on trading goods (importing from and exporting to) specific countries Countertrade: Exchanging goods and services for other goods and services (not money)
Investment Restrictions: Exchange Controls: Exchange controls encompass a variety of policies that restrict the ownership of foreign currencies by
residents of a nation and restrict the ownership of the national currency by non-residents. They include specific bans on ownership and use of foreign currency within the nation, exchange restrictions, fixed exchange rates, and limits on currency export
Financial Controls: Financial controls restrict the financial actions individuals can make. They include restrictions upon making investments by certain individuals. They can be focused on foreign individuals or simply separate sectors of the economy and restrict how financial investment occurs
Customs Restrictions: Advance Deposit Requirements: Requirements that importers deposit tariff amounts before attempting to import into a
nation Customs Valuation Procedures: Procedures whereby customs officials assign a value to a good being imported and levy a tariff
based upon the valuation Customs Classification Procedures: Procedures whereby customs officials classify imports and levy a tariff based upon the
classification Customs Clearance Procedures: Procedures whereby imports and importers clear customs after paying import taxation
Direct Government Intervention: Subsidies: Government policies that pay domestic producers of certain goods and services a specific amount for their
production, allowing these producers to price their goods and services lower than they could normally
Source: Heritage Foundation’s 2012 Index of Economic Freedom, Methodology
Rule of Law Open MarketsLimited Government Regulatory Efficiency

124124Proprietary & Confidential. © 2011, glendonTodd Capital LLC
Non-Tariff Barriers
Direct Government Intervention (continued): Aid: Policies that provide monetary aid to supporting industries, independent of production, in contrast to subsidies Industrial Policy: Governmental policy whereby industrial stimulus is provided to domestic producers Regional Development Measures: Government policy undertaken to stimulate development of regions Government Financed Research: Government policies finance domestic research Technology Policies: Government policies concerning technology, including research, limitations on export, and subsidies National Taxes and Social Insurance: Government policy to support the well-being of its residents through social insurance,
and policies that tax the nation to provide services Competition Policies: Government policies that create monopolies or restrict them Immigration Policies: Government policies that restrict or allow the movement of people across its borders Government Procurement Policies: Government Policies that determine how the government purchases goods and services,
often contain restrictions limiting them to domestic producers State Trading: Government activity in trading Government Monopolies: Enterprises owned by the government or part of the government that have a mandated ownership
of a market that cannot be breached by domestic or foreign producers Government Exclusive Franchises: Similar to government monopolies, these are areas where the government has the sole
right to operate in a market
Source: Heritage Foundation’s 2012 Index of Economic Freedom, Methodology
Rule of Law Open MarketsLimited Government Regulatory Efficiency

125125Proprietary & Confidential. © 2011, glendonTodd Capital LLC
Velocity of Money: Methodology
Vt = velocity of money for all transactions nT = nominal value of all transactions contributing towards GDP M = money supply
P = price level T = real aggregate value of transactions V = velocity of money for GDP
nQ = nominal GDP
The first and third equations show the two different methods for calculating Velocity of Money, either by using
transactions or by using GDP
The second equation shows a method for determining the nominal value of transactions using the price level
and the aggregate value of transactions
Source: Heritage Foundation’s 2012 Index of Economic Freedom, Methodology; http://www.econbrowser.com/archives/2010/12/velocity_of_mon.htmly
M
nQV
TPnT
M
nTVt
: 2 Method
:1 Method
Percentage of Population Paying Income Taxes
Velocity of Money Public Debt-to-GDP Ratio Household Debt
126126Proprietary & Confidential. © 2011, glendonTodd Capital LLC
Business Freedom: Sourcing
The following sources were used to determine Business Freedom (in order of priority):
World Bank, Doing Business 2012 Economist Intelligence Unit, Country Report 2008-2011 Economist Intelligence Unit, Country Commerce 2008-2011
U.S. Department of Commerce: Country Commercial Guide 2008-2011 Government publications of individual countries
For 176 out of the 184 countries in The Index, the only data used was the World Bank’s Doing Business 2012 report.
The other eight countries (Barbados, Burma, Cuba, North Korea, Libya, Macau, Malta, and Turkmenistan) required the use of the other sources to determine their score. The Index used this additional data to create scores for these countries in line with the scores that the Doing Business 2012 report gave out
Source: Heritage Foundation’s 2012 Index of Economic Freedom, Methodology

127127Proprietary & Confidential. © 2011, glendonTodd Capital LLC
Labor Freedom: Sourcing
Sources for the data for Labor Freedom (in order of priority):
World Bank, Doing Business 2012 Economist Intelligence Unit, Country Report 2008-2011 Economist Intelligence Unit, Country Commerce 2008-2011
U.S. Department of Commerce, Country Commercial Guide 2008-2011 Official Government Publications
The primary source of information was the World Bank’s Doing Business 2012 report. The other sources were used when there was insufficient data from the World Bank

128128Proprietary & Confidential. © 2011, glendonTodd Capital LLC
Labor Freedom: World Bank’s Doing Business 2012 Report
Since 2009, The World Bank Group has temporarily stopped including Employing Workers as a factor in the
aggregate ranking of an economy’s ease of doing business
The World Bank Group is working with a consultative group to research the Employing Workers methodology in
hopes of deriving an improved model for measuring regulations of employment in the future
Data regarding the rigidity of employment based on a detailed survey of employment regulations, completed by
local lawyers and public officials, was still included in an annex report, just not as a factor in the ease of doing business rankings, therefore the Heritage Foundation was able to obtain the data and calculate the factor as usual
The minimum wage ratio calculations were modified to ensure that no country could receive a high score from the lack of a minimum wage, a regulatory mechanism for minimum wage instead of a stated rate, a customary minimum wage not stated in the law, or a minimum wage that exists but is not enforced in practice
A threshold was installed for paid annual lead and a ceiling for working days allowed per week to ensure that no country is rewarded in excess in either of these areas
The calculations of redundancy cost and annual leave period were changed to calculate the average value of each for a worker with one, five, and ten years of tenure, rather than simply 20 years
Source: “Employing Workers Methodology” in Doing Business 2012 by The World Bank

129129Proprietary & Confidential. © 2011, glendonTodd Capital LLC
Sources for the data for Monetary Freedom include:
International Monetary Fund, International Financial Statistics Online International Monetary Fund, World Economic Outlook, April 2011 Economist Intelligence Unit, Country Report, 2006–2011
Other official government publications of each country
Monetary Freedom: Sourcing
Sources: Price Controls in The Concise Encyclopedia of Economics and Heritage Foundation’s 2012 Index of Economic Freedom Methodology
130130Proprietary & Confidential. © 2011, glendonTodd Capital LLC
Trade Freedom: Sourcing
The following sources were used to determine trade data (in order of priority):
World Bank, World Development Indicators 2011 World Trade Organization, Trade Policy Review 1995-2011 Office of the U.S. Trade Representative, 2011 National Trade Estimate Report on Foreign Trade Barriers
World Bank, Doing Business 2011 and 2012 U.S. Department of Commerce, Country Commercial Guide 2008-2011 Economist Intelligence Unit, Country Report 2008-2011
Economist Intelligence Unit, Country Commerce 2008-2011 World Bank, Data on Trade and Import Barriers: Trends in Average Applied Tariff Rates in Developing and
Industrial Countries 1981-2009
Official government Publications
Tariff data is more difficult to obtain than most other data. For this section, if the trade-weighted average was
not available then The Index used the average applied tariff rate or the simple average of most favored nation tariff rates. Additionally, if no data on duties or customs revenues were available, then The Index used international trade taxes or estimated effective tariff rates. Most data came from the World Bank, but when
circumstances like those mentioned here dictated it, The Index used data from the other sources in the list
Source: Heritage Foundation’s 2012 Index of Economic Freedom, Methodology

131131Proprietary & Confidential. © 2011, glendonTodd Capital LLC
Investment Freedom: Sourcing
The following sources were used to determine Investment Freedom (in order of priority):
Official Government Publications Economist Intelligence Unit, Country Commerce 2008-2011 Economist Intelligence Unit, Country Report 2008-2011
Office of the U.S. Trade Representative, 2011 National Trade Estimate Report on Foreign Trade Barriers U.S. Department of Commerce, Country Commercial Guide 2008-2011
Source: Heritage Foundation’s 2012 Index of Economic Freedom, Methodology

132132Proprietary & Confidential. © 2011, glendonTodd Capital LLC
Financial Freedom: Sourcing
The following sources were used to determine Financial Freedom data (in order of priority):
Economist Intelligence Unit, Country Commerce 2008-2011 Economist Intelligence Unit, Country Finance 2008-2011 Economist Intelligence Unit, Country Report 2008-2011
International Monetary Fund, Staff Country Report “Selected Issues” 2008-2011 International Monetary Fund, Staff Country Report “Article IV Consultation” 2008-2011 Organisation for Economic Co-operation and Development, Economic Survey
Official government publications U.S. Department of Commerce, Country Commercial Guide 2008-2011 Office of the U.S. Trade Representative, 2011 National Trade Estimate Report on Foreign Trade Barriers
U.S. Department of State, Investment Climate Statements 2008-2011 World Bank, World Development Indicators 2011 Various news stories on banking and finance
Various magazine articles on banking and finance
133133Proprietary & Confidential. © 2011, glendonTodd Capital LLC
Data Collection Phase Appendix
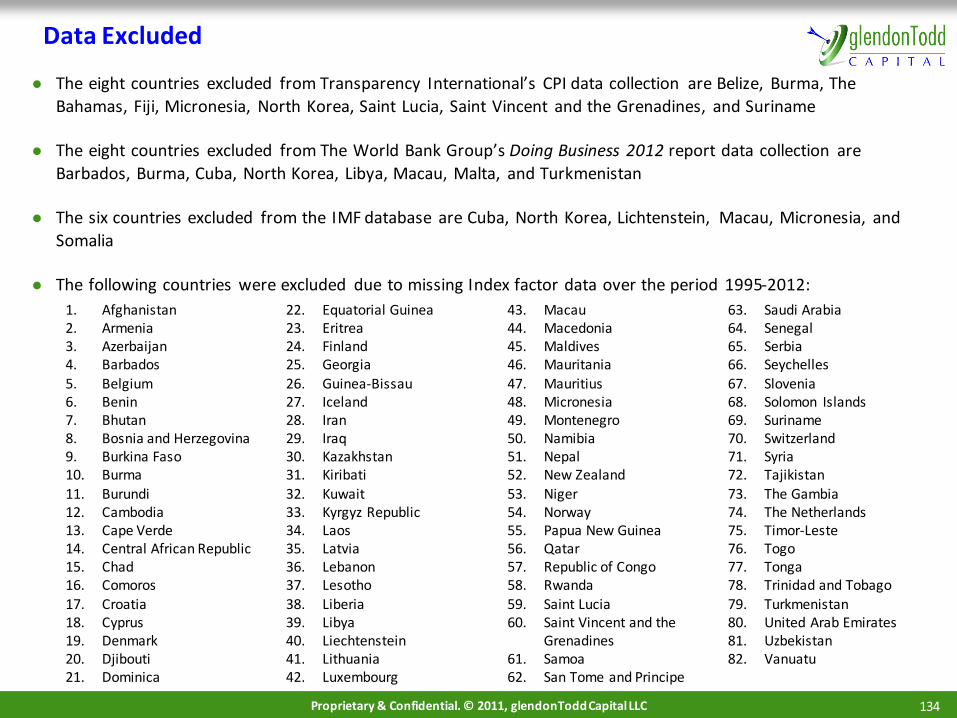
134134Proprietary & Confidential. © 2011, glendonTodd Capital LLC
Data Excluded
The eight countries excluded from Transparency International’s CPI data collection are Belize, Burma, The
Bahamas, Fiji, Micronesia, North Korea, Saint Lucia, Saint Vincent and the Grenadines, and Suriname
The eight countries excluded from The World Bank Group’s Doing Business 2012 report data collection are
Barbados, Burma, Cuba, North Korea, Libya, Macau, Malta, and Turkmenistan
The six countries excluded from the IMF database are Cuba, North Korea, Lichtenstein, Macau, Micronesia, and
Somalia
The following countries were excluded due to missing Index factor data over the period 1995-2012:
1. Afghanistan2. Armenia3. Azerbaijan4. Barbados
5. Belgium6. Benin7. Bhutan8. Bosnia and Herzegovina9. Burkina Faso10. Burma11. Burundi12. Cambodia13. Cape Verde14. Central African Republic15. Chad16. Comoros
17. Croatia18. Cyprus19. Denmark20. Djibouti21. Dominica
22. Equatorial Guinea23. Eritrea24. Finland25. Georgia
26. Guinea-Bissau27. Iceland28. Iran29. Iraq30. Kazakhstan31. Kiribati32. Kuwait33. Kyrgyz Republic34. Laos35. Latvia36. Lebanon37. Lesotho
38. Liberia39. Libya40. Liechtenstein41. Lithuania42. Luxembourg
43. Macau44. Macedonia45. Maldives46. Mauritania
47. Mauritius48. Micronesia49. Montenegro50. Namibia51. Nepal52. New Zealand53. Niger54. Norway55. Papua New Guinea56. Qatar57. Republic of Congo58. Rwanda
59. Saint Lucia60. Saint Vincent and the
Grenadines61. Samoa62. San Tome and Principe
63. Saudi Arabia64. Senegal65. Serbia66. Seychelles
67. Slovenia68. Solomon Islands69. Suriname70. Switzerland71. Syria72. Tajikistan73. The Gambia74. The Netherlands75. Timor-Leste76. Togo77. Tonga78. Trinidad and Tobago
79. Turkmenistan80. United Arab Emirates81. Uzbekistan82. Vanuatu

135135Proprietary & Confidential. © 2011, glendonTodd Capital LLC
We based our Country Classifications on The World Bank data
The World Bank’s main criterion for classifying a country’s economy is gross national income (GNI) per capita
Every economy is classified as low income, lower middle income, upper middle income, or high income based on their GNI per capita These income categories are based on the Bank’s operational lending categories (civil works preferences,
IDA eligibility, etc.). These were established due to a need for the establishment of comparative estimates of economic capacity that would give poorer countries better conditions from the Bank
GNI is considered to be the best single indicator of economic capacity and progress, but it is recognized that GNI alone does not determine the welfare or success of a country’s people or economic development
The per capita income thresholds were originally established by the Bank by identifying a stable relationship between a summary measure of well-being such as poverty incidence and economic variables such as GNI per capita, but are altered annually in order to remain consistent over time by accounting for factors such as
inflation Income classifications are set annually on July 1
Groups based on geographical region are also used but only for those countries classified as “developing economies,” i.e. low and middle income economies
Classifying Countries: The World Bank
Sources: http://data.worldbank.org/about/country-classifications/a-short-history and http://data.worldbank.org/about/country-classifications

136136Proprietary & Confidential. © 2011, glendonTodd Capital LLC
The World Bank groups the countries based on income and geography for operational and analytical
purposes:1. Income Group (per capita)
— Low income: $1,005 or less (35)
— Lower middle income: $1,006 - $3,975 (56)— Upper middle income: $3,976 - $12,275 (54)— High income: $12,276 or more (70)
2. Geographic Region (developing only)— East Asia and Pacific (24)— Europe and Central Asia (23)
— Latin America and the Caribbean (30)— Middle East and North Africa (13)— South Asia (8)
— Sub-Saharan Africa (48)
Since the World Bank’s Geographic Regions classification only includes developing nations, we altered the
groupings and added in the developed nations in different ways to achieve three groupings1. We combined the East Asia, South Asia, and Central Asia of the World Bank classifications into Asia & The
Pacific. We added the developed nations into the groups based upon location to achieve Geographic
Classification2. We added the OECD nations in their own category, developed. We changed the East Asia, South Asia, and
Central Asia classifications of The World Bank into Central Asia & Eastern Europe and East Asia & The
Pacific to achieve Semi-Geographic Classification3. We divided the nations by their primary colonizer, focusing on influence of law. England’s colonies are
divided into categories to reflect the different colonization strategies in each area. Group (1) follows the
extractive patterns typical of colonization while Group (2) colonies developed more inclusive institutions
Country Classification Groups
Sources: http://data.worldbank.org/about/country-classifications/a-short-history and http://data.worldbank.org/about/country-classifications

137137Proprietary & Confidential. © 2011, glendonTodd Capital LLC
Income Classification
Sources: http://data.worldbank.org/about/country-classifications/country-and-lending-groups
Income Classifications
Low Income Lower Middle Income Upper Middle Income Upper Income
12 25 28 26
Bangladesh Bolivia Albania Australia
Ethiopia Cameroon Algeria Austria
Guinea Ivory Coast Argentina Bahrain
Haiti Egypt Belarus Canada
Kenya El Salvador Botswana Czech Republic
Madagascar Ghana Brazil Estonia
Malawi Guatemala Bulgaria France
Mali Guyana Chile Germany
Mozambique Honduras China Greece
Tanzania India Colombia Hong Kong
Uganda Indonesia Costa Rica Hungary
Zimbabwe Moldova Dominican Republic Ireland
Mongolia Ecuador Israel
Morocco Gabon Italy
Nicaragua Jamaica Japan
Nigeria Jordan South Korea
Pakistan Malaysia Oman
Paraguay Mexico Poland
The Philippines Panama Portugal
Sri Lanka Peru Singapore
Swaziland Romania Slovakia
Ukraine Russia Spain
Vietnam South Africa Sweden
Yemen Thailand Taiwan
Zambia Tunisia United Kingdom
Turkey United States
Uruguay
Venezuela

138138Proprietary & Confidential. © 2011, glendonTodd Capital LLC
Geographic Classification
Sources: http://data.worldbank.org/about/country-classifications/country-and-lending-groups
Asia & The Pacific Europe Americas
Middle East and
North Africa Sub-Saharan Africa
17 21 23 11 19
Australia Albania Argentina Algeria Botswana
Bangladesh Austria Bolivia Bahrain Cameroon
China Belarus Brazil Egypt Ivory Coast
Hong Kong Bulgaria Canada Israel Ethiopia
India Czech Republic Chile Jordan Gabon
Indonesia Estonia Colombia Morocco Ghana
Japan France Costa Rica Oman Guinea
Malaysia Germany Dominican Republic Pakistan Kenya
Mongolia Greece Ecuador Turkey Madagascar
The Philippines Hungary El Salvador Tunisia Malawi
Russia Ireland Guatemala Yemen Mali
Singapore Italy Guyana Mozambique
South Korea Moldova Haiti Nigeria
Sri Lanka Poland Honduras South Africa
Taiwan Portugal Jamaica Swaziland
Thailand Romania Mexico Tanzania
Vietnam Slovakia Nicaragua Uganda
Spain Panama Zambia
Sweden Paraguay Zimbabwe
Ukraine Peru
United Kingdom United States
Uruguay
Venezuela
Geographic Classifications

139139Proprietary & Confidential. © 2011, glendonTodd Capital LLC
Semi-Geographic Classification
Sources: http://data.worldbank.org/about/country-classifications/country-and-lending-groups
Semi-Geographic Classification
Developed Sub-Saharan Africa
East Asia & The
Pacific Middle East
Eastern Europe &
Central Asia Americas
23 20 9 10 8 21
Australia Botswana Bangladesh Algeria Albania Argentina
Austria Cameroon China Bahrain Belarus Bolivia
Canada Ivory Coast India Egypt Bulgaria Brazil
Czech Republic Ethiopia Indonesia Israel Moldova Chile
Estonia Gabon Japan Jordan Mongolia Colombia
France Ghana Sri Lanka Morocco Romania Costa Rica
Germany Guinea Thailand Oman Russia Dominican Republic
Greece Kenya The Philippines Pakistan Ukraine Ecuador
Hong Kong Madagascar Vietnam Turkey El Salvador
Hungary Malawi Yemen Guatemala
Ireland Mali Guyana
Italy Mozambique Haiti
Malaysia Nigeria Honduras
Poland South Africa Jamaica
Portugal Swaziland Mexico
Singapore Tanzania Nicaragua
Slovakia Tunisia Panama
South Korea Uganda Paraguay
Spain Zambia Peru
Sweden Zimbabwe Uruguay
Taiwan Venezuela
United Kingdom
United States

140140Proprietary & Confidential. © 2011, glendonTodd Capital LLC
Colonization Classification
United Kingdom United Kingdom (2) Spain France Portugal
Russia (Former
U.S.S.R.) Netherlands
N/A (Primarily Self-
Ruling)
20 8 18 11 2 4 1 27
Bahrain Australia Argentina Algeria Brazil Belarus Indonesia Albania
Bangladesh Botswana Bolivia Cameroon Mozambique Estonia Austria
Egypt Canada Chile Gabon Moldova Bulgaria
Ghana Hong Kong Colombia Guinea Ukraine China
Guyana Ireland Costa Rica Haiti Czech Republic
India Singapore Dominican Republic Ivory Coast Ethiopia
Jamaica South Africa Ecuador Madagascar France
Jordan United States El Salvador Mali Germany
Kenya Guatemala Morocco Greece
Malawi Honduras Tunisia Hungary
Malaysia Mexico Vietnam Israel
Nigeria Nicaragua Italy
Oman Panama Japan
Pakistan Paraguay Mongolia
Sri Lanka Peru Poland
Swaziland The Philippines Portugal
Tanzania Uruguay Romania
Uganda Venezuela Russia
Zambia Slovakia
Zimbabwe South Korea
Spain
Sweden
Taiwan
Thailand
Turkey
United Kingdom
Yemen
Most Recent Colonial Ruler (if Applicable)

141141Proprietary & Confidential. © 2011, glendonTodd Capital LLC
Data Analysis Phase Appendix
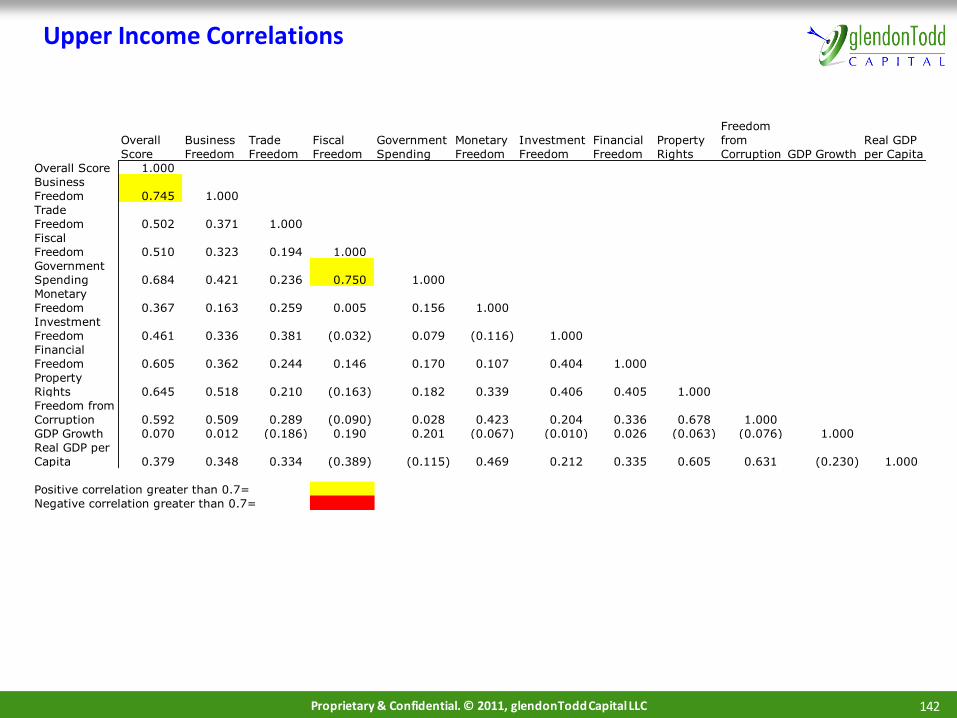
142142Proprietary & Confidential. © 2011, glendonTodd Capital LLC
Upper Income Correlations
Overall
Score
Business
Freedom
Trade
Freedom
Fiscal
Freedom
Government
Spending
Monetary
Freedom
Investment
Freedom
Financial
Freedom
Property
Rights
Freedom
from
Corruption GDP Growth
Real GDP
per Capita
Overall Score 1.000
Business
Freedom 0.745 1.000
Trade
Freedom 0.502 0.371 1.000
Fiscal
Freedom 0.510 0.323 0.194 1.000
Government
Spending 0.684 0.421 0.236 0.750 1.000
Monetary
Freedom 0.367 0.163 0.259 0.005 0.156 1.000
Investment
Freedom 0.461 0.336 0.381 (0.032) 0.079 (0.116) 1.000
Financial
Freedom 0.605 0.362 0.244 0.146 0.170 0.107 0.404 1.000
Property
Rights 0.645 0.518 0.210 (0.163) 0.182 0.339 0.406 0.405 1.000
Freedom from
Corruption 0.592 0.509 0.289 (0.090) 0.028 0.423 0.204 0.336 0.678 1.000
GDP Growth 0.070 0.012 (0.186) 0.190 0.201 (0.067) (0.010) 0.026 (0.063) (0.076) 1.000
Real GDP per
Capita 0.379 0.348 0.334 (0.389) (0.115) 0.469 0.212 0.335 0.605 0.631 (0.230) 1.000
Positive correlation greater than 0.7=
Negative correlation greater than 0.7=

143143Proprietary & Confidential. © 2011, glendonTodd Capital LLC
Upper-Middle Income Correlations
Overall
Score
Business
Freedom
Trade
Freedom
Fiscal
Freedom
Government
Spending
Monetary
Freedom
Investment
Freedom
Financial
Freedom
Property
Rights
Freedom
from
Corruption
GDP
Growth
Real GDP
per Capita
Overall Score 1.000
Business
Freedom 0.607 1.000
Trade
Freedom 0.290 0.082 1.000
Fiscal
Freedom 0.367 0.047 0.247 1.000
Government
Spending 0.394 0.033 (0.016) 0.313 1.000
Monetary
Freedom 0.624 0.305 (0.002) 0.324 0.400 1.000
Investment
Freedom 0.603 0.375 0.073 0.038 0.060 0.115 1.000
Financial
Freedom 0.584 0.356 0.042 0.021 0.060 0.186 0.537 1.000
Property
Rights 0.669 0.501 0.133 (0.040) 0.032 0.108 0.445 0.376 1.000
Freedom from
Corruption 0.653 0.358 0.067 0.039 0.068 0.396 0.267 0.235 0.593 1.000
GDP Growth (0.116) (0.162) (0.054) 0.097 0.022 0.098 (0.231) (0.168) (0.174) 0.003 1.000
Real GDP per
Capita 0.237 0.159 0.331 0.057 0.062 0.083 (0.001) 0.027 0.247 0.283 (0.088) 1.000
Positive correlation greater than 0.7=
Negative correlation greater than 0.7=
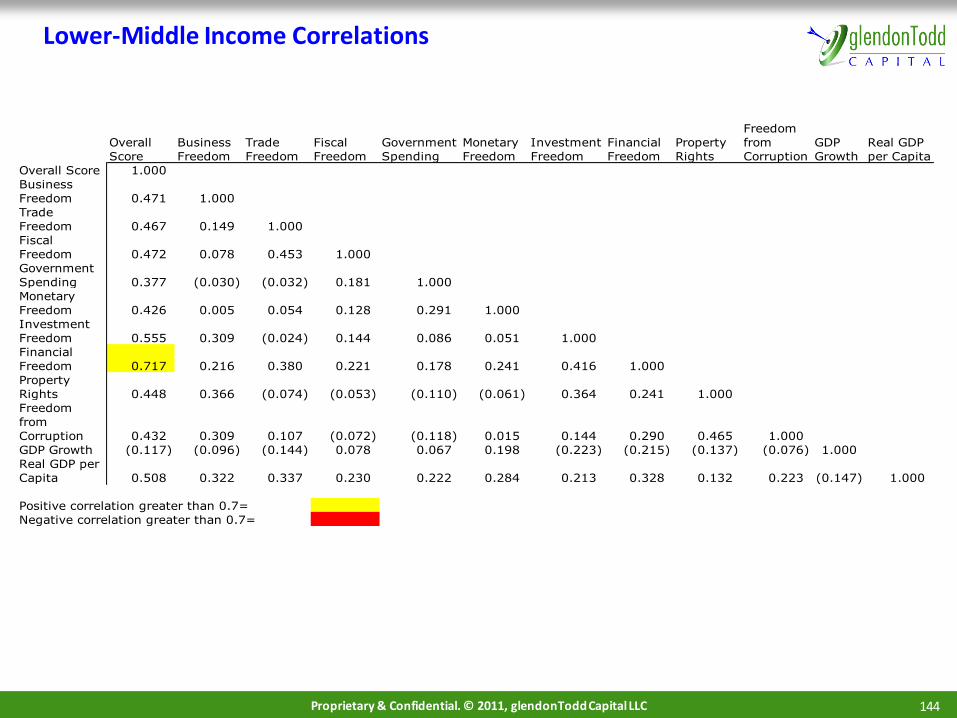
144144Proprietary & Confidential. © 2011, glendonTodd Capital LLC
Lower-Middle Income Correlations
Overall
Score
Business
Freedom
Trade
Freedom
Fiscal
Freedom
Government
Spending
Monetary
Freedom
Investment
Freedom
Financial
Freedom
Property
Rights
Freedom
from
Corruption
GDP
Growth
Real GDP
per Capita
Overall Score 1.000
Business
Freedom 0.471 1.000
Trade
Freedom 0.467 0.149 1.000
Fiscal
Freedom 0.472 0.078 0.453 1.000
Government
Spending 0.377 (0.030) (0.032) 0.181 1.000
Monetary
Freedom 0.426 0.005 0.054 0.128 0.291 1.000
Investment
Freedom 0.555 0.309 (0.024) 0.144 0.086 0.051 1.000
Financial
Freedom 0.717 0.216 0.380 0.221 0.178 0.241 0.416 1.000
Property
Rights 0.448 0.366 (0.074) (0.053) (0.110) (0.061) 0.364 0.241 1.000
Freedom
from
Corruption 0.432 0.309 0.107 (0.072) (0.118) 0.015 0.144 0.290 0.465 1.000
GDP Growth (0.117) (0.096) (0.144) 0.078 0.067 0.198 (0.223) (0.215) (0.137) (0.076) 1.000
Real GDP per
Capita 0.508 0.322 0.337 0.230 0.222 0.284 0.213 0.328 0.132 0.223 (0.147) 1.000
Positive correlation greater than 0.7=
Negative correlation greater than 0.7=

145145Proprietary & Confidential. © 2011, glendonTodd Capital LLC
Lower Income Correlations
Overall
Score
Business
Freedom
Trade
Freedom
Fiscal
Freedom
Government
Spending
Monetary
Freedom
Investment
Freedom
Financial
Freedom
Property
Rights
Freedom
from
Corruption
GDP
Growth
Real GDP
per Capita
Overall Score 1.000
Business
Freedom 0.548 1.000
Trade
Freedom 0.340 (0.147) 1.000
Fiscal
Freedom 0.306 (0.064) 0.160 1.000
Government
Spending (0.076) (0.091) (0.204) 0.220 1.000
Monetary
Freedom 0.479 0.307 (0.077) 0.011 0.040 1.000
Investment
Freedom 0.713 0.375 0.137 0.044 (0.241) 0.352 1.000
Financial
Freedom 0.675 0.160 0.148 0.126 (0.140) 0.257 0.474 1.000
Property
Rights 0.627 0.664 (0.106) (0.068) (0.301) 0.180 0.574 0.338 1.000
Freedom from
Corruption 0.356 0.183 0.045 0.065 (0.344) 0.023 0.151 0.198 0.356 1.000
GDP Growth 0.055 0.094 0.034 0.061 (0.205) 0.041 0.129 (0.022) 0.065 (0.006) 1.000
Real GDP per
Capita 0.069 (0.195) 0.213 0.323 0.260 0.075 (0.047) 0.072 (0.269) (0.256) (0.188) 1.000
Positive correlation greater than 0.7=
Negative correlation greater than 0.7=
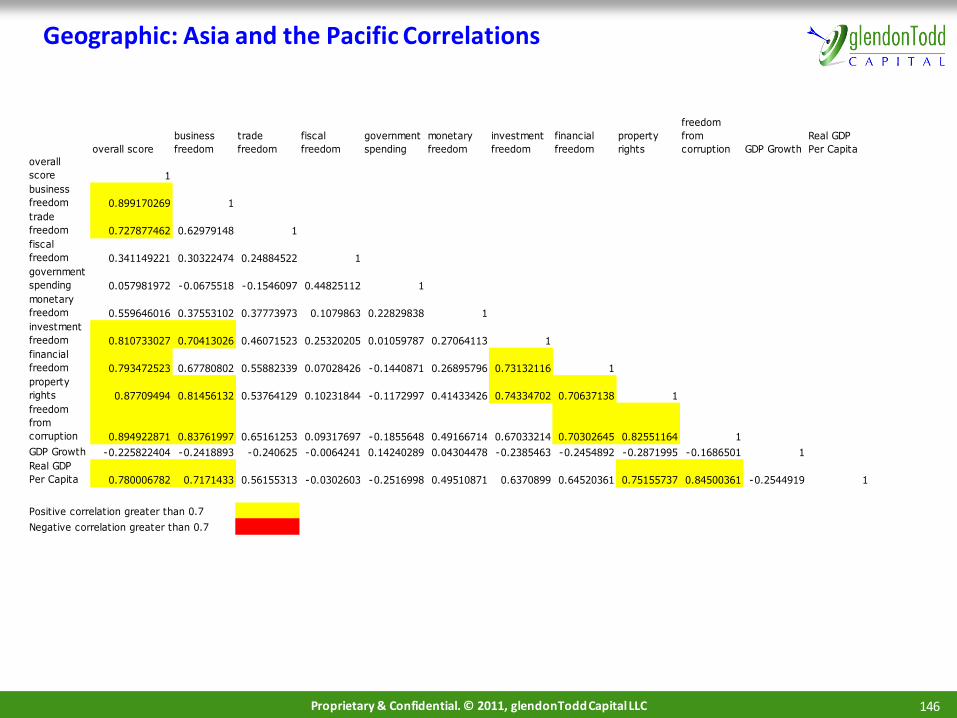
146146Proprietary & Confidential. © 2011, glendonTodd Capital LLC
Geographic: Asia and the Pacific Correlations
overall score
business
freedom
trade
freedom
fiscal
freedom
government
spending
monetary
freedom
investment
freedom
financial
freedom
property
rights
freedom
from
corruption GDP Growth
Real GDP
Per Capita
overall
score 1
business
freedom 0.899170269 1
trade
freedom 0.727877462 0.62979148 1
fiscal
freedom 0.341149221 0.30322474 0.24884522 1
government
spending 0.057981972 -0.0675518 -0.1546097 0.44825112 1
monetary
freedom 0.559646016 0.37553102 0.37773973 0.1079863 0.22829838 1
investment
freedom 0.810733027 0.70413026 0.46071523 0.25320205 0.01059787 0.27064113 1
financial
freedom 0.793472523 0.67780802 0.55882339 0.07028426 -0.1440871 0.26895796 0.73132116 1
property
rights 0.87709494 0.81456132 0.53764129 0.10231844 -0.1172997 0.41433426 0.74334702 0.70637138 1
freedom
from
corruption 0.894922871 0.83761997 0.65161253 0.09317697 -0.1855648 0.49166714 0.67033214 0.70302645 0.82551164 1
GDP Growth -0.225822404 -0.2418893 -0.240625 -0.0064241 0.14240289 0.04304478 -0.2385463 -0.2454892 -0.2871995 -0.1686501 1
Real GDP
Per Capita 0.780006782 0.7171433 0.56155313 -0.0302603 -0.2516998 0.49510871 0.6370899 0.64520361 0.75155737 0.84500361 -0.2544919 1
Positive correlation greater than 0.7
Negative correlation greater than 0.7

147147Proprietary & Confidential. © 2011, glendonTodd Capital LLC
Geographic: Europe Correlations
overall
score
business
freedom
trade
freedom
fiscal
freedom
government
spending
monetary
freedom
investment
freedom
financial
freedom
property
rights
freedom
from
corruption GDP Growth
Real GDP
Per Capita
overall
score 1
business
freedom 0.75579334 1
trade
freedom 0.63865603 0.44807926 1
fiscal
freedom 0.00400349 -0.1675487 -0.0068291 1
government
spending -0.0378652 -0.2196104 -0.0969796 0.66231372 1
monetary
freedom 0.73587763 0.4582011 0.5592788 -0.0576705 -0.2100121 1
investment
freedom 0.74493978 0.61151053 0.32633183 -0.1647435 -0.129053 0.38134547 1
financial
freedom 0.7915965 0.57125457 0.45050676 -0.064511 -0.1291937 0.45983564 0.62703523 1
property
rights 0.77039157 0.70697759 0.42500282 -0.4847302 -0.4394307 0.5114718 0.67270595 0.62037579 1
freedom
from
corruption 0.74769073 0.64018942 0.48511173 -0.4827188 -0.4999914 0.57823761 0.56661787 0.56254957 0.85777972 1
GDP Growth -0.0172571 -0.102029 -0.1342891 0.20205612 0.15221635 0.06623174 -0.1149765 -0.0262461 -0.1390577 -0.119262 1
Real GDP
Per Capita 0.6795433 0.66775191 0.45874987 -0.6031585 -0.4670681 0.5723365 0.54283826 0.52989182 0.81779307 0.861609 -0.2230732 1
Positive correlation greater than 0.7
Negative correlation greater than 0.7

148148Proprietary & Confidential. © 2011, glendonTodd Capital LLC
Geographic: Americas Correlations
overall
score
business
freedom
trade
freedom
fiscal
freedom
government
spending
monetary
freedom
investment
freedom
financial
freedom
property
rights
freedom
from
corruption GDP Growth
Real GDP
Per Capita
overall
score 1
business
freedom 0.76748686 1
trade
freedom 0.46231976 0.2997613 1
fiscal
freedom -0.0185619 -0.2413508 -0.0410308 1
government
spending -0.025219 -0.2974929 -0.0926854 0.58222907 1
monetary
freedom 0.55286635 0.35548659 0.28897298 -0.118566 -0.1653767 1
investment
freedom 0.70291546 0.47181533 0.13983166 0.13489485 0.03217217 0.26512296 1
financial
freedom 0.70551503 0.53300186 0.24129535 -0.0452966 -0.0975515 0.4826237 0.47683857 1
property
rights 0.79996796 0.73553387 0.31330836 -0.3347843 -0.3570254 0.29063042 0.48074472 0.43978917 1
freedom
from
corruption 0.76914938 0.68465948 0.39710288 -0.3666251 -0.338649 0.39007747 0.31425964 0.40933625 0.83355625 1
GDP Growth -0.1060274 -0.0776594 -0.0345755 0.05761636 0.0518082 0.00095271 -0.1379453 -0.1340027 -0.1047878 -0.0012203 1
Real GDP
Per Capita 0.58698175 0.65069678 0.42324079 -0.4396795 -0.3654664 0.30710773 0.1629265 0.39588894 0.68040945 0.7698955 -0.0603432 1
Positive correlation greater than 0.7
Negative correlation greater than 0.7

149149Proprietary & Confidential. © 2011, glendonTodd Capital LLC
Geographic: Middle East and North Africa Correlations
overall
score
business
freedom
trade
freedom
fiscal
freedom
government
spending
monetary
freedom
investment
freedom
financial
freedom
property
rights
freedom
from
corruption GDP Growth
Real GDP
Per Capita
overall
score 1
business
freedom 0.63318748 1
trade
freedom 0.47676741 0.27484125 1
fiscal
freedom 0.4248122 0.12564577 0.26180888 1
government
spending -0.0744717 -0.0207943 -0.3617286 0.28761358 1
monetary
freedom 0.44765291 0.27346109 -0.0418981 0.25306533 -0.0618684 1
investment
freedom 0.26101398 0.16503762 -0.0025583 -0.4558819 -0.3489428 -0.0378459 1
financial
freedom 0.70849895 0.35154766 0.18324837 0.15042411 0.00398167 0.07914896 0.36072058 1
property
rights 0.63959945 0.36364316 0.3570323 -0.1579266 -0.4000783 0.05224109 0.4148231 0.58215878 1
freedom
from
corruption 0.77882722 0.48800379 0.34401932 0.23971366 -0.3456719 0.5295463 0.1258762 0.38737819 0.55283928 1
GDP Growth -0.0044455 -0.0469262 -0.0194142 0.07568588 0.00083256 0.01400803 -0.034174 0.1114222 -0.0736988 -0.0523123 1
Real GDP
Per Capita 0.6656134 0.45842606 0.66655208 0.15716812 -0.5647185 0.24643373 0.28328734 0.38217193 0.59766182 0.68234847 -0.0006361 1
Positive correlation greater than 0.7
Negative correlation greater than 0.7

150150Proprietary & Confidential. © 2011, glendonTodd Capital LLC
Geographic: Sub-Saharan Africa Correlations
overall
score
business
freedom
trade
freedom
fiscal
freedom
government
spending
monetary
freedom
investment
freedom
financial
freedom
property
rights
freedom
from
corruption GDP Growth
Real GDP
Per Capita
overall
score 1
business
freedom 0.5670174 1
trade
freedom 0.41952347 -0.0584697 1
fiscal
freedom 0.27536251 -0.0496804 0.33293242 1
government
spending -0.0918401 -0.2084447 -0.1133373 -0.1430093 1
monetary
freedom 0.27462357 0.16419755 -0.0338051 -0.149719 0.23868319 1
investment
freedom 0.60291223 0.40519174 0.09961631 0.024067 -0.212836 0.01711491 1
financial
freedom 0.6222926 0.12602785 0.13705188 0.03038656 -0.0467638 0.1009085 0.33252665 1
property
rights 0.62748671 0.60949083 0.00848417 0.07405273 -0.3903384 -0.0813553 0.49707529 0.29596517 1
freedom
from
corruption 0.49943539 0.37289469 -0.00213 -0.0418338 -0.452732 -0.0926756 0.3029286 0.33419545 0.52534081 1
GDP Growth -0.1122184 -0.0818624 0.08464735 0.29129745 -0.0727751 -0.044412 -0.0897687 -0.1759436 -0.1335558 -0.1892833 1
Real GDP
Per Capita 0.42922141 0.44938352 -0.0618538 -0.295401 -0.2788947 0.23106249 0.27623702 0.28073329 0.43781137 0.61222448 -0.2070396 1
Positive correlation greater than 0.7
Negative correlation greater than 0.7

151151Proprietary & Confidential. © 2011, glendonTodd Capital LLC
Semi-Geographic: Developed Nations Correlations
Overall
Score
Business
Freedom
Trade
Freedom
Fiscal
Freedom
Government
Spending
Monetary
Freedom
Investment
Freedom
Financial
Freedom
Property
Rights
Freedom
from
Corruption GDP Growth
Real GDP
per Capita
Overall Score 1.000
Business
Freedom 0.772 1.000
Trade
Freedom 0.551 0.444 1.000
Fiscal
Freedom 0.616 0.433 0.380 1.000
Government
Spending 0.705 0.426 0.302 0.782 1.000
Monetary
Freedom 0.401 0.175 0.339 (0.006) 0.173 1.000
Investment
Freedom 0.581 0.431 0.391 0.322 0.264 (0.009) 1.000
Financial
Freedom 0.630 0.411 0.313 0.232 0.201 0.192 0.437 1.000
Property
Rights 0.735 0.601 0.208 0.112 0.339 0.388 0.386 0.436 1.000
Freedom from
Corruption 0.624 0.585 0.328 (0.052) 0.072 0.422 0.289 0.388 0.739 1.000
GDP Growth 0.085 0.021 (0.179) 0.155 0.213 (0.026) (0.012) (0.007) 0.006 (0.037) 1.000
Real GDP per
Capita 0.411 0.410 0.332 (0.294) (0.064) 0.499 0.186 0.388 0.558 0.663 (0.179) 1.000
Positive correlation greater than 0.7
Negative correlation greater than 0.7

152152Proprietary & Confidential. © 2011, glendonTodd Capital LLC
Semi-Geographic: Sub-Saharan Africa Correlations
Overall
Score
Business
Freedom
Trade
Freedom
Fiscal
Freedom
Government
Spending
Monetary
Freedom
Investment
Freedom
Financial
Freedom
Property
Rights
Freedom
from
Corruption GDP Growth
Real GDP
per Capita
Overall Score 1.000
Business
Freedom 0.574 1.000
Trade
Freedom 0.364 (0.122) 1.000
Fiscal
Freedom 0.270 (0.036) 0.322 1.000
Government
Spending (0.115) (0.233) (0.070) (0.137) 1.000
Monetary
Freedom 0.294 0.225 (0.088) (0.143) 0.197 1.000
Investment
Freedom 0.589 0.355 0.054 0.005 (0.233) 0.026 1.000
Financial
Freedom 0.604 0.097 0.111 0.016 (0.061) 0.085 0.376 1.000
Property
Rights 0.630 0.599 (0.017) 0.076 (0.397) (0.052) 0.467 0.277 1.000
Freedom from
Corruption 0.513 0.438 (0.073) (0.036) (0.466) (0.013) 0.285 0.294 0.532 1.000
GDP Growth (0.108) (0.074) 0.081 0.289 (0.075) (0.042) (0.084) (0.162) (0.132) (0.177) 1.000
Real GDP per
Capita 0.428 0.464 (0.097) (0.281) (0.262) 0.258 0.252 0.239 0.437 0.599 (0.193) 1.000
Positive correlation greater than 0.7
Negative correlation greater than 0.7

153153Proprietary & Confidential. © 2011, glendonTodd Capital LLC
Semi-Geographic: East Asia Correlations
Overall
Score
Business
Freedom
Trade
Freedom
Fiscal
Freedom
Government
Spending
Monetary
Freedom
Investment
Freedom
Financial
Freedom
Property
Rights
Freedom
from
Corruption GDP Growth
Real GDP
per Capita
Overall Score 1.000
Business
Freedom 0.843 1.000
Trade
Freedom 0.670 0.477 1.000
Fiscal
Freedom 0.149 0.009 0.114 1.000
Government
Spending (0.434) (0.554) (0.337) 0.276 1.000
Monetary
Freedom 0.606 0.473 0.353 (0.178) (0.454) 1.000
Investment
Freedom 0.558 0.323 0.115 0.077 (0.148) 0.292 1.000
Financial
Freedom 0.702 0.564 0.420 0.009 (0.175) 0.293 0.439 1.000
Property
Rights 0.850 0.741 0.327 0.023 (0.437) 0.509 0.585 0.532 1.000
Freedom from
Corruption 0.778 0.757 0.499 (0.203) (0.712) 0.640 0.257 0.432 0.683 1.000
GDP Growth (0.536) (0.455) (0.362) (0.033) 0.275 (0.274) (0.444) (0.352) (0.516) (0.358) 1.000
Real GDP per
Capita 0.619 0.630 0.419 (0.295) (0.786) 0.652 0.293 0.251 0.591 0.810 (0.432) 1.000
Positive correlation greater than 0.7
Negative correlation greater than 0.7
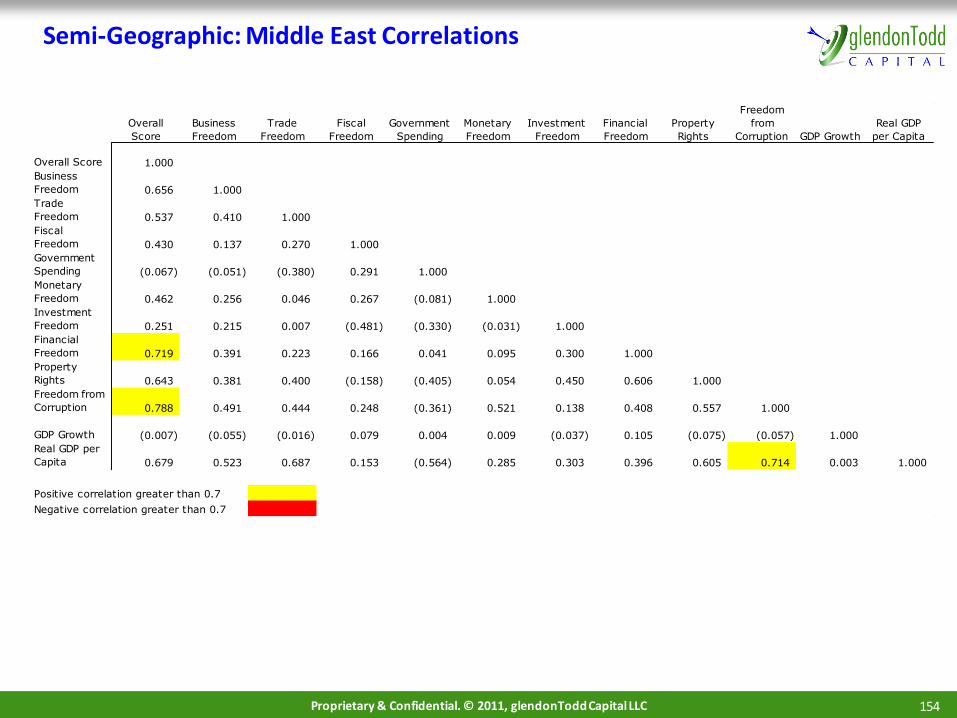
154154Proprietary & Confidential. © 2011, glendonTodd Capital LLC
Semi-Geographic: Middle East Correlations
Overall
Score
Business
Freedom
Trade
Freedom
Fiscal
Freedom
Government
Spending
Monetary
Freedom
Investment
Freedom
Financial
Freedom
Property
Rights
Freedom
from
Corruption GDP Growth
Real GDP
per Capita
Overall Score 1.000
Business
Freedom 0.656 1.000
Trade
Freedom 0.537 0.410 1.000
Fiscal
Freedom 0.430 0.137 0.270 1.000
Government
Spending (0.067) (0.051) (0.380) 0.291 1.000
Monetary
Freedom 0.462 0.256 0.046 0.267 (0.081) 1.000
Investment
Freedom 0.251 0.215 0.007 (0.481) (0.330) (0.031) 1.000
Financial
Freedom 0.719 0.391 0.223 0.166 0.041 0.095 0.300 1.000
Property
Rights 0.643 0.381 0.400 (0.158) (0.405) 0.054 0.450 0.606 1.000
Freedom from
Corruption 0.788 0.491 0.444 0.248 (0.361) 0.521 0.138 0.408 0.557 1.000
GDP Growth (0.007) (0.055) (0.016) 0.079 0.004 0.009 (0.037) 0.105 (0.075) (0.057) 1.000
Real GDP per
Capita 0.679 0.523 0.687 0.153 (0.564) 0.285 0.303 0.396 0.605 0.714 0.003 1.000
Positive correlation greater than 0.7
Negative correlation greater than 0.7

155155Proprietary & Confidential. © 2011, glendonTodd Capital LLC
Semi-Geographic: Eastern Europe and Central Asia Correlations
Overall
Score
Business
Freedom
Trade
Freedom
Fiscal
Freedom
Government
Spending
Monetary
Freedom
Investment
Freedom
Financial
Freedom
Property
Rights
Freedom
from
Corruption GDP Growth
Real GDP
per Capita
Overall Score 1.000
Business
Freedom 0.395 1.000
Trade
Freedom 0.503 0.100 1.000
Fiscal
Freedom 0.588 0.119 0.183 1.000
Government
Spending 0.498 0.062 0.007 0.406 1.000
Monetary
Freedom 0.778 0.074 0.420 0.632 0.416 1.000
Investment
Freedom 0.384 0.346 (0.090) (0.077) 0.175 (0.017) 1.000
Financial
Freedom 0.582 0.246 0.315 0.065 0.145 0.184 0.433 1.000
Property
Rights 0.010 0.214 (0.133) (0.362) (0.199) (0.318) 0.197 0.255 1.000
Freedom from
Corruption 0.300 (0.120) 0.332 (0.053) (0.173) 0.136 0.029 0.200 0.190 1.000
GDP Growth 0.134 (0.099) 0.016 0.250 0.107 0.304 (0.148) (0.068) (0.182) (0.010) 1.000
Real GDP per
Capita 0.030 (0.062) (0.131) 0.342 0.161 0.130 (0.089) (0.138) (0.529) (0.040) 0.091 1.000
Positive correlation greater than 0.7
Negative correlation greater than 0.7

156156Proprietary & Confidential. © 2011, glendonTodd Capital LLC
Semi-Geographic: Americas Correlations
Overall
Score
Business
Freedom
Trade
Freedom
Fiscal
Freedom
Government
Spending
Monetary
Freedom
Investment
Freedom
Financial
Freedom
Property
Rights
Freedom
from
Corruption GDP Growth
Real GDP
per Capita
Overall Score 1.000
Business
Freedom 0.687 1.000
Trade
Freedom 0.328 0.092 1.000
Fiscal
Freedom 0.265 0.017 0.169 1.000
Government
Spending 0.243 (0.055) 0.104 0.466 1.000
Monetary
Freedom 0.508 0.255 0.209 0.044 (0.031) 1.000
Investment
Freedom 0.761 0.521 0.107 0.189 0.044 0.266 1.000
Financial
Freedom 0.652 0.437 0.113 0.159 0.068 0.433 0.479 1.000
Property
Rights 0.737 0.608 0.105 (0.064) (0.107) 0.155 0.554 0.305 1.000
Freedom from
Corruption 0.720 0.508 0.194 (0.018) 0.019 0.280 0.399 0.258 0.730 1.000
GDP Growth (0.074) (0.040) 0.004 0.067 0.033 0.018 (0.126) (0.112) (0.083) 0.059 1.000
Real GDP per
Capita 0.383 0.523 0.152 (0.104) 0.045 0.017 0.164 0.003 0.493 0.573 0.084 1.000
Positive correlation greater than 0.7
Negative correlation greater than 0.7

157157Proprietary & Confidential. © 2011, glendonTodd Capital LLC
Colonization: UK (1)
158158Proprietary & Confidential. © 2011, glendonTodd Capital LLC
Colonization: UK (2)

159159Proprietary & Confidential. © 2011, glendonTodd Capital LLC
Colonization: Spain

160160Proprietary & Confidential. © 2011, glendonTodd Capital LLC
Colonization: France

161161Proprietary & Confidential. © 2011, glendonTodd Capital LLC
Colonization: Portugal
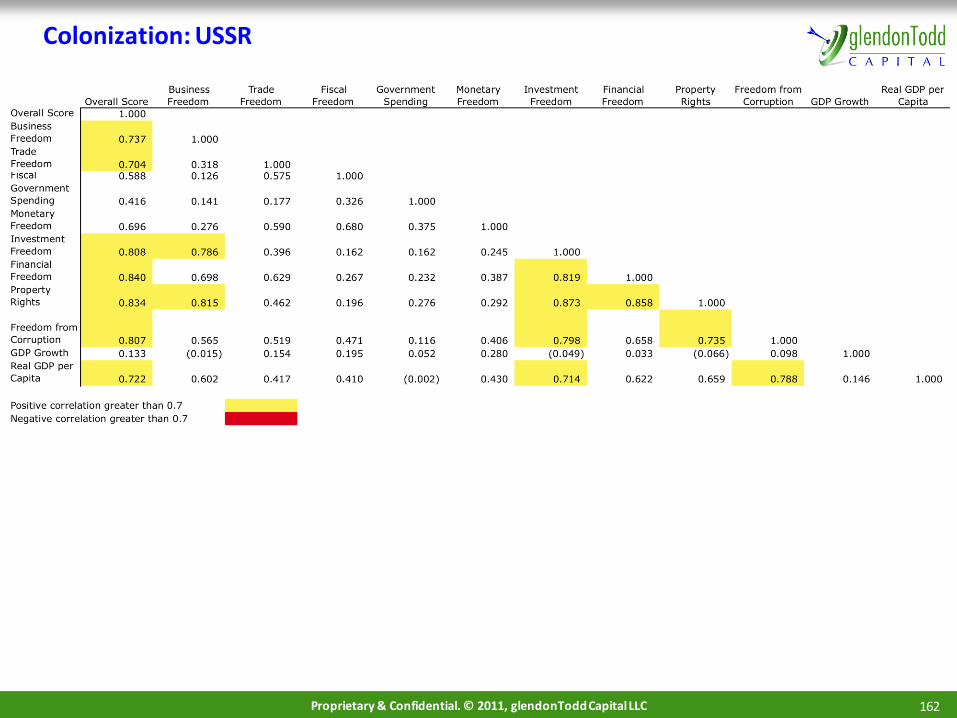
162162Proprietary & Confidential. © 2011, glendonTodd Capital LLC
Colonization: USSR

163163Proprietary & Confidential. © 2011, glendonTodd Capital LLC
Colonization: Netherlands

164164Proprietary & Confidential. © 2011, glendonTodd Capital LLC
Colonization: Self-Ruling

165165Proprietary & Confidential. © 2011, glendonTodd Capital LLC
Model Creation Phase Appendix
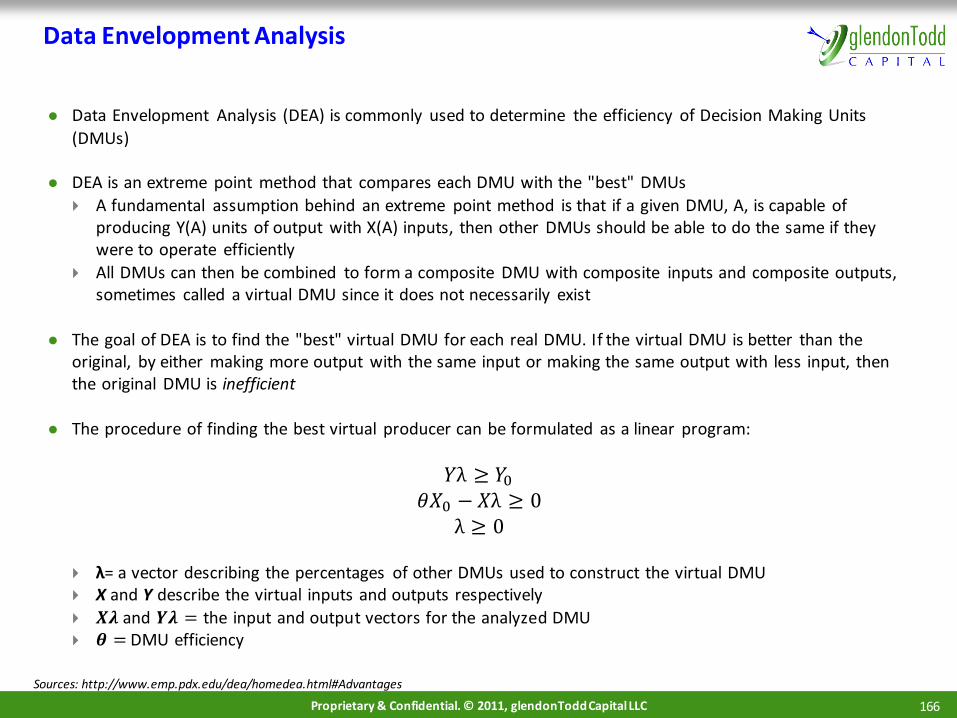
166166Proprietary & Confidential. © 2011, glendonTodd Capital LLC
Data Envelopment Analysis (DEA) is commonly used to determine the efficiency of Decision Making Units
(DMUs)
DEA is an extreme point method that compares each DMU with the "best" DMUs
A fundamental assumption behind an extreme point method is that if a given DMU, A, is capable of producing Y(A) units of output with X(A) inputs, then other DMUs should be able to do the same if they were to operate efficiently
All DMUs can then be combined to form a composite DMU with composite inputs and composite outputs, sometimes called a virtual DMU since it does not necessarily exist
The goal of DEA is to find the "best" virtual DMU for each real DMU. If the virtual DMU is better than the original, by either making more output with the same input or making the same output with less input, then the original DMU is inefficient
The procedure of finding the best virtual producer can be formulated as a linear program:
𝑌λ ≥ 𝑌0
𝜃𝑋0 − 𝑋λ ≥ 0λ ≥ 0
λ= a vector describing the percentages of other DMUs used to construct the virtual DMU X and Y describe the virtual inputs and outputs respectively
𝑿𝝀 and 𝒀𝝀 = the input and output vectors for the analyzed DMU 𝜽 = DMU efficiency
Data Envelopment Analysis
Sources: http://www.emp.pdx.edu/dea/homedea.html#Advantages

167167Proprietary & Confidential. © 2011, glendonTodd Capital LLC
The efficiency frontier defines the maximum combinations of outputs that can be produced for a given set of
inputs
The convex combination of DMUs are allowed and can be plotted on a graph, with the line equaling the
efficiency frontier:
The line segment connecting DMUs A and C shows the possibilities of virtual outputs that can be formed from these two DMUs (similar segments can be drawn between A/B and B/C)
Since the segment AC lies beyond the segments AB and BC, this means that a convex combination of A and C will create the most outputs for a given set of inputs
This model assumes Constant Returns to Scale (CRS), meaning that the producers are able to linearly scale the inputs and outputs without increasing or decreasing efficiency
Data Envelopment Analysis: Efficiency Frontier
Sources: http://www.emp.pdx.edu/dea/homedea.html#Advantages

168168Proprietary & Confidential. © 2011, glendonTodd Capital LLC
As the earlier list of applications suggests, DEA can be a powerful tool when used wisely for the following
reasons: DEA can handle multiple input and multiple output models It does not require an assumption of a functional form relating inputs to outputs
DMUs are directly compared against a peer or combination of peers Inputs and outputs can have very different units. For example, X1 could be in units of lives saved and X2
could be in units of dollars without requiring an a priori tradeoff between the two
The same characteristics that make DEA a powerful tool can also create problems. An analyst should keep these limitations in mind when choosing whether or not to use DEA:
Since DEA is an extreme point technique, noise (even symmetrical noise with zero mean) such as measurement error can cause significant problems
DEA is good at estimating "relative" efficiency of a DMU but it converges very slowly to "absolute"
efficiency. In other words, it can tell you how well you are doing compared to your peers, but not compared to a "theoretical maximum"
Since DEA is a nonparametric technique, statistical hypothesis tests are difficult and are the focus of
ongoing research Since a standard formulation of DEA creates a separate linear program for each DMU, large problems can
be computationally intensive
Data Envelopment Analysis: Strengths and Weaknesses
Sources: http://www.emp.pdx.edu/dea/homedea.html#Advantages

169169Proprietary & Confidential. © 2011, glendonTodd Capital LLC
An Artificial Neural Network – usually simply called a “neural network” – is a mathematical model or
computational model that is inspired by the structure and/or functional aspects of biological neural networks of the kind found in the human brain
Neural networks are non-linear statistical data modeling tools that are used to model complex relationships between inputs and outputs or to find hidden patterns in data
Neural networks are based on the human brain - the most powerful computer on the planet. The human brain is made up of many neurons connected by synapses which allow humans to think. Various neurons are connected to each other, and together they allow for thought and the processing of sensory inputs
Neural Networks: The Basics
Computers, for all their uses, are still merely
machines that take an input, perform some mathematical calculations—since computers see data as numbers—and get an output
In order to make computers more efficient, computer scientists developed the concept of
artificial neural networks in an attempt to replicate the brain’s decentralized and yet more powerful computational process

170170Proprietary & Confidential. © 2011, glendonTodd Capital LLC
When a neural network is created, the relative
“weights” of connections between the inputs and the “hidden” neurons are undetermined
When the network is subsequently “trained,” the “hidden” neurons map the inputs to the outputs, determining the relative weights for each input. This
is also referred to as “learning”
Neural Networks: The Basics
Graphic: http://en.wikipedia.org/wiki/Artificial_neural_network
The generalized method of artificial neural networks can be divided into three parts:
The inputs The outputs The “hidden” neurons
The inputs and outputs are quite simply the independent and the dependent variables, respectively
The “hidden” neurons are more difficult conceptually. In the brain, they comprise all the neurons that lead from the initial sensory input to the end result of the computation. The same is
conceptually true for an artificial network. The “hidden” neurons are a collection of neurons that are connected to each other, to the inputs, and to the outputs

171171Proprietary & Confidential. © 2011, glendonTodd Capital LLC
Neural Networks Colonization Route Approach
GroupingReal GDP per Capita w/in 0.5%
Predicted growth within 0.5%
Predicted growth error within 5%
UK 1 52.19% 49.67% 35.33%
UK 2 77.34% 76.67% 56.67%
Spain 70.44% 69.92% 76.56%
France 3.98% 4.24% 24.85%
USSR 28.13% 21.67% 30.00%

172172Proprietary & Confidential. © 2011, glendonTodd Capital LLC
Neural Networks Semi-geographic results
GroupingReal GDP per Capita w/in 0.5%
Predicted growth within 0.5%
Predicted growth error within 5%
Developed 82.81% 82.33% 84.00%
Sub-Saharan 77.96% 77.54% 69.47%
East Asia 23.61% 19.84% 25.40%
Middle East 3.13% 2.67% 18.00%
Eastern Europe & Central Asia 18.75% 16.67% 25.00%
Americas 4.46% 4.44% 24.76%
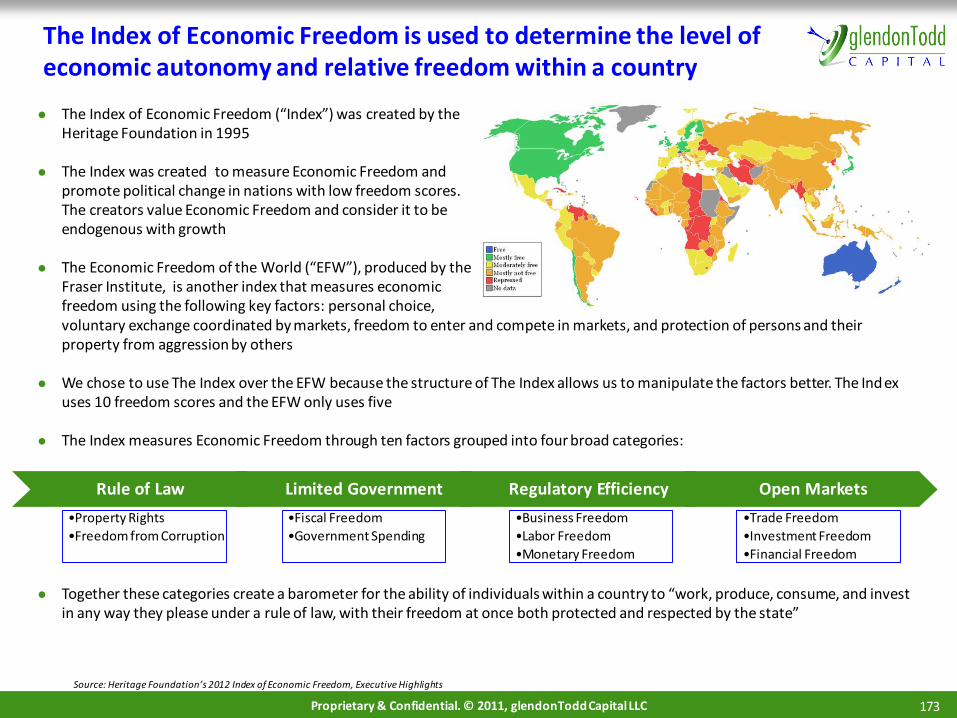
173173Proprietary & Confidential. © 2011, glendonTodd Capital LLC
The Index of Economic Freedom (“Index”) was created by the Heritage Foundation in 1995
The Index was created to measure Economic Freedom and promote political change in nations with low freedom scores. The creators value Economic Freedom and consider it to be endogenous with growth
The Economic Freedom of the World (“EFW”), produced by the Fraser Institute, is another index that measures economic freedom using the following key factors: personal choice,
The Index of Economic Freedom is used to determine the level of economic autonomy and relative freedom within a country
Source: Heritage Foundation’s 2012 Index of Economic Freedom, Executive Highlights
Rule of Law
•Property Rights
•Freedom from Corruption
Limited Government
•Fiscal Freedom
•Government Spending
Regulatory Efficiency
•Business Freedom
•Labor Freedom
•Monetary Freedom
Open Markets
•Trade Freedom
•Investment Freedom
•Financial Freedom
voluntary exchange coordinated by markets, freedom to enter and compete in markets, and protection of persons and their property from aggression by others
We chose to use The Index over the EFW because the structure of The Index allows us to manipulate the factors better. The Index uses 10 freedom scores and the EFW only uses five
The Index measures Economic Freedom through ten factors grouped into four broad categories:
Together these categories create a barometer for the ability of individuals within a country to “work, produce, consume, and invest in any way they please under a rule of law, with their freedom at once both protected and respected by the state”

174174Proprietary & Confidential. © 2011, glendonTodd Capital LLC
The Rule of Law category measures the abilities of a nation’s government to protect and respect the rights of its citizens1. Property Rights measures the presence of Property Rights and the consistency and speed of their enforcement, it
also measures the ability for individuals to obtain private property and keep it without fear of expropriation2. Freedom from Corruption alleviates insecurity and uncertainty within economic relationships, improving public
perception of the economy, and therefore driving up the economic freedom of the nation
The Limited Government category measures the size of government and the resulting burden on the nation’s economy3. Fiscal Freedom measures the burden governments place upon their citizens and businesses through taxation since
taxation depletes citizens’ income and limits their abilities to make economic decisions4. Government Spending measures the amount of spending the government engages in as a percentage of GDP
The Regulatory Efficiency category measures the burden and efficiency of regulation on a country’s economy by evaluating the amount of regulation and the resultant effects5. Business Freedom measures individuals’ ability to start, operate, and close businesses6. Labor Freedom measures individuals’ abilities to work when and where they want and employers’ ability to hire
and dismiss workers as needed7. Monetary Freedom measures price stability by assessing price controls, which distort the allocation of resources in
a nation and stifles economic growth, and measures inflation
The Open Markets category measures the degree to which a nation’s markets are open to trade and investment and the ability of markets to realize, through supply and demand, the natural equilibrium of the economy8. Trade Freedom measures the degree to which a nation allows international trade through tariffs and non-tarriff
barriers9. Investment Freedom measures the degree to which investment capital can flow unimpeded throughout a nation
and across borders by evaluating the laws and the extent to which these laws impede investment10. Financial Freedom measures banking efficiency and the efficiency and extent of government financial regulation
The Index: Freedom Factors
Source: Heritage Foundation’s 2012 Index of Economic Freedom, Executive Highlights

175175Proprietary & Confidential. © 2011, glendonTodd Capital LLC
We reduced the universe of countries being analyzed and grouped them
In addition to the Economic Freedom data, our analysis requires GDP data, which we collected from the
International Monetary Fund (“IMF”) and the Economic Research Service (“ERS”) GDP growth data and GDP PPP data came from the IMF, while real GDP per capita data and real GDP data
came from the ERS
After collecting all the data, we pared our country list down to 91 from 184 by removing those countries that do not have Index data for all the years (1995-2012), those that were not included in Transparency International’s
Corruption Perceptions Index, those that were not included in The World Bank’s Doing Business 2012 Report, those that are not included in the IMF data, and those not included in the ERS data
We also excluded the Labor Freedom factor from our analysis because the scores begin in 2005
In addition to preparing the data for general analysis, we divided the data into four different categories to run
analysis on a smaller scale. We based our division on The World Bank’s economic and geographic classifications1. Income Classification: We used The World Bank data to classify the nations as low income, lower-middle
income, upper-middle income, and high income
2. Geographic Classification: We divided the nations into the groups based upon location, based on The World Bank’s classifications
3. Semi-Geographic Classification: We classified the OECD nations and other developed nations as
“developed,” and classified the developing nations by geography, based on The World Banks’ classifications
4. Colonization Classification: We divided the nations by their primary colonizer, focusing on influence of
law. Those nations that were colonizers or not colonized are grouped together, as Self-Ruling— England’s colonies are divided into categories to reflect the different colonization strategies in each area.
Group (1) follows the extractive patterns typical of colonization while Group (2) colonies developed more
inclusive institutions
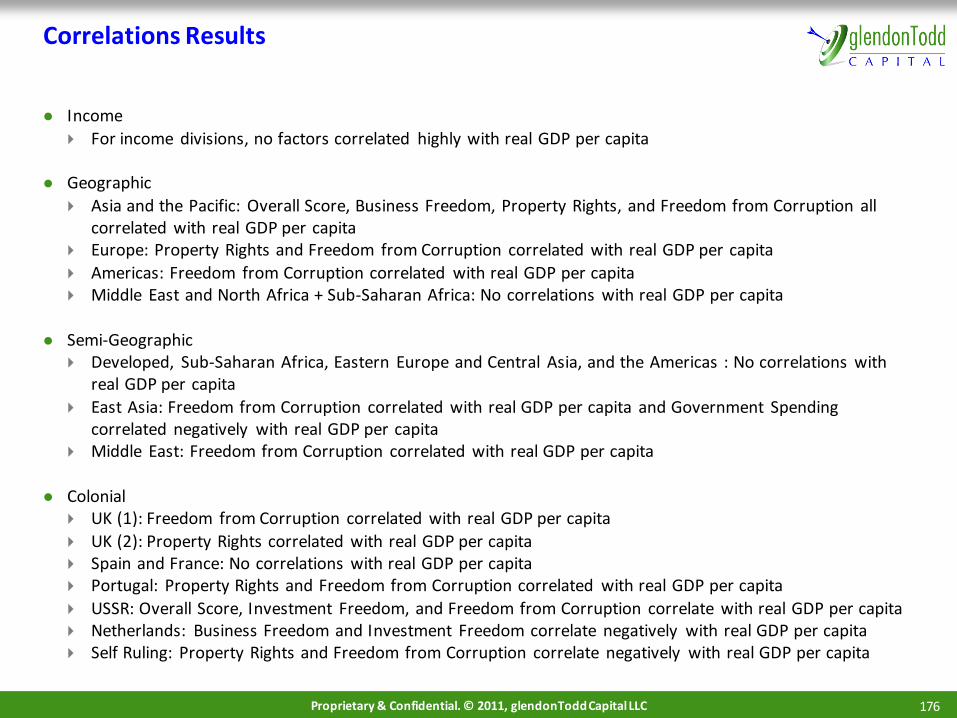
176176Proprietary & Confidential. © 2011, glendonTodd Capital LLC
Correlations Results
Income
For income divisions, no factors correlated highly with real GDP per capita
Geographic
Asia and the Pacific: Overall Score, Business Freedom, Property Rights, and Freedom from Corruption all correlated with real GDP per capita
Europe: Property Rights and Freedom from Corruption correlated with real GDP per capita
Americas: Freedom from Corruption correlated with real GDP per capita Middle East and North Africa + Sub-Saharan Africa: No correlations with real GDP per capita
Semi-Geographic Developed, Sub-Saharan Africa, Eastern Europe and Central Asia, and the Americas : No correlations with
real GDP per capita
East Asia: Freedom from Corruption correlated with real GDP per capita and Government Spending correlated negatively with real GDP per capita
Middle East: Freedom from Corruption correlated with real GDP per capita
Colonial UK (1): Freedom from Corruption correlated with real GDP per capita
UK (2): Property Rights correlated with real GDP per capita Spain and France: No correlations with real GDP per capita Portugal: Property Rights and Freedom from Corruption correlated with real GDP per capita
USSR: Overall Score, Investment Freedom, and Freedom from Corruption correlate with real GDP per capita Netherlands: Business Freedom and Investment Freedom correlate negatively with real GDP per capita Self Ruling: Property Rights and Freedom from Corruption correlate negatively with real GDP per capita
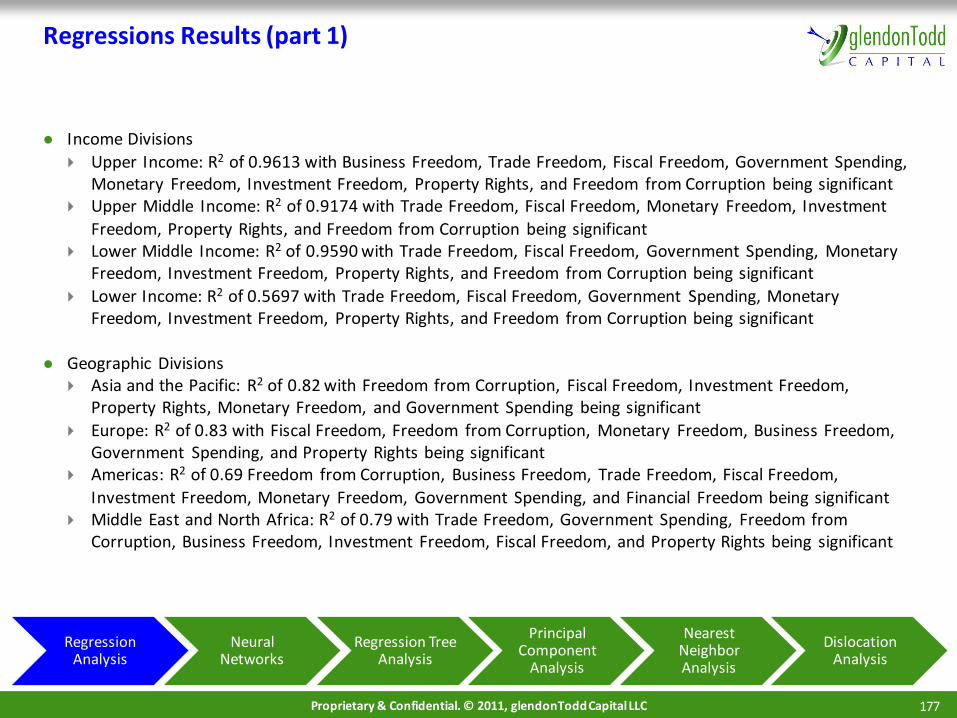
177177Proprietary & Confidential. © 2011, glendonTodd Capital LLC
Regressions Results (part 1)
Income Divisions
Upper Income: R2 of 0.9613 with Business Freedom, Trade Freedom, Fiscal Freedom, Government Spending, Monetary Freedom, Investment Freedom, Property Rights, and Freedom from Corruption being significant
Upper Middle Income: R2 of 0.9174 with Trade Freedom, Fiscal Freedom, Monetary Freedom, Investment
Freedom, Property Rights, and Freedom from Corruption being significant Lower Middle Income: R2 of 0.9590 with Trade Freedom, Fiscal Freedom, Government Spending, Monetary
Freedom, Investment Freedom, Property Rights, and Freedom from Corruption being significant
Lower Income: R2 of 0.5697 with Trade Freedom, Fiscal Freedom, Government Spending, Monetary Freedom, Investment Freedom, Property Rights, and Freedom from Corruption being significant
Geographic Divisions Asia and the Pacific: R2 of 0.82 with Freedom from Corruption, Fiscal Freedom, Investment Freedom,
Property Rights, Monetary Freedom, and Government Spending being significant
Europe: R2 of 0.83 with Fiscal Freedom, Freedom from Corruption, Monetary Freedom, Business Freedom, Government Spending, and Property Rights being significant
Americas: R2 of 0.69 Freedom from Corruption, Business Freedom, Trade Freedom, Fiscal Freedom,
Investment Freedom, Monetary Freedom, Government Spending, and Financial Freedom being significant Middle East and North Africa: R2 of 0.79 with Trade Freedom, Government Spending, Freedom from
Corruption, Business Freedom, Investment Freedom, Fiscal Freedom, and Property Rights being significant
Regression Analysis
Neural Networks
Regression Tree Analysis
Principal Component
Analysis
Nearest Neighbor Analysis
Dislocation Analysis
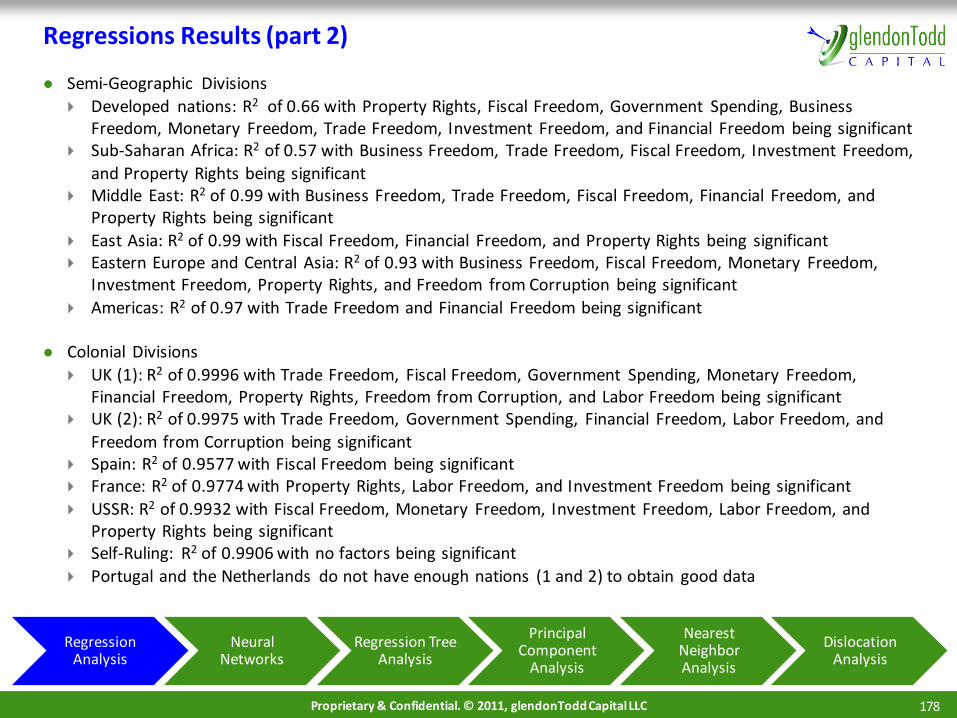
178178Proprietary & Confidential. © 2011, glendonTodd Capital LLC
Regressions Results (part 2)
Semi-Geographic Divisions
Developed nations: R2 of 0.66 with Property Rights, Fiscal Freedom, Government Spending, Business Freedom, Monetary Freedom, Trade Freedom, Investment Freedom, and Financial Freedom being significant
Sub-Saharan Africa: R2 of 0.57 with Business Freedom, Trade Freedom, Fiscal Freedom, Investment Freedom,
and Property Rights being significant Middle East: R2 of 0.99 with Business Freedom, Trade Freedom, Fiscal Freedom, Financial Freedom, and
Property Rights being significant
East Asia: R2 of 0.99 with Fiscal Freedom, Financial Freedom, and Property Rights being significant Eastern Europe and Central Asia: R2 of 0.93 with Business Freedom, Fiscal Freedom, Monetary Freedom,
Investment Freedom, Property Rights, and Freedom from Corruption being significant
Americas: R2 of 0.97 with Trade Freedom and Financial Freedom being significant
Colonial Divisions
UK (1): R2 of 0.9996 with Trade Freedom, Fiscal Freedom, Government Spending, Monetary Freedom, Financial Freedom, Property Rights, Freedom from Corruption, and Labor Freedom being significant
UK (2): R2 of 0.9975 with Trade Freedom, Government Spending, Financial Freedom, Labor Freedom, and
Freedom from Corruption being significant Spain: R2 of 0.9577 with Fiscal Freedom being significant France: R2 of 0.9774 with Property Rights, Labor Freedom, and Investment Freedom being significant
USSR: R2 of 0.9932 with Fiscal Freedom, Monetary Freedom, Investment Freedom, Labor Freedom, and Property Rights being significant
Self-Ruling: R2 of 0.9906 with no factors being significant
Portugal and the Netherlands do not have enough nations (1 and 2) to obtain good data
Regression Analysis
Neural Networks
Regression Tree Analysis
Principal Component
Analysis
Nearest Neighbor Analysis
Dislocation Analysis
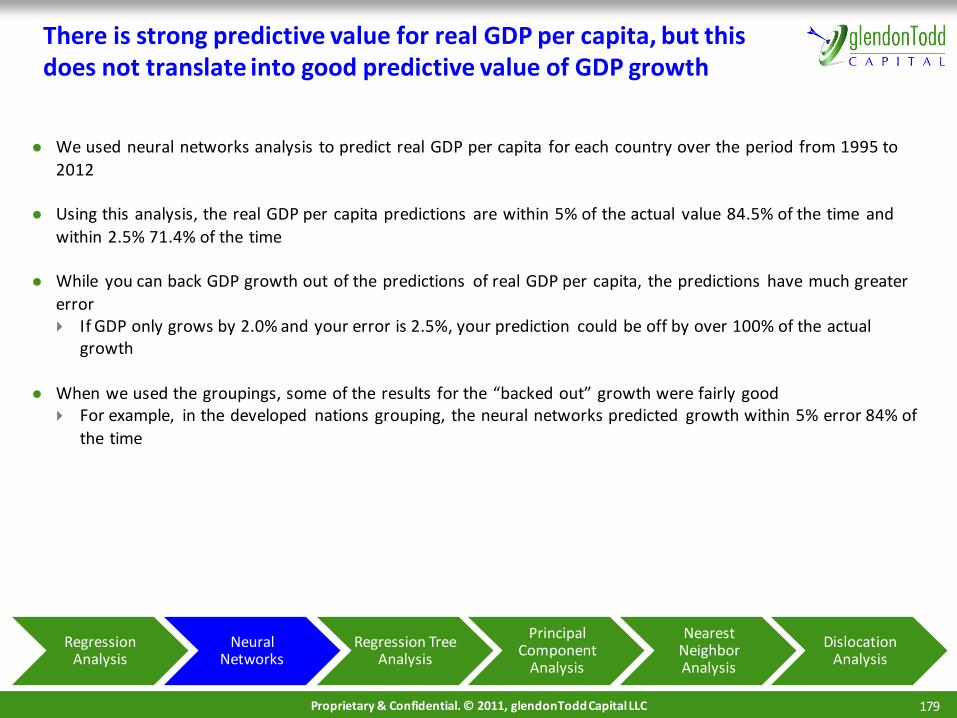
179179Proprietary & Confidential. © 2011, glendonTodd Capital LLC
There is strong predictive value for real GDP per capita, but this does not translate into good predictive value of GDP growth
We used neural networks analysis to predict real GDP per capita for each country over the period from 1995 to
2012
Using this analysis, the real GDP per capita predictions are within 5% of the actual value 84.5% of the time and
within 2.5% 71.4% of the time
While you can back GDP growth out of the predictions of real GDP per capita, the predictions have much greater
error If GDP only grows by 2.0% and your error is 2.5%, your prediction could be off by over 100% of the actual
growth
When we used the groupings, some of the results for the “backed out” growth were fairly good For example, in the developed nations grouping, the neural networks predicted growth within 5% error 84% of
the time
Regression Analysis
Neural Networks
Regression Tree Analysis
Principal Component
Analysis
Nearest Neighbor Analysis
Dislocation Analysis

180180Proprietary & Confidential. © 2011, glendonTodd Capital LLC
Regression Tree Results
The optimal regression tree for the target Total PPP Adjusted Value Added had an R2 of .776 with four terminal nodes The most significant input variables in this tree were Country, Business Freedom, Property Rights, GDP lag, and
Labor Freedom (in regressing order) The first split separated countries into two groups: China & the US and all remaining countries The second split for all remaining countries removed Brazil, France, Germany, India, Japan, Mexico, Russia, South
Korea, and the UK from all remaining countries The second split for China and the US was based on Business Freedom The reason that China and the US were most likely separated from the other countries is that their Total PPP
Adjusted Value Added is significantly higher due to their large population sizes and the fact that this GDP is not adjusted per capita
The optimal regression tree for the target Total GDP per Capita Valued Added had an R2 of 0.7 with 16 terminal nodes The most significant input variables in this tree were Country, Year, Corruption, Semi-Geographical grouping,
Property Rights, Trade Freedom, GDP lag, and Government Spending (in regressing order) The first split basically separates about half of the main OECD countries from the remaining countries The second split in the OECD countries looks at whether it was before or after 2007 Other interesting splits look at the year 2009, countries such as Ireland and Spain, GDP lag, and Corruption in the
less free countries
The optimal regression tree for the target PPP Adjusted Value Added had an R2 of 0.76 with 15 terminal nodes The most significant input variables in this tree were Country, Semi-Geographic, Income, Property Rights, Freedom
from Corruption, Colonization, Year, and Government Spending (in regressing order) The initial split once again separates out many of the OECD countries, but this time includes much more than half Other interesting splits in the “OECD” country branch look at the year 2000, the level of government spending, the
year 2008, lagged GDP, and Monetary Freedom Another interesting splits in the “non-OECD” country branch also looks at the year 2008
Regression Analysis
Neural Networks
Regression Tree Analysis
Principal Component
Analysis
Nearest Neighbor Analysis
Dislocation Analysis

181181Proprietary & Confidential. © 2011, glendonTodd Capital LLC
Principal Component Analysis – Significant Variables
The correlation matrix shows a high correlation (>.7) between Freedom from Corruption and Property Rights
Otherwise, the eigenvectors appear to be descriptive and non-zero meaning the Factor Scores are all descriptive of the variation in the data
Regression Analysis
Neural Networks
Regression Tree Analysis
Principal Component
Analysis
Nearest Neighbor Analysis
Dislocation Analysis

182182Proprietary & Confidential. © 2011, glendonTodd Capital LLC
Principal Component Analysis - Outliers
The bi-plots show the distribution of the observations along the newly created Factors (F1 and F2 below): This plot can be used to identify major outliers Outliers will cause a poor fit and the variables will only be able to determine whether the predictors describe the
set of outliers or the rest of the data set.
Regression Analysis
Neural Networks
Regression Tree Analysis
Principal Component
Analysis
Nearest Neighbor Analysis
Dislocation Analysis
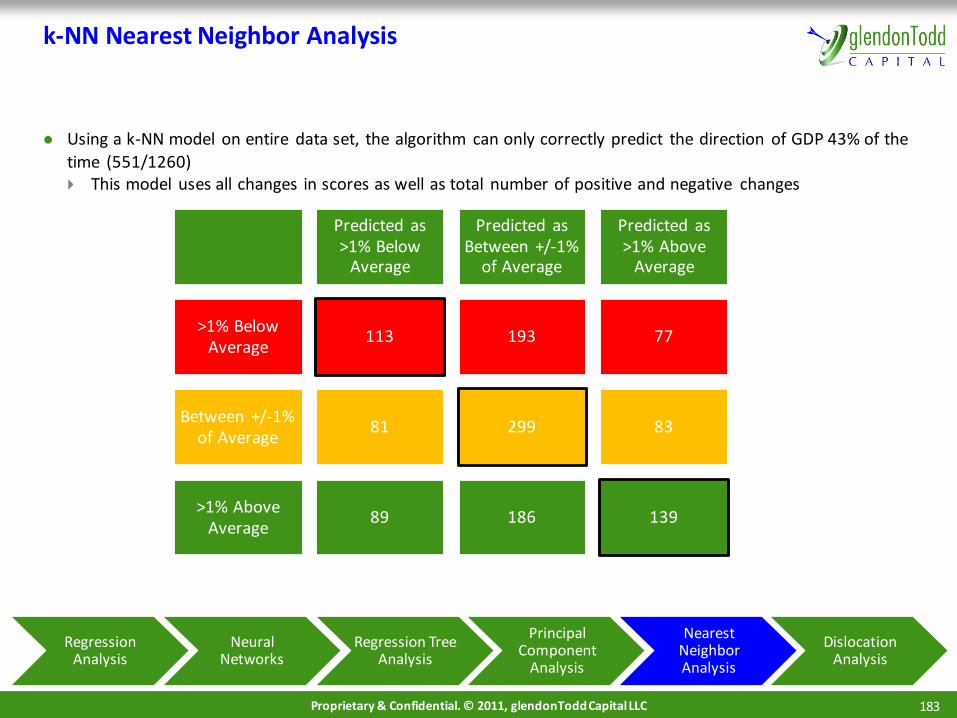
183183Proprietary & Confidential. © 2011, glendonTodd Capital LLC
k-NN Nearest Neighbor Analysis
Using a k-NN model on entire data set, the algorithm can only correctly predict the direction of GDP 43% of the
time (551/1260) This model uses all changes in scores as well as total number of positive and negative changes
Predicted as >1% Below
Average
Predicted as Between +/-1%
of Average
Predicted as >1% Above
Average
>1% Below Average
113 193 77
Between +/-1% of Average
81 299 83
>1% Above Average
89 186 139
Regression Analysis
Neural Networks
Regression Tree Analysis
Principal Component
Analysis
Nearest Neighbor Analysis
Dislocation Analysis

184184Proprietary & Confidential. © 2011, glendonTodd Capital LLC
K-NN Nearest Neighbor Regression
Using the package k-NN, we attempt to predict the PPP Adjusted Value Add per Capita:
Plotting the Difference between the Predictions and Observations— All points should lay on the horizontal line— The model poorly predicts the value of PPP Adjusted Value Add per Capita
Regression Analysis
Neural Networks
Regression Tree Analysis
Principal Component
Analysis
Nearest Neighbor Analysis
Dislocation Analysis

185185Proprietary & Confidential. © 2011, glendonTodd Capital LLC
Dislocation Analysis – Classification Tree Example
A classification tree can aid in explaining dislocations in GDP based on a country’s current factor scores and
changes in those scores
Regression Analysis
Neural Networks
Regression Tree Analysis
Principal Component
Analysis
Nearest Neighbor Analysis
Dislocation Analysis

186186Proprietary & Confidential. © 2011, glendonTodd Capital LLC
Overall Score Analysis
For Countries with higher levels of economic development and Overall Freedom, differences can be more subtle and how Freedom impacts
GDP growth, more complex Take Economies like Hong Kong that started in 1995 with a score of 100 in Business Freedom.
— In 2010, Business Freedom was at 98.7 but, baring the Financial Crisis, growth has remained strong throughout the period
Countries that already benefit from high levels of Freedom do not always see a direct impact from small changes in individual Freedom Factor scores or even small changes in Overall Freedom
There are many examples of Developing Countries showing improving growth rates as a number of Freedom Factors improve Countries that have extremely low levels of Freedom from Corruption and see that score improve typically see improvements in GDP
growth Conversely, those countries that do not see improvements in Freedom from Corruption typically undergo major political and civ il turmoil
over the period
Looking at three similar countries in Eastern Europe, Belarus, Moldova and Ukraine we see three very different outcomes over the 15 years: All three countries had similar increases in Freedom Factor scores but wildly different growth rates
Lukashenko has been the president of Belarus since 1994 and described as an authoritarian and western countries describe it as a dictatorship. Belarus also has a very close relationship with Russia, and preferential access to Russian markets
All these countries have their own issues, Belarus has recently gone into a decline due to outdated infrastructure and manufa cturing base
which was fueling its growth over the previous 15 years, Moldova slipped back into a soviet era communist party government an d suffered continuous political/civil unrest and Ukraine has had serious issues with government corruption which has passed power of large industry to powerful oligarchs that control much of the country’s production
Venezuela has had one of the most significant reductions in Freedom out of all the countries sampled When you look at the PPP Adjusted GDP per Capita, it has been one of the slowest growing countries
It is the only country to finish 2010 below an Overall Freedom score of 40 at 37.1 and the same year that Trade Freedoms fell and the two years following a drop in Business Freedom, GDP was strongly negative
During the 1980s, oil companies were nationalized and that trend has continued under Chavez who was elected in 1998.
The country has the lowest Investment and Property rights scores of any country in the sample and incredible volatility over the years in inflation and GDP growth

187187Proprietary & Confidential. © 2011, glendonTodd Capital LLC
Overall Score AnalysisAnalyzing Countries and their Factors for Freedom and Translating it into Growth… Overall Scores < 40
Filtered the list of Countries for those that, at any time during the 15 year period, had an Overall score below 40.— Belarus, Moldova, Ukraine, Venezuela, Vietnam and Zimbabwe were the only 5 out of 91 countries
Former USSR Countries with at least one year of <40 Overall Score
Belarus: Grew from 3,382 PPP Adj. PCGDP to 13,898 over the 15 year period (a 4.11x increase)— Belarus saw significant improvement in their Freedom Index Scores:
Overall has increased by 8.3 points since 1995 and in 2010 was at a 15 year high
Business Freedom has fluctuated over that period and now at a 15 year high while Fiscal and Monetary Freedom have increased significantly
During the best years of growth (2004-2008) , Belarus saw significant improvements in their Monetary Freedom Score while Fiscal
Freedom has increased over the 15 year period. Since 1995, a year after adoption of a national constitution, there has only been one year with sub 4% Per Capita GDP growth. Real
GDP Growth has been slightly lower due to a decreasing population in the country
There have been significant decreases in Investment Freedom, Property Rights and Financial Freedom.
Moldova: Grew from a 1,470 to 3,104 PPP Adj. PCGDP over the 15 year period (Over 2x PCGDP, <2x 1995 GDP due to shrinking Pop.)
Moldova only had one year in the 15 year period below a score of 40 (1995) which was likely due to low Financial, Trade and Monetary Freedom scores which all increased significantly in subsequent years. Trade freedom went from 17.6 to 75 from 1995 to
1996 and never dropped below 75 after that year. Moldova first introduced a market economy in 1992 which resulted in rapid inflation. Have had major political turmoil and was the first post-Soviet state where a non-reformed Communist Party returned to power(1)
The President of Moldova is elected by the parliament, a change that occurred in 2001.
(1) Horia C. Matei, "State lumii. Enciclopedie de istorie." Meronia, Bucureşti, 2006, p. 292-294

188188Proprietary & Confidential. © 2011, glendonTodd Capital LLC
Overall Score AnalysisAnalyzing Countries and their Factors for Freedom and Translating it into Growth… Overall Scores < 40
Ukraine: Grew from 3,123 to 6,698 PPP Adj. PCGDP over 15 years (Just over 2x but also less than 2x 1995 GDP because of shrinking Pop.)— Ukraine saw modest improvements in Freedom Scores:
Increases in Trade Freedom, Monetary Freedom and Fiscal Freedom have been offset by Decreases in Government Spending, Investment Freedom, and Business Freedom Corruption of Government by oligarchs who control major corporations, gas shortages stemming from conflicts with Russia over
prices likely led to a more severe recession in 2009 than similar and neighbor countries. Ukraine had one of the lowest Business Freedom scores in 2010 out of all the years for the <40 Overall Score group and the lo west
Overall Score of the three countries that were formerly part of Soviet Russia.
Ukraine’s worst year (2009 saw -13.51% PCGDP growth) was after three years of declines in Overall Freedom Property Rights has remained at a low of 30 and Investment Freedom and Business Freedom has decreased over the period Fiscal Freedom hit a high in 2006, while the country enjoyed its best years of growth but has since declined.
Countries in Other Regions with an Overall Score under 40 in at least one year:
Venezuela: Grew from 8,375 to 12,048 PPP Adj. PCGDP over the 15 year Period (Less than 50% increase in PCGDP and GDP <2x 1995)— Venezuela was the second worst performing country in the <40 Overall Score group with also the second worst Overall Freedom Score
at the end of 2010.
Overall Score went from 59.8 to 37.1, one of the largest changes positive or negative for countries in this group. Significant decreases occurred in Business, Trade, Investment, and Property (a score of 0 in 2010) Freedom Oil makes up 80% of the country’s exports and has led to underdevelopment of agricultural exports in coffee and cocoa. Becaus e of
this underdevelopment of agriculture, Venezuela imports approximately 2/3rds of its food. Political turmoil (national strikes) especially in 2002-2003 correlate with major drops in GDP where. the 2003 PCGDP level was
actually below the 1995 level
Venezuela has performed poorly during the economic crisis with two consecutive years of negative per capita GDP growth in 2009 and 2010 a net loss of approximately 9% of PCGDP PPP Adjusted.

189189Proprietary & Confidential. © 2011, glendonTodd Capital LLC
Overall Score AnalysisAnalyzing Countries and their Factors for Freedom and Translating it into Growth… Overall Scores < 40
Vietnam: Grew from 1,009 to 3,143 PPP Adj. PCGDP over the 15 year Period (Tripling PCGDP and 3.8x 1995 GDP)— Vietnam is now near its highest level of Overall Freedom:
1997 was the one year Vietnam registered an Overall Freedom Score below 40 and that proceeded its two worst years of GDP growth 1998 and 1999
1997 saw a significant drop in Fiscal Freedom which recovered in the year 2000 where the next 7 years saw growth north of 7%
Changes in Fiscal Freedom appears most correlated with changes in GDP growth rates Since the early 2000s, Vietnam has applied sequenced trade liberalization although it is not immediately apparent from the Trade
Freedom Scores. Between land reform and trade liberalization, Vietnam has become a major exporter of agricultural products.
Zimbabwe: Shrunk from 10.4 (bn) to 5.487 (bn) PPP Adj. GDP over the 15 year Period (Nearly cutting GDP in half)— Political Turmoil and forced land redistribution has plagued the country
Overall Freedom dropped from 48.5 to 36.7 and in 2010, reached an all -time recorded low of 21.4. During the decline in Freedom Zimbabwe recorded its worst declines in GDP growth with a staggering -16.95% GDP growth rate in
2003 where Financial, Property, and Investment Freedom were at historical lows of 10.
Overall Scores > 40, <50
Albania: Grew from 2,727 to 7468 PPP Adj. PCGDP over the 15 year Period (Nearly Tripling PCGDP and 2.8x 1995 GDP)— Albania saw significant improvements in its Overall Freedom Score:
Overall Freedom was at an all time high of 66, up from 49.7 in 1995.
The only year of negative growth was in 1997 at the failure of a number of Ponzi schemes and peaking with an armed rebellion leading to mass emigration.
Growth rates have been volatile but high single digits to double digits each year and Albania did not post a negative growth rate in
either 2009 or 2010 during the tail end of the global financial crisis.
190190Proprietary & Confidential. © 2011, glendonTodd Capital LLC
Overall Score AnalysisAnalyzing Countries and their Factors for Freedom and Translating it into Growth… Overall Scores > 40, <50
Bangladesh: Grew from 685 to 1,584.5 PPP Adj. PCGDP (3x 1995 GDP and 2.4x PCGDP)— Bangladesh saw a 10 point increase in its Overall Freedom Score, quickly jumping from 40.9 to 51.1 between ‘95 and ‘96 and then
fluctuating throughout the rest of the 15 year period. Business Freedom has increased while Investment, Financial and Property freedom have seen decreasing over the period Bangladesh had not a single year of negative growth and, since 2003 has not had a single year of sub 5% PCGDP growth.
Bolivia: Grew from 2,748 to 4,549 PPP Adj. PCGDP (2.12x 1995 GDP and 1.75x PCGDP)
— Bolivia went from a increase in Overall Freedom in the early 2000s to ultimately having a lower Overall Freedom Score in 2010compared to 1995 Property Freedom, after reaching a high in 1998 of 70, steadily decreased followed by 1999 being the only year of negative GDP
growth (PPP Adj.) In general, there is a large amount of volatility in Investment and Property Rights Freedom Scores Regional economic issues and political turmoil are typically blamed for sluggish growth in the country
The country was often hit by frequent and sometimes violent protests
Brazil: Grew from 6,469 to 11,314 PPP Adj. PCGDP over the 15 year Period (Only 1.75x 1995 PCGDP and 2.12x 1995 GDP)
— Brazil saw a quick 9 point increase in its Overall Freedom score in 1999 and by 2010 saw Overall Freedom slip back to 55.6 from a high of 63.4 in 2003. Brazil’s highest growth rates occurred in 2004 through 2007 while previous year’s Overall Freedom score was North of 60.
Biggest decreases came from drops in Business Freedom in 2006 and Fiscal Freedom in 2007 Brazil has the largest population of Uncontacted peoples and is the World’s 7th largest economy my Purchasing Power Parity

191191Proprietary & Confidential. © 2011, glendonTodd Capital LLC
Overall Score AnalysisAnalyzing Countries and their Factors for Freedom and Translating it into Growth… Overall Scores > 40, <50
Bulgaria: Grew from 5,828 to 12,965 PPP Adj. PCGDP over the 15 year Period (2.22x 1995 PCGDP and 2.01x 1995 GDP)— Bulgaria saw steady improvements in Overall Freedom during the 21st century after slightly dipping from 1995 to 2000.
Big improvements in Fiscal Freedom and Business Freedom lead to a rise in the Overall Freedom score. Starting in 2000, when Trade Freedom began to improve again, Bulgaria enjoyed high single digit to double digit growth up unt il
2009-2010
Bulgaria has a decreasing and relatively low Property Freedom score (30 as of 2010).
Cameroon: Grew from 1,444 to 2,176 PPP Adj. PCGDP over the 15 year Period (Only 1.5x 1995 PCGDP and 2.3x 1995 GDP)
— Cameroon saw only a 1 point increase in Overall Freedom over the period Growth was relatively stable although at an extremely low level for a small country. Investment Freedom only declined recently and Trade freedom had the largest positive move since 1995.
Business Freedom declined as well from 55 to 37.2 Corruption is rife and literacy rates are around 67.9% with one of the highest school attendance rates in Africa.
Ecuador: Grew from 4,418 to 7,828 PPP Adj. PCGDP over the 15 year Period (Only 1.77x 1995 PCGDP and 2.21x 1995 GDP)— Overall Freedom remained in mid 50s until 2010 where it dropped to 49.3
Investment Freedom and Property Rights have decreased over the period
Trade Freedom has increased by 10 points while other Freedom scores have remained relatively level Average PCGDP growth has been in low single digit for much of the period
Egypt: Grew from 2,996 to 6,417 PPP Adj. PCGDP over the 15 year Period (2.14x 1995 PCGDP and 2.93x 1995 GDP)— Overall Freedom in 2010 was at a high of 59
High single digit growth from 2006 to 2008 was accompanied by a change in Business Freedom from 39.8 to 60.2 over the period.
Fiscal Freedom and Trade Freedom grew significantly over the period. Freedom from Corruption scores were low from 50 down to 28 and Financial Freedom was volatile ranging from 30 to 70.

192192Proprietary & Confidential. © 2011, glendonTodd Capital LLC
Overall Score AnalysisAnalyzing Countries and their Factors for Freedom and Translating it into Growth… Overall Scores > 40, <50
Ethiopia: Grew from 398 to 1,019 PPP Adj. PCGDP over the 15 year Period (2.56x 1995 PCGDP and 3.81x 1995 GDP)— Ethiopia saw an increase from an Overall Freedom score of 42.6 to 51.2
Investment Freedom went from 10 in 1995 to a high of 50 in 2004 when the country’s PCGDP grew at 13.96% and continued double digit grow rates through 2008.
Trade Freedom went from a low of 27 and is now in the 60s.
Grow rates have been volatile with two negative years but high single digits in 2009 and 2010 During 1998 (when Ethiopia experienced negative growth) they were at war with Eritrea which lasted until 2000. There were only modest decreases in economic freedom scores during the poor growth in 2002 and 2003.
Guyana: Grew from 3,432 to 7,035 PPP Adj. PCGDP over the 15 year Period (2.05x 1995 PCGDP and 2.04x 1995 GDP)— Guyana saw little net change in Overall Freedom scores although it did reach a level 11 points higher than 1995 in 2006.
The two years following Guyana’s highest freedom scores, it put inn impressive growth of 8.22% and 9.87% vs an average of around 5% for the entire period. These scores also coincided with highest levels for most of the individual Factor scores
Haiti: Grew from 948 to 1,163 PPP Adj. PCGDP over the 15 year Period (1.23x 1995 PCGDP and 1.54x 1995 GDP)— Haiti saw an 7.8 point increase in Overall Freedom:
Haiti saw modest declines in Business Freedom which was already at a low level in 1995 (40) and levels
Property Freedom remains at 10 and Investment as well as Financial Freedom are at 30.
India: Grew from 1,150 to 3,419 PPP Adj. PCGDP over the 15 year Period (2.97x 1995 PCGDP and 3.79x 1995 GDP)
— India’s Overall Freedom grew from 45.1 to 53.8 over the period rather consistently Most significant improvement was from trade freedom of 0 to 67.9 Although a great deal of volatility in GDP, India reported strong numbers in 2009 and 2010 (7.86% and 9.29%) while Trade Free dom
continued to increase Liberalization of trade has been occurring in the country since 1991.

193193Proprietary & Confidential. © 2011, glendonTodd Capital LLC
Overall Score AnalysisAnalyzing Countries and their Factors for Freedom and Translating it into Growth… Overall Scores > 40, <50
Ivory Coast: Grew from 1,440 to 1,683 PPP Adj. PCGDP over the 15 year Period (1.17x 1995 PCGDP and 1.74x 1995 GDP)— There was little net change in Overall Freedom in the country started at 53.4 to 54.1
Business Freedom was at 70 in 1995 and decreased to 43.7 in 2010 While most Freedom Scores are high, the country has gone through a number of coups starting in 1999. 180 people died in 2000
prior to an election during a public uprising.
In 2002, Ivory Coast had its first Civil War and a peace accord was not signed until 2007 The elections that were delayed until 2010 were accused of rampant fraud and in 2011 the country was in its Second Civil war after
becoming independent from France in 1958.
The country was one of the most prosperous in the region with annual growth rates nearly 10% for 20 years, impressive for non -oil-exporting countries.
Mongolia: Grew from 1,753 to 4,020 PPP Adj. PCGDP over the 15 year Period (2.29x 1995 PCGDP and 2.83x 1995 GDP)— Overall Freedom grew from 47.8 to 60 in 2010.
Trade Freedom, Fiscal Freedom and Monetary Freedom increased significantly over the period
A boom in the mining sector in 2007-2008 led to a few years of high growth although 2003-2007 saw high single to low double digit growth.
Mozambique: Grew from 311 to 1,011 PPP Adj. PCGDP over the 15 year Period (3.25x 1995 PCGDP and 4.43x 1995 GDP)— Overall Freedom grew from 45.5 to 56
Overall Freedom reached a high in 2001 of 59.2 and growth that year was 11.43%
The years following the first increases in Financial Freedom, Monetary Freedom and Investment Freedom saw increases in the average GDP growth rate.
Devastating floods in 2000 had incredibly short term effects, in spite of the floods, GDP growth went from 2.1% in 2000 to 14.8% in
2001

194194Proprietary & Confidential. © 2011, glendonTodd Capital LLC
Overall Score AnalysisAnalyzing Countries and their Factors for Freedom and Translating it into Growth… Overall Scores > 40, <50
Nicaragua: Grew from 1,489 to 3,037 PPP Adj. PCGDP over the 15 year Period (2.04x 1995 PCGDP and 2.28x 1995 GDP)— Overall Freedom improved from 42.5 to 58.3 over the period
Trade freedom went from 54.4 to 82.8 and Monetary Freedom went from zero to 64.1 There are large gaps in information prior to 2004; information may be inaccurate.
Nigeria: Grew from 1,015 to 2,420 PPP Adj. PCGDP over the 15 year Period (2.38x 1995 PCGDP and 3.58x 1995 GDP)— Overall Freedom increased from 47.3 to 56.8
Trade Freedom increased in 2005 which followed two years of 9.89% growth and 10.93% growth in PCGDP
The following years saw increased growth compared to the previous 10 years. Investment Freedom, Property Rights and Financial Freedom all decreased over the period The Democratic Era began in 1999 after 33 years of military rule. Growth that year and the following years was substantially higher
than previously.
Romania: Grew from 5,814 to 11,904 PPP Adj. PCGDP over the 15 year Period (2.05x 1995 PCGDP and 1.92x 1995 GDP)
— Overall Freedom increased from 42.9 to 64.2 Business Freedom has only recently increased while early on Trade Freedom decreased only to reach new highs in 2010 of 87.5
after reaching a low of 57.6
Fiscal Freedom has increased over the period significantly and its largest jumps have coincided with the largest PCGDP growth rates in 2000, 2004 and 2006.
Romania instituted a flat tax in 2005 and it wasn’t until the year 2000 that the country was able to replace its obsolete industrial
base and lack of structural reforms from Communist rule which ended in 1989.
195195Proprietary & Confidential. © 2011, glendonTodd Capital LLC
Overall Score AnalysisAnalyzing Countries and their Factors for Freedom and Translating it into Growth… Overall Scores > 40, <50
Russia: Grew from 6,422 to 15,657 PPP Adj. PCGDP over the 15 year Period (2.44x 1995 PCGDP and 2.35x 1995 GDP)— Overall Freedom decreased by 0.8 points over the period
Trade, Fiscal and Monetary Freedom saw the only increases while Investment, Property, Business saw major declines. GDP growth can be characterized as volatile going from high single digits to negative with little correlation between any of the
freedom score and GDP growth rates.
A natural resource rich country, since 2000 has grown precipitously. Russia has had a flat tax of 13% since 2001. Political stability is noted as one of the reasons for high economic growth.
Yemen: Grew from 1,701 to 2,598 PPP Adj. PCGDP over the 15 year Period (1.53x 1995 PCGDP and 2.44x 1995 GDP)— Overall Freedom has increased from 49.8 to 54.4 and steady 3-4% GDP growth
Financial, Property, and Freedom from Corruption scores all remain very low.
Yemen is one of the poorest Middle East countries with a growing young population and dwindling natural resources 46% of the population is under 15 years old with a fertility rate of 4.45 children per woman.
Overall Scores > 50, <60
Algeria: Grew from 3,872 to 7,112 PPP Adj. PCGDP over the 15 year Period (1.83x 1995 PCGDP and 2.32x 1995 GDP)
— Overall Freedom has increased from 55.7 to 56.9 and is well off a high of 61 reached in 2002 PCGDP growth improved around the same time there were improvements in Fiscal Freedom and Monetary Freedom Algeria was engaged in a Civil war between 1992 and 2002
Excluding 2005, after 2002, PC GDP (PPP Adj.) growth rates remained in the high single digits
Argentina: Grew from 7,878 to 15,901 PPP Adj. PCGDP over the 15 year Period (2.02x 1995 PCGDP and 2.35x 1995 GDP)
— Overall Freedom has decreased from 68 to 51.2 and hit a high of 74.7 back in 1996 Four years of negative GDP growth occurred a few years after Overall Freedom reached a high and began to decline. The worst year for growth was the same year Trade freedom hit a low
Issues cited in Transparency International’s Corruption Perceptions Index include government corruption, lack of judicial independence, huge taxes and tariffs, and regulatory interference that undermines efficiency and productivity growth
Many changes and high corruption level may explain volatility in growth rate albeit high on average.

196196Proprietary & Confidential. © 2011, glendonTodd Capital LLC
Overall Score AnalysisAnalyzing Countries and their Factors for Freedom and Translating it into Growth… Overall Scores > 50, <60
Botswana: Grew from 6,176 to 15,179 PPP Adj. PCGDP over the 15 year Period (2.46x 1995 PCGDP and 3.06x 1995 GDP)— Overall Freedom increased steadily from 56.8 to 70.3
Growth has been slower in recent years many freedom scores were relatively high already in 1995. 2009 GDP growth was significantly negative but rebounded strongly in 2010 from -4.93 to +7.2 In 2002, Investment Freedom increased from 50 to 70 and GDP growth rose to 8.96% from 3.5%
The following years were relatively volatile Botswana went from one of the poorest countries in 1966 to one of the fastest-growing economies in the World and has a strong
tradition as a representative democracy
China: Grew from 1,513 to 7,550 PPP Adj. PCGDP over the 15 year Period (4.99x 1995 PCGDP and 5.52x 1995 GDP)— Overall Freedom went down by 1 point
Since the introduction market-based economic reforms in 1978, China has become the world’s fastest-growing major economy. In Roll and Talbott’s 2001 paper, Deng Xiaoping’s market-oriented reforms are considered a democratic event Trade Freedom has increased throughout the period and GDP growth rates have remained high between 8-12 percent on average
Colombia: Grew from 5,528 to 9,585 PPP Adj. PCGDP over the 15 year Period (1.73x 1995 PCGDP and 2.1x 1995 GDP)— Overall Freedom was up by 1 point in 2010 compared to 1995 and fluctuated only slightly throughout the period
Freedom from Corruption score was at a intermediate low in 1999 when GDP growth was negative Freedom from Corruption has recently improved, Business Freedom is moving back towards the high reached in 1995 and GDP
growth is in mid single digits over last few years
Other scores have not changed significantly GDP growth rates have increased from 2003 onward, despite armed conflicts Investment as a portion of GDP has also soared from 15% in 2002 to 26% in 2008
Number of homicides in the country have decreased during the 21st century.

197197Proprietary & Confidential. © 2011, glendonTodd Capital LLC
Overall Score AnalysisAnalyzing Countries and their Factors for Freedom and Translating it into Growth… Overall Scores > 50, <60
Dominican Republic: Grew from 3,871 to 8,860 PPP Adj. PCGDP over the 15 year Period (2.29x 1995 PCGDP and 2.99x 1995 GDP)— Overall Freedom increased from 55.8 to 60.3 in 2010
Trade Freedom dropped from 60.8 to 44.4 and GDP growth dropped to -.25 and 1.31 in 2003 and 2004 respectively and then climbed to an all time high in 2010 of 80.4 while GDP growth was in high single digits.
The Business Freedom and Trade Freedom began increasing around the time GDP growth accelerated from a low single digit
average growth rate to high single digits. (from average 4% to 7%) Despite an antiquated power grid, the country has had solid economic growth
France: Grew from 21,315 to 33,997 PPP Adj. PCGDP over the 15 year Period (1.59x 1995 PCGDP and 1.73x 1995 GDP)— Overall Freedom Decreased by 0.2 points
Business Freedom dropped from 85 to 70 during a time of slow economic growth (Sub 2% average growth) Trade Freedom has increased slightly over the period while Fiscal, has decreased Property Rights have remained high while Financial Freedom has increased
Government Spending scores have been extremely low over the entire 15 year period France’s public debt is 86.5% of annual GDP which is close to the threshold set by Reinhart and Rogoff (2012) where it becomes a
drag on GDP
Gabon: Grew from 12,436 to 15,197 PPP Adj. PCGDP over the 15 year Period (1.22x 1995 PCGDP and 1.72x 1995 GDP)— Overall Freedom Decreased by 2.1 points
Over the period there were significant declines in Business Freedom, Investment, Financial, Freedom from Corruption and a sli ghtdecrease in Property Rights
The average growth rate was significantly worse in 1999 onward when Overall Freedom reached a high and started to decline.
The country has had very volatile growth going back to the 1980s Throughout the 1995-2010 period there has been significant political and civil unrest.

198198Proprietary & Confidential. © 2011, glendonTodd Capital LLC
Overall Score AnalysisAnalyzing Countries and their Factors for Freedom and Translating it into Growth… Overall Scores > 50, <60
Ghana: Grew from 1,194 to 2,725 PPP Adj. PCGDP over the 15 year Period (2.28x 1995 PCGDP and 3.33x 1995 GDP)— Overall Freedom increased from 55.6 to 60.2 in 2010
The average growth rate has increased in recent years as Business Freedom and Trade Freedom have increased Growth has been relatively stable particularly for an African country and Investment Financial, and Property Freedom scores h ave
remained at a moderately high level over the entire period.
Jerry John Rawlings ruled the country for 20 years and significantly increased the public debt, since then there have been many fiscal and economic reforms including re-denomination of the currency in 2007 improving stability
Greece: Grew from 14,964 to 27,668 PPP Adj. PCGDP over the 15 year Period (1.85x 1995 PCGDP and 1.94x 1995 GDP)— Overall Freedom increased from 61.2 to 62.7 in 2010
Overall Freedom throughout the period has remained flat
Business Freedom, Financial Freedom and Monetary Freedom have increased while Government Spending, Investment Freedom, Freedom from Corruption and Property Freedom have Decreased
GDP has shrunk over the past few years while public debt-to-GDP stood at 165% in 2011 well over the Threshold set by Reinhart &
Rogoff (2012)
Guatemala: Grew from 3,471 to 4,902 PPP Adj. PCGDP over the 15 year Period (1.41x 1995 PCGDP and 2.17x 1995 GDP)
— Overall Freedom decreased from 62 to 61 in 2010 Guatemala has had a low growth rate throughout the entire period with one year of > 5 percent growth in 2007 when Trade
Freedom Increased to an all time high of 80.2 and Financial Freedom increased to 60
Overall Freedom hit a high in 1999 of 66.2 and has decreased until 2010 where it had a slight increase from 59.4 to 61 Guatemala suffered a 36 year civil war that did not end until 1996.

199199Proprietary & Confidential. © 2011, glendonTodd Capital LLC
Overall Score AnalysisAnalyzing Countries and their Factors for Freedom and Translating it into Growth… Overall Scores > 50, <60
Guinea: Grew from 718 to 1,049 PPP Adj. PCGDP over the 15 year Period (1.46x 1995 PCGDP and 2.02x 1995 GDP)— Overall Freedom decreased from 59.4 to 51.8 in 2010
GDP growth slowed significantly around the time Trade Freedom dropped from 70.2 to 19 in a two year period. Property Freedom has Decreased from 50 to 20, Financial Freedom has dropped from 70 to 40 Lowest years of growth coincide with lowest Property Freedom Scores and Trade Freedom Scores
The country may have as much as half the world’s supply of Bauxite Has maintained a very low score for Freedom from Corruption
Honduras: Grew from 2,686 to 4,192 PPP Adj. PCGDP over the 15 year Period (1.56x 1995 PCGDP and 2.23x 1995 GDP)— Overall Freedom increased from 57 to 58.3 in 2010
Freedom from Corruption scores never reached above 30
Fiscal Freedom, Financial Freedom, Trade Freedom and Business Freedom increased, while Freedom from Corruption and Property Freedom decreased
Overall Freedom peaked a few years before growth reached a peak
Financial Freedom did not increase until a year after the first of a few years of 6%+ GDP growth. Despite massive damage fro Hurricane Mitch in 1998, the country managed to get back to accelerating growth as Overall Freedom
hit a high in 2003 of 60.4
Hungary: Grew from 9,451 to 18,809 PPP Adj. PCGDP over the 15 year Period (1.99x 1995 PCGDP and 1.93x 1995 GDP)— Overall Freedom increased from 55.2 to 66.1 in 2010
Trade, Fiscal, Monetary, and Investment Freedom all increased while Business Freedom decreased in 1996 and never regained itshigh
The one year Financial Freedom dropped (2007) GDP growth went from averaging around 4% to the next two years sub 1% and
2009 GDP growth was -6.8% Many state owned enterprises have not been privatized and regulations are not applied consistently. Experienced market liberalization in early 1990s

200200Proprietary & Confidential. © 2011, glendonTodd Capital LLC
Overall Score AnalysisAnalyzing Countries and their Factors for Freedom and Translating it into Growth… Overall Scores > 50, <60
Indonesia: Grew from 2,297 to 4,353 PPP Adj. PCGDP over the 15 year Period (1.46x 1995 PCGDP and 2.02x 1995 GDP)— Overall Freedom increased from 54.9 to 55.5 in 2010
Business Freedom slightly decreased while Trade Freedom increased significantly Investment and Property Freedom both decreased from 50 to 30. The worst GDP growth year was 1998 at the peak of Overall Freedom ad had a solid 2009 of 4.63% growth
President Suharto resigned in 1998 and Indonesia then proceeded with major political and governmental structural reforms Country hardest hit by the Asian financial crisis Many business borrowed in dollars which was a net advantage as the currency strengthened
Italy: Grew from 20,674 to 29,841 PPP Adj. PCGDP over the 15 year Period (1.44x 1995 PCGDP and 1.53x 1995 GDP)— Overall Freedom increased from 61.2 to 62.7 in 2010
GDP growth has been poor throughout the entire period. Freedom from Corruption started at 70 in 1995 and is currently at 48 There has been large government expenditures in the country leading to 116% public debt to GDP in 2010
Kenya: Grew from 1,128 to 1,676 PPP Adj. PCGDP over the 15 year Period (1.48x 1995 PCGDP and 2.14x 1995 GDP)— Overall Freedom increased from 54.5 to 57.5 in 2010
Freedom from Corruption went from 50 to 21 over the period Monetary Freedom increased over the period from 50.4 to 72.7 Monetary Freedom hit a high of 82.9 in 2004, the same year growth rates started to accelerate.
Next four years of growth of 4.62, 5.98, 6.33 and 6.99 The country has gone through political and civil unrest including protests in 2007 that escalated into violence resulting in nearly
1000 deaths and 600,000 people displaced.

201201Proprietary & Confidential. © 2011, glendonTodd Capital LLC
Overall Score AnalysisAnalyzing Countries and their Factors for Freedom and Translating it into Growth… Overall Scores > 50, <60
Madagascar: Grew from 676 to 933 PPP Adj. PCGDP over the 15 year Period (1.38x 1995 PCGDP and 2.10x 1995 GDP)— Overall Freedom increased from 51.6 to 63.2 in 2010
The country has seen dramatic population growth Trade Freedom has increased significantly and annual GDP growth has been strong averaging north of 5% when excluding 2002 Economic reforms were implemented in 1996 with only gradual progress
In 2001 the contested presidential elections led to a 7-month standoff which had devastating impacts on the economy.
Malawi: Grew from 470 to 821 PPP Adj. PCGDP over the 15 year Period (1.75x 1995 PCGDP and 2.57x 1995 GDP)
— Overall Freedom decreased from 54.7 to 54.1 in 2010 Freedom from Corruption was below 30 from 2004 onward Monetary, Trade, and Fiscal Freedom increased over the period
Malawi’s political environment is described as “challenging” and government corruption is still a serious issue
Malaysia: Grew from 7,523 to 14,744 PPP Adj. PCGDP over the 15 year Period (1.96x 1995 PCGDP and 2.68x 1995 GDP)
— Overall Freedom decreased from 71.9 to 64.8 in 2010 Trade Freedom and Fiscal Freedom increased Highest growth rates were in 1995 and 1996, which coincide with the two highest Overall Freedom Scores
Malaysia is a relatively open state-oriented economy. The state has a significant but declining role in guiding economic activi ty
Mali: Grew from 556 to 1,109 PPP Adj. PCGDP over the 15 year Period (1.96x 1995 PCGDP and 3.02x 1995 GDP)
— Overall Freedom increased from 52.4 to 55.6 in 2010 Became a constitutional democracy in 1992 and since 2002, has moved to an increasingly pragmatic and pro-Western country While Freedom From Corruption and Fiscal Freedom has improved, Business, Property, and Monetary Freedom have decreased
202202Proprietary & Confidential. © 2011, glendonTodd Capital LLC
Overall Score AnalysisAnalyzing Countries and their Factors for Freedom and Translating it into Growth… Overall Scores > 50, <60
Mexico: Grew from 8,247 to 13,932 PPP Adj. PCGDP over the 15 year Period (1.69x 1995 PCGDP and 2.08x 1995 GDP)— Overall Freedom increased from 63.1 to 68.3 in 2010
Business, Trade, Fiscal, Monetary, Financial Freedom all increased significantly Growth rates are volatile and Freedom from Corruption score is low Mexico has an extremely high crime rate and has been in a drug war since 2006 although influence and impact of the drug trade in
Mexico has persisted for much longer. Freedom scores have been increasing since the 21st century while GDP growth has been poor thus far
Morocco: Grew from 2,193 to 4,794 PPP Adj. PCGDP over the 15 year Period (2.19x 1995 PCGDP and 2.64x 1995 GDP)— Overall Freedom decreased from 62.8 to 59.2 in 2010
Growth was highest at 12.22% in 1996 when Overall Freedom was at its peak and growth was also high in 2006 (7.76% when
Freedom was at its low. Trade Freedom has been very volatile and has increased significantly in recent years Freedom from Corruption has decreased significantly as well as Property Freedom
Political reforms in the 90s resulted in a bicameral legislature being established in 1997.
Pakistan: Grew from 1,507 to 2,720 PPP Adj. PCGDP over the 15 year Period (1.80x 1995 PCGDP and 2.52x 1995 GDP)
— Overall Freedom decreased from 57.6 to 55.2 in 2010 The highest growth year was the same year Overall Freedom was at a low (2005) Has not had a negative GDP growth year for the entire period
Freedom from Corruption score has improved although still very low Business, Trade and Fiscal Freedom Scores have improved significantly Investment, Financial and Property Freedom have decreased significantly
The country underwent extensive economic reforms from 2001 to 2008 Pakistan has been democratic since 1985

203203Proprietary & Confidential. © 2011, glendonTodd Capital LLC
Overall Score AnalysisAnalyzing Countries and their Factors for Freedom and Translating it into Growth… Overall Scores > 50, <60
Paraguay: Grew from 3,443 to 5,208 PPP Adj. PCGDP over the 15 year Period (1.51x 1995 PCGDP and 2.02x 1995 GDP)— Overall Freedom decreased from 65.9 to 61.3 in 2010
The worst years were during the decline in Overall Freedom Property Freedom declined form 50 to 30 the year prior to two consecutive years of negative GDP Growth Freedom from Corruption score is extremely low but has improved since 1995 from 10 to 24
Investment Freedom and Property Freedom have declined significantly Constitution in 1992 dramatically improved fundamental rights Sluggish period between 1998 to 2002 appears to be a direct result of political and civil instability
Peru: Grew from 4,453 to 9,358 PPP Adj. PCGDP over the 15 year Period (2.10x 1995 PCGDP and 2.66x 1995 GDP)— Overall Freedom increased from 56.9 to 67.6 in 2010
The best growth has come recently while Overall Freedom has been improving Business, Trade and Property Freedom all improved around the time growth starting averaging 7% The country accumulated a large external debt during the 1980s which was reduced from 1990-2000
Reforms and economic liberalization occurred during the 1990s The Asian financial crisis apparently contributed to a short term slump in GDP growth
Poland: Grew from 7260 to 18,951 PPP Adj. PCGDP over the 15 year Period (2.61x 1995 PCGDP and 2.58x 1995 GDP)— Overall Freedom increased from 50.7 to 63.2 in 2010
GDP growth was strong in 1995 to 1997 where Overall Freedom increased by 6.1 points.
Investment, Business, and Financial Freedom have decreased in recent years Poland stands as one of the best examples of a centrally planned to a market-based economy Since the fall of communism, Poland has pursued a policy of liberalizing the economy
Poland continues to privatize and restructure sensitive portions of the economy

204204Proprietary & Confidential. © 2011, glendonTodd Capital LLC
Overall Score AnalysisAnalyzing Countries and their Factors for Freedom and Translating it into Growth… Overall Scores > 50, <60
Slovakia: Grew from 8,801 to 22,122 PPP Adj. PCGDP over the 15 year Period (2.51x 1995 PCGDP and 2.55x 1995 GDP)— Overall Freedom increased from 60.4 to 69.7 in 2010
Business, Fiscal, Monetary, and Financial all increased significantly at around the same time GDP growth rates began to accel erate All freedom scores are at or near highs excluding Labor Freedom and Financial Freedom. Financial Freedom is still at 70 thou gh Slovakia became an independent state in 1993 in a peaceful dissolution of Czechoslovakia
Spain: Grew from 17,191 to 29,881 PPP Adj. PCGDP over the 15 year Period (1.74x 1995 PCGDP and 2.03x 1995 GDP)— Overall Freedom increased from 62.8 to 69.6 in 2010
GDP growth has been rather steady throughout the entire period Freedom Scores have been stable with Fiscal /Freedom and Government Spending having the greatest amount of change A real estate bubble busting is credited with causing the negative growth in 2009 and 2010 during the financial crisis
Sri Lanka: Grew from 2,132 to 5,169 PPP Adj. PCGDP over the 15 year Period (2.42x 1995 PCGDP and 2.86x 1995 GDP)— Overall Freedom decreased from 60.6 to 54.6 in 2010
Business, Trade, and Fiscal Freedom improved while Investment, Financial, Property and Freedom from Corruption declined GDP growth has been strong throughout the 15 year period baring 2001
Swaziland: Grew from 3,042 to 5,156 PPP Adj. PCGDP over the 15 year Period (1.69x 1995 PCGDP and 1.98x 1995 GDP)— Overall Freedom decreased from 63.3 to 57.4 in 2010
GDP growth was relatively low throughout the entire period
Investment, Business, Property and Freedom from Corruption declined Trade and Monetary Freedom improved ~50% of GDP is government services and a constitution was recently put into place in 2005 and still hotly contested.
205205Proprietary & Confidential. © 2011, glendonTodd Capital LLC
Overall Score AnalysisAnalyzing Countries and their Factors for Freedom and Translating it into Growth… Overall Scores > 50, <60
Tanzania: Grew from 626 to 1,418 PPP Adj. PCGDP over the 15 year Period (2.27x 1995 PCGDP and 3.16x 1995 GDP)— Overall Freedom increased from 57.3 to 58.3 in 2010
Trade, Fiscal, Monetary and Investment Freedom improved while Business Freedom declined GDP growth improved in the later years but remained relatively stable throughout the period as well as all Freedom scores
remained relatively stable
The Philippines: Grew from 2,116 to 3,920 PPP Adj. PCGDP over the 15 year Period (1.85x 1995 PCGDP and 2.55x 1995 GDP)— Overall Freedom increased from 55 to 56.3 in 2010
Business, Fiscal, Investment and Property Freedom declined over the period while Trade Freedom improved significantly Overall Freedom was at a high the one year (1998) the country experienced negative GDP growth The country’s economic reforms first implemented in ‘92 were impacted by both the Asian financial crisis in ‘97 and charges o f
corruption
Tunisia: Grew from 3,994 to 9,454 PPP Adj. PCGDP over the 15 year Period (2.37x 1995 PCGDP and 2.82x 1995 GDP)
— Overall Freedom declined from 63.4 to 58.9 in 2010 Tunisia’s worst year of GDP growth in 2002 is after years of declining Overall Freedom and coincides with a large drop in Trade
Freedom
Investment and Financial Freedom has declined substantially
Turkey: Grew from 6,709 to 13,275 PPP Adj. PCGDP over the 15 year Period (1.98x 1995 PCGDP and 2.51x 1995 GDP)
— Overall Freedom increased from 58.4 to 63.8 in 2010 Growth rates have been volatile as well as Overall Freedom ranging from a high of 63.4 to a low of 50.6 Business, Property, and Financial Freedom declined while Trade, Fiscal, and Monetary Freedom improved
1999 and 2001 (negative growth years) occur the same years as declines in Overall Freedom Freedom from Corruption has improved substantially There was a major earthquake in 1999
The 1999 to 2001 period involved high government debt and rampant government corruption

206206Proprietary & Confidential. © 2011, glendonTodd Capital LLC
Overall Score AnalysisAnalyzing Countries and their Factors for Freedom and Translating it into Growth… Overall Scores > 50, <60
Uganda: Grew from 542 to 1,252 PPP Adj. PCGDP over the 15 year Period (2.31x 1995 PCGDP and 3.74x 1995 GDP)— Overall Freedom declined from 62.9 to 62.2 in 2010
High growth rates occurred during times of Trade Freedom and the lowest growth rate (1998 3.81% growth) occurred during a time of very low Trade Freedom
The period 1990 to 2001 has been characterized as growth by economic reform and investment
Trade Freedom increased significantly as well as Monetary and Financial
Zambia: Grew from 824 to 1,517 PPP Adj. PCGDP over the 15 year Period (1.84x 1995 PCGDP and 2.64x 1995 GDP)
— Overall Freedom increased from 55.1 to 58 in 2010 GDP growth has been stronger in the last 7 years than the previous 8. Business and Trade and Monetary Freedom have improved while Investment, Financial and Property Freedom have declined
Foreign investment in the country’s mining has been attributed to stabilization and increased economic growth The country is highly dependent on copper as an export

207207Proprietary & Confidential. © 2011, glendonTodd Capital LLC
Overall Score AnalysisAnalyzing Countries and their Factors for Freedom and Translating it into Growth… Overall Scores > 60
Australia: Grew from 21,709 to 39,090 PPP Adj. PCGDP over the 15 year Period (1.80x 1995 PCGDP and 2.22x 1995 GDP)— Overall Freedom increased from 74.1 to 82.6 in 2010
GDP growth has been steady although slowed, but never went negative, during financial crisis Business, Trade and Investment Freedom have increased All Freedom scores are relatively high as well as Overall Freedom
Austria: Grew from 22,866 to 39,849 PPP Adj. PCGDP over the 15 year Period (1.74x 1995 PCGDP and 1.84x 1995 GDP)— Overall Freedom increased from 70 to 71.6 in 2010
There was a decrease in Trade Freedom the two years of sub 1% growth and the year of negative growth (2009)
Bahrain: Grew from 16,895 to 27,037 PPP Adj. PCGDP over the 15 year Period (1.6x 1995 PCGDP and 3.05x 1995 GDP)
— Overall Freedom increased from 76.2 to 76.3 in 2010 Business Freedom decreased while GDP growth accelerated Financial Freedom increased around same time growth rate accelerated
All Freedom scores are relatively high regardless Many Freedoms were instituted in 2001, after an uprising, including giving women the right to vote, elections for parliament and
releasing political prisoners. The years following, the country saw accelerated growth
Personal Freedoms are not well reflected in the Freedom Index
Canada: Grew from 22,810 to 39,154 PPP Adj. PCGDP over the 15 year Period (1.72x 1995 PCGDP and 2.00x 1995 GDP)
— Overall Freedom increased from 69.4 to 80.4 in 2010 GDP growth rates have been decreasing over recent years Monetary Freedom has decreased while almost all other scores have increased

208208Proprietary & Confidential. © 2011, glendonTodd Capital LLC
Overall Score AnalysisAnalyzing Countries and their Factors for Freedom and Translating it into Growth… Overall Scores > 60
Chile: Grew from 7,911 to 16,112 PPP Adj. PCGDP over the 15 year Period (2.04x 1995 PCGDP and 2.46x 1995 GDP)— Overall Freedom increased from 71.2 to 77.2 in 2010
Business Freedom has declined while most other Freedoms have increased. Investment recently increased while Freedom from Corruption has increased dramatically Trade freedom has also increased a great deal around the time growth rates improved after sluggish years (1998-2002)
Chile had a reputation in the early 1990s as a model of economic reform
Costa Rica: Grew from 19.672 to 51.718 PPP Adj. GDP over the 15 year Period (2.63x 1995 GDP)
— Overall Freedom decreased from 68 to 65.9 in 2010 Highest Overall Freedom in 2000 was only 0.4 higher than 1995 GDP growth has been volatile
Business and Monetary Freedom have declined while Trade Freedom has increased A large source of revenue is from tourism which can be impacted by many outside factors
Czech Republic: Grew from 12,906 to 26,122 PPP Adj. PCGDP over the 15 year Period (2.02x 1995 PCGDP and 2.06x 1995 GDP)— Overall Freedom increased from 67.8 to 69.8 in 2010
Has had very volatile growth and volatile Business Freedom Scores
Fiscal, Trade and Monetary Freedom have improved Lowest Business Freedom score coincides with highest GDP growth year over the period (2006) Most of the economy has been privatized after 1993 when the country went through economic reforms with the intention of
creating a capitalist economy
El Salvador: Grew from 4,294 to 7,340 PPP Adj. PCGDP over the 15 year Period (1.71x 1995 PCGDP and 1.90x 1995 GDP)
— Overall Freedom increased from 69.1 to 69.9 in 2010 Had a high growth rate from 1990-1995 but since, average growth has been 2.3% Business Freedom has declined
There was a period where Freedom Scores (Overall and Individual) improved but GDP growth was poor (2000-2004) Economic reforms in early 90s brought major benefits, however crime still remains a problem for the investment climate

209209Proprietary & Confidential. © 2011, glendonTodd Capital LLC
Overall Score AnalysisAnalyzing Countries and their Factors for Freedom and Translating it into Growth… Overall Scores > 60
Estonia: Grew from 6,240 to 18,539 PPP Adj. PCGDP over the 15 year Period (2.97x 1995 PCGDP and 2.75x 1995 GDP)— Overall Freedom increased from 65.2 to 74.7 in 2010
Trade, Monetary Financial, Property and Freedom from Corruption improved significantly Business Freedom has declined in recent years GDP growth has been somewhat volatile but high on average and average growth has increased as Overall Freedom has increased
1999 was impacted by the Russian financial crisis of 1998 Estonia ranked 1st in the State of World Liberty Index Balanced budget, almost non-existent public debt, flat-rate income tax, free trade, competitive commercial banking and innovative
e-services are all hallmarks of Estonia’s market economy
Germany: Grew from 22,027 to 36,013 PPP Adj. PCGDP over the 15 year Period (1.63x 1995 PCGDP and 1.64x 1995 GDP)
— Overall Freedom increased from 69.8 to 71.1 in 2010 GDP growth has been poor throughout the entire period Growth did reach north of 3% for two consecutive years after Business Freedom moved up from 70 to 89.1
Fiscal Freedom has improved significantly while Government Spending has been improving from a low level
Hong Kong: Grew from 22,633 to 46,128 PPP Adj. PCGDP over the 15 year Period (2.03x 1995 PCGDP and 2.3x 1995 GDP)
— Overall Freedom increased from 88.6 to 89.7 in 2010 GDP growth has been volatile hitting -6.03% when Overall Freedom was its lowest in 1998 (Asian financial crisis, H5N1 and just
months after transfer of sovereignty from the United Kingdom to the PRC)
When Overall Freedom hit 90 in 2004 growth was at a high of 8.47% for the 15 year period but when it reached 90 again in 2009, growth was negative (during the financial crisis)

210210Proprietary & Confidential. © 2011, glendonTodd Capital LLC
Overall Score AnalysisAnalyzing Countries and their Factors for Freedom and Translating it into Growth… Overall Scores > 60
Ireland: Grew from18,600 to 39,492 PPP Adj. PCGDP over the 15 year Period (2.12x 1995 PCGDP and 2.64x 1995 GDP)— Overall Freedom increased from 68.5 to 81.3 in 2010
Trade, Fiscal, Investment, Financial Freedom and Freedom from Corruption all improved GDP growth has slowed since the late 1990s although throughout the period the largest changes have come only from Government
Spending and Fiscal Freedom
Most other Freedom scores were extremely high at the start of the period
Israel: Grew from 17,253 to 29,602 PPP Adj. PCGDP over the 15 year Period (1.72x 1995 PCGDP and 2.37x 1995 GDP)
— Overall Freedom increased from 61.5 to 67.7 in 2010 Growth has been volatile with highest growth rates occurring in 1995 and 2000 when Overall Freedom was at short term lows Investment and Business Freedom has declined over the period
Trade, Fiscal and Monetary Freedom have increased over the period
Jamaica: Grew from 6,620 to 8,743 PPP Adj. PCGDP over the 15 year Period (1.32x 1995 PCGDP and 1.46x 1995 GDP)
— Overall Freedom increased from 64.4 to 65.5 in 2010 GDP growth has been poor throughout the entire period All Freedom scores are relatively high and were stable
Largest decline was in Freedom from Corruption which is at a 15 year low in 2010
Japan: Grew from 22,897 to 34,330 PPP Adj. PCGDP over the 15 year Period (1.50x 1995 PCGDP and 1.53x 1995 GDP)
— Overall Freedom decreased from 75 to 72.9 in 2010 The years of negative growth do not correlate with any significant change in Overall Freedom or Freedom Factors Japan’s public debt as of 2011 is 208.2% of GDP
Jordan: Grew from 2,886 to 5,767 PPP Adj. PCGDP over the 15 year Period (2.00x 1995 PCGDP and 2.86x 1995 GDP)— Overall Freedom increased from 62.7 to 66.1 in 2010
Highest growth rates have occurred in the 2004-2008 period which was when Business Freedom and Trade Freedom were near highs.
Liberal economic policies are credited for an economic boom from 1999 and conservative bank policies are credited with helpin g
the country escape the worst of the global financial crisis of 2009
211211Proprietary & Confidential. © 2011, glendonTodd Capital LLC
Overall Score AnalysisAnalyzing Countries and their Factors for Freedom and Translating it into Growth… Overall Scores > 60
Oman: Grew from 14,011 to 25,459 PPP Adj. PCGDP over the 15 year Period (1.82x 1995 PCGDP and 2.59x 1995 GDP)— Overall Freedom decreased from 70.2 to 67.7 in 2010
Freedom had been increasing the year the country recorded 12.86% GDP growth (2008) Growth was negative in 1999 the year Business Freedom and Investment Freedom both dropped significantly The country is highly dependent on oil prices
Panama: Grew from 5,217 to 12,706 PPP Adj. PCGDP over the 15 year Period (2.44x 1995 PCGDP and 3.26x 1995 GDP)— Overall Freedom decreased from 71.6 to 64.8 in 2010
Business, Trade and Fiscal Freedom improved Trade Freedom seems relatively correlated to GDP growth, growth rates hit a high when Trade Freedom was at a high Freedom from Corruption has been declining over recent years to levels in the 30s and Property Freedom has declined
Portugal: Grew from13,988 to 18,341 PPP Adj. PCGDP over the 15 year Period (1.66x 1995 PCGDP and 1.77x 1995 GDP)— Overall Freedom increased from 62.4 to 64.4 in 2010
GDP growth was volatile and sub 1% for a number of years The worst stretch coincides with a drop in Freedom from Corruption and Government Spending scores but the best years were als o
the lowest years of the Freedom from Corruption score. All scores besides Government Spending were relatively high over the
entire period. Portugal, in 2011, stands at 108.5% public debt to GDP Corruption has been cited as an issue, yet the country scores well in Freedom from Corruption and in the Transparency
International Report

212212Proprietary & Confidential. © 2011, glendonTodd Capital LLC
Overall Score AnalysisAnalyzing Countries and their Factors for Freedom and Translating it into Growth… Overall Scores > 60
Singapore: Grew from 25,285 to 56,708 PPP Adj. PCGDP over the 15 year Period (2.24x 1995 PCGDP and 3.17x 1995 GDP)— Overall Freedom decreased from 86.3 to 86.1 in 2010 although it was above the 1995 level in every other year
Growth has been volatile but on average very high A global recession is blamed for the contraction in 2001, changes were then suggested to revitalize the economy
South Africa: Grew from 5,781 to 10,541 PPP Adj. PCGDP over the 15 year Period (1.82x 1995 PCGDP and 2.22x 1995 GDP)— Overall Freedom increased from 60.7 to 62.8 in 2010
The best growth years were around the time Overall Freedom was the highest
Trade Freedom has improved significantly
South Korea: Grew from 12,288 to 30,042 PPP Adj. PCGDP over the 15 year Period (2.44x 1995 PCGDP and 2.65x 1995 GDP)
— Overall Freedom decreased from 72 to 69.9 in 2010 Growth has been highest in the late 1990s although 1998 was a result of the Asian financial crisis The 1990s was also the period where overall Freedom was the highest, the peak of which was 1998 when growth was negative
Has been a liberal democracy since the 1980s The country is also characterized by low debt levels
Sweden: Grew from 20,597 to 38,171 PPP Adj. PCGDP over the 15 year Period (1.85x 1995 PCGDP and 1.97x 1995 GDP)— Overall Freedom increased from 61.4 to 72.4 in 2010
GDP growth has been relatively stable over the entire period
Fiscal Freedom is very low and Government Spending scores are very low There was a big dip in Trade Freedom in 2001 where growth retracted to 1.42% While they have an extremely low Government Spending score, public debt as a % of GDP is low

213213Proprietary & Confidential. © 2011, glendonTodd Capital LLC
Overall Score AnalysisAnalyzing Countries and their Factors for Freedom and Translating it into Growth… Overall Scores > 60
Taiwan: Grew from 15,075 to 35,595 PPP Adj. PCGDP over the 15 year Period (2.36x 1995 PCGDP and 2.56x 1995 GDP)— Overall Freedom decreased from 74.2 to 70.4 in 2010
Growth has been high and relatively steady baring the Asian Financial Crisis and the most recent Financial Crisis Trade Freedom has improved significantly
Thailand: Grew from 4,687 to 9,222 PPP Adj. PCGDP over the 15 year Period (1.97x 1995 PCGDP and 2.11x 1995 GDP)— Overall Freedom decreased from 71.3 to 64.1 in 2010
There has been some political instability in recent years, due to a depreciation of the currency in 1997 and 1998, that led t o the
Asian Financial Crisis, GDP contracted significantly Around the time Trade Freedom was peaking was when GDP growth was the highest Freedom from Corruption scores are low and the period of 2008-2010 was marred by political and civil unrest
United Kingdom: Grew from 19,704 to 35,344 PPP Adj. PCGDP over the 15 year Period (1.79x 1995 PCGDP and 1.92x 1995 GDP)— Overall Freedom decreased from 77.9 to 76.5 in 2010
Growth has been relatively steady over the entire period baring the recent Financial Crisis All Freedom scores are high besides Government Spending
United States: Grew from 27,827 to 46,900 PPP Adj. PCGDP over the 15 year Period (1.69x 1995 PCGDP and 1.96x 1995 GDP)— Overall Freedom increased from 76.7 to 78 in 2010
Freedom from Corruption scores have declined over the years while Business Freedom, Trade Freedom, Fiscal Freedom have
increased Overall Freedom was near its highest in 2008 and 2009 during the Financial Crisis where GDP growth was negative Public debt is estimated at 67.7% of GDP but it does not include intra-governmental debt
Uruguay: Grew from 7,015 to 14,049 PPP Adj. PCGDP over the 15 year Period (2.00x 1995 PCGDP and 2.10x 1995 GDP)— Overall Freedom increased from 62.5 to 69.8 in 2010
Uruguay has had a very volatile GDP growth rate Trade Freedom has been volatile but improved ,worst growth year (2002) coincides with lowest Trade Freedom score Best years have occurred recently with highest Trade Freedom scores