GDDC Strategic Plan / Retail Strategies Stakeholder 10-9-14
36
Retail Strategies | 500 West 7 th Street, Suite 1720 | Fort Worth, TX 76102 | (682)207-1100 | 205.303.3677 | www.retailstrategies.com Retail Market Research & Strategic Plan Overview
-
Upload
carolyn-grace -
Category
Economy & Finance
-
view
160 -
download
2
Transcript of GDDC Strategic Plan / Retail Strategies Stakeholder 10-9-14

Retail Strategies | 500 West 7th Street, Suite 1720 | Fort Worth, TX 76102 | (682)207-1100 | 205.303.3677 | www.retailstrategies.com
Retail Market Research & Strategic Plan Overview

firm background| Retail Strategies
• Retail Specialists, Inc. is a commercial real estate company with offices in
Birmingham, New Orleans and Fort Worth, focused on retail real estate including
tenant representation, retail project leasing, retail brokerage & development and
retail property management.
• Decision Data Resources specializes in providing research solutions through
web based data and GIS applications.
• Provide municipal clients with research and retail recruitment services leveraging a
national network of retail, restaurant, developer and investor relationships.

| Retail Strategies
our research
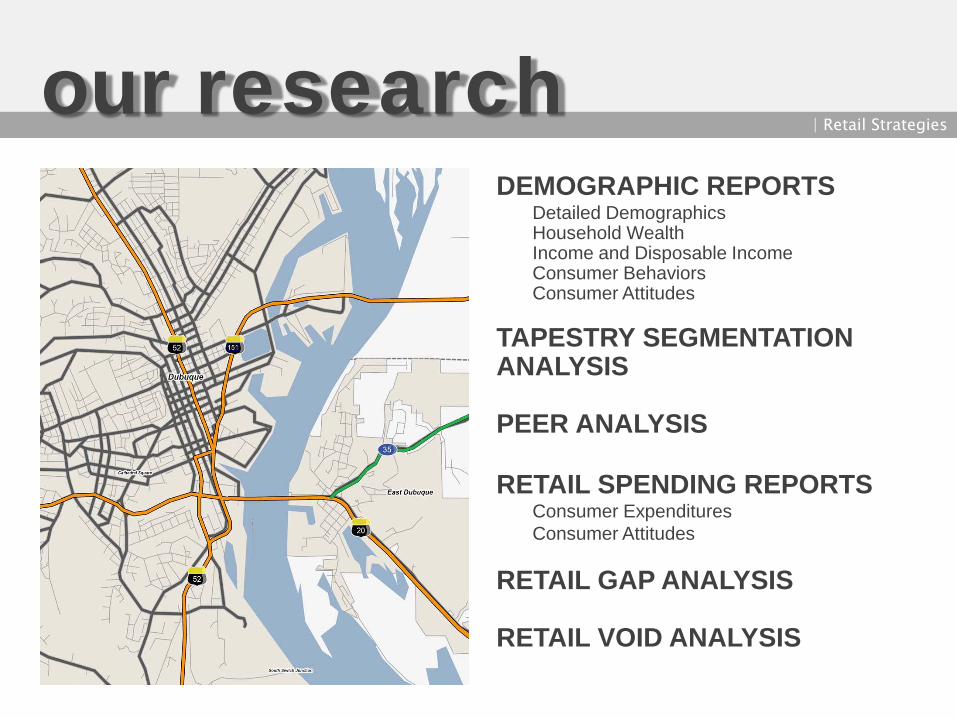
DEMOGRAPHIC REPORTSDetailed DemographicsHousehold WealthIncome and Disposable IncomeConsumer BehaviorsConsumer Attitudes
TAPESTRY SEGMENTATION ANALYSIS
PEER ANALYSIS
RETAIL SPENDING REPORTSConsumer ExpendituresConsumer Attitudes
RETAIL GAP ANALYSIS
RETAIL VOID ANALYSIS
our research| Retail Strategies

data resources| Retail Strategies
• Census Data from 1980-2010 (Census years)• Demographic Analysis:
– AGS for current and five year projections– ESRI for current and five year projections– PopStats for current and five year projections– Claritas for current and five year projections
• Segmentation Analysis:– Tapestry (ESRI)– Prizm (Claritas)– Mosaic (Experian)
• MRI Consumer Behavior & Attitudinal Data• Bureau of Economic Analysis, Census of Retail /Consumer Spending• EMSI for Employment, Occupation and Wage Information• Crime Stats (FBI)• Regus for Aerials by City, Trade Area, Development, Redevelopment Zones
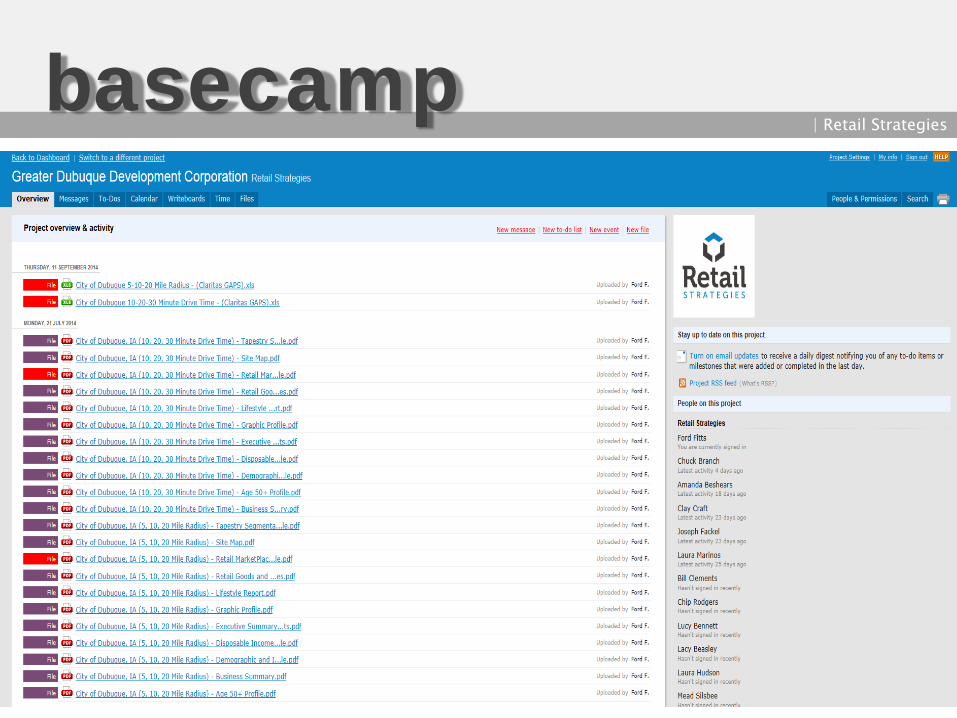
basecamp| Retail Strategies
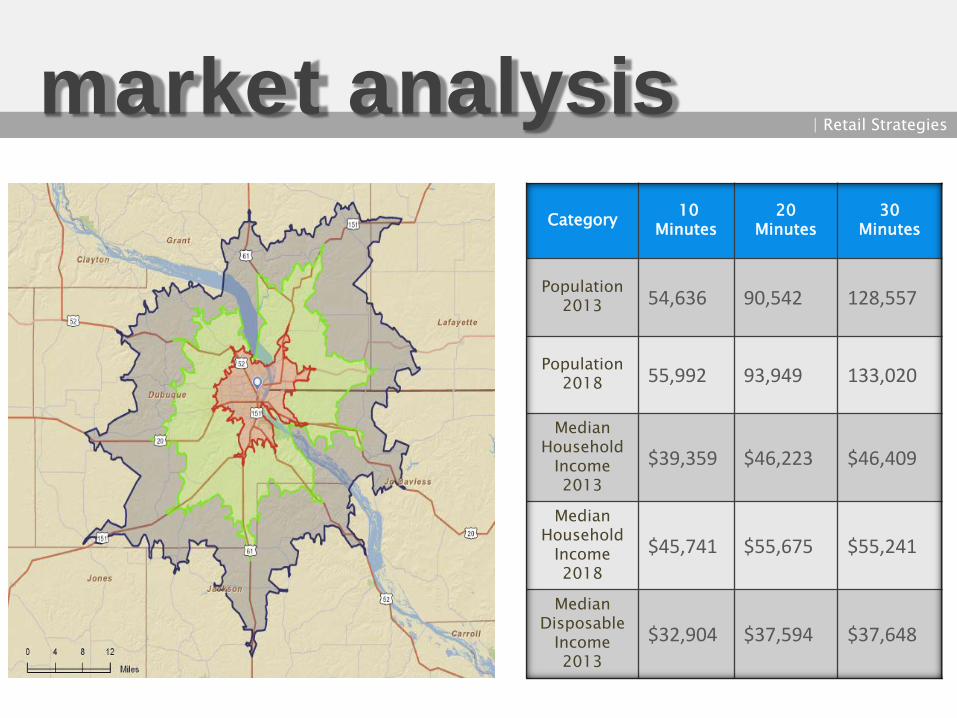
market analysis | Retail Strategies
Category 10 Minutes
20 Minutes
30Minutes
Population2013 54,636 90,542 128,557
Population2018 55,992 93,949 133,020
MedianHousehold
Income 2013
$39,359 $46,223 $46,409
MedianHousehold
Income 2018
$45,741 $55,675 $55,241
MedianDisposable
Income 2013
$32,904 $37,594 $37,648

market analysis | Retail Strategies
Category 3 Mile Radius
5 Mile Radius
10 Mile Radius
Population2013 66,845 87,879 130,263
Population2018 71,078 91,288 134,659
MedianHousehold
Income 2013
$42,737 $45,916 $46,955
MedianHousehold
Income 2018
$51,609 $55,508 $55,711
MedianDisposable
Income 2013
$35,653 $37,429 $37,933

| Retail Strategies
demographic & psychographic highlights

| Retail Strategies tapestry segmentation
Segmentation systems operate on the theory that people with similar tastes,lifestyles, and behaviors seek others with the same tastes—“like seeks like.”These behaviors can be measured, predicted, and targeted. Esri’s TapestrySegmentation system combines the “who” of lifestyle demography with the“where” of local neighborhood geography to create a model of variouslifestyle classifications or segments of actual neighborhoods withaddresses—distinct behavioral market segments.
Segmentation 101
Tapestry Segmentation represents the fourth generation of market segmentation systems that beganmore than 30 years ago. The 65-segment Tapestry Segmentation system classifies US neighborhoodsbased on their socioeconomic and demographic compositions. The power of Tapestry Segmentationallows you to profile consumers and constituents.
What is Tapestry Segmentation?
All companies, agencies, and organizations need to understand consumers/constituents in order tosupply them with the right products and services and to reach them via their preferred media. Theseapplications require a robust segmentation system that can accurately profile these diverse markets. Theversatility and predictive power of Tapestry Segmentation allow users to integrate their own data ornational consumer surveys into Tapestry Segmentation to identify their best market segments andreach them through the most effective channels.
Who Should Use Tapestry Segmentation?
www.esri.com/library/brochures/pdfs/tapestry-segmentation.pdf

| Retail Strategies demographic highlights
Although these neighborhoods are found in rural areas across theUnited States, nearly half are in the Midwest, with concentrations inPennsylvania, Ohio, Indiana, and Michigan. The other half are in theSouth and Northeast. Eighty-four percent of the residents own theirhomes. Most of the housing is single family; 12 percent are mobile homes. Twenty-two percent of the homes were built before 1940.
These residents work in professional and managerial positions and unskilledlabor jobs. Higher than average proportions work in skilled labor occupations.Approximately 20 percent of the workers are employed in the manufacturingsector. The median household income of $48,409, slightly lower than the USfigure. At higher than national rates, residents supplement their wages withincome from interest, dividends, rental properties, self-employment businesses,retirement plans, and Social Security benefits. Forty-one percent of the residentsaged 25 years and older have attended college; 15 percent have earned abachelor’s or graduate degree.
Salt of the Earth residents are settled, traditional, and hardworking.Independent and self-reliant, they tackle small home improvement andremodeling projects. They spend money and time on their flower andvegetable gardens and own the necessary tools to handle these choressuccessfully. Twenty-eight percent of the households own three or more vehicles including a truck; many own a motorcycle. One of TapestrySegmentation’s top segments for owning or leasing multiple vehicles, theseresidents prefer domestic vehicles and do their own maintenance. Most ofthem carry insurance policies to protect themselves and their families. They invest in annuities, certificates of deposit, and US savings bonds. Many familiesown two or more pets, either dogs or cats.
They eat out at family restaurants such as Bob Evans Farms or Cracker Barrel. Satisfying their sweet tooth, theyoften bake goodies at home. They go fishing, hunting,target shooting, and boating and work out on indoorexercise equipment such as stationary bikes andtreadmills. They read fishing and hunting magazines. They listen to country music radio and follow NASCAR racing.Many households own a satellite dish so they can watch CMT and the Speed Channel. Favorite TV programs includeauto racing, horse racing, truck and tractor pulls/ mudracing, and weekly sitcoms.
Salt of the Earth 16.6%30 Minute Dominant Tapestry Segmentation

| Retail Strategies demographic highlightsMidlife Junction 10%
30 Minute Dominant Tapestry Segmentation
Most are still working; although at 61 percent, the labor forceparticipation rate is slightly below average. A third of thehouseholds receive Social Security. The median household incomeis $42,694. Educational attainment levels are comparable to the USlevels.
Although scattered in suburbs across the country, these neighborhoods are found more frequently in the South and Midwest.Sixty-two percent of residents own their homes, close to the USrate. Nearly two-thirds of the housing is single family; the remainder are primarily apartments in multiunit buildings.
Midlife Junction residents live quiet, settled lives as they move fromchild-rearing into retirement. To finance their retirement, they owncertificates of deposit, savings bonds, and IRAs. They’re carefulspenders, always looking for bargains, and not swayed by fads.
On weekends, they eat fast food or go to family restaurants suchas Friendly’s or Perkins. They drive standard- sized domestic carsand shop by mail or phone from the L.L. Bean and JCPenneycatalogs. They communicate with friends and family by e-mail. Theygo fishing, take walks, work crossword puzzles, play board games,do woodwork- ing, and read science fiction or romance novels.They watch TV network shows and news programs.

| Retail Strategies demographic highlights
Green Acres 9%30 Minute Dominant Tapestry Segmentation
Educated and hard-working, more than one-fourth of Green Acresresidents hold a bachelor’s or graduate degree; more than halfhave attended college. Occupation distributions are similar tothose of the United States. Seventeen percent of the householdsearn income from self-employment ventures. The median household income is $60,461.
Although Green Acres neighborhoods are located throughout thecountry, they are found primarily in the Midwest and South, withthe highest concentrations in Michigan, Ohio, and Pennsylvania. A“little bit country,” these residents live in pastoral settings ofdeveloping suburban. Home ownership is at 86 percent. Typical of rural residents, Green Acres households own multiple vehicles; 78percent own two or more vehicles.
Country living describes the lifestyle of Green Acres residents. Pet dogs or cats are considered part of the family. These do-it-yourselfers maintain andremodel their homes; projects include roofing and installing carpet orinsulation. They own all the necessary power tools, including routers, welders,sanders, and various saws, to finish their projects. Residents also have theright tools to maintain their lawns, flower gardens, and vegetable gardens.They own riding lawn mowers, garden tillers, tractors, and even separate homefreezers for the harvest. Continuing the do-it-yourself mode, it is notsurprising that Green Acres is the top market for owning a sewing machine. Afavorite pastime is using their ice cream maker to produce homemade icecream. They prefer motorcycles and full-size trucks.
For exercise, Green Acres residents ride their mountain bikesand go fishing, canoeing, and kayaking. They also ridehorseback and go power boating, bird watching, targetshooting, hunting, motorcycling, and bowling. They listen toauto racing and country music on the radio and readfishing and hunting magazines. Many own satellite dishes sothey can watch news programs, the Speed Channel, andauto racing on TV. A favorite channel is Country MusicTelevision.

| Retail Strategies
peer&gap analysis

peer analysis| Retail Strategies
The Peer Analysis focuses on identifying cities across the United States that are similar to the City of Dubuque from an economic and demographic perspective.
City State Population (2010)
Population (2014)
Population (2019)
Households (2014)
Average Household
Income (2014)
Total Retail Expenditures
(2014)
Council Bluffs IA 62,270 62,606 63,900 25,446 $55,851 $509,048,502
Great Falls MT 59,105 60,556 63,105 26,057 $54,467 $513,828,666
Dubuque IA 59,032 60,489 63,859 25,222 $60,980 $535,308,701
Kingsport TN 55,933 56,672 57,995 25,024 $57,348 $509,813,201
Pocatello ID 54,913 55,859 57,216 21,485 $56,375 $431,111,994
Manhattan KS 53,144 55,759 59,617 22,165 $56,502 $444,811,653
Battle Creek MI 52,447 52,995 53,511 21,597 $54,895 $424,692,263

gap analysis| Retail Strategies
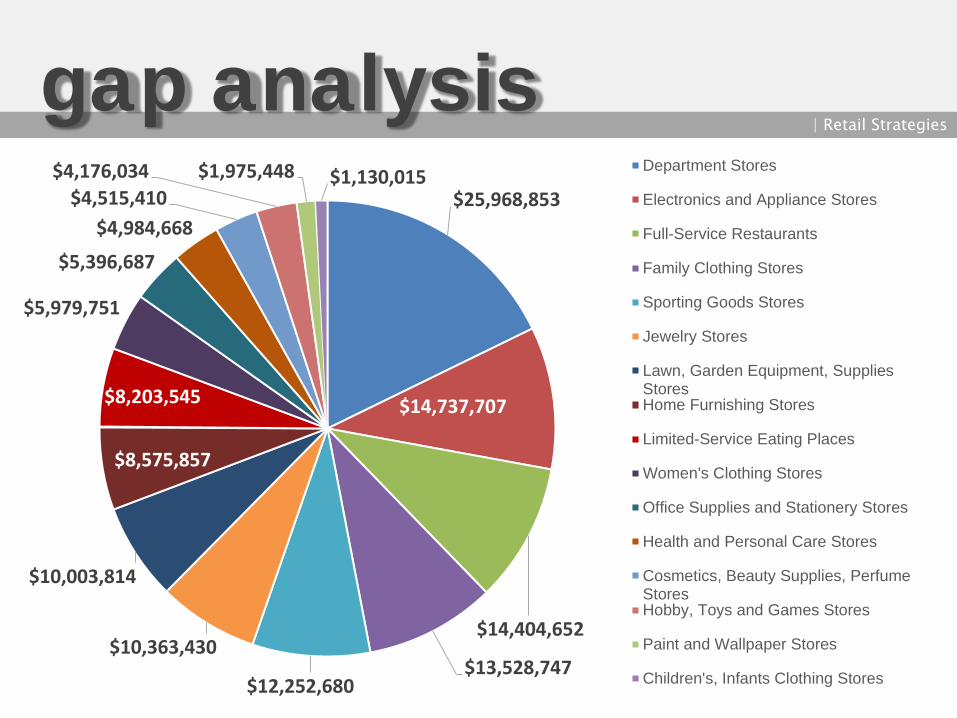
The Gap Analysis is a summary of the primary spending Gaps segmented by retail category. It measures actual consumer expenditures within the City’s trade area and compares it to the potential retail revenue generated by retailers in the same area. The difference between the two numbers reflects leakages, or the degree to which consumers travel outside the community for certain retail goods and services. The Gap analysis is a useful tool to gauge retail supply and demand within the community.
The summary includes the Number of Retailers Targeted in Plan. These figures represent the number of retailers potentially required to fill the particular Gap in each category.
Category Gap # of Retailers
PotentialSquare Feet
Department Stores $25,968,853 2 70,000
Electronics and Appliance Stores $14,737,707 2 30,000
Full-Service Restaurants $14,404,652 4 20,000
Family Clothing Stores $13,528,747 3 15,000
Sporting Goods Stores $12,252,680 2 25,000
Jewelry Stores $10,363,430 2 8,000
Lawn, Garden Equipment, Supplies Stores $10,003,814 1 20,000
Home Furnishing Stores $8,575,857 2 20,000

gap analysis| Retail Strategies
The Gap Analysis is a summary of the primary spending Gaps segmented by retail category. It measures actual consumer expenditures within the City’s trade area and compares it to the potential retail revenue generated by retailers in the same area. The difference between the two numbers reflects leakages, or the degree to which consumers travel outside the community for certain retail goods and services. The Gap analysis is a useful tool to gauge retail supply and demand within the community.
The summary includes the Number of Retailers Targeted in Plan. These figures represent the number of retailers potentially required to fill the particular Gap in each category.
Category Gap# of
Retailers
PotentialSquare
Feet
Limited-Service Eating Places $8,203,545 4 9,000
Women's Clothing Stores $5,979,751 2 10,000
Office Supplies and Stationery Stores $5,396,687 1 15,000
Health and Personal Care Stores $4,984,668 1 10,000
Cosmetics, Beauty Supplies, Perfume Stores $4,515,410 2 15,000
Hobby, Toys and Games Stores $4,176,034 1 20,000
Paint and Wallpaper Stores $1,975,448 1 4,000
Children's, Infants Clothing Stores $1,130,015 1 4,000
TOTAL $146,197,298 31 295,000
gap analysis| Retail Strategies
$25,968,853
$14,737,707
$14,404,652
$13,528,747$12,252,680
$10,363,430
$10,003,814
$8,575,857
$8,203,545
$5,979,751
$5,396,687
$4,984,668$4,515,410
$4,176,034 $1,975,448 $1,130,015 Department Stores
Electronics and Appliance Stores
Full-Service Restaurants
Family Clothing Stores
Sporting Goods Stores
Jewelry Stores
Lawn, Garden Equipment, SuppliesStoresHome Furnishing Stores
Limited-Service Eating Places
Women's Clothing Stores
Office Supplies and Stationery Stores
Health and Personal Care Stores
Cosmetics, Beauty Supplies, PerfumeStoresHobby, Toys and Games Stores
Paint and Wallpaper Stores
Children's, Infants Clothing Stores

| Retail Strategies site selection process

site selection process| Retail Strategies

current retail overview| Retail Strategies

available properties| Retail Strategies
available properties| Retail Strategies

Big Box Recruitment and Development
Entertainment/ Restaurant Recruitment and Development
Long Term Redevelopment Zone
available properties| Retail Strategies

| Retail Strategies retail prospects

retail prospects | Retail Strategies
Department StoresGAP: $ 25,968,853
Von MaurDilard’s
Marshall’sBurlington Coat Factory
Electronics & Appliances
GAP: $ 14,737,707HH Gregg
Sears Home and Garden
Full Service RestaurantsGAP: $ 14,404,652
Bonefish GrillCarrabas
Chili’sRed Lobster
Family Clothing GAP: $ 13,528,747
GymboreeGordmans

retail prospects | Retail Strategies
Sporting Goods GAP: $12,252,680
Academy Sports Field and Stream Gander Mountain
Dunham’s
Jewelry GAP: $ 10,363,430
Jared Jewelers
Lawn, Garden Equipment & Supplies
GAP: $ 10,003,814Sears Hometown and Outlet
Home FurnishingsGAP: $ 8,575,857
Ashley Furniture Bassett Furniture
Rooms to Go Mattress Firm
retail prospects | Retail Strategies
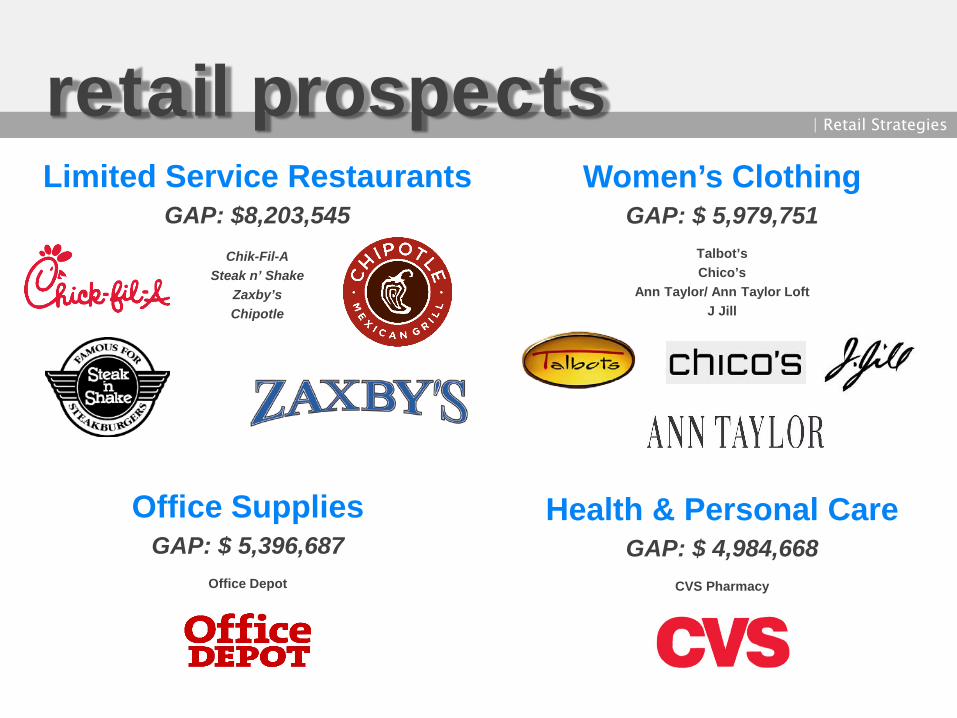
Limited Service Restaurants GAP: $8,203,545
Chik-Fil-A Steak n’ Shake
Zaxby’sChipotle
Women’s Clothing GAP: $ 5,979,751
Talbot’s Chico’s
Ann Taylor/ Ann Taylor LoftJ Jill
Office Supplies GAP: $ 5,396,687
Office Depot
Health & Personal Care GAP: $ 4,984,668
CVS Pharmacy

retail prospects | Retail Strategies
Hobby, Toys & GamesGAP: $ 4,176,034
Hancock Fabrics Hobby Town USA Learning Express

recruitment objectives| Retail Strategies
• Leverage Retail Strategies’ national network of retail, restaurant, developer and investorrelationships on behalf of Dubuque
• Focus on marketing the three primary retail redevelopment, new development and infill/redevelopment opportunities
• Communicate with local real estate professionals and support their efforts where needed
• Initiate and continue aggressive outreach/marketing campaign to targeted retailers andrestaurant prospects through direct contact, tenant representatives, preferred developerrelationships as well as industry conferences/trade shows (ICSC)
• Overcome objections about proximity to larger markets, specifically Davenport, CedarRapids and Madison.
• Connect landowners with out of market developers as appropriate
• Connect leasing/brokerage professionals with potential tenants based on location andreal estate requirements
• Focus on reviving any stalled projects
• Present opportunities to retailers during Portfolio Reviews – already taking place

focus properties| Retail Strategies
• Address and Property Description • Coordinates• Listing Agent if applicable• Contact Info for Agent or Owner• Website address for Agent or Owner• Link to Property Information on Agent or
Owner’s Website• Google Earth Link to aerial and ground photo• Total Size of Center if existing• Available Space in Center• Parcel Size if vacant land• Existing Tenants if existing shopping center• Traffic Count at property• Summary of Recruitment opportunities specific
to property• Specific Prospects for property• Overall strategy for property• General comments
information collected on BOG tour ….

focus properties| Retail Strategies
# On Aerial Name Address1 Carpet Shak Site 400 Harrison St2 Vacant Site -North of Dollar Tree 100 S Locust3 Plaza 20 Shopping Center 2562 Dodge Street4 Motel 2670 Dodge St5 In Plaza 3430 Dodge Street6 Unanchored Strip 3220 Dodge Street7 Unanchored Strip by Target 3401 Dodge Street8 Shopco 255 JFK Road9 Kennedy Mall 801 Wacker Drive10 Walmart Shopping Center 4482 Dodge St11 Unanchored Strip 2055 Holiday Drive12 Westfield Sqaure 4855 Asbury Rd13 Shop Space attached to Buffalo Wild Wings 2805 NW Arterial14 Tri State Independent Blind Society 3333 Asbury Road15 Fareway Grocery Center (with Dollar Tree) 2050 JFK Rd16 Vacant Site for lease 1895 Kennedy Circle17 Unanchored Strip- well located 3301 Pennsylvania Ave18 Oreilly, Sherwin Williams Center 1690 JFK Rd

# On Aerial Name Address19 Dubuque Auto Outlet Center 3412 Pennsylvania Avenue20 Little Caesars & Big Apple Bagels Center 1675 JFK Rd21 Rent A Center Center 1650 JFK Rd22 Vacant Restaurant 1350 JFK Rd23 Petsmart 1300 John F Kennedy Rd24 JFK Plaza 170 JFK Rd25 Vacant land 75 John F. Kennedy Rd26 Port of Dubuque - 16.26 AC E. 5th Street 27 Lower Bee Branch - 4.76 AC 16th Street28 City Parking Lot 599 Main St29 Schmitt Island 1855 Greyhound Park Rd30 Dubuque Technology Park - 13.97 AC US Highway 15131 Riverview Plaza 16th Street - Riverview Plaza32 Asbury Plaza Outparcels 2545 NW Arterial33 Northwest Arterial & Plaza Dr. - 14 AC 2625 NW Arterial - 14 AC34 JFK Rd. & Northwest Arterial - 7.73 AC 3199 John F Kennedy Rd35 Kennedy Mall Outparcels 555 John F Kennedy Rd
focus properties| Retail Strategies

| Retail Strategies marketing guide

marketing guide| Retail Strategies

going forward| Retail Strategies
• Provide access to BaseCamp• Provide On Demand Research when needed• Provide immediate support where needed (through research/networking)• Research new and emerging concepts appropriate for Dubuque• Prepare for ICSC Dallas November 12-14• Update research in 2015 and 2016• Refine strategy on an annual basis and tweak tactics as needed• Represent Dubuque at retail industry conferences and trade shows• Communicate with stakeholders regarding progress

Questions?
Retail Strategies | 500 W. 7th Street, Suite 1720 | Fort Worth, TX 76102 | (682)207-1100| 205.303.3677 | www.retailstrategies.com