facility.waseley.networcs.net GCS… · Web viewA flood alleviation scheme, which protects over...
28
Case Study Revision Helper Revision for Paper 1: Living with the Physical Environment Paper 1: Section A: Page The Challenge of Natural Hazards HIC Earthquake – L’Aquila, Italy (2009). LIC Earthquake – Gorkha, Nepal (2015). 4 5 Weather Hazards Typhoon Haiyan, November 2013 Flooding – Somerset Levels Flood 2014 7 9 Climate Change Mitigation International Agreements – 2015 Paris Climate Change Conference and Agreement . Adaptation Changes to agriculture – Drought resistant crops in the Gambia Managing Water Supplies – artificial glaciers (Bolivia / India – Himalayas ) Raised Islands – Maldives 11 Paper 1: Section B: Living World Epping Forest, Essex, UK – Deciduous Woodland Ecosystem Introduction of species: Yellowstone National Park, USA (Wolves) Tropical Rainforests – Borneo (Malaysia) Deserts – Western Desert (USA) Desertification – Sahel, Africa The Great Green Wall / Bunds 11 12 12-13 14 14 Paper 1: Section C: 1 Physic al Paper
Transcript of facility.waseley.networcs.net GCS… · Web viewA flood alleviation scheme, which protects over...

Case Study Revision Helper
Revision for Paper 1: Living with the Physical Environment
Paper 1: Section A: Page
The Challenge of Natural Hazards
HIC Earthquake – L’Aquila, Italy (2009).
LIC Earthquake – Gorkha, Nepal (2015).
4
5
Weather Hazards Typhoon Haiyan, November 2013
Flooding – Somerset Levels Flood 2014
7
9Climate Change Mitigation
International Agreements – 2015 Paris Climate Change Conference and Agreement.
AdaptationChanges to agriculture – Drought resistant crops in the Gambia
Managing Water Supplies – artificial glaciers (Bolivia / India – Himalayas)
Raised Islands – Maldives
11
Paper 1: Section B:
Living World Epping Forest, Essex, UK – Deciduous Woodland Ecosystem
Introduction of species: Yellowstone National Park, USA (Wolves)
Tropical Rainforests – Borneo (Malaysia)
Deserts – Western Desert (USA)
Desertification – Sahel, AfricaThe Great Green Wall / Bunds
11
12
12-13
14
14
Paper 1: Section C:
Coasts Dorset Coast Landforms
Coastal Realignment – Managed Retreat: Medmerry, West Sussex
16
17
Rivers River Severn Landforms
River Flood Relief (alleviation) scheme - Frankwell Flood Defence Scheme, Shrewsbury (2002). Demountable barriers.
18
21
1
Physical Paper 1Geograp
Natural Hazards
Types of natural hazard.
Natural Hazard: Natural Hazards pose a potential risk of damage and loss of life.Tectonic Hazards Involve movement of tectonic plates in the Earth’s crust e.g. earthquake and
tsunamis.Atmospheric Hazards HurricanesGeomorphological Hazards Occur on the earth’s surface e.g. floodingBiological Hazards Involve living organisms e.g. forest fires.
Human factors that are making the incidence (frequency) of natural hazards increase?Global warming Deforestation Urbanisation
Factors affecting hazard risk.
Depth of focus Population density Building density Distance from epicentre
Level of wealth
Medical facilities Transport infrastructure
Time of day and week
Construction standards
Warning Systems
Training Type of event Emergency services Corruption Preparation
Tectonic Hazards
Plates Tectonic Theory
In 1912, a German scientist called Alfred Wegener proposed that South America and Africa were once joined together and had subsequently moved apart.
He believed that all the continents were once joined together as one big supercontinent (one big land mass) called Pangaea and this was intact until about 200 million years ago.
Plate tectonics Continental DriftThe Earth's surface is made up of a number of large plates (like pieces of a jigsaw puzzle) that are in constant, slow motion.
The ocean floors are continually moving, spreading from the centre and sinking at the edges.At the edges of these plates (plate boundaries) earthquakes and volcanoes occur.Convection currents in the mantle move the plates. The source of heat driving the convection currents is radioactive decay which is happening deep in the Earth.
Evidence for continental driftEvidence that continents that now have oceans between them were once very close or joined together comes from:Study of fossilsPattern of rocksShapes of continentsClimate
Tectonic plates:
Continental crust Oceanic CrustOlderLess denseCannot sinkCannot be renewed and destroyed
NewerDenserCan SinkCan be renewed and destroyed.
2
Hazards
Convection currents The circular movement of magma within the earths mantleRidge Push When gravity causes the ridge to push on the lithosphere and move tectonic plates.Slab Pull When the weight of a dense tectonic plate is subducted into the mantle.Ocean Trenches A deep area of the ocean found in the subduction zone of a destructive plate
margin where the oceanic plate is forced beneath the continental plate.Ocean Ridge An underwater mountain range caused by two tectonic plates moving away from
each other at a constructive margin.Pacific Ring of Fire The circle of volcanoes and earthquakes created where the edge of the pacific plate
meets continental plates and creates destructive plate margins.Rift Valley On land constructive plate margins form a steep sided valley.Shield Volcano A wide, low volcano that erupts basic runny lava. Occurs on constructive plate
margins.Composite volcano A steep sided, dome shaped volcano that erupts a variety of materials such as sticky
acidic lava and ash. Occurs at a destructive plate margin.
Plate margin: Where two plates meet (YOU MUST BE ABLE TO EXPLAIN THESE PLATES AND ASSOCIATED LANDFORMS & HAZARDS – with diagrams)Destructive Oceanic and continental plates collide.Constructive Plates more away from one anotherConservative Plates move alongside one another
3
Destructive ConservativeConstructive
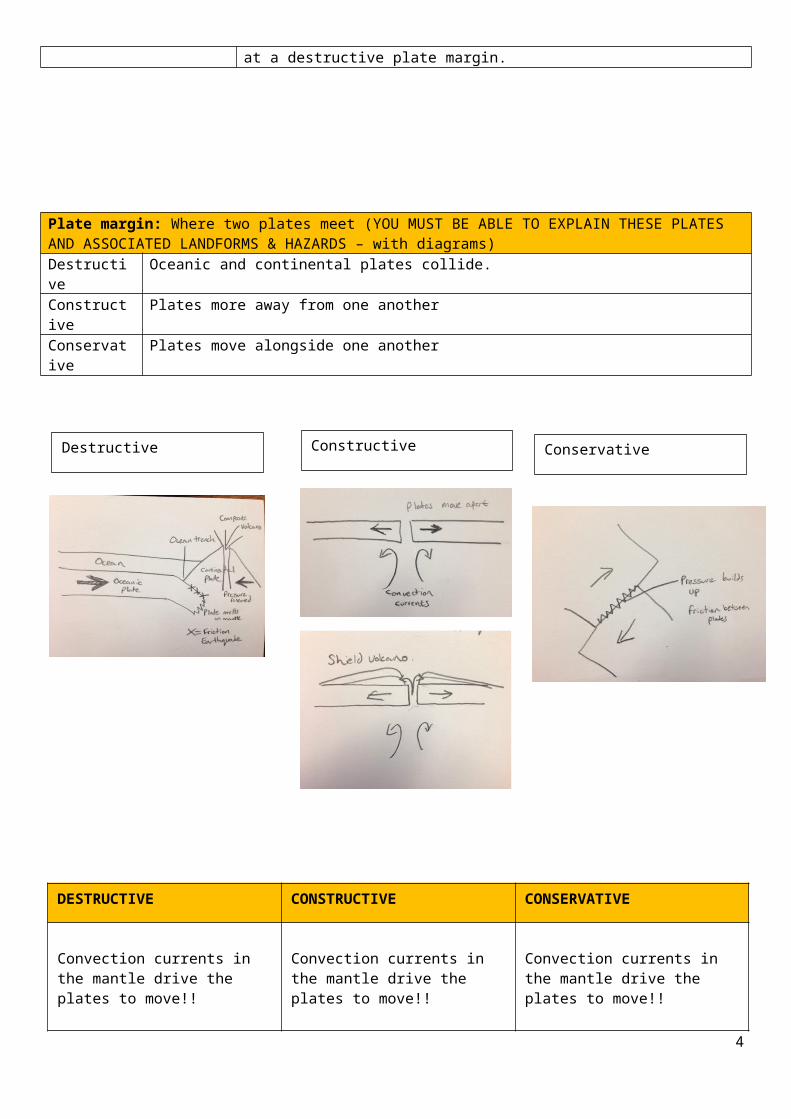
DESTRUCTIVE CONSTRUCTIVE CONSERVATIVE
Convection currents in the mantle drive the plates to move!!Oceanic plate moves towards continental plateOceanic plate subducts beneath the continental plate (as it is denser and more flexible). An ocean trench is formed.Friction builds up between the two plates and causes earthquakes.The oceanic plate melts in the mantle and pressure increases. This is released as a volcanic eruption (composite volcano)
Convection currents in the mantle drive the plates to move!!Two oceanic plates separateThe two plates separate leaving a gap between them.Magma rises from the mantle and makes its way between the plates.This comes out as lava as is runny so forms a wide volcanic cone (shield volcano)
Convection currents in the mantle drive the plates to move!!Two plates move besides each other (opposite direction or one faster than the other.Pressure builds up between the two plates as they attempt to move.Eventually the plates jolt forwards as they move and the friction between the plates is released as a strong seismic wave (earthquake).
Use named examples to show how the effects and responses to a tectonic hazard vary between two areas of contrasting levels of wealth.
HIC Earthquake – L’Aquila, Italy (2009). 6.3 Richter Scale
Primary Effects Secondary Effects
308 people killed1500 injured67,500 homelessMany buildings of cultural value collapsedSan Salvatore Hospital severely damaged (patients evacuated).US$11,434 million damage
Aftershocks triggered landslides which damaged transportLandslide burst a mains water supplyThe numbers of students at L’Aquila University decreasedHouse prices and rents increased.
Immediate Responses Long-term ResponsesHotels provided shelter for 10,000 people40,000 tents given outSome train carriages used as sheltersWithin 1 hour the Italian Red Cross searched for survivorsDog units, 36 ambulances, temporary hospitals and hot water supplies set up/Mortgages and bills such as Sky TV were suspended.
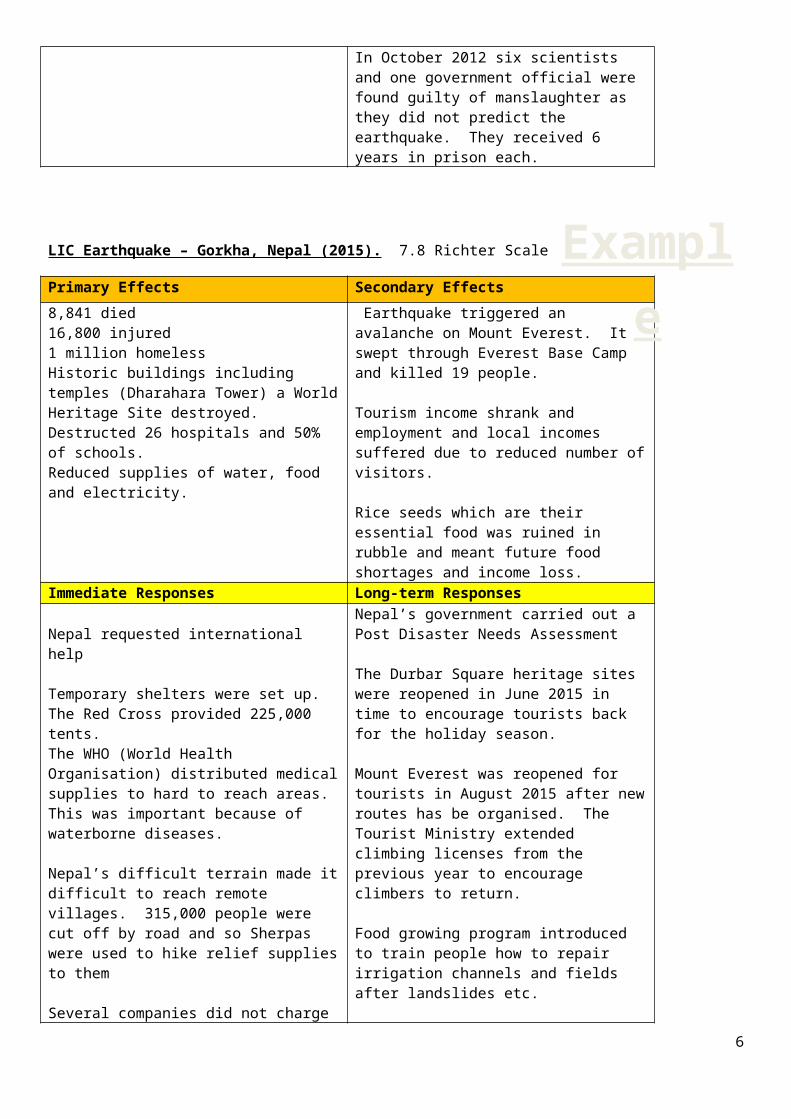
There was a torch lit procession to mark the anniversary of the earthquake.Residents did not pay taxes in 2010Students were given free transport and equipment and didn’t pat university fees for three years.Homes took several years to rebuildHistoric buildings may take 15 years to rebuild.In October 2012 six scientists and one government official were found guilty of manslaughter as they did not predict the earthquake. They received 6 years in prison each.
LIC Earthquake – Gorkha, Nepal (2015). 7.8 Richter Scale
4
Example
Example

Primary Effects Secondary Effects
8,841 died16,800 injured1 million homelessHistoric buildings including temples (Dharahara Tower) a World Heritage Site destroyed.Destructed 26 hospitals and 50% of schools.Reduced supplies of water, food and electricity.
Earthquake triggered an avalanche on Mount Everest. It swept through Everest Base Camp and killed 19 people.
Tourism income shrank and employment and local incomes suffered due to reduced number of visitors.
Rice seeds which are their essential food was ruined in rubble and meant future food shortages and income loss.
Immediate Responses Long-term Responses
Nepal requested international help
Temporary shelters were set up. The Red Cross provided 225,000 tents.The WHO (World Health Organisation) distributed medical supplies to hard to reach areas. This was important because of waterborne diseases.
Nepal’s difficult terrain made it difficult to reach remote villages. 315,000 people were cut off by road and so Sherpas were used to hike relief supplies to them
Several companies did not charge for calls etc.
Nepal’s government carried out a Post Disaster Needs Assessment
The Durbar Square heritage sites were reopened in June 2015 in time to encourage tourists back for the holiday season.
Mount Everest was reopened for tourists in August 2015 after new routes has be organised. The Tourist Ministry extended climbing licenses from the previous year to encourage climbers to return.
Food growing program introduced to train people how to repair irrigation channels and fields after landslides etc.
Why do effects and responses differ? Level of development?
Depth of focus Population density Building density Distance from epicentre
Medical facilities Transport infrastructure Time of day and week Construction standards
Training Type of event Emergency services Corruption
Reasons why people continue to live in areas at risk from a tectonic hazard.
Geothermal Energy Farming Mining TourismIn Iceland energy stations provide geothermal power, electricity and hot water for the capital Reykjavik. It produces 30% of Iceland’s total electricity.
Volcanic soils are found on less than one per cent of the Earth’s surface, but support 10 per cent of the worlds population
In East Java, Indonesia mining of valuable minerals creates jobs and income for locals.
More than 100 million people visit volcanic sites every year.
VOLCANOES: How monitoring, prediction, protection and planning can reduce the risks from a tectonic hazard.
5
Monitoring Protection Planning
Satellites (GPS)SeismometersThermal heat sensorsGas sensorsTemperature of water in streams
Evacuation procedures
Lahar – mudflows – people must move out of valleys.
Hazard mapping of danger zones
Evacuation plans.Prepare emergency shelter, food and water.Practice advice of what to do prior to the volcano.Residents taught how to seek shelter to avoid dangers of falling ash and rock.
EARTHQUAKES: How monitoring, prediction, protection and planning can reduce the risks from a tectonic hazard.
Monitoring Planning Protection
SeismologistsSeismometersPrevious earthquakes mapped and recorded.GPS (Global Positioning Systems)Animals are believed to act strange prior to earthquakes.
Planning prior to event makes people act quickly and calmly and so there are fewer injuries.
Furniture and objects fastened downLearn how to turn gas/water offPrepare emergency supplies (bottled water, batteries, tinned food).Practise fire drills – some countries do this on anniversaries of previous large earthquakes (Japan – 1st September).Checklists to help plan and education.
Example: TransAmerican Pyramid
Building’s made from flexible materials with shock absorbers, deep foundations and strong triangular structures.
Shutters on windows
No loose materials on exterior
Fire resistant walls
Pendulum to counterbalance movement
Flexible pipes for gas and water etc
Weather Hazards
General atmospheric circulation model: pressure belts and surface winds.
ITCZ Inter Topical Convergence Zone – Along the equator where the low pressure causes the air to rise.
Hadley Cell The cell of circulating air from the ITCZ outwardsCoriolis Effect The deflection, or bending, of the wind due to the rotational spin of the earth.Jet Stream A fast flowing (200km/hr) current of air that circles the planet at a height of
10km.
Low Pressure High PressureWarmer air rises, cools and condenses. Clouds form and create rainfall.
Colder air sinks, warms up and holds more moisture so less condensation and clouds so less precipitation (deserts – along tropics)
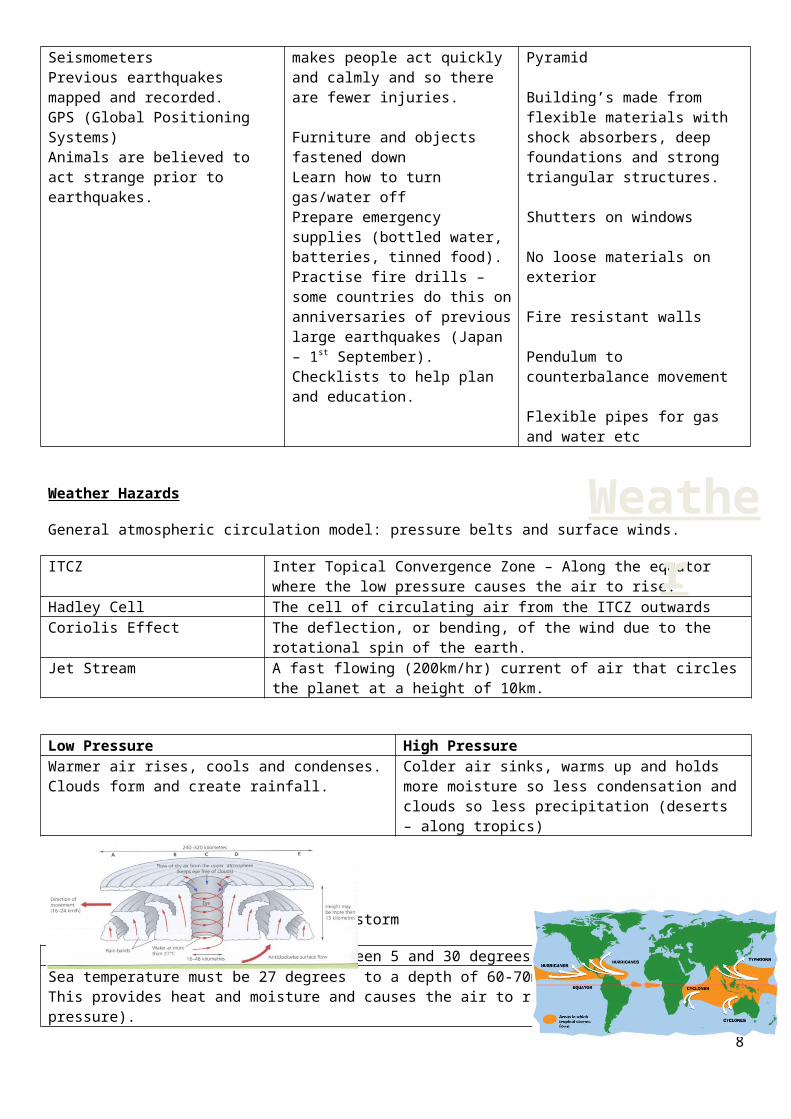
Causes and conditions for tropical storm
6
Weather

Found in areas of low latitude between 5 and 30 degrees north and south.Sea temperature must be 27 degrees to a depth of 60-70mThis provides heat and moisture and causes the air to rise rapidly (low pressure).Air rises and water condenses into cumulonimbus cloudsWind increases and heavy rainfall falls.Latent heat is then released which powers the storm.The eye of the storm is relatively calm, with clearer sky and it can get warmer.Wind and heavy rainfall increase again and the temperature drops (air pressure begins to rise)** Tropical storms DO NOT form along the equator because the Coriolis effect is not strong enough to cause the storm to spin.
Typhoon Haiyan, November 2013 (Category 5 Typhoon struck the Philippines).
Primary Effects Secondary Effects
314 km/hr winds battered homes
6190 people died14.1 million people affectedUS$12 billion dollars damage1 million farmers affected1.1 million homes damaged (half destroyed)4.1 million homeless
Oil barge ran aground causing 800,000 litre oil leak.Most oil washed ashore and contaminated 10 hectares of precious mangroves.Fishing at Estancia had to stop due to the pollution.Looting was rife and people stole food supplies.8 deaths were caused in a stampede for rice.Ground water was contaminated and disease spread.
Immediate Responses Long-term ResponsesAuthorities evacuated 800,000 peopleMany people sheltered in an indoor stadium in Tacloban. They died when the stadium flooded.
Emergency supplies were sent out but some got washed away.
Emergency supplies took 3 days to arrive in some areas by plane.
It took a week to restore power to some regions.
Within two weeks over one million food packs had been given out.
A curfew was imposed two days after the storm to reduce looting. No one was allowed out after dark.
The XFactor, Coca Cola and other companies influenced the public to donate more.
‘Build Back Better’ where the intention was not just to rebuild but upgrade and protect from future events.
No build zone along the coast
A new storm warning system
Mangroves replanted
** don’t forget to make link to how these responses will have positive knock on effects in the future.
Reducing the effects of tropical storms
7
Example
Satellites Aircraft2004 the Global Precipitation Measurement Satellite was Launched. It monitors precipitation every three hours to identify high altitude rainclouds.
NASA Global Hawk Drone – monitors Atlantic storms. Unmanned with on-board radar and equipment.
Super computers Planning to reduce risksSuper computers can now give 5 days warning. They successfully predicted 2013 Cyclone Phailin in India and saved up to 1.2. million lives as evacuation was completed early.
Preparing disaster supply kits Fuel in Vehicles Fill bath with clean water Know where official shelters are Shutters on windows Store loose objects Install emergency generator Remove trees close to buildings etc
An overview of types of weather hazard experienced in the UK.
Storms Events Flooding Drought Extreme cold eventsUK large depressions.2013 – widespread wind damage. Storm St Jude grounded planes at Gatwick. In 2005 a tornado in the UK killed 19 people.
Coastal, river flash and slow flooding and surface water flooding affects the UK. Flooding in 2013 caused a landslide which disrupted trains into London for weeks.
Extended periods with low rainfall. Longest drought in UK was in 1975. Recently in 2003 a drought in Europe was linked to 20,000 deaths.
The winter of 2010-11 and 2014-15 were exceptionally cold in the UK. Cold weather kills crops, stops trains and halts transport causing airline delays.
Extreme Weather – Flooding – Somerset Levels Flood 2014
8
Example

An example of a recent extreme weather event in the UK:
Somerset is a county in south-west England.
Somerset Levels are a large low lying area of land used for farming and wetlands.
The area is drained by two main rivers the River Tone and the River Parrett.
Causes Impacts
Extensive flooding was caused by:1) Wettest January since records began in 1910.2) High tides and storm surges swept water up
rivers.3) Rivers had not been dredged for 20 years so had
become clogged with sediment.
Social Over 600 homes flooded 16 farms evacuated People’s daily lives affected – attending school
etc. Many peoples power was cut off.
Economic £10 million of damage. 14,000 of farmland under water for 3-4 weeks. Over 1000 livestock evacuated
Environmental Floodwaters heavily contaminated with sewage
spread across fields. Huge amount of debris left behind Stagnant water that had collected for months
had to be reoxygenated before being pumped back into the river.
Immediate Responses Long-term ResponsesHome owners coped the best they could moving personal belongings upstairs etc.
Villagers cut off by the water used boats to go shopping and attend school.
Local community groups volunteered support to help people such as the elderly.
A £20 million Flood Action Plan has been launched by Somerset County Council.
Environment Agency working to help manage the area.
March 2014 8km of River Tone and Parrett were dredged to increase capacity.
Road levels have been raised in places to maintain communications even when water levels are high.
Vulnerable communities will have flood defences.
River banks raised and strengthened.
In the longer term by 2024 they are considering building a tidal barrage at Bridgwater.
Responses to different extreme weather events in the UK:
9
Drought (shortage of water) StormsHosepipe bansWater supplies to homes restrictedWater metres fitted
MET office improves predictionsSevere weather warnings (smart phones etc)Airlines and services etc suspend services to protect people.
Floods Cold WeatherHard engineering and flood barriers builtCloser monitoring of drainage basinsMore accurate predictionsDiscourage building in flood prone areas by increasing insurances etc.
Local councils improve ability to clear roads etc.Media warnings used to encourage people to take care.Charities such as Age Concern support the elderly during cold periods.
Climate Change
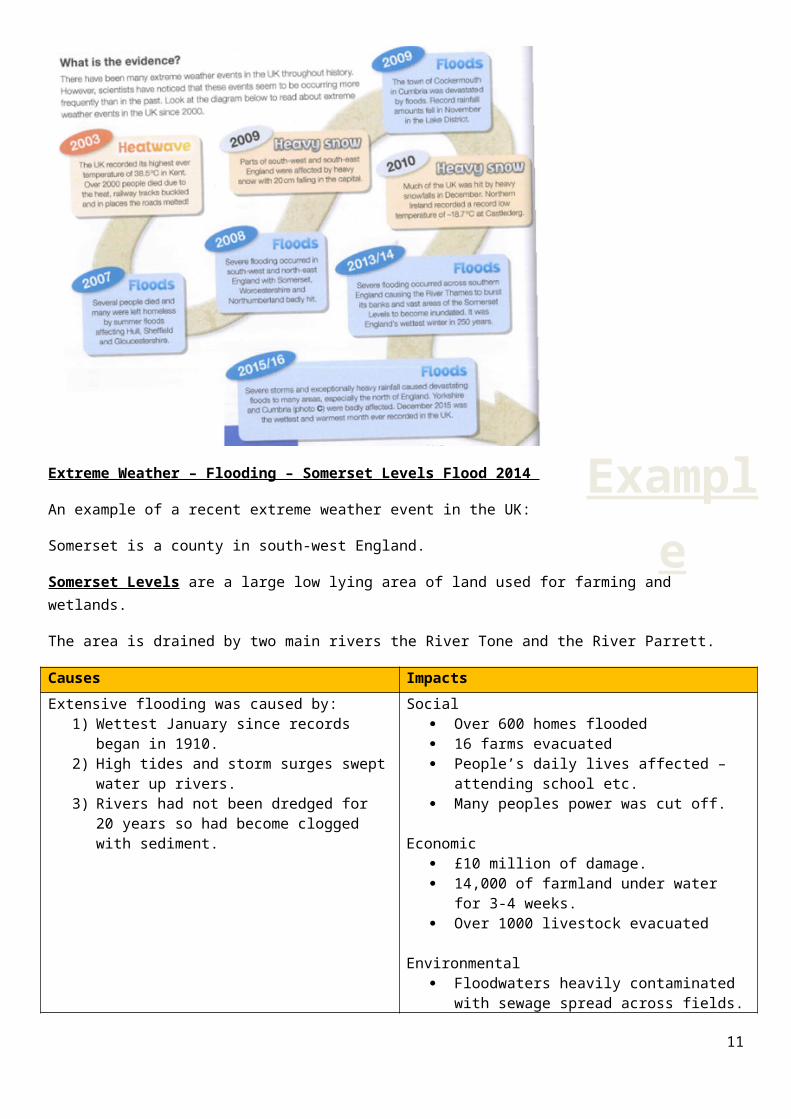
Evidence for climate change from the beginning of the Quaternary period to the present day.
** Proxy data – natural recorders of past temperatures
Ice Cores Tree Rings / Fossilised PollenRecords go back 800,000 yearsTime capsules for past climatesOxygen isotopes indicate temperatures. The ratio of three different oxygen isotopes are measured to work out the climate.More 018 = warmer weather because 018 is heavier so needs more of the sun’s energy to evaporate, condense and precipitate.
The size of tree rings and amount of fossilised pollen buried underground can indicate the temperate of the climate when they were alive.
Thicker rings = better growing conditions
Old paintings and diaries Ocean SedimentsOld paintings show markets on the River Thames when it was frozen over.Frost Fair painting 1677
The billions of tonnes of sediment deposited at the bottom of the seas provide a timeline. Organisms that remain in the sediments such as plankton reveal past water temperatures.
Scientific Data (Temperature Measurements) – Since 1914 we have collected reliable scientific data. This shows us
Sea levels have risen by 19 centimetres since 1900 Ocean temperatures are the warmest they have been since 1850 NASA data shows that since 2002 the volume of ice lost from Antarctica is 134 billion tonnes per year.
Possible causes of climate change:
Natural factors – orbital changes, volcanic activity and solar output
Human factors – use of fossil fuels, agriculture and deforestation.
Orbital ChangesEllipse – 100,000 yearsAxis tilt – 41,000 yearsWobble on axis, 20,000 year cycle.
Fossil fuelsEnhanced greenhouse effect - - fossil fuels account for 50% of greenhouse gas emissions. Burning fossil fuels emits carbon dioxide.
Volcanic ActivityCan cause temporary climate change. Pinatubo (1991) eruption caused drop of 0.5 degrees Celsius. Volcanic gases such as sulphur dioxide mix with water vapour to form an aerosol and block the suns heat out.
AgricultureContribute 20% of global greenhouse gas emissions. Also produces large amounts of methane. As population increases so will food production.
Solar Output (sun spots) Deforestation
10
Climate Change
The output of the sun varies. This did change from 1900-1940 but has been stable for the past 50 years so cannot be solely responsible for climate change.Little Ice Age (1645-1715) = less sunspots recorded
Clearing land – reduces photosynthesis. Releases carbon trapped in vegetation as a store.
Global impacts of climate change:
Extreme weather AgricultureUK will see higher temperatures. Crop yields might increase but need more irrigation (watering).
In areas of Asia crop yields of rice may increase, but maize and wheat may decrease.
Health WildlifeIn southern Africa malaria may be spread more as the climate is more humid.
Coral reefs such as the Great Barrier Reef may lose biodiversity as it is warmer and the oceans become more acidic.
Orangutans may face food shortages in the Borneo forest
Managing Climate Change:
Mitigation AdaptationAlternative energy – in 2013, 15% of UK’s energy was generated by renewable sources.
Carbon Capture and Storage (CCS) - by 2050 CCS could provide more than 20% of UK’s electricity
International Agreements – 2015 Paris Climate Change Conference and Agreement. Implemented in 2020.
Planting trees – reforestation. UK has invested £24.9 million in a project to reduce deforestation in Brazil.
Changes to agriculture – Drought resistant crops in the Gambia
Managing Water Supplies – artificial glaciers (Bolivia / India – Himalayas)
Raised Islands – Maldives
Ecosystems
An example of a small scale UK ecosystem:
Epping Forest, Essex, UK – Deciduous Woodland Ecosystem
Produces
Consumers
Decomposers
Scavengers
Biodiversity – the variety of life in the world or a particular habitat.
Nutrient Cycling - a set of processes whereby organisms extract minerals necessary for growth from soil or water, before passing them on through the food chain, and ultimately back to the soil and water.
11
Ecosystems
Example

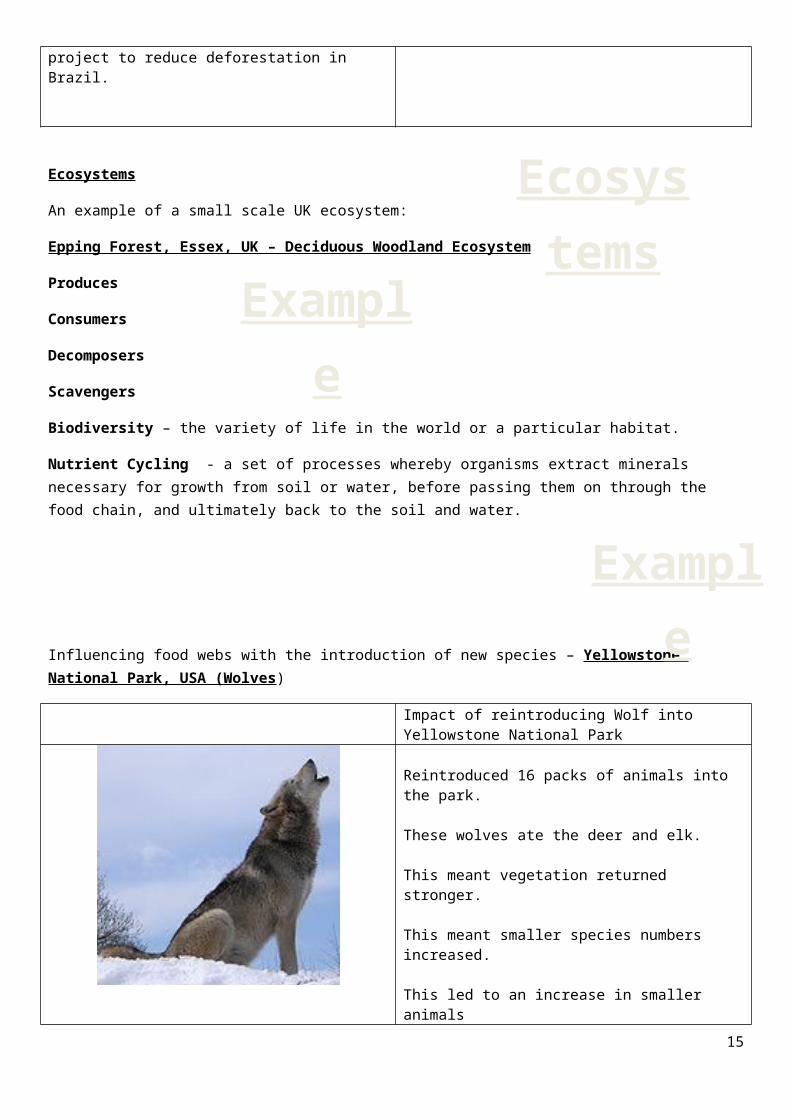
Influencing food webs with the introduction of new species – Yellowstone National Park, USA (Wolves)
Impact of reintroducing Wolf into Yellowstone National Park
Reintroduced 16 packs of animals into the park.
These wolves ate the deer and elk.
This meant vegetation returned stronger.
This meant smaller species numbers increased.
This led to an increase in smaller animals
Birds of prey etc increased in numbers as a result.
Beavers recolonised rivers as there was more wood/trees for them to build habitats etc.
Tropical Rainforests – Borneo (Malaysia)
Deforestation:
Cause of deforestation in Malaysia
Detail about the cause An impact of this cause of deforestation Economic, social or environmental impact?
Commercial Logging
Clear felling was common in the 1980s.
Deforestation threatens the survival of many species, including the orang-utanA local Penan community protested against a logging company and were imprisoned.Malaysia was the biggest exporter of tropical woods and so made a lot of money.
Energy $2bn Bakun Dam project flooded thousands of hectares of forest to provide hydroelectric power for new industries.
9000 Kenyah people have been forced to move from the flooded area. They are traditional subsistence farmers (farm enough to eat but not sell) but are being asked to pay to be rehoused. Many suffer from depression and alcoholism.
Mining For tin and drilling for oil and gas. Forest has been cleared for operations and construction of roads.
Land and rivers have been polluted by mining chemicals and affected local food chains.
12
Example
Example
Commercial plantations
Forest was cleared for rubber plantations and, in the 1970s, for oil palm. 10 year tax breaks for owners has led to more forest being converted to plantations.
Malaysia was the largest exporter of palm oil in the world and so made a lot of money.
Sustainable solutions to deforestation in Borneo:
Name of strategy You must be able to explain why this method is sustainable… how does it ensure the forest is protected for future generations?
Selective Management System (SMS)
Fully grown trees are selected.Arrows painted on trees to show which direction it should be felled (cut down)Tree is removed from forest by water buffalo rather than a lorry.Replacement tree is planted.
Permanent Forest Estates
Areas of forest are protected – no development or conversion to plantations is allowed.10% has special conservation status
Forest Stewardship Council (FSC)
Educates people to buy soft, fast growing wood like pine rather than hard, slow growing wood like mahogany.Educates manufacturers and consumers (buyers) to buy wood only from sustainable sources (all their products have the FSC label on)
Ecotourism Borneo – swiftlet nest caves (one used by swiftlets, one harvested for their nests to sell, one shown off to tourists) Borneo – turtles (used to eat them, now have a hatchery to show tourists who then set them free into the oceans)Tourism that focuses on protecting the environment and the local way of life.
Debt relief / Carbon Sinks
LEDCs are paid money by MEDCs to make sure their rainforests are not cut down.A 75,000 hectare national park was funded by Europe and NGOs (Non-Government Organisations – charities such as the RSPB). This is paid to protect the area and support its carbon intake for the future.
Deserts – Western Desert (USA)
A case study of a hot desert to illustrate:
13
Example
• Development opportunities in hot desert environments: mineral extraction, energy, farming, tourism
• Challenges of developing hot desert environments: extreme temperatures, water supply, inaccessibility.
Opportunities Challenges1) Mineral extraction – Copper, lead, zinc and uranium. Near Grand Canyon but some people opposed to nuclear power.
The Havasupai people managed to stop uranium mining on their land near the Grand Canyon as they were concerned about the risk to wildlife and endangered species and the contamination of water supplies.
2) Energy – Solar energy (Sonoran Solar Project in Arizona), HEP employs 5000 people, Fossil Fuels employs 100 people and creates $50million.
3) Farming- Irrigation is essential from aquifers and Canals (Central Arizona Project). Farmers use 80% of water but only contribute 10% to economy.
4) Tourism – National parks, Las Vegas, Grand Canyon. 37 million visitors per year.
1) Extreme temperaturesPeople only live where there is water available and climate is not too extreme.Carrying Capacity refers to the amount of people the area can support with its resources e.g. water.
2) Water supplyWater is in limited supply. Aquifers have been overused and maintaining canals is expensive. Water is harvested from roofs, sprinklers limited and grey water used where possible. Gardens have native species in which need less watering.
3) InaccessibilityRoads were poor quality and the desert difficult to access. Railways were built in the late 1800s. Roads were improved from the 1900s and recently Las Vegas has its own airport which receives 30 million people a year.
Desertification – Sahel, Africa (At or near the edge of deserts)
Areas on the fringe of hot deserts are at risk of desertification.
Causes of desertification Solutions to reduce desertificationPopulation pressures – bigger populations mean more use of wood for fires and more grazing of animals. This increases the pressure and damages the environment.
Over cultivation – overcropping and growing water hungry cash crops which damages soil.
Overgrazing – Too many goats and cattle are grazed and they destroy all vegetation and trample the soil.
Soil erosion – Both of the above leave the soil bare and the nutrient rich topsoil is then eroded away by the wind. It is also baked hard by the sunlight. Occasional rain washes it away.
Climate Change – More extreme temperatures dry the soil out and destroy vegetation.
Education – education locals in how to protect the land is important. They do not understand the damage they are doing.
Planting Trees – The Great Green Wall (7,775km of trees)This will secure the ground from erosion and shade it so more vegetation grows.
Bunds – small stone walls trap moisture and help vegetation return. They are cheap and very effective at improving the soil.
Appropriate technology – using solar ovens means less wood has to be cut down for fires etc. The same happens with solar lights which means wood is not burnt for light.
Coasts
Weathering and Mass Movement
Weathering: is the breaking down of rock in situ (where it is)
14
Example
Coasts
Chemical Weathering Mechanical WeatheringChemical Weathering is caused by a chemical reaction when rainwater hits rock and decomposes it (or eats it away)
Carbonation Hydrolysis Oxidation
e.g. Acid rain
Mechanical weathering results in rocks being disintegrated rather than decomposed. It is usually associated with extremes of temperature.
Freeze-thaw weathering Salt weathering
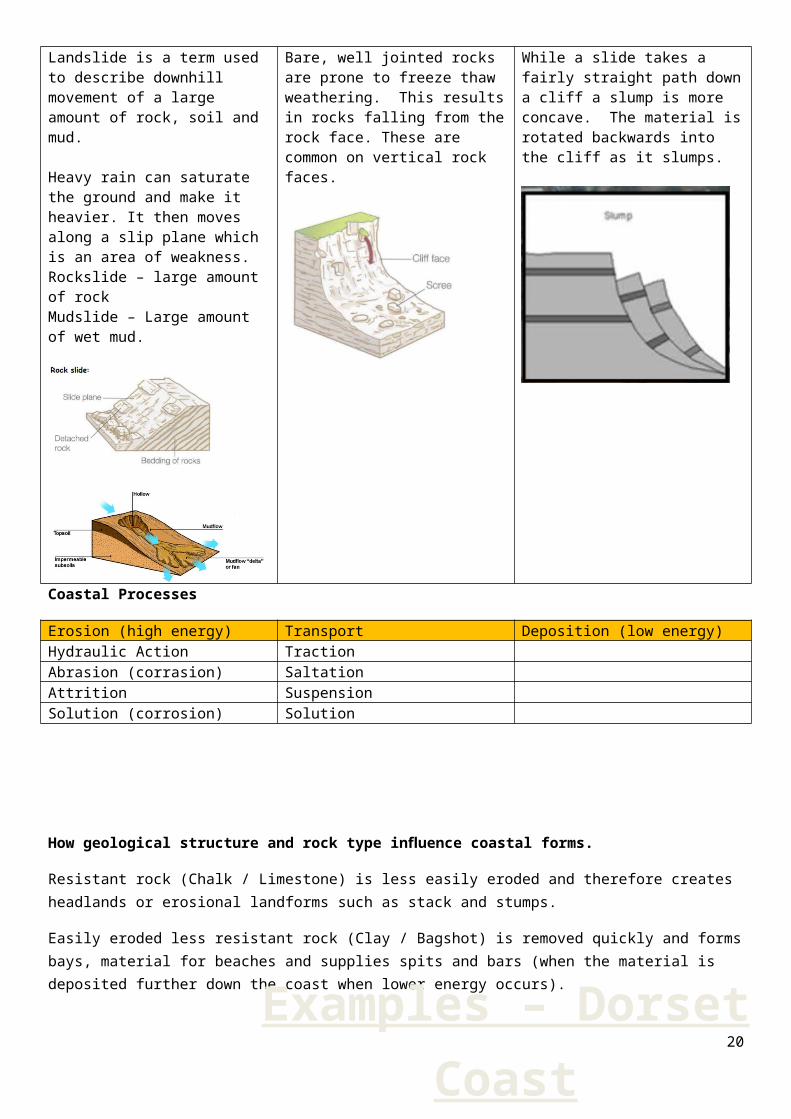
Mass movement: Is the downslope movement of rock, soil or mud under the influence of gravity. Heavy rainfall can be a trigger.Sliding Rockfalls SlumpingLandslide is a term used to describe downhill movement of a large amount of rock, soil and mud.
Heavy rain can saturate the ground and make it heavier. It then moves along a slip plane which is an area of weakness.Rockslide – large amount of rockMudslide – Large amount of wet mud.
Bare, well jointed rocks are prone to freeze thaw weathering. This results in rocks falling from the rock face. These are common on vertical rock faces.
While a slide takes a fairly straight path down a cliff a slump is more concave. The material is rotated backwards into the cliff as it slumps.
Coastal Processes
Erosion (high energy) Transport Deposition (low energy)Hydraulic Action TractionAbrasion (corrasion) SaltationAttrition SuspensionSolution (corrosion) Solution
How geological structure and rock type influence coastal forms.
Resistant rock (Chalk / Limestone) is less easily eroded and therefore creates headlands or erosional landforms such as stack and stumps.
15

Easily eroded less resistant rock (Clay / Bagshot) is removed quickly and forms bays, material for beaches and supplies spits and bars (when the material is deposited further down the coast when lower energy occurs).
Dorset Coast Landforms
Erosion Transportation DepositionBays and Headlands(Concordant and Discordant)Example:Durlston HeadIsle of Purbeck, Dorset.Swanage Bay
Longshore Drift Prevailing Wind Swash Backwash Direction of longshore drift
Beaches (Pebble / Shingle and Sand)
Pebble beach –Example: Chesil Beach, Dorset
Sandy Beach –Example: Sandbanks Beach, Poole, Dorset.
Cliffs and Wave cut platforms / notchExample: Kimmeridge wave cut platform e.g. Washing Ledge
Sand DunesExample: Studland, Dorset
Caves, Arches, Stacks and stumpsExample:Durdle Door ArchOld Harry Stack
Spits and BarsExample:Sandbanks spit and barHurst Castle Spit
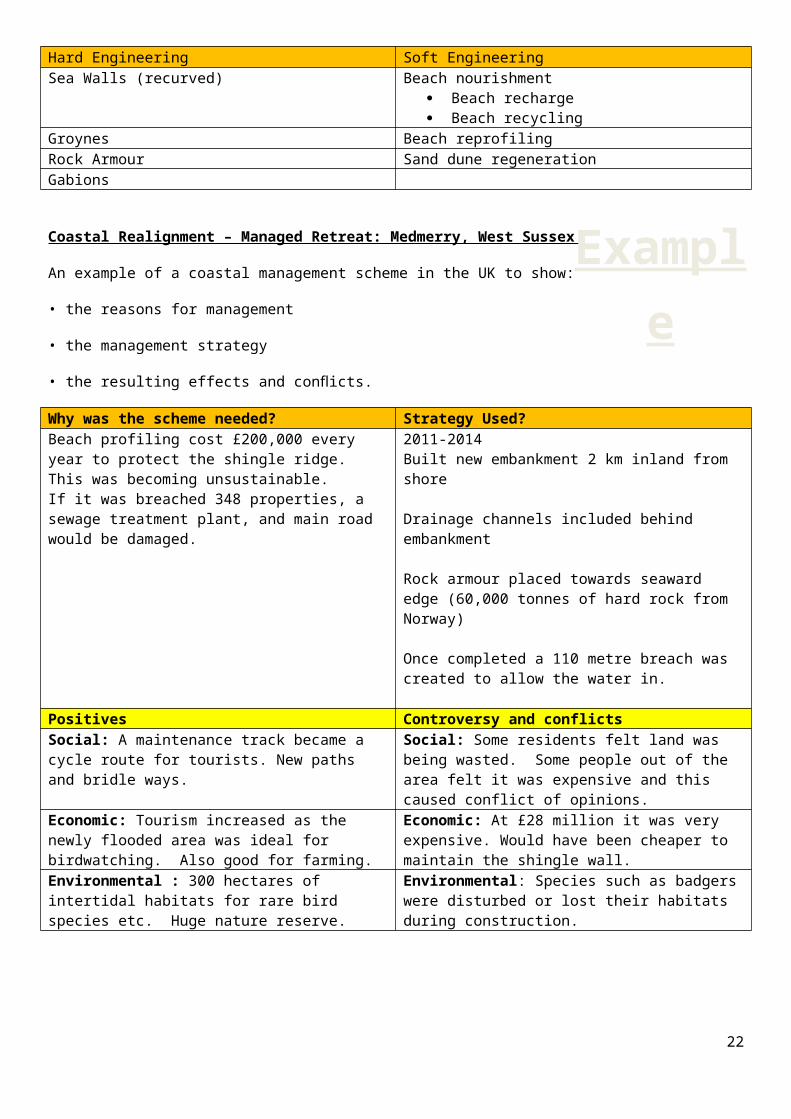
Hard and Soft Engineering (need to know positive and negatives of each).
Hard Engineering Soft EngineeringSea Walls (recurved) Beach nourishment
16
Examples – Dorset Coast
You must be able to draw and explain how these landforms are
created!!!!!

Beach recharge Beach recycling
Groynes Beach reprofilingRock Armour Sand dune regenerationGabions
Coastal Realignment – Managed Retreat: Medmerry, West Sussex
An example of a coastal management scheme in the UK to show:
• the reasons for management
• the management strategy
• the resulting effects and conflicts.
Why was the scheme needed? Strategy Used?Beach profiling cost £200,000 every year to protect the shingle ridge.This was becoming unsustainable.If it was breached 348 properties, a sewage treatment plant, and main road would be damaged.
2011-2014Built new embankment 2 km inland from shore
Drainage channels included behind embankment
Rock armour placed towards seaward edge (60,000 tonnes of hard rock from Norway)
Once completed a 110 metre breach was created to allow the water in.
Positives Controversy and conflictsSocial: A maintenance track became a cycle route for tourists. New paths and bridle ways.
Social: Some residents felt land was being wasted. Some people out of the area felt it was expensive and this caused conflict of opinions.
Economic: Tourism increased as the newly flooded area was ideal for birdwatching. Also good for farming.
Economic: At £28 million it was very expensive. Would have been cheaper to maintain the shingle wall.
Environmental : 300 hectares of intertidal habitats for rare bird species etc. Huge nature reserve.
Environmental: Species such as badgers were disturbed or lost their habitats during construction.
Rivers
17
Example
Rivers

River Severn Landforms
Upper Middle Lower
V Shaped Valley
Example: Afon Dulas Valley
Meanders and Oxbow lake
Examples:Meander – ShrewsburyOxbow Lake – Welshpool
Floodplain
Examples:
Levees – Minster Worth near Gloucester
Floodplain – Tewkesbury, Gloucestershire
Estuary – Severn Estuary (Severn bridge crossing)
Waterfall
Example: River Severn breaks its neckExample: Ironbridge Gorge
How physical and human factors affect the flood risk – precipitation, geology, relief and land use.
The use of hydrographs to show the relationship between precipitation and discharge.
18
Meander Cross Section
Remember this is caused by ‘Lateral Erosion’
You must be clear and label the inside and outside of the bend.
Vertical Erosion
Weathering
Long profile of a river
Natural causes of change to LAG TIME
‘Flashy’ response hydrograph(lots of surface run off, little infiltration) – SHORTER LAG TIME
Slow responses hydrograph(less of surface run off because more infiltration)– LONGER LAG TIME
Basin Size Small basin often leads to a rapid water transfer - less far to travel to river.
Large basins result in a relatively slow water transfer – further to get to the river
Drainage density A high density speeds up water transfer – lots of tributaries speeds up water getting to main river
A low density leads to a slower transfer – fewer tributaries.
Rock type Impermeable rocks (e.g. granite) encourage rapid surface run off.
Permeable rocks (e.g. sandstone) allow infiltration so encourage a slow transfer by groundwater flow.
Land use Urbanisation encourages rapid water transfer as concrete is impermeable and leads to lots of surface run off.
Forests slow down transfer, because of interception and transpiration
Relief Steep slopes lead to rapid water transfer
Gentle slopes slow down water transfer
Soil moisture Saturated soil results in rapid surface run off (no infiltration)
Dry soil soaks up water (infiltration) and slows down its transfer
Rainfall intensity Heavy rain may exceed the infiltration capacity of vegetation, and lead to rapid surface run off.
Light rain will transfer slowly and most will soak into the soil.
Human causes of change to LAG TIME:
Urban Rural
19
Lagtime – time between peak precipitation and peak discharge
New InfrastructureThis increases the risk of flooding because surface run off increases. Impermeable surfaces of roads etc
Forestry (deforestation)Dense forest intercepts water and slows it down. It can also use up to 40% of water and therefore less forest reduces the lag time and increases the chance of flash flooding.
New HousesDevelopers are squeezing houses in where they can. Between 2001 and 2011 there was an increase of 72% in the density of new homes.
FarmingLoss of hedges means less interception. Ploughed fields also create channels which can increase surface run off.
Disappearing GardensThis increases the risk of flooding because gardens are replaced with impermeable surfaces such as driveways. This reduces infiltration and leads to faster surface run off.
Disappearing FieldsFields absorb water through infiltration. As more fields are covered with greenhouses and plastic sheeting surface run off increases. This reduces lag time and increases the chance of flooding.
Hard and Soft Engineering (need to know positive and negatives of each).
Hard Engineering Soft EngineeringDams and reservoirs Flood plain zoningChannel Straightening Flood warnings and preparationEmbankments Planting treesFlood relief channels River restoration
River Flood Relief (alleviation) scheme: CAUSES OF FLOODING IN FRANKWELL
Frankwell Flood Defence Scheme, Shrewsbury (2002)
Natural Causes – Why Shrewsbury is prone to flooding Impacts of previous flooding (2000)
River Severn passes through steep sided valleys Cost £7-8 million
Many tributary steams feed into the River Severn Emotional distress
Large catchment area Residents and traders in Frankwell had to abandon their properties
Shrewsbury is on impermeable rock called slatey-shales The town was closed due to the disruption to bridges (Welsh and English bridge)
High levels of precipitation fall in Autumn Lower ground floor of Wakeman School was ruined as floodwater swept through technology suites, food rooms and kitchens.
Soils become saturated and increase surface runoff (reduced lag-time)
Boots lost £250,000, Marks and Spencer lost £975,00 and had to throw away £30,000 of food.
Number of shoppers fell by 60%
400+ properties were flooded.
River Flood Relief (alleviation) scheme – Frankwell Flood Defence Scheme, Shrewsbury (2002)
Why was the scheme needed? Strategy Used?A flood alleviation scheme, which protects over 70 Demountable flood wall
20
Example
Example

properties in Frankwell, was completed within only three years of the 2000 floods. The work cost £3.5 million. The scheme involved 700 metres of defences including flood banks and walls, and about 130 metres of demountable defences at various heights.
Land use zoning – car park allowed to floodPumping Stations
ImpactsSocial: Access difficulties for the public and residence during constructionShort term disturbances during constructionIs it ethical? Where do you save and is it fair to put other areas at higher risk?
Economic:Significant construction and maintenance costs6th Feb 2004 – 74 properties protected that would have been flooded previously.Cost £3.5 million
Environmental :Loss of trees along river corridorPotential change to riverside characteristicsMedieval historic sites disturbed
Don’t forget to learn how to complete 4 and 6 figure grid references!!!
214 fig – PARKING (blue P) = 0363
6 fig – PARKING = 038633
22