GCM Q1 2016s21.q4cdn.com/.../files/doc_presentations/GCM-Q1-2016.pdf4 TSX: GCM OTC: TPRFF May13,...
13
1 TSX: GCM OTC: TPRFF May 13, 2016 Lombardo Paredes Arenas, CEO Mike Davies, CFO The leading high‐grade gold producer in Colombia Q1 2016 Results May 13, 2016
Transcript of GCM Q1 2016s21.q4cdn.com/.../files/doc_presentations/GCM-Q1-2016.pdf4 TSX: GCM OTC: TPRFF May13,...
1
TSX: GCMOTC: TPRFFMay 13, 2016
Lombardo Paredes Arenas, CEOMike Davies, CFO
The leading high‐grade gold producer in Colombia
Q1 2016 ResultsMay 13, 2016
2
TSX: GCMOTC: TPRFFMay 13, 2016
Forward‐Looking Statements DISCLAIMER
This presentation contains "forward‐looking information", which may include, but is not limited to, statements withrespect to the future financial or operating performance of the Company and its projects, and, specifically, statementsconcerning anticipated growth in annual gold production, reduction of cash costs and AISC, future G&A andcapex,interest payments on the senior debt and future purchases and/or redemptions of the senior debt. Often, butnot always, forward‐looking statements can be identified by the use of words such as "plans", "expects", "isexpected", "budget", "scheduled", "estimates", "forecasts", "intends", "anticipates", or "believes" or variations(including negative variations) of such words and phrases, or state that certain actions, events or results "may","could", "would", "might" or "will" be taken, occur or be achieved. Forward‐looking statements involve known andunknown risks, uncertainties and other factors which may cause the actual results, performance or achievements ofGran Colombia to be materially different from any future results, performance or achievements expressed or impliedby the forward‐looking statements. Factors that could cause actual results to differ materially from those anticipatedin these forward‐looking statements are described under the caption "Risk Factors" in the Company's AnnualInformation Form dated as of March 30, 2016 which is available for view on SEDAR at www.sedar.com. Forward‐looking statements contained herein are made as of the date of this press release and Gran Colombia disclaims, otherthan as required by law, any obligation to update any forward‐looking statements whether as a result of newinformation, results, future events, circumstances, or if management's estimates or opinions should change, orotherwise. There can be no assurance that forward‐looking statements will prove to be accurate, as actual resultsand future events could differ materially from those anticipated in such statements. Accordingly, the reader iscautioned not to place undue reliance on forward‐looking statements.

3
TSX: GCMOTC: TPRFFMay 13, 2016
RESULTS Highlights
Mine development at Sandra K – July 17, 2014
1st Quarter2016 2015
Gold production (ozs) 31,489 23,973Gold sales (ozs) 29,686 25,332
Realized gold price ($/oz) $1,144 $1,193
Cash cost ($/oz) $685 $824AISC ($/oz) $790 $938
Revenue $34.5M $30.7MAdjusted EBITDA (1) $11.6M $7.1M
Adjusted net income (loss) (1) $0.3M ($1.8M)Per share $0.00 ($0.08)
(1) Refer to Company’s MD&A for computation
4
TSX: GCMOTC: TPRFFMay 13, 2016
RESULTS
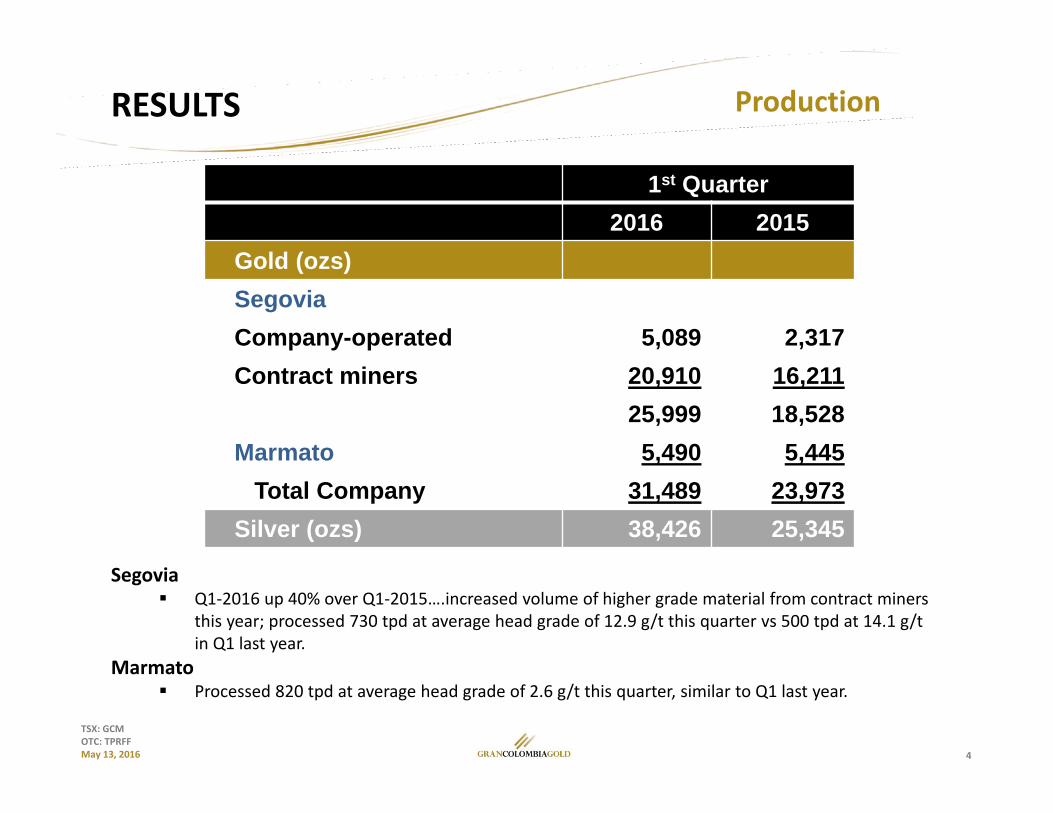
Segovia Q1‐2016 up 40% over Q1‐2015….increased volume of higher grade material from contract miners
this year; processed 730 tpd at average head grade of 12.9 g/t this quarter vs 500 tpd at 14.1 g/t in Q1 last year.
Marmato Processed 820 tpd at average head grade of 2.6 g/t this quarter, similar to Q1 last year.
Production
1st Quarter2016 2015
Gold (ozs)SegoviaCompany-operated 5,089 2,317Contract miners 20,910 16,211
25,999 18,528Marmato 5,490 5,445
Total Company 31,489 23,973Silver (ozs) 38,426 25,345
5
TSX: GCMOTC: TPRFFMay 13, 2016
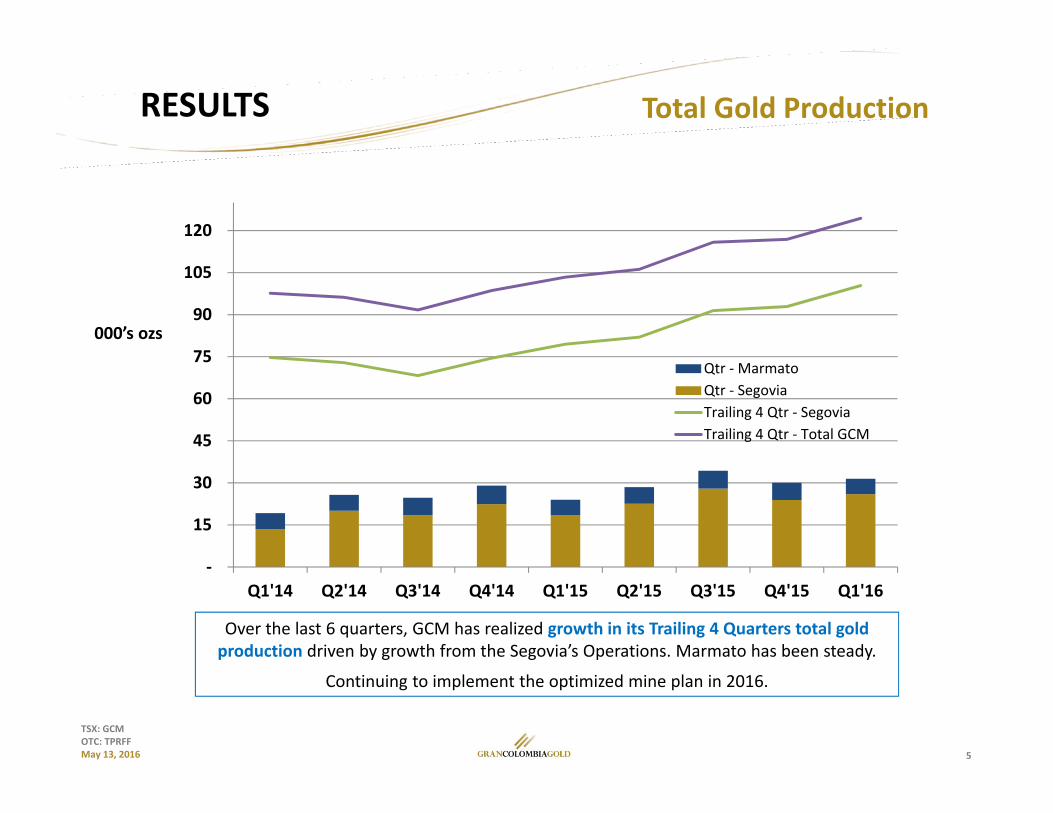
Over the last 6 quarters, GCM has realized growth in its Trailing 4 Quarters total gold production driven by growth from the Segovia’s Operations. Marmato has been steady.
Continuing to implement the optimized mine plan in 2016.
Total Gold ProductionRESULTSAISC (‐23%
)
000’s ozs
‐
15
30
45
60
75
90
105
120
Q1'14 Q2'14 Q3'14 Q4'14 Q1'15 Q2'15 Q3'15 Q4'15 Q1'16
Qtr ‐ MarmatoQtr ‐ SegoviaTrailing 4 Qtr ‐ SegoviaTrailing 4 Qtr ‐ Total GCM
6
TSX: GCMOTC: TPRFFMay 13, 2016
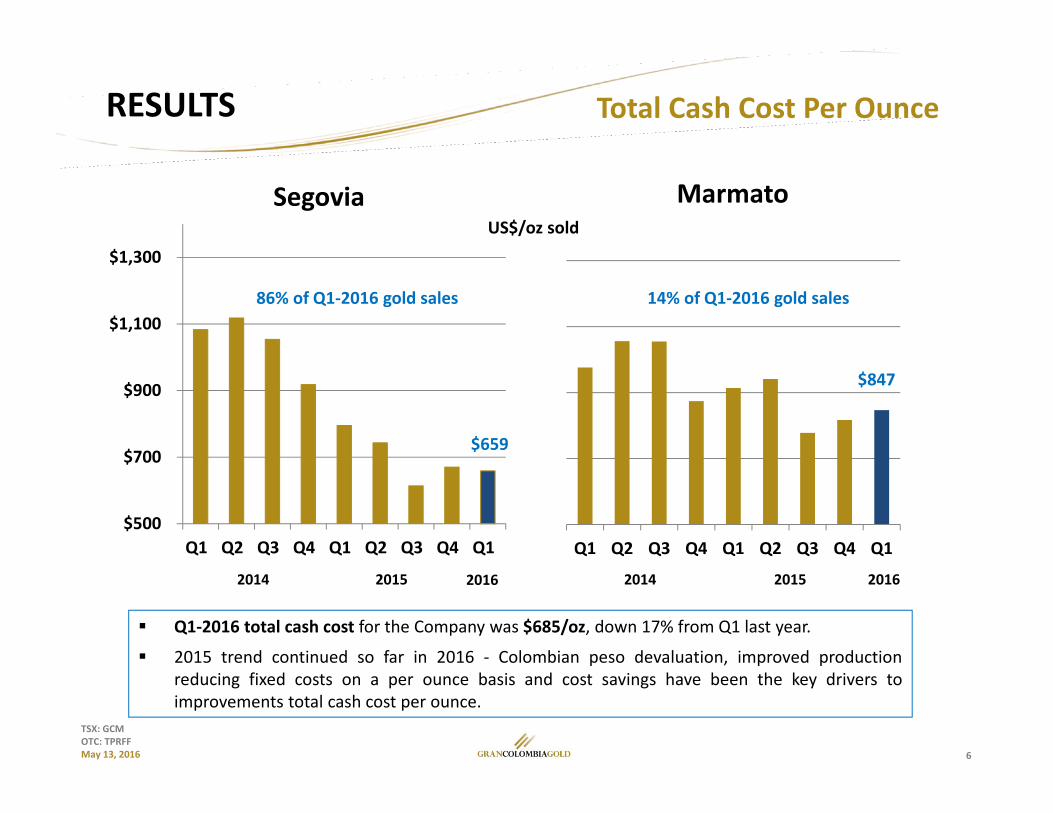
Q1‐2016 total cash cost for the Company was $685/oz, down 17% from Q1 last year.
2015 trend continued so far in 2016 ‐ Colombian peso devaluation, improved productionreducing fixed costs on a per ounce basis and cost savings have been the key drivers toimprovements total cash cost per ounce.
Total Cash Cost Per OunceRESULTS
117
89
$500
$700
$900
$1,100
$1,300
Q1 Q2 Q3 Q4 Q1 Q2 Q3 Q4 Q1
Segovia
Q1 Q2 Q3 Q4 Q1 Q2 Q3 Q4 Q1
Marmato
$847
14% of Q1‐2016 gold sales
2014 20142015 2015
US$/oz sold
$659
2016 2016
86% of Q1‐2016 gold sales
7
TSX: GCMOTC: TPRFFMay 13, 2016
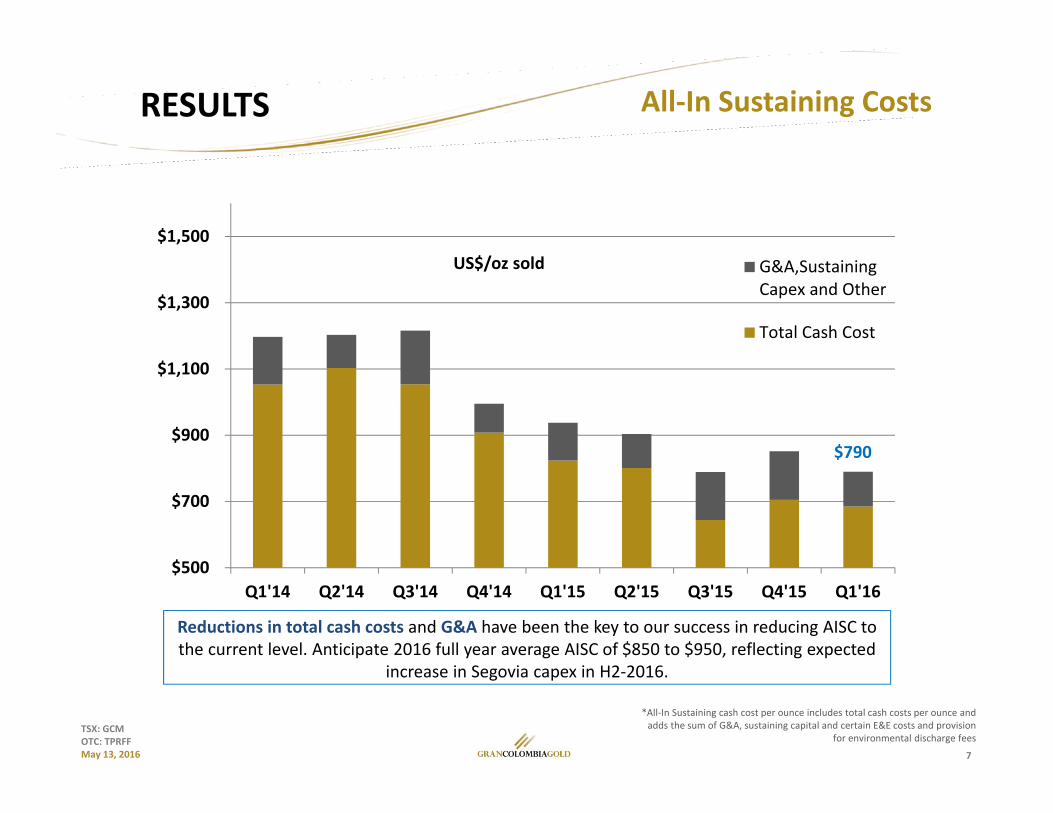
Reductions in total cash costs and G&A have been the key to our success in reducing AISC to the current level. Anticipate 2016 full year average AISC of $850 to $950, reflecting expected
increase in Segovia capex in H2‐2016.
All‐In Sustaining Costs
*All‐In Sustaining cash cost per ounce includes total cash costs per ounce and adds the sum of G&A, sustaining capital and certain E&E costs and provision
for environmental discharge fees
RESULTSAISC (‐23%
)
US$/oz sold
$500
$700
$900
$1,100
$1,300
$1,500
Q1'14 Q2'14 Q3'14 Q4'14 Q1'15 Q2'15 Q3'15 Q4'15 Q1'16
G&A,SustainingCapex and Other
Total Cash Cost
$790
8
TSX: GCMOTC: TPRFFMay 13, 2016
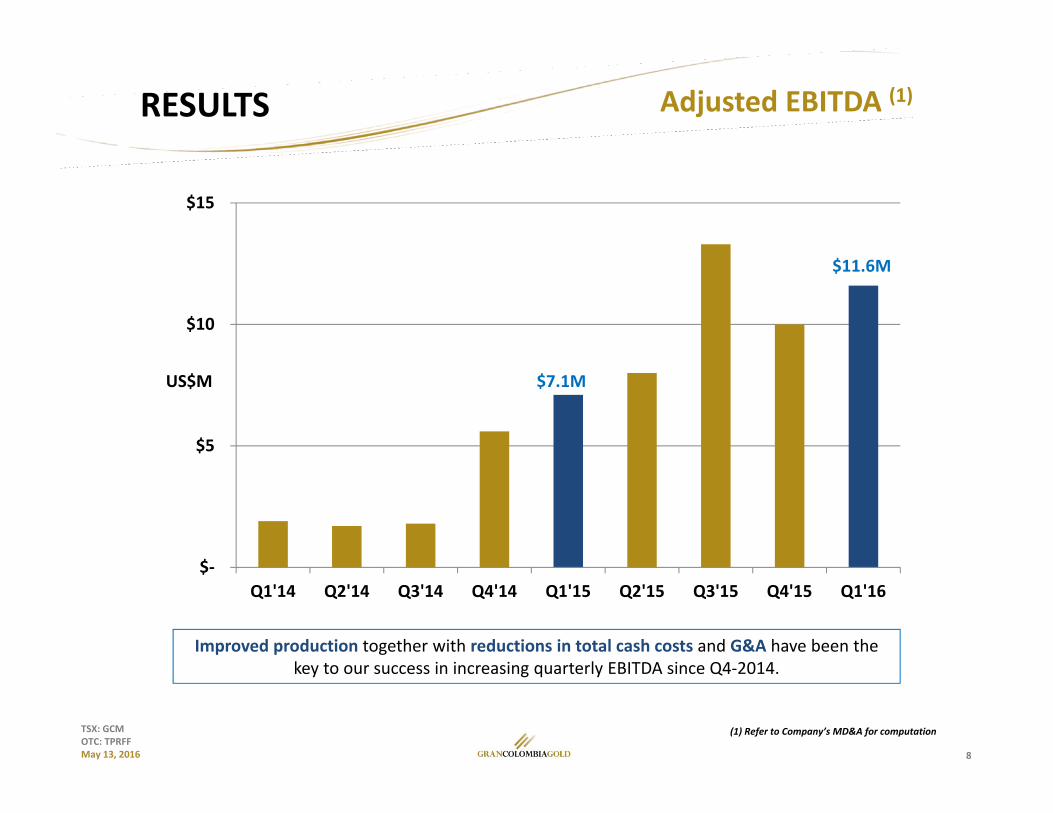
Improved production together with reductions in total cash costs and G&A have been the key to our success in increasing quarterly EBITDA since Q4‐2014.
Adjusted EBITDA (1)RESULTSAISC (‐23%
)US$M
$‐
$5
$10
$15
Q1'14 Q2'14 Q3'14 Q4'14 Q1'15 Q2'15 Q3'15 Q4'15 Q1'16
$11.6M
$7.1M
(1) Refer to Company’s MD&A for computation
9
TSX: GCMOTC: TPRFFMay 13, 2016
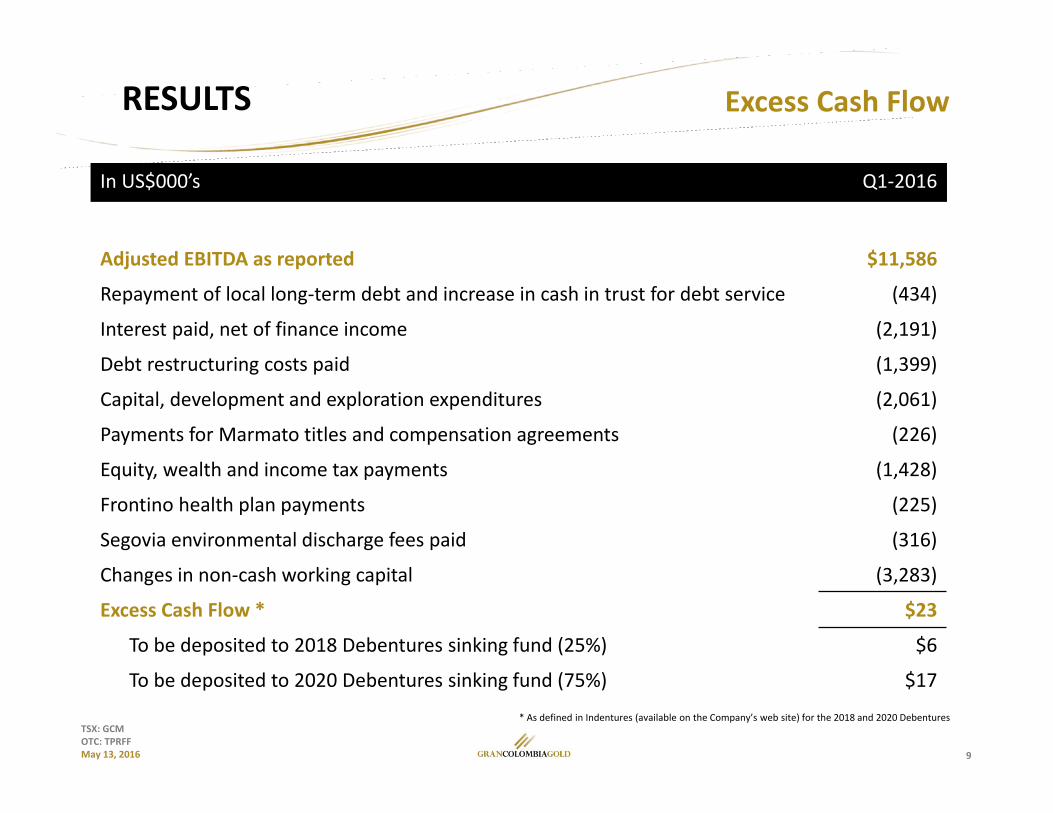
Excess Cash FlowRESULTS
* As defined in Indentures (available on the Company’s web site) for the 2018 and 2020 Debentures
In US$000’s Q1‐2016
Adjusted EBITDA as reported $11,586
Repayment of local long‐term debt and increase in cash in trust for debt service (434)
Interest paid, net of finance income (2,191)
Debt restructuring costs paid (1,399)
Capital, development and exploration expenditures (2,061)
Payments for Marmato titles and compensation agreements (226)
Equity, wealth and income tax payments (1,428)
Frontino health plan payments (225)
Segovia environmental discharge fees paid (316)
Changes in non‐cash working capital (3,283)
Excess Cash Flow * $23
To be deposited to 2018 Debentures sinking fund (25%) $6
To be deposited to 2020 Debentures sinking fund (75%) $17
10
TSX: GCMOTC: TPRFFMay 13, 2016
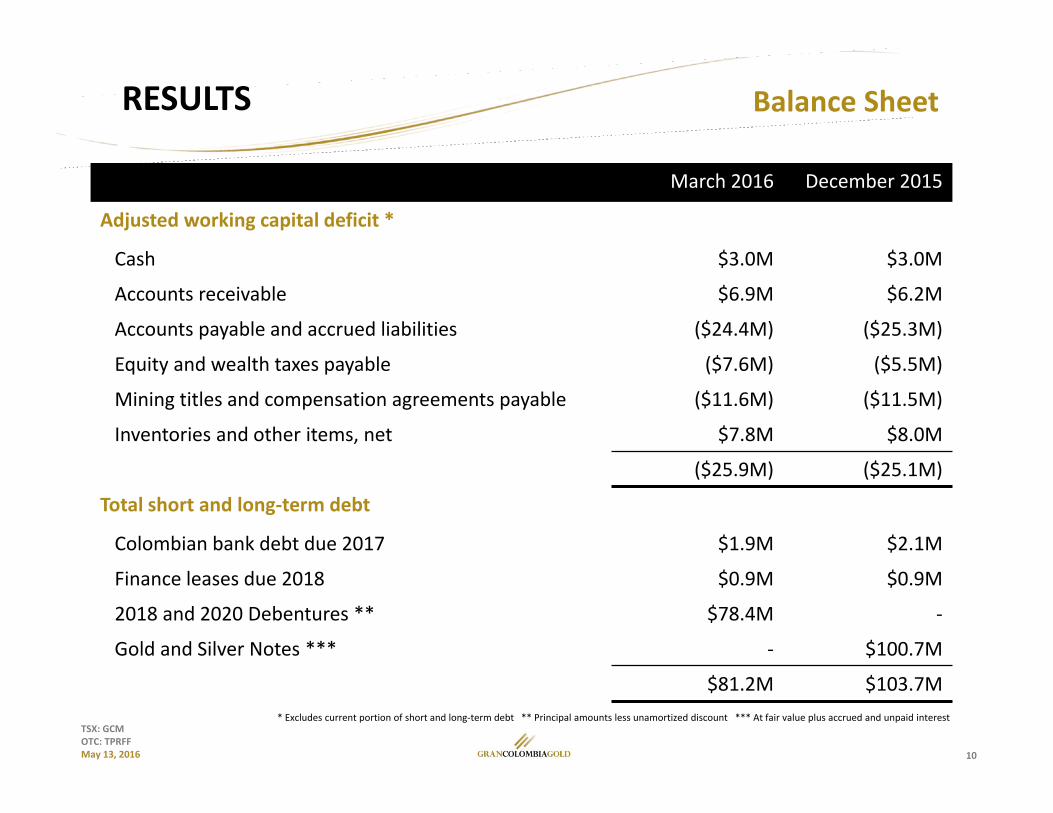
Balance SheetRESULTS
* Excludes current portion of short and long‐term debt ** Principal amounts less unamortized discount *** At fair value plus accrued and unpaid interest
March 2016 December 2015
Adjusted working capital deficit *
Cash $3.0M $3.0M
Accounts receivable $6.9M $6.2M
Accounts payable and accrued liabilities ($24.4M) ($25.3M)
Equity and wealth taxes payable ($7.6M) ($5.5M)
Mining titles and compensation agreements payable ($11.6M) ($11.5M)
Inventories and other items, net $7.8M $8.0M
($25.9M) ($25.1M)
Total short and long‐term debt
Colombian bank debt due 2017 $1.9M $2.1M
Finance leases due 2018 $0.9M $0.9M
2018 and 2020 Debentures ** $78.4M ‐
Gold and Silver Notes *** ‐ $100.7M
$81.2M $103.7M
11
TSX: GCMOTC: TPRFFMay 13, 2016
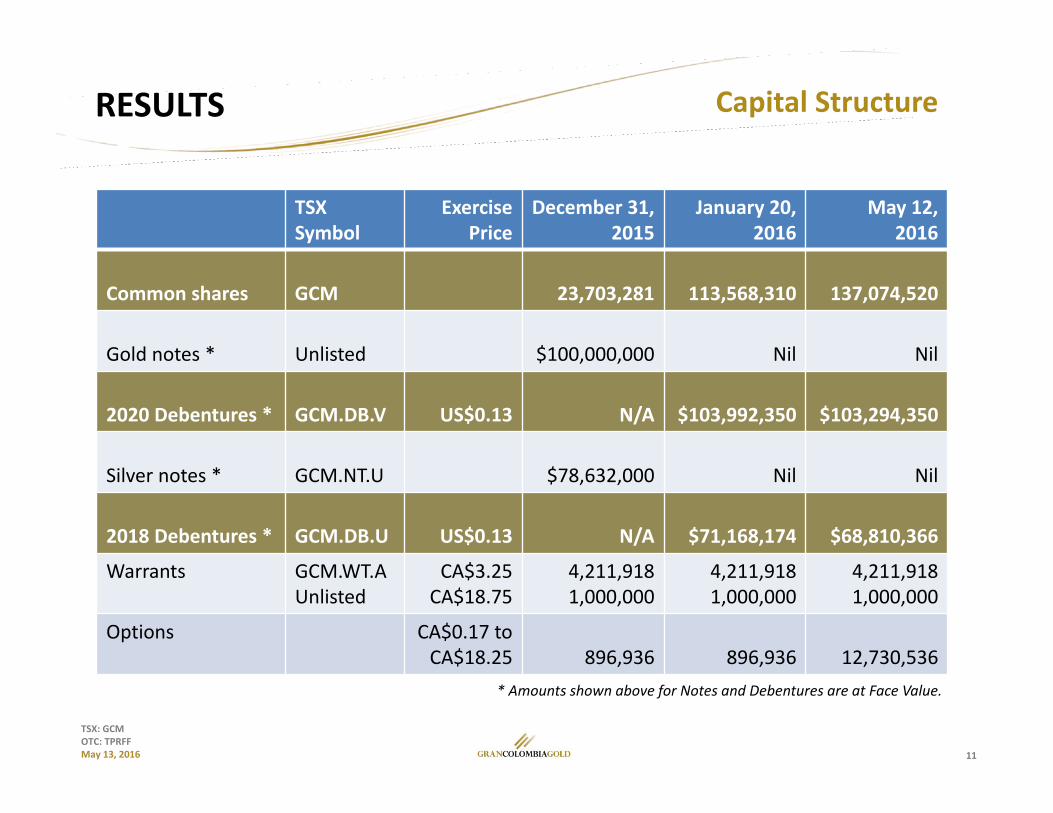
RESULTS
TSX Symbol
Exercise Price
December 31,2015
January 20,2016
May 12, 2016
Common shares GCM 23,703,281 113,568,310 137,074,520
Gold notes * Unlisted $100,000,000 Nil Nil
2020 Debentures * GCM.DB.V US$0.13 N/A $103,992,350 $103,294,350
Silver notes * GCM.NT.U $78,632,000 Nil Nil
2018 Debentures * GCM.DB.U US$0.13 N/A $71,168,174 $68,810,366
Warrants GCM.WT.AUnlisted
CA$3.25CA$18.75
4,211,9181,000,000
4,211,9181,000,000
4,211,9181,000,000
Options CA$0.17 to CA$18.25 896,936 896,936 12,730,536
* Amounts shown above for Notes and Debentures are at Face Value.
Capital Structure
12
TSX: GCMOTC: TPRFFMay 13, 2016
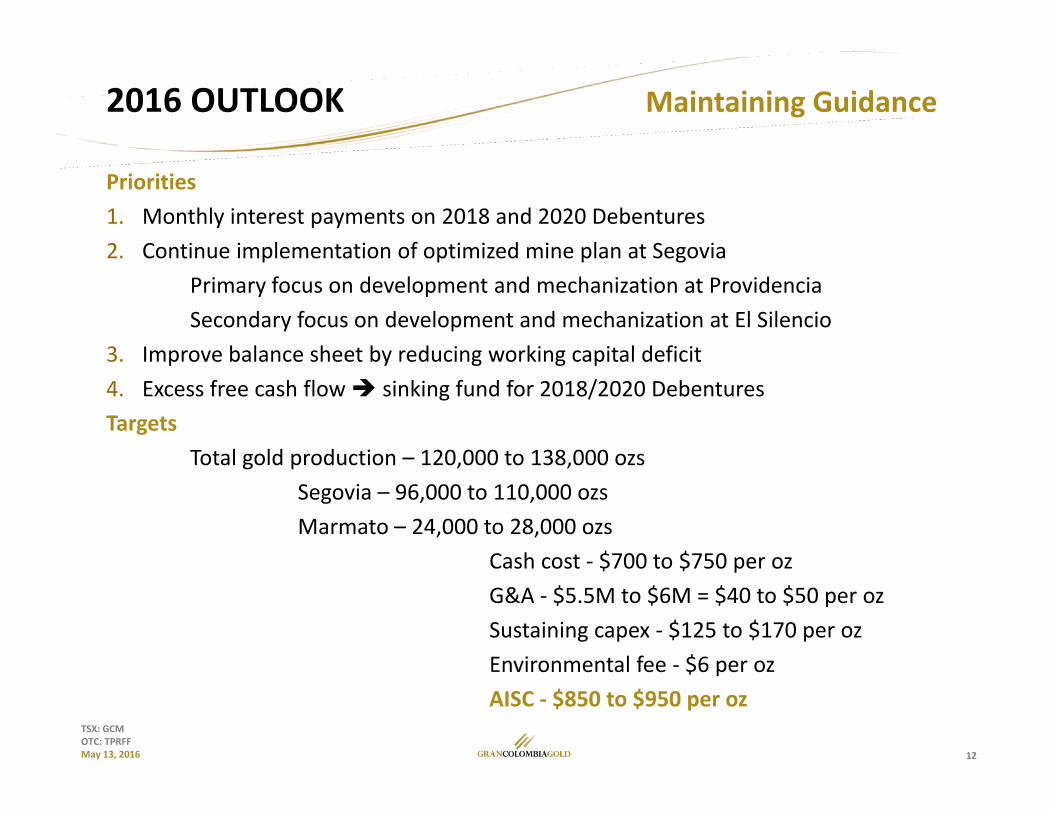
2016 OUTLOOK
Priorities1. Monthly interest payments on 2018 and 2020 Debentures2. Continue implementation of optimized mine plan at Segovia
Primary focus on development and mechanization at ProvidenciaSecondary focus on development and mechanization at El Silencio
3. Improve balance sheet by reducing working capital deficit4. Excess free cash flow sinking fund for 2018/2020 DebenturesTargets
Total gold production – 120,000 to 138,000 ozsSegovia – 96,000 to 110,000 ozsMarmato – 24,000 to 28,000 ozs
Cash cost ‐ $700 to $750 per ozG&A ‐ $5.5M to $6M = $40 to $50 per ozSustaining capex ‐ $125 to $170 per ozEnvironmental fee ‐ $6 per ozAISC ‐ $850 to $950 per oz
Maintaining Guidance
13
TSX: GCMOTC: TPRFFMay 13, 2016
Follow us on:
@GCMGold
![[Induction] sessão 2 gcm](https://static.fdocuments.in/doc/165x107/549a2526ac7959ff2d8b5a50/induction-sessao-2-gcm.jpg)