GCC Fixed Income Chart Book: FY 2017 Review - nbad.com · PDF file2011 2012 2013 2014 2015...
31
GCC Fixed Income Chart Book: FY 2017 Review 09 January 2018
Transcript of GCC Fixed Income Chart Book: FY 2017 Review - nbad.com · PDF file2011 2012 2013 2014 2015...

GCC Fixed Income Chart Book: FY 2017 Review
09 January 2018

2
Disclaimer
The information contained herein has been prepared by First Abu Dhabi Bank P.J.S.C (“FAB”). FAB relies on information
obtained from sources believed to be reliable but does not guarantee its accuracy or completeness.
This presentation has been prepared for information purposes only and is not and does not form part of any offer for sale
or solicitation of any offer to subscribe for or purchase or sell any securities nor shall it or any part of it form the basis of or
be relied on in connection with any contract or commitment whatsoever.
Some of the information in this presentation may contain projections or other forward-looking statements regarding future
events or the future financial performance of FAB. These forward-looking statements include all matters that are not
historical facts. The inclusion of such forward-looking information shall not be regarded as a representation by FAB or any
other person that the objectives or plans of FAB will be achieved. FAB undertakes no obligation to publicly update or
publicly revise any forward-looking statement, whether as a result of new information, future events or otherwise.

3
Foreword
Welcome to our FY 2017 chart book for the GCC fixed income market. The idea is very simple – to give those of you who
follow this market a quick snapshot of some of the key points in terms of the following:
➢ Primary Market issuance in 2017 and the new issue trend over the past eight years
➢ Deal dynamics and relative value analysis
➢ Secondary Market performance of key instruments (snapshot from 30th December 2016 to 29th December 2017)
We have deliberately made the report text-light in an attempt to make it easier to digest. Hopefully you will find it both
interesting and useful.
If you have any feedback on the report, or indeed would like to discuss any of the points highlighted, please do contact me.
Regards,
Chavan Bhogaita / Rakesh Sahu
Market Insights & Strategy
Global Markets, FAB
+971 2 6110 127
Please click here to view our recent publications on MENA and Global Markets
4
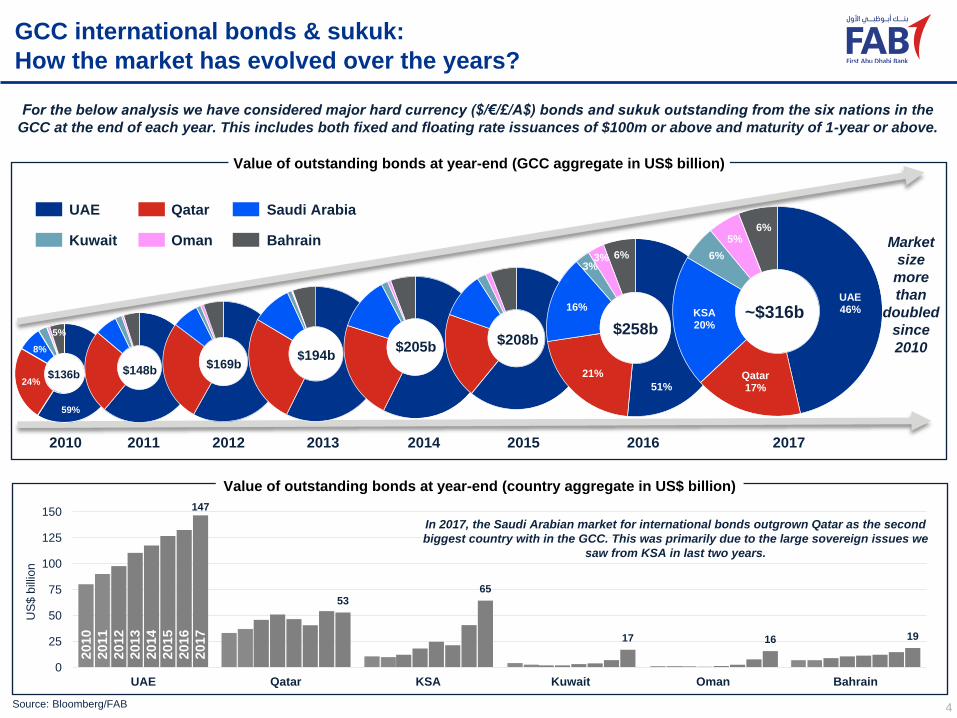
GCC international bonds & sukuk:
How the market has evolved over the years?
Source: Bloomberg/FAB
For the below analysis we have considered major hard currency ($/€/£/A$) bonds and sukuk outstanding from the six nations in the
GCC at the end of each year. This includes both fixed and floating rate issuances of $100m or above and maturity of 1-year or above.
Market
size
more
than
doubled
since
2010
59%
24%
8%
5%
51%
21%
16%
3%3% 6%
UAE46%
Qatar17%
KSA20%
6%
5%6%
UAE Qatar Saudi Arabia
Kuwait BahrainOman
2010
$136b
2011 2012 2013 2014 2015 2016 2017
$148b$169b
$194b$205b
$208b$258b
~$316b
Value of outstanding bonds at year-end (GCC aggregate in US$ billion)
147
5365
17 16 19
0
25
50
75
100
125
150
UAE Qatar KSA Kuwait Oman Bahrain
US
$ b
illio
n
20
10
20
11
20
12
20
13
20
14
20
15
20
16
20
17
In 2017, the Saudi Arabian market for international bonds outgrown Qatar as the second
biggest country with in the GCC. This was primarily due to the large sovereign issues we
saw from KSA in last two years.
Value of outstanding bonds at year-end (country aggregate in US$ billion)
5Source: Bloomberg/FAB
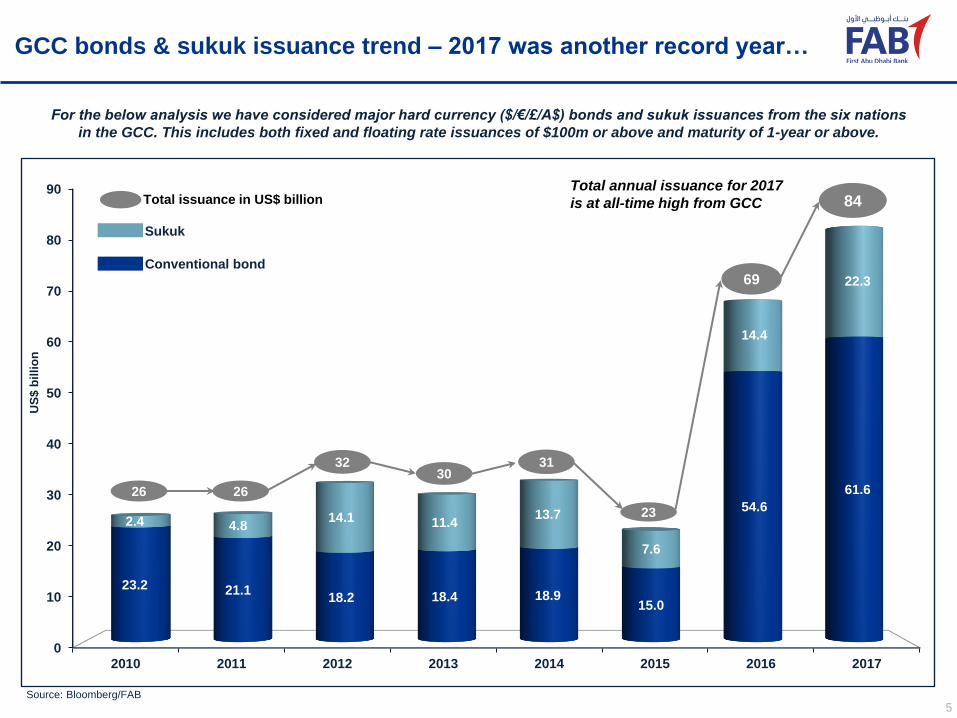
For the below analysis we have considered major hard currency ($/€/£/A$) bonds and sukuk issuances from the six nations
in the GCC. This includes both fixed and floating rate issuances of $100m or above and maturity of 1-year or above.
GCC bonds & sukuk issuance trend – 2017 was another record year…
0
10
20
30
40
50
60
70
80
90
2010 2011 2012 2013 2014 2015 2016 2017
23.2 21.118.2 18.4 18.9
15.0
54.6
61.6
2.4 4.814.1 11.4
13.7
7.6
14.4
22.3
Sukuk
Conventional bond
Total annual issuance for 2017
is at all-time high from GCC
26
84
26
3230
31
23
69
Total issuance in US$ billion
US
$ b
illi
on

6
Source: Bloomberg/FAB
…and witnessed highest amount of sovereign issuances in this market
GCC Sovereign issue trend
6.4 7.3 6.8
3.3 3.42.1
40.0
50.1
0
20
40
60
80
100
120
0
5
10
15
20
25
30
35
40
45
50
55
60
2010 2011 2012 2013 2014 2015 2016 2017
Sov bond issue in US$ bn (LHS)
Avg brent price in $/bbl (RHS)
Sov
as % of
total
GCC
issue
25% 28% 21% 11% 10% 9% 58% 60%
0 5 10 15 20 25 30 35 40 45 50 55
2016
2017Sov
issue
by
country
Kingdom of Saudi Arabia
Qatar
Kuwait Oman Abu DhabiBahrain
UAE ex AD
US$ bn

7
Sovereigns should continue to borrow in 2018, albeit at lower level
Source: IMF/Bloomberg/FAB
Economic growth across the GCC is expected to accelerate in 2018. Brent prices also stabilised near $60/bbl which should provide
some fiscal buffer. However, fiscal deficits still persist, although improving. Governments thus need to continue their borrowing.
-2.50%
-1.50%
-0.50%
0.50%
1.50%
2.50%
3.50%
4.50%
UAE KSA Qatar Kuwait Oman Bahrain GCC
2017 2018
Real GDP growth (IMF estimates)
0.05.0
10.015.020.025.030.035.040.045.050.055.060.065.070.075.080.085.090.095.0
100.0
UAE KSA Qatar Kuwait Oman Bahrain
2017 2018
Break-even Brent oil price in US$/barrel (IMF estimates)
-15.0%
-12.5%
-10.0%
-7.5%
-5.0%
-2.5%
0.0%
2.5%
UAE KSA Qatar Kuwait Oman Bahrain GCC
2017 2018
Govt. sector fiscal balance as % of GDP (IMF estimates)
-60.0%
-50.0%
-40.0%
-30.0%
-20.0%
-10.0%
0.0%
UAE KSA Qatar Kuwait Oman Bahrain GCC
2017 2018
Non-oil fiscal balance as % of GDP (IMF estimates)
2018 forecast, Bloomberg survey median ($58.00)
Current Brent price ($67.10)
Economies expected to
improve this year…
… but negative fiscal balances
still need debt funding
2017 average price ($54.75)

8
We expect corporate issuance to exceed sovereign issues in 2018
Corporate bond issuance could see an uptick this year and we back our rationale based on the following observations:
➢ Corporates & banks have a large refinancing need as some $60bn of loans and bonds maturing in 2018;
➢ They could seek to lock in the relatively low level of interest rates still available in international market as local rates are rising;
➢ They could capitalise on the demand from yield hungry international investors to diversify their sources of funding;
➢ And more importantly, GCC governments have now established US$ yield curves to provide pricing benchmark for issuers.
* Notes: International bonds & sukuk are the major hard currency ($/€/£/A$) deals from the GCC (fixed & floating; size >= $100m and tenor >= 1-year); Source: Bloomberg/FAB
0
20
40
60
80
100
120
140
160
180
200
2010 2011 2012 2013 2014 2015 2016 2017
5461
4655
66
94104
68
2626
3230
33
23
69
84
Debt issued by GCC entities (in US$ billion)
The loan and bond mix for GCC debt
capital market has shifted in last two years
and we expect this to continue in 2018
Loans International Bonds & Sukuk*
GCC 3-month interbank rates
0.90
1.10
1.30
1.50
1.70
1.90
2.10
2.30
2.50
2.70
2.90
0.90
1.10
1.30
1.50
1.70
1.90
2.10
2.30
2.50
2.70
2.90 KSA
UAE
Qatar
Kuwait
Oman
Bahrain
US$ Libor 3M
Rates have moved
higher by 10-30 bps

9
Global rates environment still accommodative for GCC issuers
Notes: * Rates are for 29-Dec-17; Source: Bloomberg/FAB;
We expect 2018 debt issuance from the GCC to remain
elevated, but lower than the record level we saw last year. We
think issuers would opt for longer duration, bearing in mind
the following factors:
➢ In Sep’17, the Fed lowered its expectation for long-term
interest rate from 3.0% to 2.75% and it remains unchanged
since. Furthermore, Fed still expects to raise rates at a
gradual pace and sees only three hikes in 2018.
➢ As a result, short-term rates have moved faster since
Sep’17 pushing the 5y-10y & 5y-30y spread to record lows.
➢ GCC issuers are increasingly diversifying their investor
base and allocating more to investors from US & Europe,
who usually bid for longer duration bonds for the yield.
1.00
1.25
1.50
1.75
2.00
2.25
2.50
2.75
3.00
3.25
2017 2018 2019 Longer Term
Implie
d F
ed F
unds T
arg
et
Rate
Year End Projection
Fed’s interest rate projection (FOMC Dots)
FOMC member dots
Dec'16 meeting median
Jun’17 meeting median
Dec'17 meeting median
(same as Sep’17)
Current Fed Funds Futures
implied interest rate*
Current OIS (overnight Index
Swap) implied interest rate*
Fed has lowered its
long-term rates
expectation
1.00
1.25
1.50
1.75
2.00
2.25
2.50
2.75
3.00
3.25
1.00
1.25
1.50
1.75
2.00
2.25
2.50
2.75
3.00
3.252Y: +69bps 5Y: +28bps 10Y: -4bps 30Y: -33bps
US treasury yields movement in 2017
Yield% Yield%
… Short-end yields
climbing fast on
Fed rate hikes…
Long-end yields remain
flattish on duration demand…
0
40
80
120
160
200
240
280
320
0
40
80
120
160
200
240
280
3205y30y
5y10y
Treasury yield spreads (in bps)
… As a result, treasury
yield spreads plunged
to record lows

10
And demand remain robust for primary issues from the GCC
0 5
10
15
20
25
30
35
KSA 2-tranche Sukuk (5y & 10y)
Kuwait 2-tranche (5y & 10y)
Oman 3-tranche (5, 10 & 30y)
Bahrain 3-tranche (7.5y sukuk, 12y & 30y)
Oman 7Y Sukuk
Mubadala 2-tranche (5y & 10y)
Inv. Corp. of Dubai 10Y Sukuk
Qatar Reinsurance Perp Bond
Equate Petrochemical 7Y Sukuk
National Bank Kuwait 5Y Bond
Omangrid 10Y Bond
QIB 5Y Sukuk
Dubai Islamic Bank 5Y Sukuk
Ahli Bank Qatar 5Y Bond
KIPCO 10Y Bond
Ezdan 5Y Sukuk
Majid Al Futtaim Perp Bond
Al Baraka Bank Perpetual Sukuk
FAB 5Y Green Bond
Gulf International Bank 5Y Bond
33.0
30.0
19.5
15.0
7.0
4.3
3.1
6.5
3.7
2.9
2.7
2.2
2.1
2.0
2.0
2.0
1.8
1.6
1.1
1.1
Amount in billion US$
Times oversubscribedOrderbookAmount issued
Source: Bloomberg/FAB
3.7x
3.9x
3.5x
2.9x
2.7x
2.9x
4.0x
2.1x
4.0x
3.6x
3.8x
5.0x
4.0x
2.4x
2.2x
3.9x
Fin
s &
Co
rp. B
on
ds
So
ve
reig
n/S
WF
Bo
nd
s
Some major primary deals of 2017
3.1x
14.4x
7.4x
3.9x

11Note: Credit ratings are in following order Moody’s/S&P/Fitch; NR is ‘not rated’; *For ADNOC Distribution & Emirates SembCorp the ratings are bond ratings; Source: Bloomberg/FAB
International appetite indeed appeared unscathed in recent deals…
…amid the startling political headlines that we witnessed from the region in the second half of 2017. Investor base for GCC deals are now well
diversified with more than 50% of the demand coming from outside the MENA region. The below deals are indeed a testimony to this.
0% 20% 40% 60% 80% 100%
KSA MENA
8%
Europe
26%
Asia
18%
US
48%
Abu Dhabi Sov (Aa2/AA/AA)
3-tranche deal in Oct
KSA Sov (A1/A-/A+)
3-tranche deal in Sep
ADNOC Distribution*
(NR/AA/AA) 2-tranche deal
in Oct
Emirates SembCorp*
(A2/A-/NR) deal in Nov
Emirates Reit (BB+)
deal in Dec
Oman’s Mazoon Electricity
(Baa2/NR/BBB-) deal in Oct
~$975m (2.4x)
$400m
~$2.1bn (5.3x)
$400m
~$5.0bn (10.0x)
$500m
~$11bn (3.6x)
$3.0bn
Orderbook (Oversubscription): ~$40bn (3.2x)
Deal size: $12.5bn
$30bn (3.0x)
$10bn
0% 20% 40% 60% 80% 100%
ADGB MENA
22%
Europe
29%
Asia
10%
US
39%
0% 20% 40% 60% 80% 100%
AND 5%37% 9%49%
0% 20% 40% 60% 80% 100%
ADGB0% 20% 40% 60% 80% 100%
Reit 54%15%31%
Geographic Distribution
0% 20% 40% 60% 80% 100%
Mazn 47%17%23%13%
0% 20% 40% 60% 80% 100%
Semb 3%26%29%12%

12
Regional geo-politics narrowed the GCC-EM spread in H2’2017
* Notes: Bloomberg/Barclays maintain the above indices on Bloomberg; BGCIOAS is the GCC US$ bond index & BEHGOAS is the EM IG US$ bond index; Source: Bloomberg/FAB
120
130
140
150
160
170
180
120
130
140
150
160
170
180
GCC US$ bond index* – Average credit rating ‘A’ Emerging Markets US$ Inv. Grade bond index* – Average credit rating ‘BBB+’
Qatar stand-off emerged
at the beginning on JuneSaudi anti-graft
crackdown begin
at the end of Oct,
followed by the
Lebanon crisis
Major trend we witnessed during June and November sell-off…
➢ The sell-off was primarily fast-money driven, while real-money was only
involved in the long-end (mostly 30yr papers), albeit at a very low volume
➢ Real-money from GCC and Asia bought on dips
➢ Regional banks support secondary market due to lack of primary allocation
Option a
dj. s
pre
ad (
OA
S)
in b
ps
Option a
dj. s
pre
ad (
OA
S)
in b
ps

13
GCC credits offer pick up vs Asia investment grade credits…
… even though aggregate credit quality of GCC bonds – at ‘A’ – is one notch higher than the aggregate
credit quality of Asian investment grade bonds.
* Notes: Bloomberg/Barclays maintain the above indices on Bloomberg; BGCIOAS is the GCC index & BAIGOAS is the Asia IG index; Source: Bloomberg/FAB
100
120
140
160
180
200
220
240
260
0
15
30
45
60
75
90
105
120
GCC US$ bond index* (RHS)
Avg. credit rating “A”
Asia US$ Inv. Grade bond index* (RHS)
Avg. credit rating “A-”Brent oil price per barrel (LHS)
Option a
dj. s
pre
ad (
OA
S)
in b
ps
US
$ p
er
barr
el
GCC credit spreads were inside
Asia inv. grade when oil was
trading around $60/barrel in 2015
Current GCC spreads, trading
outside Asia IG, indicate that markets
are pricing in the political risk and
not focusing on the fundamentals.
As a result we expect the GCC-Asia
spread to narrow in 2018 as:
1. Asia spreads are trading at the
tightest level; and
1. Investors would start focusing on
the credit fundamentals
14
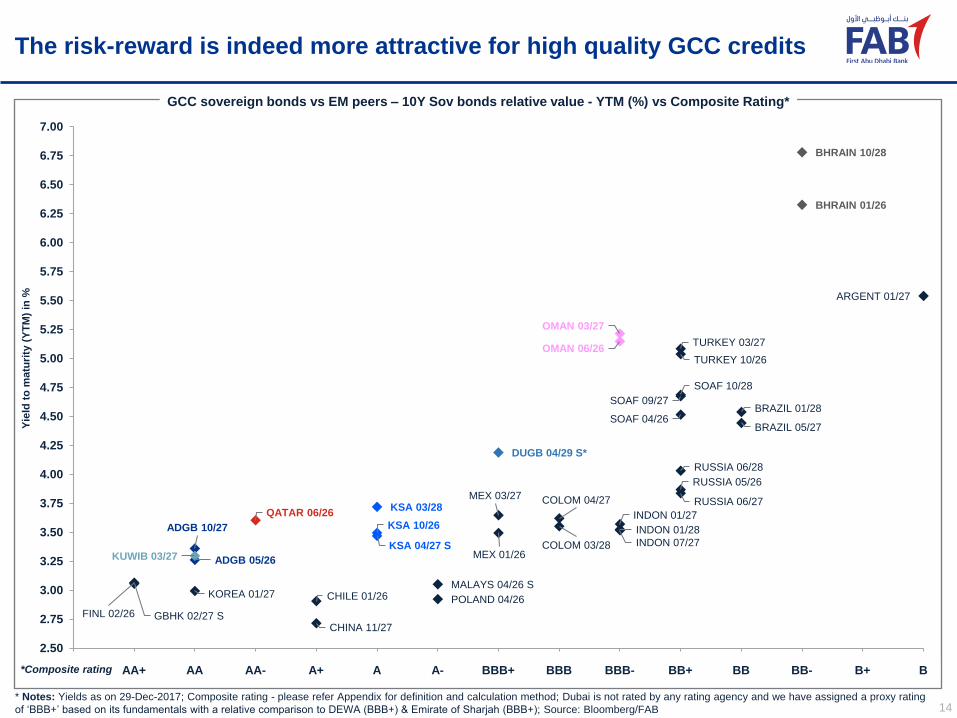
The risk-reward is indeed more attractive for high quality GCC credits
* Notes: Yields as on 29-Dec-2017; Composite rating - please refer Appendix for definition and calculation method; Dubai is not rated by any rating agency and we have assigned a proxy rating
of ‘BBB+’ based on its fundamentals with a relative comparison to DEWA (BBB+) & Emirate of Sharjah (BBB+); Source: Bloomberg/FAB
ADGB 05/26
ADGB 10/27
QATAR 06/26
KSA 10/26
KSA 04/27 S
KSA 03/28
KUWIB 03/27
DUGB 04/29 S*
OMAN 06/26
OMAN 03/27
BHRAIN 01/26
BHRAIN 10/28
MEX 01/26
MEX 03/27
CHILE 01/26MALAYS 04/26 S
CHINA 11/27
FINL 02/26
TURKEY 10/26
TURKEY 03/27
POLAND 04/26KOREA 01/27
INDON 01/27
INDON 07/27
INDON 01/28
SOAF 04/26
SOAF 09/27
SOAF 10/28
COLOM 04/27
COLOM 03/28
RUSSIA 05/26
RUSSIA 06/27
RUSSIA 06/28
BRAZIL 05/27
BRAZIL 01/28
GBHK 02/27 S
ARGENT 01/27
2.50
2.75
3.00
3.25
3.50
3.75
4.00
4.25
4.50
4.75
5.00
5.25
5.50
5.75
6.00
6.25
6.50
6.75
7.00
GCC sovereign bonds vs EM peers – 10Y Sov bonds relative value - YTM (%) vs Composite Rating*
AA+ AA AA- A+ A A- BBB BBB-BBB+ BB+ BB
Yie
ld t
o m
atu
rity
(Y
TM
) in
%
*Composite rating BB- B+ B

15
GCC sovereign bonds vs EM peers – 30Y relative value
30Y Sov bonds relative value - YTM (%) vs Composite Rating*
ADGB 10/47
DUGB 01/43*
QATAR 06/46
KSA 10/46
KSA 10/47
OMAN 03/47
BHRAIN 09/44
BHRAIN 09/47
MEX 01/47
MEX 02/48 KAZAKS 07/45
CHILE 06/47 MALAYS 04/46 S
COLOM 06/45
SOAF 10/46
SOAF 09/47
INDON 01/47
INDON 07/47
INDON 01/48
TURKEY 02/45
TURKEY 05/47
RUSSIA 09/43
RUSSIA 06/47
KOREA 06/44
BRAZIL 02/47
ARGENT 04/46
3.00
3.25
3.50
3.75
4.00
4.25
4.50
4.75
5.00
5.25
5.50
5.75
6.00
6.25
6.50
6.75
7.00
7.25
7.50
7.75
8.00
AA+ AA AA- A+ A A- BBB BBB-BBB+ BB+ BB
Yie
ld t
o m
atu
rity
(Y
TM
) in
%
*Composite rating BB- B+ B
* Notes: Yields as on 29-Dec-2017; Composite rating - please refer Appendix for definition and calculation method; Dubai is not rated by any rating agency and we have assigned a proxy rating
of ‘BBB+’ based on its fundamentals with a relative comparison to DEWA (BBB+) & Emirate of Sharjah (BBB+); Source: Bloomberg/FAB

16
Notes: * X-axis represents the composite rating (please refer Appendix for calculation method); Dubai is not rated by any rating agency and we have assigned a proxy rating of ‘BBB+’ based on
its fundamentals with a relative comparison to DEWA (BBB+) & Emirate of Sharjah (BBB+). The ratings have been arranged from higher to lower starting from ‘AA’, followed by ‘AA-’ and so on;
CDS levels are for 29-Dec-17 & in basis points; Source: Bloomberg/FAB
GCC sovereign credit ratings & CDS spreads versus peers
Bahrain
Turkey
Russia
Indonesia
India
Dubai*
SpainMalaysia
Italy
Poland
Kingdom of Saudi Arabia
China
Japan
South Korea
Abu Dhabi
Qatar
UKFranceAustria Belgium
Hong Kong
Kuwait
Brazil
0
20
40
60
80
100
120
140
160
180
200
220
240
260
280
CD
S (
bp
s)
The chart shows that Gulf sovereigns are rated favourably as
compared to many of their peers from the EMEA region.
AA+ AA AA- A+ A A-AAA BBB BBB-BBB+ BB+ BB BB-
Indeed Abu Dhabi and Kuwait have maintained their AA
ratings from all major rating agencies amid a persistent low oil
price environment. The ratings of these sovereigns underpin
the fact that they have substantial reserves and a range of
tools available to them to deal with the new normal of oil price
and other geo-political threats.

17Notes: Curves as on 29-Dec-2017; “S” in the ticker indicates that the bond is Islamic (sukuk); Source: Bloomberg/FAB
GCC sovereign curves
3.000
4.000
5.000
6.000
7.000
8.000
OMAN 3.875 03/22
BHRAIN 7.5 09/47
BHRAIN 6.125 07/22
BHRAIN 7 10/28
DUGB 6.45 05/22 S
DUGB 5.25 01/43OMAN 5.375 03/27
OMAN 6.5 03/47
2.500
2.750
3.000
3.250
3.500
3.750
4.000
4.250
4.500
4.750
5Y 10Y 30Y~5-year bonds ~10-year bonds ~30-year bonds
KUWIB 2.75 03/22
ADGB 2.5 10/22
QATAR 4.5 01/22
QATAR 4.625 06/46
KSA 2.894 04/22 S
KSA 4.625 10/47
ADGB 4.125 10/47
DUGB 5 04/29 S

18
GCC credit quality at a glance
Un
ite
d A
rab
Em
ira
tes
(U
AE
)
Em
ira
te o
f A
bu
Dh
ab
i
Ku
wa
it
Qa
tar
Kin
gd
om
of
Sa
ud
i A
rab
ia
Em
ira
te o
f R
as
Al-
Kh
aim
ah
Em
ira
te o
f S
ha
rja
h
Em
ira
te o
f D
ub
ai*
Su
ltan
ate
of
Om
an
Kin
gd
om
of
Bah
rain
3
4
5
6
7
8
9
10
11
12
13
14
15
Co
mp
os
ite
Ra
tin
g Mubad
ala
IPIC
TD
IC
Wa
ha
Ab
u D
ha
bi C
rud
e O
il P
ipe
lin
e
Qa
tari
Dia
r
Qa
tar
Pe
tro
leu
m
Eti
sa
lat
RA
SG
AS
Ind
us
trie
s Q
ata
r
Do
lph
in E
ne
rgy
QG
TS
(N
ak
ila
t)
SE
CO
SA
BIC
Eti
had
Oo
red
oo
(Q
tel)
Qa
tar
Rein
su
ran
ce
Sa
ud
i T
ele
co
m
Ta
qa
DE
WA
MA
F
DIF
C I
nve
stm
en
t
DP
Wo
rld
JA
FZ
Ald
ar
EQ
UA
TE
Pe
tro
ch
em
OM
GR
ID
Em
aa
r M
all
s G
rp
Ku
wa
it P
roje
cts
Co
Em
aa
r P
rop
Ma
zo
on
Ele
ctr
icit
y C
o
Du
ba
i In
v P
ark
Oil
an
d G
as
Ho
ldin
g
Ezd
an
Ho
ldin
g
Dam
ac
Inve
stc
orp
Mu
mta
lak
at
Bate
lco
Dar
Al
Ark
an
2
3
4
5
6
7
8
9
10
11
12
13
14
15
0 1 2 3 4 5 6 7 8 9 10111213141516171819202122232425262728293031323334353637383940
Co
mp
os
ite
Ra
tin
g
IsDB
FA
B
NB
K
QN
B
Al-
Hil
al
UN
B
Ind
Ba
nk
of
Ku
wa
it
Ku
wa
it In
tl B
an
k
AD
CB
AD
IB
Do
ha
Ba
nk
QIB
QII
B
Al
Ah
li B
an
k o
f K
uw
ait
KF
H
CB
K
Gu
lf B
an
k
INT
BO
Q
Intn
l B
an
k o
f Q
ata
r
Em
ira
tes
Is
lam
ic B
an
k
Ah
li B
an
k Q
SC
Bo
ub
ya
n b
an
k
CB
Q
Al
Kh
ali
j
NC
B
Sa
mb
a
Al
Ra
jhi
SA
BB
Riy
ad
Ba
nk
Du
ba
i Is
lam
ic B
an
k
No
or
Gu
lf In
v C
orp
Bu
rga
n B
an
k
Wa
rba
Ba
nk
Ma
sh
req
BS
F
Ara
b N
ati
on
al B
an
k
Sa
ud
i H
oll
an
di
Sa
ud
i In
v B
an
k
Gu
lf In
tl B
an
k
Co
m B
an
k o
f D
ub
ai
Ta
mw
ee
l
Ba
nk
of
Sh
arj
ah
Sh
arj
ah
Is
lam
ic B
an
k
RA
KB
AN
K
NB
F (
Fu
jair
ah
)
HS
BC
Ba
nk
Om
an
UA
B
Ah
li U
nit
ed
Ba
nk
Om
an
Ara
b B
an
k
Ba
nk
Mu
sc
at
NB
O
AB
C
Ba
nk
Dh
ofa
r
Ba
nk
So
ha
r
Ah
li B
an
k S
AO
G
Al
Ba
rak
a B
an
kin
g G
rou
p
NB
B
BB
K
GF
H
1
2
3
4
5
6
7
8
9
10
11
12
13
14
15
16
17
0 2 4 6 8 10 12 14 16 18 20 22 24 26 28 30 32 34 36 38 40 42 44 46 48 50 52 54 56 58 60
Co
mp
os
ite
Ra
tin
g
AA
AA-
A+
A
A-
BBB+
BBB
BBB-
BB+
BB
BB-
B+
AA+
B-
GCC Sovereigns GCC Corporates
AA+
AA
AA-
A+
A
A-
BBB+
BBB
BBB-
BB+
BB
BB-
B+
GCC Financials
AA+
AA
AA-
A+
A
A-
BBB+
BBB
BBB-
BB+
BB
AAA
BB-
B+
B
Notes: The ratings mentioned here are composite credit rating for each issuer. Please see appendix for the methodology of calculating composite credit rating; * Dubai is not rated by any rating agency and we
have assigned a proxy rating of ‘BBB+’ based on its fundamentals with a relative comparison to DEWA (BBB+) and Emirate of Sharjah (BBB+); Source: Bloomberg/FAB

19
GCC spread performance summary – FY 2017
Top 10 / bottom 10 bond/sukuk performers (z-spread, bps) in each category from 30th Dec 2016 to 29th Dec 2017
-80-70-60-50-40-30-20-1001020304050
+43
+24
+10
+8
+6
+5
-2
-3
-3
-5
-34
-36
-37
-39
-41
-45
-49
-59
-60
-77
Sovereigns
DUGB 43
DUGB 21 PUTA
DUGB 20
BHRAIN 22
DUGB 22 (S)
KSA 26
OMAN 22 *8/3/17
KSA 27 (S) *20/4/17
OMANGS 24 (S) *1/6/17
QATAR 30
KSA 23 *4/10/17
ADGB 47 *11/10/17
BHRAIN 29 *20/9/17
OMAN 26
BHRAIN 28
ADGB 27 *11/10/17
ADGB 22 *11/10/17
OMAN 47 *8/3/17
BHRAIN 47 *20/9/17
QATAR 23 (S)
-175-150-125-100-75-50-250255075100125
+98
+53
+44
+37
+32
+32
+16
+15
+8
-5
-79
-80
-81
-82
-91
-93
-131
-133
-142
-156
Financials
BGBKKK Jr Sub PERP
Nxt C: 30-09-2019
ALHILA (S) Jr Sub PERP
Nxt C: 30-06-2019
EBIUH Jr Sub PERP Nxt
C: 30-05-2019
AUBBI Jr Sub PERP Nxt
C: 29-04-2020
RAKBNK 19
DIBUH (S) Jr Sub PERP
Nxt C: 20-03-2019
EBIUH Jr Sub PERP Nxt
C: 17-09-2020
EBIUH 22 €
ADCBUH 23 Sub
NBOBOM Jr Sub PERP
Nxt C: 18-11-2020
QNBK 21
INTBOQ 20
QNBK 20
COMQAT 2.875 19
ABQKQD 21
ADCBUH Sub CALL Nxt C: 28-05-
2018
COMQAT 7.5 19
QIBKQD 22 (S) *23/5/17
QIBKQD 20 (S)
EBIUH Sub CALL Nxt C: 28-03-
2018
-250-200-150-100-50050100150200
+30
+0
-1
-3
-7
-9
-10
-10
-11
-13
-68
-68
-68
-69
-70
-72
-101
-129
-172
-213
Corporates
DAMACR 19 (S)
GMSEDU (S) Jr Sub
PERP Nxt C: 21-11-2018
DPWDU 37
JAFZSK 19 (S)
EMAAR 19 (S)
MAFUAE 19
ETISLT 19
ETISLT 21 €
INVCOR 20 (S)
KWIPKK 19
EMIRAT 25 SINK
QATIQD Sub PERP Nxt C: 13-
09-2022 *13/3/17
MUMTAK 21 (S)
OMGRID 27 *16/5/17
INTPET 41
KHDRWY 25 (S) SINK
OMGRID 25
KWIPKK 27 *23/2/17
ADNOUH 29 Sec *2/11/17
BATELC 20
Notes: (1) We have used a list of GCC public debt which are maturing in 2019 or beyond and for which FAB trading desk provides market price; (2) (S) in the ticker indicates Sukuk; (3) All
bonds/sukuks are $ denominated unless any other currency is highlighted in the ticker. (3) All bonds/sukuks are senior unsecured debt unless an abbreviation for the debt type is highlighted in the
ticker – e.g. – “Unsec” = Unsecured debt junior to Senior Unsecured debt; ; “Sub” = Subordinated; “Sr Sub” = Senior Subordinated; “Jr Sub” = Junior Subordinated; “Perp” = Perpetual; Callable,
Puttable and Sinkable highlighted as “Call”, “Puta”, & “Sink” respectively; (4) * highlights spread change from the 1st settlement date of the bond as it was issued in 2017; Source: FAB/Bloomberg

20
GCC’s major primary deals in 2017 and their performance
Secondary market performance since issue (change in z-spread and cash price since issue till 29-Dec-17)
ADNOUH 4.6 47 Sec SINK (10/10)
ESCWPC 4.45 35 Sec SINK (29/11)
ADGB 4.125 47 (2/10)
MUBAUH 3.75 29 (11/04)
FABUH 3 22 (27/03)
ADNOUH 3.65 29 Sec (26/10)
MUBAUH 3 24 (11/04)
ADGB 2.5 22 (2/10)
ADGB 3.125 27 (2/10)
INVCOR 5 27 (S) (25/01)
DAMACR 6.25 22 (S) (11/04)
MAFUAE 5.5 Jr Sub PERP NC5 (28/02)
BOSUH 4.23 22 (28/02)
DIBUH 3.664 22 (S) (7/02)
REITDU 5.125 22 (S) (5/12)
EBIUH 3.25 22 (7/11)
KUWIB 3.5 27 (13/03)
WARBAB 6.5 (S) Jr Sub PERP NC5 (7/03)
EQPCKW 3.944 24 (S) (13/02)
ALAHKW 3.5 22 (29/03)
KUWIB 2.75 22 (13/03)
KWIPKK 4.5 27 (16/02)
NTBKKK 2.75 22 (22/05)
KSA 4.625 47 (27/09)
INTLWT 5.95 39 Sec SINK (2/05)
KSA 3.628 27 (S) (12/04)
KSA 3.625 28 (27/09)
APICOR 3.141 22 (S) Unsec (25/10)
KSA 2.894 22 (S) (12/04)
ISDB 2.393 22 (S) (5/04)
KSA 2.875 23 (27/09)
ISDB 2.261 22 (S) (14/09)
DARALA 6.875 22 (S) (5/04)
OILGAS 7.5 27 (18/10)
OMAN 3.875 22 (1/03)
OMAN 3.875 22 (1/03)
MAZOON 5.2 27 (S) (23/10)
OMANGS 4.397 24 (S) (23/05)
OMGRID 5.196 27 (9/05)
BHRAIN 5.25 25 (S) (6/09)
BHRAIN 6.75 29 (6/09)
OMAN 6.5 47 (1/03)
GULINT 3.5 22 (18/01)
BHRAIN 7.5 47 (13/09)
QATIQD 4.95 Sub PERP NC5 (6/03)
BARKAB 7.875 (S) Sub PERP NC5 (23/05)
ABQKQD 3.5 22 (15/02)
QIBKQD 3.251 22 (S) (16/05)
ERESQD 4.875 22 (S) (29/03)
-100 -75 -50 -25 0 25 50 75 100 125 150 175 200
+196.0
+44.0
+19.1
-10.5
+143.5
+24.3
-2.5
-32.3
-28.8
-9.7
-35.6
-13.5
+10.5
-39.2
-11.6
-39.1
+90.0
-3.9
-5.1
-20.9
-20.6
-18.4
-17.2
-36.7
-42.7
-20.3
-17.7
-0.7
-26.2
-50.1
-49.0
-59.6
-29.8
-5.6
-7.7
-51.6
-59.5
-52.3
-99.4
-62.1
+5.9
+8.3
-13.3
+0.2
-14.5
-22.8
-2.7
-21.4
-23.9
-8.0 -7.0 -6.0 -5.0 -4.0 -3.0 -2.0 -1.0 0.0 1.0 2.0 3.0 4.0 5.0
-7.9
-2.9
-1.4
+0.7
-4.9
-4.2
-1.2
+0.5
+0.5
-0.5
+0.1
+0.3
+1.0
+1.3
+1.6
+2.6
-3.9
-1.1
-0.8
-0.7
-0.5
+0.1
+0.6
+1.3
+2.7
+3.2
-0.8
-0.2
+0.5
+1.1
+2.3
+2.5
+2.9
-0.3
+0.3
+1.2
+1.8
+2.3
+2.4
+4.5
-1.4
-1.3
-1.0
-0.7
0.0
+0.1
+0.2
+2.2
+2.9
Notes: (S) in the ticker indicates Sukuk; All bonds/sukuks are US$ senior unsecured debt of the issuer unless an abbreviation for the debt type is highlighted – e.g – “Unsec” = Unsecured debt; “Sub” =
Subordinated; “Sr Sub” = Senior Subordinated; “Jr Sub” = Junior Subordinated; “Perp” = Perpetual; Callable, Puttable and Sinkable highlighted as “Call”, “Puta”, & “Sink” respectively; Source: Bloomberg/FAB
Cash price change Bond/Sukuk (Pricing date in dd/mm) Z-spread change (in bps)*
Abu Dhabi
credits
UAE credits(Excluding Abu Dhabi)
Kuwait
credits
Saudi
credits
Oman
credits
Bahrain
credits
Qatar
credits

21
Sovereigns spread performance – Abu Dhabi
Notes: * Highlights spread change from the 1st settlement date of the bond as it was issued in 2017; Source: FAB/Bloomberg
AD
GB
19
AD
WA
20
SIN
K
AD
GB
21
AD
GB
22
*
11
/10
/17
AD
GB
26
AD
GB
27
*
11
/10
/17
AD
GB
47
*
11
/10
/17
-13
-26-18
+8
-10
+6
-3
0
15
30
45
60
75
90
105
120
135
150
165
180
z-s
pre
ad
(b
ps
)
MaturityLong
term
Short
term29-Dec-1730-Dec-16 Curve on 30-Dec-16 Curve on 29-Dec-17

22
Sovereigns spread performance – Kuwait
Notes: * Highlights spread change from the 1st settlement date of the bond as it was issued in 2017; Source: FAB/Bloomberg
KU
WIB
22
*2
0/3
/17
KU
WIB
27
*2
0/3
/17
-26
-30
40
50
60
70
80
90
100
110
120
130
z-s
pre
ad
(b
ps
)
MaturityLong
term
Short
term29-Dec-1730-Dec-16 Curve on 30-Dec-16 Curve on 29-Dec-17

23
Sovereigns spread performance – Qatar
QA
TAR
19
QA
TAR
20
QA
TDIA
20
QA
TAR
21
QA
TAR
22
QA
TAR
23
(S)
QA
TAR
26
QA
TAR
30
QA
TAR
40
QA
TAR
42
QA
TAR
46
+43
-22
-14
-21
-9
+43
-10
-34
-21-20
-19
0
20
40
60
80
100
120
140
160
180
200
220
z-s
pre
ad
(b
ps
)
Maturity
29-Dec-1730-Dec-16
Long
term
Short
term
Notes: If "Sukuk" the ticker contains "(S)" next to the maturity year; Source: FAB/Bloomberg
Curve on 30-Dec-16 Curve on 29-Dec-17

24
Sovereigns spread performance – Saudi Arabia
KSA
21
KSA
22
(S)
*
20
/4/1
7
KSA
23
*
4/1
0/1
7
KSA
26
KSA
27
(S)
*
20
/4/1
7
KSA
28
*
4/1
0/1
7
KSA
46
KSA
47
*
4/1
0/1
7
-26 -21
-5
-41-37
-17
-21-20
50
70
90
110
130
150
170
190
210
230
z-s
pre
ad
(b
ps
)
Maturity
Notes: * Highlights spread change from the 1st settlement date of the bond as it was issued in 2017; If "Sukuk" the ticker contains "(S)" next to the maturity year; Source: FAB/Bloomberg
Long
term
Short
term29-Dec-1730-Dec-16 Curve on 30-Dec-16 Curve on 29-Dec-17
25
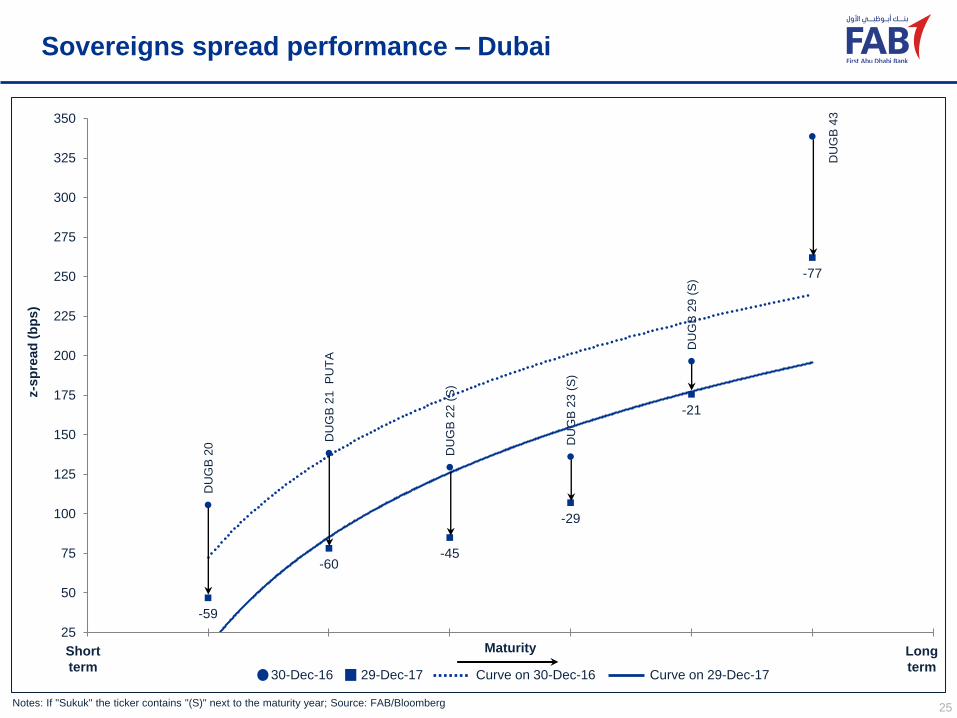
Sovereigns spread performance – Dubai
DU
GB
20
DU
GB
21
PU
TA
DU
GB
22 (
S)
DU
GB
23 (
S)
DU
GB
29 (
S)
DU
GB
43
-59
-60-45
-29
-21
-77
25
50
75
100
125
150
175
200
225
250
275
300
325
350
z-s
pre
ad
(b
ps
)
Maturity
29-Dec-1730-Dec-16
Long
term
Short
term
Notes: If "Sukuk" the ticker contains "(S)" next to the maturity year; Source: FAB/Bloomberg
Curve on 30-Dec-16 Curve on 29-Dec-17

26
Sovereigns spread performance – Sharjah
Notes: If "Sukuk" the ticker contains "(S)" next to the maturity year; Source: FAB/Bloomberg
SH
AR
SK
21
(S
)
SH
AR
SK
24
(S
)
-27
-19
60
70
80
90
100
110
120
z-s
pre
ad
(b
ps
)
MaturityLong
term
Short
term29-Dec-1730-Dec-16 Curve on 30-Dec-16 Curve on 29-Dec-17
27
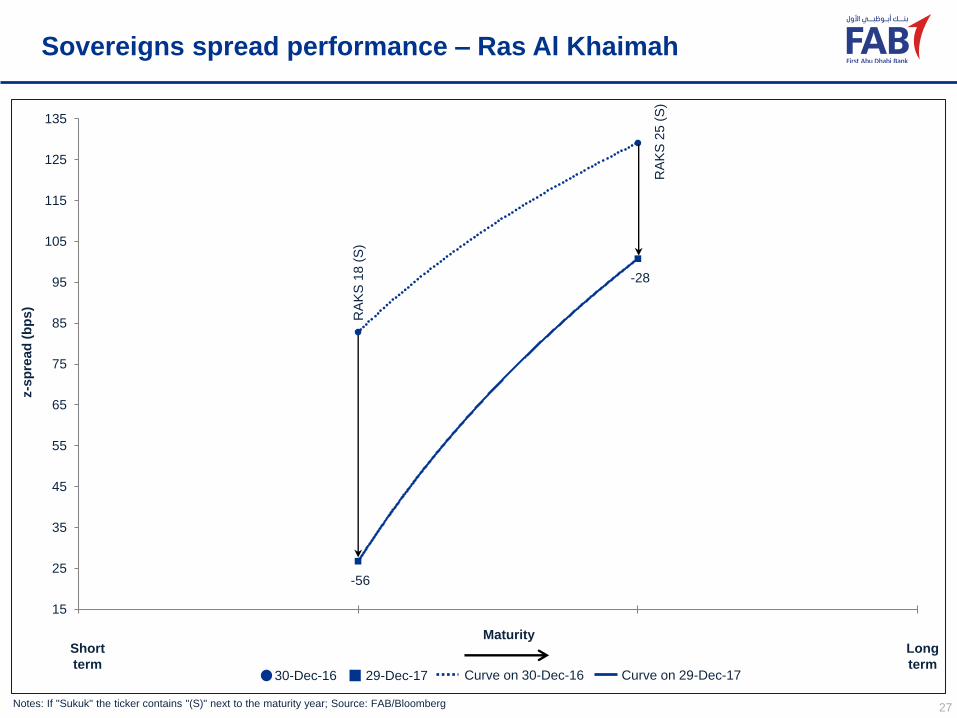
Sovereigns spread performance – Ras Al Khaimah
Notes: If "Sukuk" the ticker contains "(S)" next to the maturity year; Source: FAB/Bloomberg
RA
KS
18
(S
)
RA
KS
25
(S
)
-56
-28
15
25
35
45
55
65
75
85
95
105
115
125
135
z-s
pre
ad
(b
ps
)
MaturityLong
term
Short
term29-Dec-1730-Dec-16 Curve on 30-Dec-16 Curve on 29-Dec-17

28
Sovereigns spread performance – Oman
OM
AN
21
OM
AN
22
*
8/3
/17
OM
AN
GS
24
(S)
*1
/6/1
7
OM
AN
26
OM
AN
27
*
8/3
/17
OM
AN
47
*
8/3
/17
-32-39
-36
-2-12
+10
100
125
150
175
200
225
250
275
300
325
350
375
400
425
z-s
pre
ad
(b
ps
)
Maturity
29-Dec-1730-Dec-16
Long
term
Short
term
Notes: * Highlights spread change from the 1st settlement date of the bond as it was issued in 2017; If "Sukuk" the ticker contains "(S)" next to the maturity year; Source: FAB/Bloomberg
Curve on 30-Dec-16 Curve on 29-Dec-17

29
Sovereigns spread performance – Bahrain
BH
RA
IN 1
8 (
S) U
nse
c
BH
RA
IN 2
0 BH
RA
IN 2
1
BH
RA
IN 2
2
BH
RA
IN 2
3
BH
RA
IN 2
4 (
S)
BH
RA
IN 2
5 (
S) *
20
/9/1
7
BH
RA
IN 2
6
BH
RA
IN 2
8
BH
RA
IN 2
9 *
20
/9/1
7
BH
RA
IN 4
4
BH
RA
IN 4
7 *
20
/9/1
7
-28
-16
-33
-49
-20
-13 -32
-12
+5
-3
-28
+24
100
150
200
250
300
350
400
450
500
550
z-s
pre
ad
(b
ps
)
Maturity
29-Dec-1730-Dec-16
Long
term
Short
term
Notes: * Highlights spread change from the 1st settlement date of the bond as it was issued in 2017; If "Sukuk" the ticker contains "(S)" next to the maturity year; Source: FAB/Bloomberg
Curve on 30-Dec-16 Curve on 29-Dec-17

30
Appendix
Source: Bloomberg/FAB
➢ As mentioned in above slides, we have used “composite ratings” for the credit quality analysis – i.e. the average of the
ratings assigned by three leading rating agencies Moody’s, S&P and Fitch – in order to provide a more representative
view of the credit strength of each bank.
➢ The composite rating is calculated as follows:
• A score is assigned to the rating from each rating agency: AAA or equivalent being the best with a score of “1”,
followed by AA+ or equivalent as “2”, AA or equivalent as “3”, AA- or equivalent as “4” and so on;
• For example FAB is rated Aa3/AA-/AA- by Moody’s/S&P/Fitch. So the scores are 4/4/4;
• Hence the average of the scores is “4” which indicates a composite rating of “AA-” for FAB;
• In case the average score is not an absolute number – e.g. 4.33 (average of 4, 5, & 4 ) – the final score is derived by
rounding off the average score to the nearest whole number. In this case “4”.

Thank You
Contact:
Chavan Bhogaita / Rakesh Sahu
Market Insights & Strategy
Global Markets
First Abu Dhabi Bank
Tel: +971 2 6110 127
Market Insights & Strategy, FAB Global Markets
Please click here to view our recent publications
on MENA and Global Markets