GC-MS Studies on Methoxymethylene- Substituted ...
116
GC-MS Studies on Methoxymethylene- Substituted Phenethylamines Related to MDA, MDMA, MDEA and MDMMA by Yu Ning A thesis submitted to the Graduate Faculty of Auburn University in partial fulfillment of the requirements for the Degree of Master of Science Auburn, Alabama August 4 , 2012 Keywords: MDMA, GC-MS, Phenethylamine, Identification Copyright 2012 by Yu Ning Approved by C. Randall Clark, Chair, Professor of Pharmacal Sciences Jack DeRuiter, Professor of Pharmacal Sciences Forrest Smith, Associate Professor of Pharmacal Sciences Angela Calderón, Assistant Professor of Pharmacal Sciences
Transcript of GC-MS Studies on Methoxymethylene- Substituted ...

GC-MS Studies on Methoxymethylene- Substituted Phenethylamines
Related to MDA, MDMA, MDEA and MDMMA
by
Yu Ning
A thesis submitted to the Graduate Faculty of
Auburn University
in partial fulfillment of the
requirements for the Degree of
Master of Science
Auburn, Alabama
August 4 , 2012
Keywords: MDMA, GC-MS, Phenethylamine, Identification
Copyright 2012 by Yu Ning
Approved by
C. Randall Clark, Chair, Professor of Pharmacal Sciences
Jack DeRuiter, Professor of Pharmacal Sciences
Forrest Smith, Associate Professor of Pharmacal Sciences
Angela Calderón, Assistant Professor of Pharmacal Sciences
ii
Abstract
This thesis mainly focused on synthesis and analysis approaches of eight
methoxymethylene phenethylamine compounds associated with MDMA and MBDB
series structures. Gas chromatography- mass spectrometry (GC-MS) methods were used
to separate the target compounds and important intermediates with their homologues or
regioisomeric compounds. Gas chromatography- time of flight detector (GC-TOF) was
used for the exact mass analysis of characteristic MS fragments.
Unlike the ethoxy phenethylamines, the studied methoxymethylene phenethylamines
have a unique fragment of m/z 104 under EI mass spectrometry. Possible mechanism for
this m/z 104 fragment is proposed and supportive analytical studies were carried out in
this thesis. The eight target compounds are divided into two groups: 4-methoxymethylene
amphetamine series and 4-methoxymethylene butanamine series. Underivatized
compounds in each group were nicely separated by GC. Heptafluorobutyramide
derivatives of 6 derivatizable target compounds were synthesized, and the mass spectrum
of the each derivatized compound reveals unique structural information for identification
purposes.
Previous studies have revealed the structure-activity relationships and separation
approaches for direct, indirect regioisomerics and some isobarics related to MDMA.
Especially, the most recent study of MDMA related compounds reveals a unique
fragment m/z 107 generated by EI MS of ethoxy ring substituted phenethylamines. The

iii
proposed mechanism for the generation of the m/z 107 involves the engagement of
ethoxy oxygen, and we are interested to find out what will happen to this characteristic
m/z 107 fragment if the ester oxygen is moved one carbon away toward the side chain
end. Thus, is seems necessary to initiate a study of the methoxymethylene
phenethylamine series of compounds in order to be compared with the ethoxy
phenethylamine homologues, and to further complete the separation study of MDMA
with its regioisomeric and isobaric compounds.

iv
Acknowledgments
Lots of people both in the U.S.A and China have provided supports to me during the
preparation of this dissertation. I gratefully acknowledge all of them. In particular, I
would like to thank:
First of all, I would like to express my most sincere gratitude to my supervisor,
Professor Dr. Randall C. Clark for his patience and guidance. I am impressed by his
fundamental knowledge in chromatography and mass spectrometry and broad scientific
interests. All the knowledge he taught me is invaluable to me. With such a nice
personality, he behaves like a farther to me and makes me feel proud of my life. I greatly
appreciate that Dr. Jack Deruiter, Dr. Forrest Smith and Dr. Angela Calderon gave me
lots of supports in course works as well as experiments. I am grateful that Dr. Karim M.
Hafiz Abdel-Hay helped me do develop experimental skills, well-organized habits and
independent scientific research capability. His continuous encouragement makes me
confident and aspiring. I would also like to thank Auburn University and Chinese
Scholarship Council to financially support me to finish my course and research works in
the past three years.
In addition to all these people and institutions, I would like to appreciate Dr. Yani Wu
in the mass spectrum center in the chemistry department at Auburn University for his
sincere help. I would also like to express my sincere gratefulness to my family in China
for their love and bringing up, encouragement and the motive to finish this dissertation.

v
Table of Contents
Abstract .................................................................................................................................... ii
Acknowledgments ...................................................................................................................iv
List of Tables ...........................................................................................................................ix
List of Figures ........................................................................................................................... x
List of Abbreviations ............................................................................................................ xiv
1. Literature Review ............................................................................................................... 1
1.1 Introduction .................................................................................................................... 1
1.2 Pharmacology ................................................................................................................ 4
1.3 Negative effects ............................................................................................................. 4
1.4 Neurotoxicity ................................................................................................................. 5
1.5 Metabolism .................................................................................................................... 6
1.6 Analytical methods used to identify and separate phenyethylamine regioisomers
and isobarics related to MDMA, MDA and MDEA ................................................... 6
1.6.1 Analytical studies of direct regioisomers of MDMA ...................................... 9
1.6.2 Analytical studies of indirect regioisomers of MDMA ................................. 11
1.6.3 Analytical studies of methoxymethyl ring substitutive compounds related to
MDMA ...................................................................................................................... 12
1.6.4 Analytical studies of ethoxy ring substitutive compounds related to MDMA15
1.7 Statement of research purposes .................................................................................. 16
2. Synthesis of regioisomeric and isobaric methoxymethylene substituted
phenethylamines ............................................................................................................... 20
2.1 Synthesis of 4-methoxymethylene benzaldehyde ..................................................... 22

vi
2.2 Synthesis of 4-methoxymethylene phenylacetone and 4-methoxymethylene
phenyl-2-butanone ....................................................................................................... 23
2.3 Synthesis of 4-methoxymethylene phenethylamines (Compound 1-8) ................... 27
2.4 Synthesis of 4-methoxymethylene benzaldehyde and 4-methoxymethylene phenyl
acetone with methoxy methyl group labeled with deuterium ................................... 30
2.4.1 Synthesis of deuterium labeled 4-methoxymethylene benzaldehyde........... 30
2.4.2 Synthesis of 4-methoxymethylene phenylacetone with methoxy methyl
group labeled with deuterium .................................................................................. 32
3. Analytical studies on the methoxymethylene- substituted phenethylamines related to
MDA, MDMA, MDEA and MDMMA and their related intermediates ....................... 34
3.1 Analytical studies on the comparison of synthesis intermediate 4-
methoxymethylene benzaldehyde with its regioisomeric compound 4-
ethoxymethylene benzaldehyde .................................................................................. 36
3.1.1 Gas chromatography separation of 4- methoxymethylene benzaldehyde and
4- ethoxy benzaldehyde ........................................................................................... 36
3.1.2 Mass spectra studies of 4- methoxymethylene benzaldehyde and 4- ethoxy
benzaldehyde ............................................................................................................ 37
3.1.3 GC-TOF analysis of 4-methoxymethylene benzaldehyde on certain
characteristic fragments ........................................................................................... 40
3.1.4 GC-TOF analysis on 4-ethoxy benzaldehyde m/z 121 fragment .................. 42
3.1.5 GC-MS studies on isotopic labeled 4-methoxymethylene benzaldehyde .... 45
3.2 Analytical studies on the comparison of synthesis intermediate 4-
methoxymethylene phenylacetone with its homologue 4-methoxymethylene
phenyl-2-butanone ....................................................................................................... 47
3.2.1 Gas chromatography separation of 4- methoxymethylene phenylacetone
and 4- methoxymethylene phenyl-2-butanone ....................................................... 47
3.2.2 Mass spectra studies of 4- methoxymethylene phenylacetone and 4-
methoxymethylene phenyl-2-butanone ................................................................... 49
3.2.3 GC-TOF analysis on 4-methoxymethylene phenylacetone .......................... 51
3.2.4 GC-MS studies on isotopic labeled 4-methoxymethylene phenylacetone... 54
3.2.5 Analytical studies comparing 4-methoxymethylene phenylacetone with its
regioisomer 4-ethoxy phenylacetone ...................................................................... 56

vii
3.2.6 GC-TOF analysis on 4-ethoxy phenylacetone ............................................... 59
3.3 GC-MS studies of the 4-methoxymethylene amphetamine series compounds ....... 62
3.3.1 GC separation of the 4-methoxymethylene amphetamine series compounds62
3.3.2 Mass spectra studies of the 4-methoxymethylene amphetamine series ....... 63
3.4 GC-MS studies of the 4-methoxymethylene butanamine series compounds .......... 67
3.4.1 GC separation of the 4-methoxymethylene butanamine series compounds 67
3.4.2 Mass spectra studies of the 4-methoxymethylene butanamine series
compounds ................................................................................................................ 69
3.5 GC-MS analysis on HFBA derivatized 4-methoxymethylene phenethylamines:
compound 1-3 and 5-7 ................................................................................................ 72
3.5.1 GC separation of the HFBA derivatized 4-methoxymethylene amphetamine
series and 4-methoxymethylene butanamine series ............................................... 72
3.5.2 Mass spectra studies of the HFBA derivatized 4-methoxymethylene
amphetamine series and 4-methoxymethylene butanamine series ........................ 74
4. Experimental..................................................................................................................... 81
4.1 Materials, Instruments, GC-Columns and Temperature Programs .......................... 81
4.1.1 Materials ........................................................................................................... 81
4.1.2 Instruments ....................................................................................................... 82
4.1.3 GC-Columns .................................................................................................... 82
4.1.4 Temperature Programs .................................................................................... 83
4.2 Synthesis of 4-methoxymethylene benzaldehyde ..................................................... 84
4.3 Synthesis of 4-methoxymethylene benzyl aldehyde ................................................. 85
4.4 Synthesis of 4-methoxymethylene phenylacetone .................................................... 86
4.4.1 Synthesis of 4-methoxymethylene phenyl 2-nitropropene ........................... 86
4.4.2 Synthesis of 4-methoxymethylene phenylacetone ........................................ 86
4.5 Synthesis of the 4-methoxymethylene amphetamine series compounds ................. 87
4.5.1 Synthesis of 4-methoxymethylene amphetamine .......................................... 87

viii
4.5.2 Synthesis of 4-methoxymethylene methamphetamine .................................. 88
4.5.3 Synthesis of 4-methoxymethylene ethylamphetamine .................................. 88
4.5.4 Synthesis of 4-methoxymethylene dimethylamphetamine ........................... 89
4.6 Synthesis of 4-methoxymethylene phenyl-2-butanone ............................................. 90
4.6.1 Synthesis of 4-methoxymethylene phenyl 2-nitrobutene .............................. 90
4.6.2 Synthesis of 4-methoxymethylene phenyl-2-butanone ................................. 90
4.7 Synthesis of the 4-methoxymethylene butanamine series compounds .................... 91
4.7.1 Synthesis of 4-methoxymethylene butanamine ............................................. 91
4.7.2 Synthesis of 4-methoxymethylene N-methyl butanamine ............................ 92
4.7.3 Synthesis of 4-methoxymethylene N-ethyl butanamine ............................... 92
4.7.4 Synthesis of 4-methoxymethylene N, N-dimethyl butanamine .................... 93
4.8 Synthesis of deuterium labeled 4-methoxymethylene benzyl aldehyde .................. 94
4.8.1 Synthesis of deuterium labeled methyl 4-methoxymethyl benzoate ............ 94
4.8.2 Synthesis of deuterium labeled 4-methoxymethyl benzyl alcohol ............... 94
4.8.3 Synthesis of deuterium labeled 4-methoxymethylene benzyl aldehyde ...... 95
4.8.4 Synthesis of deuterium labeled 4-methoxymethylene benzaldehyde........... 95
4.8.5 Synthesis of deuterium labeled 4-methoxymethylene phenylacetone ......... 96
4.8.6 Synthesis of HFBA derivatized 4-methoxymethylene phenethylamines
compound 1-3 and 5-7 ............................................................................................. 97
5. References......................................................................................................................... 98

ix
List of Tables
Table 1 TOF data on m/z 121 fragment of 4-methoxymethylene benzaldehyde................41
Table 2 TOF data on m/z 135 fragment of 4-methoxymethylene benzaldehyde................42
Table 3 TOF data on m/z 121 fragment of 4-ethoxy benzaldehyde ....................................43
Table 4 TOF data on m/z 104 fragment of 4-methoxymethylene phenylacetone ..............52
Table 5 GC study results of 4- methoxymethylene phenylacetone and 4- ethoxy
phenylacetone under column Rtx-1 and Rtx-5 Sil .........................................................57
Table 6 TOF data on m/z 107 fragment of 4-ethoxy phenylacetone ...................................60
Table 7 List of GC-Columns and their stationary phase composition ................................83

x
List of Figures
Figure 1 Structures of methylenedioxyphenethylamine controlled drugs MDA, MDMA
and MDEA ..........................................................................................................................1
Figure 2 Regioisomeric side chains patterns yielding m/z 58 cation in the 3, 4-
methylenedioxy methamphetamine series ........................................................................7
Figure 3 Ion structures of regioisomeric m/z 58 generated by side chain regioisomers of
MDMA under EI mass spectrometry ................................................................................8
Figure 4 Regioisomeric and isobaric compound structures of MDMA ................................9
Figure 5 Structures of the five side chain regioisomeric phenethylamines ........................10
Figure 6 Structures of the ten direct regioisomers related to MDMA ................................11
Figure 7 Methoxymethcathinone and MDMA structures separated by Belal T. et al., 2009
...........................................................................................................................................12
Figure 8 Methoxy methyl methamphetamines structures studied by Awad T., DeRuiter J.
and Clark C.R., 2007 ........................................................................................................14
Figure 9 Structures of ethoxy ring substituted isobarics related to MDMA studied by
Belal T. et al., 2009 ..........................................................................................................15
Figure 10 Mechanism of mass spectral fragment m/z 107 cation generated by ethoxy
phenethylamines ...............................................................................................................16
Figure 11 Major fragment ions for ring substituted methamphetamines ............................17
Figure 12 Compound structures involved in this thesis .......................................................19
Figure 13 Structures of the eight target compounds studied in the research ......................21
Figure 14 Synthesis procedures for 4-methoxymethylene benzaldehyde...........................23
Figure 15 Synthesis of 4-methoxymethylene phenylacetone and 4-methoxymethylene
phenyl-2-butanone............................................................................................................24
Figure 16 Mechanisms for imine formation from an aldehyde and a primary amine ........25

xi
Figure 17 Nitroalkene formation mechanism .......................................................................25
Figure 18 Reaction outline of nitroaldol reaction.................................................................26
Figure 19 Reaction scheme of reductive hydrolysis of nitroalkenes ..................................27
Figure 20 Synthesis of compound 1-4 starting from 4-methoxymethylene phenylacetone
...........................................................................................................................................28
Figure 21 Mechanism of reductive amination that yields compound 1-4 ..........................29
Figure 22 Synthesis of compound 5-8 starting from 4-methoxymethylene phenyl-2-
butanone ............................................................................................................................30
Figure 23 The synthesis procedure for deuterium labeled 4-methoxymethylene
benzaldehyde ....................................................................................................................31
Figure 24 The synthesis procedure for deuterium labeled 4-methoxymethylene
phenylacetone ...................................................................................................................33
Figure 25 Gas chromatography separation of (1): 4- methoxymethylene benzaldehyde
and (2): 4- ethoxy benzaldehyde on column Rtx-1 ........................................................37
Figure 26 EI Mass spectra of (A) 4- methoxymethylene benzaldehyde and (B) 4- ethoxy
benzaldehyde ....................................................................................................................38
Figure 27 Mass spectrum fragmentation pattern of 4- methoxymethylene benzaldehyde 39
Figure 28 TOF mass spectra of 4-methoxymethylene benzaldehyde .................................40
Figure 29 TOF mass spectra of 4-ethoxy benzaldehyde ......................................................43
Figure 30 The generation of m/z 121 fragments of 4-methoxymethylene benzaldehyde
and 4-ethoxy benzaldehyde under EI mass spectrometry suggested by TOF studies .44
Figure 31 Gas chromatography of isotopic labeled 4-methoxymethylene benzaldehyde.
Column: Rtx-35 ................................................................................................................46
Figure 32 EI mass spectra of isotopic D3-methyl labeled 4-methoxymethylene
benzaldehyde ....................................................................................................................46
Figure 33 Gas chromatography separation of (1): 4- methoxymethylene phenylacetone
and (2): 4- methoxymethylene phenyl-2-butanone on column Rtx-5 Sil .....................48
Figure 34 EI Mass spectra of 4- methoxymethylene phenylacetone and 4-
methoxymethylene phenyl-2-butanone...........................................................................50
Figure 35 TOF mass spectra of 4-methoxymethylene phenylacetone ................................51

xii
Figure 36 Possible mechanisms for the formation of mass 104 fragment ..........................53
Figure 37 Gas chromatography of isotopic labeled 4-methoxymethylene phenylacetone.
Column: Rxi-50 ................................................................................................................54
Figure 38 EI mass spectra of isotopic labeled 4-methoxymethylene phenylacetone .........55
Figure 39 EI mass spectra of 4- methoxymethylene phenylacetone and 4- ethoxy
phenylacetone ...................................................................................................................58
Figure 40 TOF mass spectra of 4-ethoxy phenylacetone .....................................................60
Figure 41 Possible mechanisms for the formation of mass 107 piece ................................61
Figure 42 Gas chromatography separation of (1) 4-methoxymethylene amphetamine (2)
4-methoxymethylene methamphetamine (3) N-ethyl-4-methoxymethylene
amphetamine (4) N, N-dimethyl-4-methoxymethylene amphetamine on an Rtx-1
column...............................................................................................................................63
Figure 43 EI mass spectra of the 4-methoxymethylene amphetamine series .....................65
Figure 44 Base peak fragment structures of the 4-methoxymethylene amphetamine series
under EI mass spectrometry ............................................................................................66
Figure 45 Mechanism proposed for the generation of m/z 44 fragment of 4-
methoxymethylene N-ethylamphetamine under mass spectrometry ............................67
Figure 46 Gas chromatography separation of (1) 4-methoxymethylene 2-butanamine (2)
4-methoxymethylene N-methyl 2-butanamine (3) 4-methoxymethylene N-ethyl 2-
butanamine on columns Rxi-50 .......................................................................................68
Figure 47 Mass spectra of the 4-methoxymethylene butanamine series compounds ........70
Figure 48 Base peak fragment structures of the 4-methoxymethylene butanamine series
compounds under EI mass spectrometry ........................................................................71
Figure 49 GC separation of the HFBA derivatized 4-methoxymethylene amphetamine
series: HFBA derivatized compound 1, 2 and 3 on an Rtx-5 amine column ...............73
Figure 50 GC separation of the HFBA derivatized 4-methoxymethylene butanamine
series: compound 5, 6 and 7 on an Rtx-5 amine column ...............................................74
Figure 51 Mass spectra of the HFBA derivatives of compounds 1-3 .................................75
Figure 52 Formation of m/z 240, m/z 254, m/z 268 and m/z 282 fragments from
perfluoroacyl derivatives of compound 1-3 and compound 5-7 ...................................77

xiii
Figure 53 Formation of m/z 162 from perfluoroacyl derivative of 4-methoxymethylene
amphetamine series and m/z 176 from perfluoroacyl derivative of 4-
methoxymethylene butanamine series ............................................................................77
Figure 54 Formation of m/z 210 fragments from m/z 254 of N-methyl compound 2 and
m/z 268 of N-methyl compound 6 ...................................................................................78
Figure 55 Mass spectra of the HFBA derivatives of compounds 5-7 .................................79
xiv
List of Abbreviations
°C Degree centigrade
5-HT Serotonin
ACh Acetylcholine
COMT Catechol-O-methyltransferase
CSA Controlled Substances Act
DA Dopamine
DEA Drug Enforcement Administration
EI Electronic ionization
eV Electron volt
GC Gas chromatography
GC- TOF Gas chromatography- time of flight detector
GC-IRD Gas chromatography coupled to infrared detection
GC-MS Gas chromatography– mass spectrometry
HFBA Heptafluorobutyramide
HHA Dihydroxyamphetamine
HHMA Dihydroxymethamphetamine
HMA 4-hydroxy-3-methoxy-amphetamine
HMMA 4-hydroxy-3-methoxy methamphetamine
M Mole per liter
xv
MDA Methylenedioxyamphetamine
MDEA Methylenedioxy ethylamphetamine
MDMA Methylenedioxyphenethylamine
MDMMA Methylenedioxy-N,N-dimethylamphetamine
min Minute
mL Milliliter
mm Millimeter
mmol Micro Mole
NA Noradrenaline
PCC Pyridinium chlorochromate
PFPA Pentafluoropropionamide
ppm Part per million
Red Al Sodium bis(2-methoxyethoxy) aluminum hydride
μL Micro liter
μm Micro meter
1
1. Literature Review
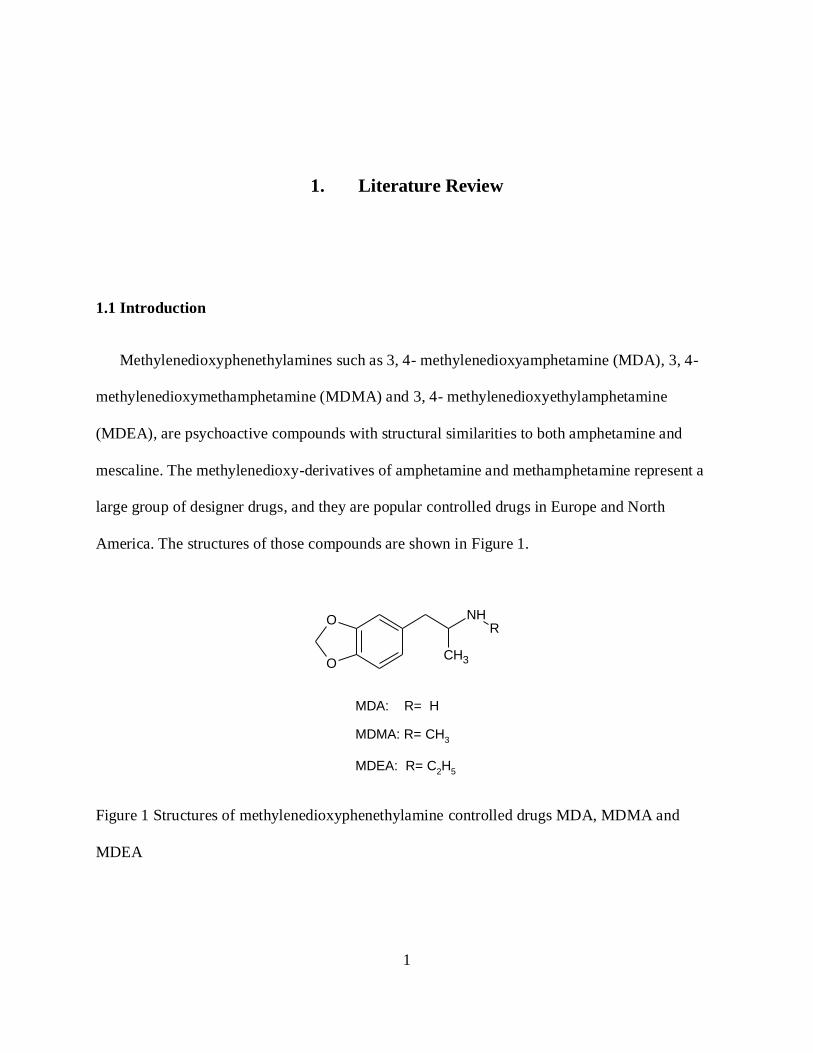
1.1 Introduction
Methylenedioxyphenethylamines such as 3, 4- methylenedioxyamphetamine (MDA), 3, 4-
methylenedioxymethamphetamine (MDMA) and 3, 4- methylenedioxyethylamphetamine
(MDEA), are psychoactive compounds with structural similarities to both amphetamine and
mescaline. The methylenedioxy-derivatives of amphetamine and methamphetamine represent a
large group of designer drugs, and they are popular controlled drugs in Europe and North
America. The structures of those compounds are shown in Figure 1.
O
O
NH
CH3
R
MDA: R= H
MDMA: R= CH3
MDEA: R= C2H
5
Figure 1 Structures of methylenedioxyphenethylamine controlled drugs MDA, MDMA and
MDEA

2
MDMA is the most commonly used derivative of this series and is known by the street names
“Ecstasy” or “XTC”. It has both stimulant and hallucinogenic effects in humans and has become
one of the major drugs of abuse in recent times. On the street, people call it the “party pill”. It
was not an illegal drug until 1985, when it’s addictive nature of causing hallucination and being
neurotoxic was widely discussed. MDMA was moved to the Schedule I controlled drug list by
the drug enforcement administration (DEA) of U.S. in 1986 (Lawn, J.C. 1986).
The most common way to administer MDMA is orally, usually in tablet or capsule form, and
its effects last approximately four to six hours. Users of the drug say that it produces profoundly
positive feelings, empathy for others, elimination of anxiety, and extreme relaxation.
The goal of clandestine manufacturers is to prepare substances with pharmacological profiles
that are sought after by the user population. Clandestine manufacturers are also driven by the
desire to create substances that fall outside national and/or international control regimes in order
to circumvent existing laws and to avoid prosecution. In the USA this has resulted in legislation
(Controlled Substances Analog Act) to upgrade the penalties associated with clandestine use of
all of these compounds. In Europe, because of the substance-by-substance scheduling method,
the appearance of new substances cannot be immediately considered as illicit drugs. This offers
room for clandestine experimentation into individual substances within a class of drugs with
similar pharmacological profiles. This phenomenon is not only used to bypass the legal
regulations but to produce even more potent substances from non-controlled precursors. This has
created the continued designer-drug exploration and especially within the MDA series. Thus,
identification of new designer drug derivatives is essential and a highly challenging task for
forensic laboratories.

3
MDA, which is a derivative of phenethylamines, has similar pharmacological effects as
MDMA. MDA was first synthesized by Mannich and Jacobsohn in 1910 (Mannich and
Jacobsohn, 1910). It did not become a popular drug until 1960s and was put on the Schedule I
list by the enforcement of Controlled Substances Act (CSA) in 1970s (The green list, 2003).
MDMA was first synthesized by Merck Company, which filed a patent for MDMA in
German in 1912. The synthetic procedure for the production of MDMA was first published by
Yakugaku Zasshi as a part of antispasmodics research program (Yutaka Kasuya, 1985). Around
1970s, Alexander Shulgin and his colleges studied MDMA’s pharmacological effects on human
beings, which were first published in 1978. Alexander Shulgin himself, who has been called “the
father of MDMA”, described the effect of MDMA as bringing “altered state of consciousness
with emotional and sensual overtones” to users (Shulgin and Nichols, 1978). Since then and until
its schedule I control, MDMA’s usage as a psychotherapy drug was adopted by many scientists
in Europe and North America.
MDEA is another popular phenethylamine derivative used on the street and now a controlled
drug. MDEA has very similar effects in humans as MDMA requiring a slightly higher dosage.
Given the high popularity of MDMA and MDA over decades, clandestine labs have every
incentive to search for another similar structure which will generate similar pharmacological
effects as an analogue or substitution for those two drugs. In 1993, MDEA’s drug effects were
reported by Tehan and his colleges (Tehan et al., 1993).
The phenethylamine drugs are still among the most popular drugs of abuse today, especially
MDMA. Clandestine labs have continued to search for a substitution for MDMA in order to
avoid the legal control on this specific molecule. It is very important to work on analytical

4
methods especially identification and discrimination procedures for the phenethylamine related
structures to provide reliable and solid data/evidence for forensic use.
1.2 Pharmacology
MDA, MDMA and MDEA have all been reported to produce very similar central and
peripheral effects in humans differing only in potency, time of onset and duration of action.
Studies have reported that MDMA is a potent releaser of serotonin (5-HT), dopamine (DA),
noradrenaline (NA) and acetylcholine (ACh). More importantly, MDMA can act as a 5-HT
uptake inhibitor. The combined “unique behavioral effects of MDMA” results in an increase of
extracellular monoamine concentration (Cole J.C and Sumnall H.R, 2003). Although MDMA’s
structure is similar to amphetamine, studies reported that they have different pharmacological
paths. Unlike amphetamine, which achieves its effect via dopamine (DA) release, drug users
experience a new state of consciousness complied with altered mood and reinforced perception
of emotions due to high extracellular 5-HT and DA level (Maldonado E. and Navarro J.F, 2000).
Clinic reports show panic attacks, depression, flashbacks and psychosis, indicating MDMA’s
effect of changing neurotransmitter level inside the brain is not a temporary effect (White S.R. et
al., 1996). Lab animal studies show that after the last injection of MDMA, changes in 5-HT and
DA neurotransmission in the central nervous system (i.e. brain) will last as long as two weeks.
The study suggested that frequent users of MDMA are likely to experience relatively more
harmful effects (White S.R. et al., 1996).
1.3 Negative effects
Although MDMA was put on schedule I controlled list by DEA in 1986, it is still widely
used. Some researchers and clinician believe that the ban on MDMA was only based on animal

5
studies. The following few years, many studies focused on MDMA’s effects on human beings
and were carried out all over the world.
It was reported the immediate physical and psychological effects attributed to MDMA use by
humans include (Richard S.C., 1995): euphoria, increased energy, sexual arousal, paranoia,
anxiety, depression, papillary dilation, bruxism, lower back pain, and nausea. Long term residual
effects attributed to MDMA use in humans include (Richard S.C., 1995): depersonalization,
insomnia, depression, flashbacks, lower back pain, neck hyper tonicity, joint stiffness, acne/skin
rash, frequent headaches, and frequent stomach cramps.
Other common effects that have been reported are trismus and vomiting in recreational users
(Greer and Toibert, 1986); hallucination and papillary dilation (Brown and Osterloh, 1987).
Other long lasting residual effects reported are blurred vision and muscle hyper tonicity (Hayner
and Mc Kinney, 1986).
1.4 Neurotoxicity
Until early this century, the mechanism of MDMA’s neurotoxicity in humans had not been
directly demonstrated and proven. It is believed the mechanism is related to oxidative stress,
hyperthermia and increased extracellular concentration of dopamine (Sanchez et al., 2001).
Further studies revealed that MDMA’s neurotoxicity is related to MDMA’s ability to reduce the
uptake of both synaptosomal and vesicular serotonin and dopamine depending on the dosage,
while glutamate and γ-aminobutyric acid (GABA) uptake process remains unaffected (Bogen et
al., 2003). The serotonergic neurotoxicity is the most accepted mechanism to explain and predict
MDMA’s long lasting negative effects on the neurosystem. Yet, the answer to the concern over
6
how the animal toxicity study results relate to the human condition is still not clear (Lyles J. and
Cadet J. L., 2003).
1.5 Metabolism
The metabolism of MDMA involves two major processes: O-demethylation generates the
major metabolite 3, 4-dihydroxymethamphetamine (HHMA); while N-demethylation generates
methylenedioxyamphetamine (MDA). Further O-demethylation of MDA results in 3, 4-
dihydroxyamphetamine (HHA). Metabolism of HHMA and HHA by catechol-O-
methyltransferase (COMT) will generate 4-hydroxy-3-methoxy methamphetamine (HMMA) and
4-hydroxy-3-methoxy-amphetamine (HMA) respectively (Lyles J. and Cadet J. L., 2003). The
formation of HHA and HHMA did not produce neurotoxicity (McKenna D. J. and Peroutka S. J.,
1990). The HHMA is metabolized to quinone-like structures which were thought to contribute to
MDMA’s neurotoxicity (Hiramatsu M. et al., 1990).
1.6 Analytical methods used to identify and separate phenyethylamine regioisomers and
isobarics related to MDMA, MDA and MDEA
Regioisomeric relationships are the result of different positions of attachment of functional
groups in compounds that possess the same molecular formula (elemental composition). Isobaric
substances are of the same nominal mass but different elemental compositions. There are mainly
three types of regioisomeric and isobaric compounds of MDMA: (1) direct regioisomers of
MDMA include side chain and methylenedioxy substitution pattern; (2) indirect regioisomers
include methoxymethcathinones; and (3) isobaric substances include four major types of
substitution patterns which are (i) methoxymethyl ring substitution patterns; (ii) ethoxy ring
7
substitution pattern; (iii) methoxy group on the ring and methyl group on the side chain pattern;
and (iv) methoxymethylene ring substitution pattern.
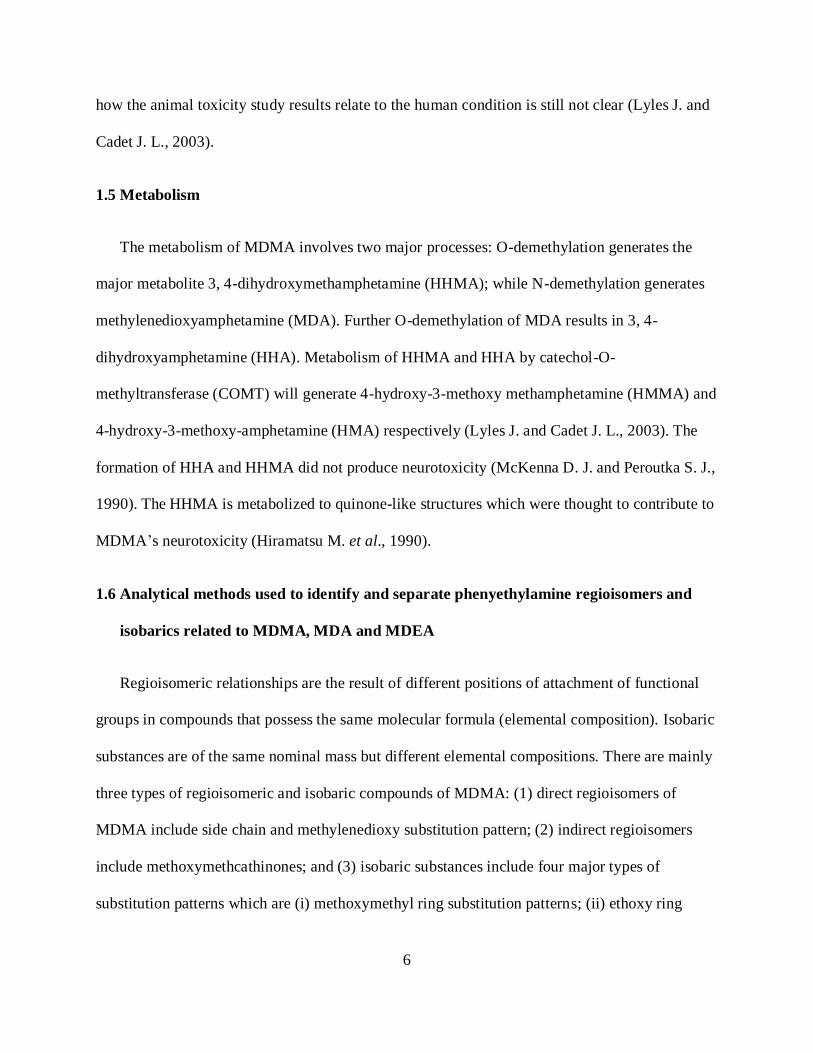
The direct regioisomers include five arrangement possibilities of the side chain all yielding
an m/z 58 cation fragment in their EI mass spectrum, shown in Figure 2. Those 5 regioisomeric
structures will all yield the base peak m/z 58 under mass spectrometry; the structures of those m/z
58 peaks are shown in Figure 3.
O
O
NH CH3
CH3H
3,4-Methylenedioxy Methamphetamine
C 11H15NO2, MW=193
O
O
NH2
CH3CH3
3,4-Methylenedioxy Phentemine
C11H15NO2, MW=193
O
O
NH2
C2H5
3,4-Methylenedioxy1-Phenyl-2-aminobutane
C11H15NO2, MW=193
O
O
NH C2H5
3,4-Methylenedioxy N-Ethylphenethylamine
C11H15NO2, MW=193
O
O
N
CH3
CH3
3,4-Methylenedioxy N,N-Dimethylphenethylamine
C11H15NO2, MW=193
Figure 2 Regioisomeric side chains patterns yielding m/z 58 cation in the 3, 4-methylenedioxy
methamphetamine series

8
C N
C N C N
C N C N
H
CH3
H
H
CH3
CH3
H
HH
CH2CH3
HH
H
H3C
H3C
H3C
H
HCH3CH2
H
m/z=58, C4H8N+
Figure 3 Ion structures of regioisomeric m/z 58 generated by side chain regioisomers of MDMA
under EI mass spectrometry
With the mass 58 side chain arrangement possibilities abbreviated as 58, the regioisomeric
and isobaric compound structures related to MDMA discussed above are shown in Figure 4. The
first structure shows direct regioisomers of MDMA, with 10 possible different compounds; the
second structure shows indirect regioisomers of MDMA, with 15 possible different compounds;
and the last four structures stands for the four most likely types of isobaric compounds related to
MDMA, with a total of 95 possible different compounds. Thus the total number of compounds
represented by the general structures in Figure 4 is 120 compounds of nominal molecular weight
193 and an EI base peak of m/z 58.

9
O
O
58
H3C
H3CO
58
EtO
58 58
H3CO
H3CO
58
O
H3CO
58
H3C
1 2 3
4 5 6
Figure 4 Regioisomeric and isobaric compound structures of MDMA
Among the 120 regioisomeric and isobaric compounds related to MDMA, previous studies
show identification and separation analytical procedures on direct regioisomer methylenedioxy
phenethylamines, indirect regioisomer methoxymethcathinones, and isobaric substances such as
methoxymethyl ring and side chain substitutive phenethylamine as well as ethoxy ring
substitutive phenethylamine isobarics. The first published study used mass spectrometry to
separate 3, 4-MDMA from other phenethylamines in 1988 by Noggle et al. Following studies
mainly focused on GC-MS separations of derivatized phenethylamines in order to overcome the
limitation of EI mass spectrometry. GC-IRD analysis on derivatized or underivatized
phenethylamines is another widely discussed topic studied by many forensic scientists.
1.6.1 Analytical studies of direct regioisomers of MDMA
Effects of the side chain on compounds was studied by the separation of methamphetamine
and it’s four other regioisomers (Figure 5) in 2009 (Awad T. et al., 2009). The studied five mass
equivalent compounds have the same molecular weight of 149 with a base peak of m/z 58 under
EI mass spectrometry.

10
NH2
H3C CH3
Phentermine
C10H15N, MW=149
Methamphetamine
C10H15N, MW=149
NH
H CH3
CH3
NH2
1-Phenyl-2-aminobutane
C10H15N, MW=149
N
N,N-Dimethylphenethylamine
C10H15N, MW=149
NH
N-Ethylphenethylamine
C10H15N, MW=149
C2H5
CH3
CH3
C2H5
Figure 5 Structures of the five side chain regioisomeric phenethylamines
The study reported that trifluoroacetyl derivatives of the primary and secondary amines yield
unique fragment ions for identification purposes. The underivatized compounds can be nicely
separated by gas chromatography and show unique vapor phase IR spectra.
The ten direct regioisomers of MDMA generated from side chain and methylenedioxy
substitution patterns shown in Figure 6 were reported being separated by GC, the ultimate
separation results were obtained using the polar stationary phase DB-35 MS (Laura A., et al,
2004).
Those 10 compounds were also separated by the study of their perfluoroacyl derivatives
under GC-MS. After being converted into their perfluoroacyl derivatives, the ten direct
regioisomers of MDMA show elution differences under GC using nonpolar stationary phases,
such as Rtx-1 and Rtx-5. The results of mass spectra of these ten compounds are significantly
individualized, thus specific side-chain identification is possible based on unique fragment ions
(Awad T., DeRuiter J. and Clark C. R., 2005). Previous studies also show that the
perfluoroacylated 3, 4-MDMA will yield some specific fragments that can be specifically

11
identified (Belal T. et al., 2009). The compound structures reported being separated are shown in
Figure 6.
Figure 6 Structures of the ten direct regioisomers related to MDMA
1.6.2 Analytical studies of indirect regioisomers of MDMA
The separation of three methoxymethcathinones (with the same side chain arrangement
pattern as MDMA) from 3, 4-MDMA and 2, 3-MDMA was reported by Belal T. et al in 2009.
The structures being separated are shown in Figure 7. While mass spectrometry is unable to
differentiate methoxymethcathinones from 3, 4-MDMA and 2, 3-MDMA since they are of mass
spectra equivalence (both methoxymethcathinones and MDMA have molecular weight at 193
and the only significant fragments of those compounds under mass spectrometry are the m/z 58
and m/z 135 or 136 ions), the study adopted GC-IRD and successfully separated target

12
compounds. The methoxymethcathinones can be identified without chemical derivatization
based on the fact that the carbonyl group of methoxymethcathinones shows unique infrared
absorption bands in the 1690-1700 cm-1
range. Moreover, the study also indicates that the three
methoxymethcathinones can also be separated from 3, 4-MDMA and 2, 3-MDMA by GC using
Rxi-50 as a stationary phase (Belal T. et al., 2009).
O
NHCH3
CH3OCH3
O
NHCH3
CH3
OCH3
O
NHCH3
CH3H3CO
O
O NHCH3
CH3
NHCH3
CH3
O
O
2-Methoxymethcathinone 3-Methoxymethcathinone
4-Methoxymethcathinone
2,3-MDMA 3,4-MDMA
Figure 7 Methoxymethcathinone and MDMA structures separated by Belal T. et al., 2009
1.6.3 Analytical studies of methoxymethyl ring substitutive compounds related to MDMA
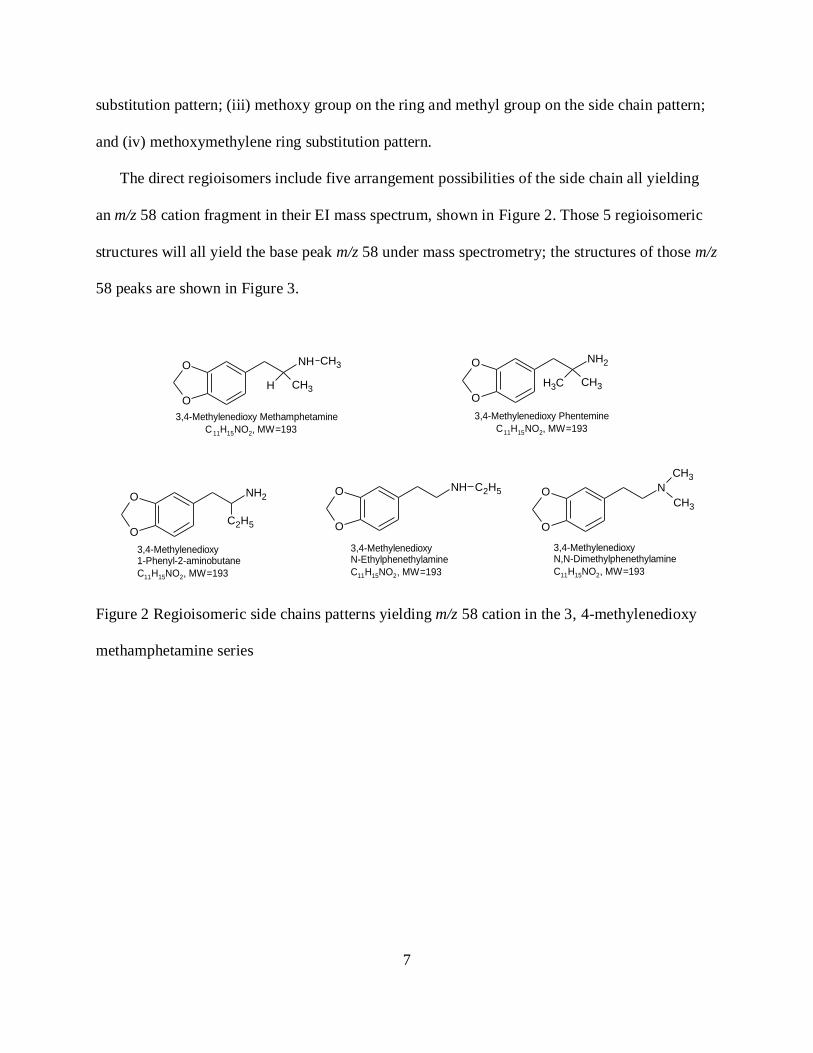
Among the fifty methoxy methyl ring substituted isobarics related to MDMA, the most
thoroughly studied group of compounds are the methoxy methyl methamphetamines, which have
the same side chain arrangement pattern as MDMA and also have the mass spectra equivalent to

13
MDMA (both methoxy methyl methamphetamines and MDMA have molecular weight at 193
and the only significant fragments of those compounds under mass spectrometry are the m/z 58
and m/z 135 or 136 ions). A previous study showed that perfluoroacyl derivatives, such as
pentafluoropropionamides (PFPA) and heptafluorobutyramides (HFBA), of methoxy methyl
methamphetamines with methoxy group at 2- or 4- position will yield unique ions under mass
spectrometry and can be identified from related MDMA. It is also reported that methoxy methyl
methamphetamines can be successfully separated from 2, 3-MDMA and 3, 4-MDMA in the
PFPA and HFBA derivative forms by GC with non-polar stationary phases (Awad T., DeRuiter
J. and Clark C.R., 2007). Structures studied are shown in Figure 8 .
Further studies of 3-methoxy-4methyl- and 4-methoxy-3methyl-phenethylamines show the
results that trifluoroacetyl derivatives provide unique fragment ions for identification purposes.
These derivatives also show excellent resolution on GC with a non-polar stationary phase, such
as Rtx-1 (Belal T. et al., 2008).
14
Figure 8 Methoxy methyl methamphetamines structures studied by Awad T., DeRuiter J. and
Clark C.R., 2007

15
1.6.4 Analytical studies of ethoxy ring substitutive compounds related to MDMA
GC-IRD used to separate ethoxy ring substituted isobarics related to MDMA from 3, 4-
MDMA and 2, 3-MDMA was reported (Belal T. et al., 2009). It was also reported that capillary
GC using the stationary phase Rxi-50 will give satisfactory separation between the side chain
regioisomers and the ethoxy substituted methamphetamines.
Figure 9 Structures of ethoxy ring substituted isobarics related to MDMA studied by Belal T. et
al., 2009
Abdullah M. A. et al. reported a unique m/z 107 cation generated by perfluroacyl derivatives
of the ring substituted ethoxy methamphetamines under EI mass spectrometry (Al-Hossaini A.
M. et al., 2010). The existence of the m/z 107 fragment is an indicator of the ethoxy

16
phenethylamine structure. A proposed mechanism of this unique m/z 107 fragment is shown in
Figure 10.
Figure 10 Mechanism of mass spectral fragment m/z 107 cation generated by ethoxy
phenethylamines
This proposed mechanism yielding the m/z 107 fragment involves the ethoxy oxygen. It is
necessary to find out what if the ethoxy group is substituted with regioisomeric
methoxymethylene group and the key oxygen is one more carbon away? In order to answer this
question, this thesis is based on a study of a series of compounds with the methoxymethylene
ring substitution pattern.
1.7 Statement of research purposes
As mentioned in the previous discussion, the three major types of regioisomeric and isobaric
compounds, a total 120 different structures (shown in Figure 4), are of mass spectra equivalence
and not identifiable under mass spectrometry alone. They all have the same molecular weight
193, the only significant fragments of those compounds under mass spectrometry are the m/z 58
and m/z 135 or 136 ions. Figure 11 shows the major fragment ions of some regioisomeric ring

17
substituted methamphetamines under EI mass spectrometry. Since the majority of forensic labs
use MS information as the predominant data set for identification purposes, it is a huge challenge
for them to identify controlled ring substituted methamphetamines from uncontrolled
regioisomers or isobarics with a similar structure.
CH3
NHCH3 O
O CH3
NHCH3
CH3
NHCH3
O
OCH3 OCH3
CH3
CH3 CH NH CH3
m/z58
MDMA, MW=193 Methoxymethcathinones MW=193
Methoxy-methyl-methamphetaminesMW=193
C8H7O2
m/z135
CH3
OCH3
CH2 O
O
CH2
OCH3
O
m/z135
C8H7O2 C9H11O
m/z135
Figure 11 Major fragment ions for ring substituted methamphetamines
Previous studies discussed earlier show that the MDMA separation/identification hardship
generated by the existence of the possibility of direct regioisomer phenethylamines, indirect
regioisomer methoxymethcathinones, and methoxymethyl ring substitutive phenethylamine
isobarics and ethoxy ring substituted phenethylamine isobarics have been successfully solved by
the adoption of acylation, perfluoroacyl derivatives and GC-IRD. Now it is necessary to study
the properties of methylene methoxy ring substitutive phenethylamine isobarics and establish
identification approaches for them from MDMA; there are several reasons for this:
1) Successful identification approaches for methylene methoxy ring substituted
phenethylamine isobarics from MDMA will contribute another portion to the file of

18
identification of MDMA from its mass spectra equivalent structures. This is essential for
a complete set of data on the forensic chemistry of these compounds.
2) For structural analysis purposes, it is meaningful to find out how will the
methoxymethylene oxygen affect compounds’ fragmentation pattern under mass
spectrometry compare to ethoxy ring substituted phenethylamines.
3) It is also useful to study how the methoxymethylene oxygen will affect the fragmentation
pattern of the synthetic intermediates, such as benzaldehyde and phenylacetone, under
mass spectrometry compare to those synthesis intermediates of ethoxy ring substituted
phenethylamines.
This thesis is mainly focused on eight compounds related to MDMA and MBDB series. The
structures of the target compounds in this study are shown in Figure 12 .
This thesis will focus on the following goals:
1) Chemical synthesis of the eight methoxymethylene substituted phenethylamines related
to MDMA, MDA and MDEA.
2) Create analytical profiles for each compound and some of the related intermediates using
the following analytical techniques: GC-MS and GC-TOF.
3) Design isotope labeling and regioisomer comparison procedures to confirm or rationalize
fragment ion structures under mass spectrometry.
4) Establish effective separation approaches of the eight methoxymethylene substituted
phenethylamines; document the unique GC-MS analytical information for each
compound.

19
O
NH2
4-Methoxymethylene Amphetamine
4-Methoxymethylene amphetamine series
O
HN
4-Methoxymethylene Methamphetamine
O
HN
4-Methoxymethylene N-Ethylamphetamine
O
N
4-Methoxymethylene N,N-Dimethylamphetamine
4-Methoxymethylene Butanamine series
O
NH2
O
HN
O
HN
O
N
4-Methoxymethylene 2-Butanamine 4-Methoxymethylene N-methyl 2-Butanamine
4-Methoxymethylene N-ethyl 2-Butanamine4-Methoxymethylene N,N-dimethyl 2-Butanamine
Figure 12 Compound structures involved in this thesis

20
2. Synthesis of regioisomeric and isobaric methoxymethylene substituted
phenethylamines
3, 4-Methylenedioxymethamphetamine (3, 4-MDMA) is a schedule I controlled drug
according to the U.S. Drug Enforcement Administration (DEA). Forensic scientists must
specifically identify 3, 4-MDMA in forensic evidence in legal matters including drug issues.
This level of identification standard includes the elimination of possible regioisomeric and
isobaric compounds as interfering substances. Methylenedioxyamphetamine (MDA),
methylenedioxymethamphetamine (MDMA) series, methylenedioxyethylamphetamine (MDEA)
and methylenedioxy-N,N-dimethylamphetamine (MDMMA) series of compounds and their
regioisomers and isobarics create extreme difficulties for the discrimination of 3, 4-MDMA.
Those compounds will yield similar gas chromatography-mass spectrum results as that for 3, 4-
MDMA. This research mainly focuses on eight methoxymethylene substituted phenethylamines
related to MDA, MDMA, MDEA and MDMMA. These eight compounds include four of the 4-
methoxymethylene amphetamine series: 4-methoxymethylene amphetamine, 4-
methoxymethylene methamphetamine, 4-methoxymethylene ethylamphetamine and 4-
methoxymethylene dimethylamphetamine, and four of 4-methoxymethylene butanamine series:
4-methoxymethylene butanamine, 4-methoxymethylene N-methyl butanamine, 4-
methoxymethylene N-ethyl butanamine and 4-methoxymethylene N, N-dimethyl butanamine.
The structures of those eight compounds are shown in Figure 13.

21
O
NH2
4-Methoxymethylene Amphetamine
4-Methoxymethylene amphetamine series
O
HN
4-Methoxymethylene Methamphetamine
O
HN
4-Methoxymethylene N-Ethylamphetamine
O
N
4-Methoxymethylene N,N-Dimethylamphetamine
4-Methoxymethylene Butanamine series
O
NH2
O
HN
O
HN
O
N
4-Methoxymethylene 2-Butanamine 4-Methoxymethylene N-methyl 2-Butanamine
4-Methoxymethylene N-ethyl 2-Butanamine4-Methoxymethylene N,N-dimethyl 2-Butanamine
Figure 13 Structures of the eight target compounds studied in the research
Studying analytical characteristics of these eight compounds is critical because they are
expected to share similar cleavage patterns to MDA, MDMA, MDEA and MDMMA compounds
under EI mass spectral conditions. Previous studies show that the two most significant peaks the

22
MDA compounds will yield under mass spectrum are m/z 44 and m/z 135, the MDMA
compounds will yield under mass spectrum m/z 58 and m/z 135, MDEA and the MDMMA
compounds will yield under mass spectrum m/z 72 and m/z 135. There are two model compounds
that serve as comparison points for this project. The first are the MDA-type compounds and the
target methoxymethyl compounds have an isobaric relationship to the MDA compounds. The
second set of model compounds for comparison are the ethoxy substituted phenethylamines and
the methoxymethyl series are regioisomeric based on the position of the oxygen in the side chain
group. In this study each of the eight target regioisomeric or isobaric compounds related to
MDA, MDMA, MDEA and MDMMA were synthesized in order to study their analytical
properties and find an efficient approach to differentiate them from the model compounds. In this
chapter, synthetic approaches of these eight compounds are described, while their analytical
properties and separation results are discussed later in this thesis.
2.1 Synthesis of 4-methoxymethylene benzaldehyde
4-Methoxymethylene benzaldehyde is a key intermediate in this project. It is the central
precursor substance for the synthesis of all the target compounds.
Commercially available 4-chloromethylbenzoyl chloride was treated with methanol and solid
sodium metal as catalyst to yield methyl 4-methoxymethyl benzoate. Based on our experience
with this reaction, the methyl ester formed by methanol displacement of the chloride of the acid
chloride functionally occurs just by dissolving the substrate material in methanol. Thus the
intermediate 4-chloromethyl substituted methylbenzoate is the first product formed and without
the addition of sodium metal is often present as a major product along with the desired 4-
methoxymethylene substituted methylbenzoate. The addition of sodium metal to form the

23
methoxide anion allows for the complete displacement of the benzylchloride and the complete
conversion of the starting material to the desired product.
The strong reducing agent sodium bis (2-methoxyethoxy) aluminum hydride solution (Red-
Al) in toluene can reduce the ester functional group in 4-methoxymethyl benzoate methyl ester to
give the alcohol and yield 4-methoxymethyl benzyl alcohol. The primary alcohol group was then
converted into an aldehyde and this requires a special oxidant which can stop the oxidization at
the aldehyde stage with no further oxidation occurs. Treat 4-methoxymethyl benzyl alcohol with
fresh PCC, converted the 4-methoxymethyl benzyl alcohol into 4-methoxymethylene
benzaldehyde. The entire reaction sequence for getting the desired precursor aldehyde, 4-
methoxymethylene benzaldehyde, is outlined in Figure 14.
Cl
Cl
O
MeOH/Na
Heat
O
OCH3
OCH3
Red Al
CH2OH
OCH3
PCC
Celite
CHO
OCH3
Figure 14 Synthesis procedures for 4-methoxymethylene benzaldehyde
2.2 Synthesis of 4-methoxymethylene phenylacetone and 4-methoxymethylene phenyl-2-
butanone
The synthesis of the two homologous ketones, 4-methoxy methylene phenylacetone and 4-
methoxymethylene phenyl-2-butanone, is a three step sequence including formation of the imine
adduct between the precursor aldehyde and butylamine. This step is followed by condensation of
the imine with nitroethane or 1-nitropropane to give the corresponding nitroalkene. The

24
nitroalkenes were then subjected to reductive hydrolysis. The complete reaction sequence is
outlined in Figure 15.
CHO
OCH3
n-butylamine
Heat
OCH3
N CH3
CH3CH
2NO
2
OCH3
NO2
CH3
Fe/FeCl3
HCl
H2O/Toluene
OCH3
CH3
O
CH3CH
2CH
2NO
2
OCH3
NO2
CH3
OCH3
O
CH3
Imine
4-methoxymethylene
Phenyl 2-nitropropene
4-methoxymethylene
phenyl 2-nitrobutene
4-methoxymethylene
phenyl 2-nitropropene4-MethoxyMethylenePhenylacetone
Figure 15 Synthesis of 4-methoxymethylene phenylacetone and 4-methoxymethylene phenyl-2-
butanone
The first step of the reaction sequence is the nucleophilic addition of n-butylamine and 4-
methoxymethylene benzaldehyde, electrons on the nitrogen will attack the aldehyde carbon and
yield the carbinolamine intermediate. This is followed by dehydration under heating, to give the
imine. This mechanism is shown in Figure 16. Since the nucleophilic addition reaction is an
equilibrium reaction, it is important to remove the water generated to keep the reaction moving

25
in the forward direction toward the desired imine. In the research, we used a Dean Stark trap to
remove the water formed in the equilibrium reaction.
O
R1 H
NH2 R2+ NR1
H
OH
R2
HHeat N
R1 R2
Imine
Dehydration
Carbinolamine
+ H2O
Figure 16 Mechanisms for imine formation from an aldehyde and a primary amine
The next step is to get the corresponding nitroalkene from the reaction between nitroalkane
and imine intermediate. The α-carbon of nitroalkane attacks the electrophilic carbon of the imine,
followed by elimination of the amine to yield the nitroalkene product, the mechanism is shown in
Figure 17. In the reaction, we used an organic acid, glacial acetic acid, as a catalyst to accelerate
the reaction.
N
R1 R2
N+
OO-
R
H
N+O-O
R
N+O-O
R
HN
R2
R1
H
N+OO-
R
R1
NH
R1 R2
+
NitroalkeneNitroalkane
Imine
+H
+H
Figure 17 Nitroalkene formation mechanism

26
Note that we designed to have the imine as an intermediate in order to activate the aldehyde
carbon, but it’s not a required step for the reaction between the aldehyde and nitroalkane to yield
the nitroalkene. As shown in Figure 18, the aldehyde and the nitroalkane can go through a
nitroaldol reaction under base catalyst and yield the nitroalkene product. In our research, we did
not choose this approach. Instead we designed an approach to activate the aldehyde carbon
reaction center and make it more reactive when exposed to nucleophilic attack. Research results
show that under our approach, the reaction can be finished in one hour and the average yield is
around 90%.
After the imine intermediate is generated from the first step, the following reaction with
nitroethane will yield 4-methoxymethylene phenyl 2-nitropropene, while the reaction with
nitropropane will yield 4-methoxymethylene phenyl-2-butene.
R1 NO2
O
R2 R3
+
O2N R3
R1 OH
R2
O2N R3
R2R1
Base
Figure 18 Reaction outline of nitroaldol reaction
The reductive hydrolysis of the nitroalkene is a two phase reaction involving a solvent
mixture of equal parts water and toluene. The reaction mixture also consists of iron powder and
ferric chloride for the reduction of the nitro group and hydrolysis of the resulting enamine
intermediate to yield the corresponding ketone. Reduction of 4-methoxymethylene phenyl 2-
nitropropene will yield 4-methoxymethylene phenylacetone, while a similar reaction starting
with 4-methoxymethylene phenyl-2-butene will yield 4-methoxymethylene phenyl-2-butanone,
shown in Figure 19.

27
OCH3
NO2
CH3
OCH3
O
CH3
4-methoxymethylene
phenyl 2-nitrobutene
4-methoxymethylene
phenyl 2-nitropropene
OCH3
NO2
CH3
Fe/FeCl3
HCl
H2O/Toluene
OCH3
CH3
O
4-methoxymethylene
Phenyl 2-nitropropene
4-MethoxyMethylenePhenylacetone
Fe/FeCl3
HCl
H2O/Toluene
OCH3
NH2
CH3
H2O
Enamine Intermediate
OCH3
NH2
CH3
Enamine Intermediate
H2O
Figure 19 Reaction scheme of reductive hydrolysis of nitroalkenes
2.3 Synthesis of 4-methoxymethylene phenethylamines (Compound 1-8)
The last step to get the target compounds involves converting the ketone carbonyl group into
an amine group; this approach is known as reductive amination. The process uses one equivalent
of 4-methoxymethylene phenylacetone in methanol, ten equivalents of sodium cyanoborohydride
and ten equivalents of the required amine. The mixture is stirred under room temperature and the
system maintained at pH 7 for three days for the reaction to go to completion. Products were
purified by solvent extraction to yield compounds 1-4. The reaction scheme is shown in Figure
20.

28
NaCNBH3
CH3NH2
OCH3
CH3
NHCH3
Compound 2OCH3
CH3
O
Ammonium Acetate
NaCNBH3
OCH3
CH3
NH2
Compound 1
NaCNBH3
CH3CH2NH2
OCH3
CH3
NHCH2CH3
Compound 3
NaCNBH3
(CH3)2NH
OCH3
CH3
NCH3CH3
Compound 4
Figure 20 Synthesis of compound 1-4 starting from 4-methoxymethylene phenylacetone
The mechanism of this reductive amination is shown in Figure 21. The lone pair of electrons
on the amine nitrogen attack the carbonyl carbon, the generated intermediate grabs H+
ion and
goes through a dehydration process to yield the imine intermediate. At this point, the original
carbonyl carbon is activated and more subjective to nucleophilic attack. Then the electrons on
sodium cyanoborohydride attack the activated imine carbon center, lose H2BCN and yield the
amine product. Since this reaction consumes H+ ion, it is important to check pH from time to
time, and add concentrated hydrochloride to maintain pH at 7.

29
O
R1 R2
H
R3
N
R4
O-
R1
R2
H
R3
N+
R4H+
R2
O
R1
N
R4
R3
H
R1
R2
N+
R4
R3
H
B- CNH
H
N
R4
R3R2
R1
H
H+
+
+
2
2+
-H O
H BCN
Compound 1 R1= R
2= CH
3 R
3= H R
4= H
OCH3
X
Compound 2 R1= R
2= CH
3 R
3= CH
3 R
4= H
OCH3
X
Compound 3 R1= R
2= CH
3 R
3= CH
3CH
2 R
4= H
OCH3
X
Compound 4 R1= R
2= CH
3 R
3= CH
3 R
4= CH
3
OCH3
X
Figure 21 Mechanism of reductive amination that yields compound 1-4
A similar reaction process starting with 4-methoxymethylene phenyl-2-butanone will
generate compound 5 through 8 as shown in Figure 22.

30
NaCNBH3
CH3NH2
Ammonium Acetate
NaCNBH3
NaCNBH3
CH3CH2NH2
NaCNBH3
(CH3)2NH
OCH 3
NH2
CH3
Compound 5
OCH 3
NHCH 3
CH3
Compound 6OCH3
O
CH3
OCH 3
NHCH 2CH 3
CH3
Compound 7
Compound 8
OCH3
CH3
NCH3CH3
Figure 22 Synthesis of compound 5-8 starting from 4-methoxymethylene phenyl-2-butanone
2.4 Synthesis of 4-methoxymethylene benzaldehyde and 4-methoxymethylene phenyl
acetone with methoxy methyl group labeled with deuterium
2.4.1 Synthesis of deuterium labeled 4-methoxymethylene benzaldehyde
4-Methoxymethylene benzaldehyde is a key and very important intermediate in this project.
It is the central precursor substance for the synthesis of all the target compounds.
Commercially available 4-chloromethylbenzoyl chloride was treated with CD3-labeled
methanol and solid sodium metal as catalyst to yield D6-labeled methyl 4-methoxymethyl
benzoate. Based on our experience with this reaction, the labeled methyl ester formed by D3-
labeled methanol displacement of the chloride of the acid chloride functionally occurs just by
dissolving the substrate material in D-labeled methanol. Thus the intermediate D-labeled 4-

31
chloromethyl substituted methylbenzoate is the first product formed and without the addition of
sodium metal is often present as a major product along with the desired D-labeled 4-
methoxymethylene substituted methylbenzoate. The addition of sodium metal to form the D-
labeled methoxide anion allows for the complete displacement of the benzylchloride and the
complete conversion of the starting material to the desired product.
The strong reducing agent sodium bis (2-methoxyethoxy) aluminum hydride solution (Red-
Al) in toluene can reduce the ester functional group in D-labeled 4-methoxymethyl benzoate
methyl ester into the alcohol group and yield D3-labeled 4-methoxymethyl benzyl alcohol. The
primary alcohol group was then converted into an aldehyde and this requires a special oxidant
which can stop the oxidization at the aldehyde stage without further oxidation. The treatment of
the D-labeled 4-methoxymethyl benzyl alcohol with the fresh oxidation agent PCC, the D3-
labeled 4-methoxymethyl benzyl alcohol was selectively oxidized into D-labeled 4-
methoxymethylene benzaldehyde. The entire reaction sequence for getting the desired precursor
aldehyde, D3-labeled 4-methoxymethylene benzaldehyde is shown in Figure 23.
Cl
Cl
O
CD3OH/Na
Heat
O
OCD3
OCD3
Red Al
CH2OH
OCD3
PCC
Celite
CHO
OCD3
Figure 23 The synthesis procedure for deuterium labeled 4-methoxymethylene benzaldehyde
32
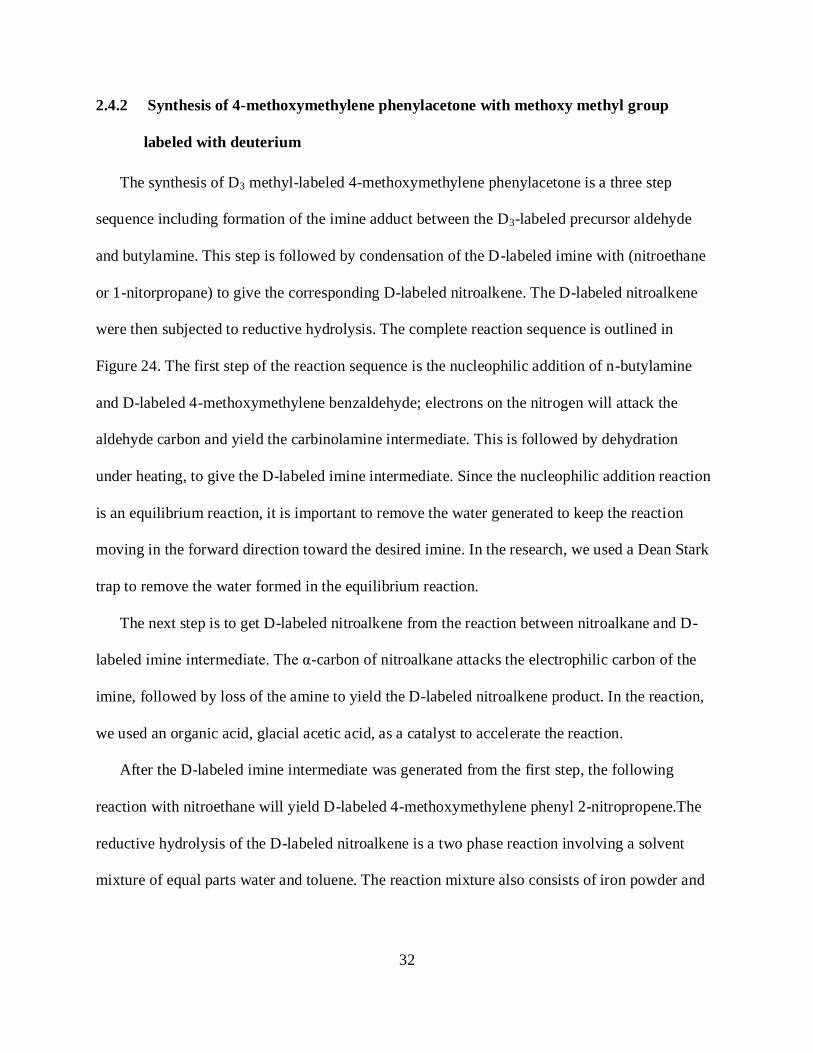
2.4.2 Synthesis of 4-methoxymethylene phenylacetone with methoxy methyl group
labeled with deuterium
The synthesis of D3 methyl-labeled 4-methoxymethylene phenylacetone is a three step
sequence including formation of the imine adduct between the D3-labeled precursor aldehyde
and butylamine. This step is followed by condensation of the D-labeled imine with (nitroethane
or 1-nitorpropane) to give the corresponding D-labeled nitroalkene. The D-labeled nitroalkene
were then subjected to reductive hydrolysis. The complete reaction sequence is outlined in
Figure 24. The first step of the reaction sequence is the nucleophilic addition of n-butylamine
and D-labeled 4-methoxymethylene benzaldehyde; electrons on the nitrogen will attack the
aldehyde carbon and yield the carbinolamine intermediate. This is followed by dehydration
under heating, to give the D-labeled imine intermediate. Since the nucleophilic addition reaction
is an equilibrium reaction, it is important to remove the water generated to keep the reaction
moving in the forward direction toward the desired imine. In the research, we used a Dean Stark
trap to remove the water formed in the equilibrium reaction.
The next step is to get D-labeled nitroalkene from the reaction between nitroalkane and D-
labeled imine intermediate. The α-carbon of nitroalkane attacks the electrophilic carbon of the
imine, followed by loss of the amine to yield the D-labeled nitroalkene product. In the reaction,
we used an organic acid, glacial acetic acid, as a catalyst to accelerate the reaction.
After the D-labeled imine intermediate was generated from the first step, the following
reaction with nitroethane will yield D-labeled 4-methoxymethylene phenyl 2-nitropropene.The
reductive hydrolysis of the D-labeled nitroalkene is a two phase reaction involving a solvent
mixture of equal parts water and toluene. The reaction mixture also consists of iron powder and
33
ferric chloride for the reduction of the nitro group and hydrolysis of the resulting D-labeled
enamine intermediate to yield the corresponding D-labeled ketone.
OCD3
NO2
CH3
Fe/FeCl3
HCl
H2O/Toluene
OCD3
CH3
O
CHO
OCD3
n-butylamine
Heat
OCD3
N CH3 CH3CH
2NO
2
Figure 24 The synthesis procedure for deuterium labeled 4-methoxymethylene phenylacetone
34
3. Analytical studies on the methoxymethylene- substituted
phenethylamines related to MDA, MDMA, MDEA and MDMMA and their
related intermediates
Gas chromatographic separation coupled with mass spectrometry detect ionization (GC-MS)
is the most widely adopted analytical method in forensic labs because of its relatively low cost,
fast analyzing time and relatively low requirement on the purity of samples. A mass spectrum is
considered a “finger print” of a compound that forensic scientists can use for a confirmation
level of identification. As discussed in the introductory part of this thesis, large numbers of
MDMA’s regioisomers and isobarics will yield similar mass spectral information. This section of
the thesis will discuss the analysis methods used to identify the methoxymethylene- substituted
phenethylamines and synthetic precursors, and their differentiation from other isobaric and
regioisomeric phenethylamines having equivalent mass spectrometry properties.
Gas chromatography is based on different compounds having different interacting forces
with column coating materials (stationary phase liquids) and these different interacting forces
will result in different elution times that can be used to separate and identify compounds. Gas
chromatography is most effective in separation when the number of compounds to be separated
is somehow small. However, in the case of identifying MDMA from other potential structures,
co-eluting compounds pose a huge challenge for forensic scientists.

35
After eluting from the GC columns, the compounds will enter the mass spectrometer
detector. The substances will be ionized and form fragments and those fragments are captured
and displayed based on their mass to charge ratio (m/z). This research project used the electron
ionization (EI) method with an energy of 70eV. Since the fragmentation is based on molecular
structure, MS is very powerful in revealing the structure by putting all the fragments back
together, like a “jigsaw puzzle”. Yet MS has its drawbacks, it does not show the actual structure
of the compound, not even a calculated elemental composition. Those regioisomers and isobarics
of MDMA that will yield similar MS information are significant obstacles for MDMA
identification.
Gas Chromatography coupled with Time-Of-Flight mass spectrometry detector (GC-TOF) is
an analytical method which can generate a high resolution exact mass molecular formula for
fragments and the molecular ion. This can then be compared to a calculated exact mass to
determine the elemental composition of fragment ions. In the detector, ions are accelerated and
will travel through a certain distance; their time of flight is captured. The time of flight is
dependent on ion’s m/z value. GC-TOF is an advance over GC-MS in acquiring high precision
compound structure information; however, its usage is limited because of high instrument cost
and maintenance.
Nuclear magnetic resonance (NMR) is an analytical method that is based on the specific
resonance frequency of atoms. NMR is by far the most accurate and effective method in reveling
unknown compound’s structure information. Its usage in forensic industry is limited because it
requires high quality pure samples, while in most cases pure samples will not be available in
forensic labs. High cost is another hindrance for wide use of NMR in forensic labs. In this
research, we used NMR as a supportive method in confirming synthesis intermediates.

36
In this section, we will discuss different kinds of analysis and isotope labeling used to
confirm certain important intermediates of the synthesis procedures. We will also discuss the
comparison of methoxymethylene- substituted intermediates and their ethoxy- substituted
counterparts, as well as the separation of methoxymethylene- substituted phenethylamines.
3.1 Analytical studies on the comparison of synthesis intermediate 4-methoxymethylene
benzaldehyde with its regioisomeric compound 4-ethoxymethylene benzaldehyde
4-Methoxymethylene benzaldehyde and 4- ethoxy benzaldehyde are regioisomers based on
the position of the oxygen in the ether side chain. Studying their analytical properties will help
understand the different impacts of the methoxymethylene group and ethoxy group of
regioisomers on gas chromatography and mass spectra.
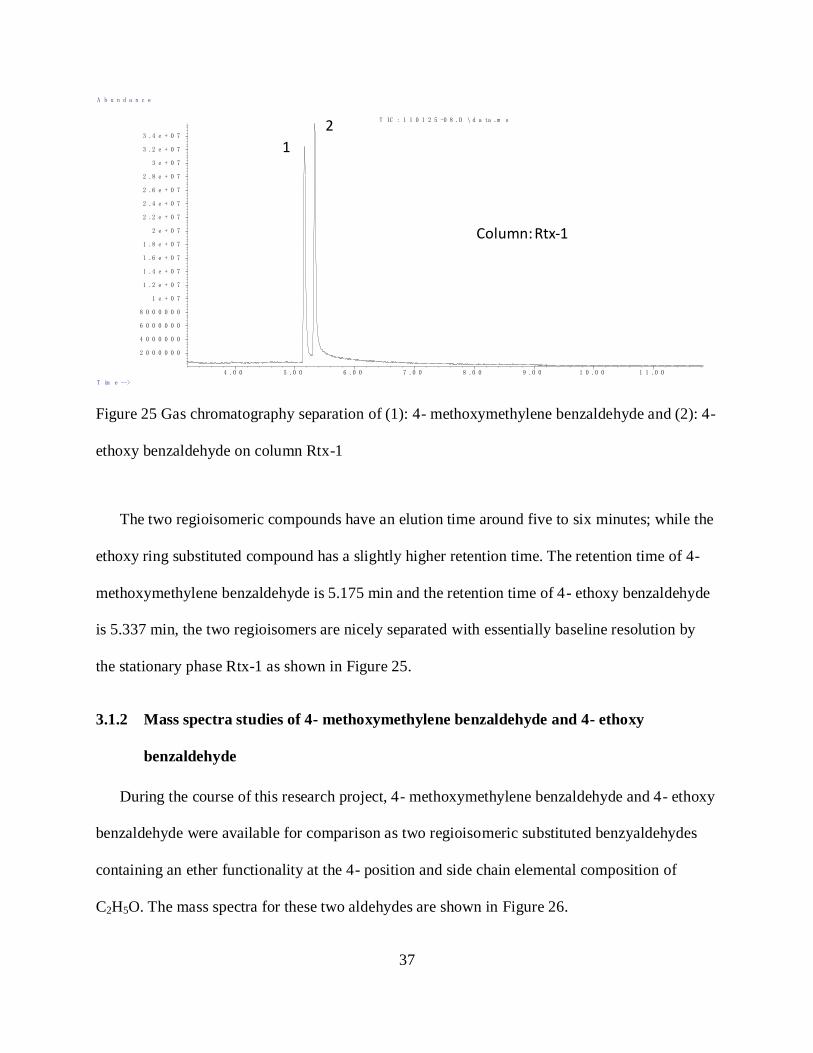
3.1.1 Gas chromatography separation of 4- methoxymethylene benzaldehyde and 4-
ethoxy benzaldehyde
Gas chromatography separation of 4- methoxymethylene benzaldehyde and 4- ethoxy
benzaldehyde was carried out on several columns, and only the best separation result is shown in
Figure 25. The Rtx-1 column has a length of 30 meters, internal dimension of 0.25 mm and a
stationary phase film thickness of 0.25 μm. The stationary phase of the Rtx-1 column is 100%
dimethyl polysiloxane. The temperature program used for separation was to set the injector
temperature at 250 °C, detector temperature at 280 °C. The column is started at 70 °C, held at
that temperature for 1 minute then the temperature was ramped up to 250 °C at a rate of 30 °C
per minute and set at 250 °C for 5 minutes. The finish time is 20 minutes.
37
4 .0 0 5 .0 0 6 .0 0 7 .0 0 8 .0 0 9 .0 0 1 0 .0 0 1 1 .0 0
2 0 0 0 0 0 0
4 0 0 0 0 0 0
6 0 0 0 0 0 0
8 0 0 0 0 0 0
1 e + 0 7
1 .2 e + 0 7
1 .4 e + 0 7
1 .6 e + 0 7
1 .8 e + 0 7
2 e + 0 7
2 .2 e + 0 7
2 .4 e + 0 7
2 .6 e + 0 7
2 .8 e + 0 7
3 e + 0 7
3 .2 e + 0 7
3 .4 e + 0 7
T im e -->
A b u n d a n c e
T IC : 1 1 0 1 2 5 -0 8 .D \ d a ta .m s
Column: Rtx-1
1
2
Figure 25 Gas chromatography separation of (1): 4- methoxymethylene benzaldehyde and (2): 4-
ethoxy benzaldehyde on column Rtx-1
The two regioisomeric compounds have an elution time around five to six minutes; while the
ethoxy ring substituted compound has a slightly higher retention time. The retention time of 4-
methoxymethylene benzaldehyde is 5.175 min and the retention time of 4- ethoxy benzaldehyde
is 5.337 min, the two regioisomers are nicely separated with essentially baseline resolution by
the stationary phase Rtx-1 as shown in Figure 25.
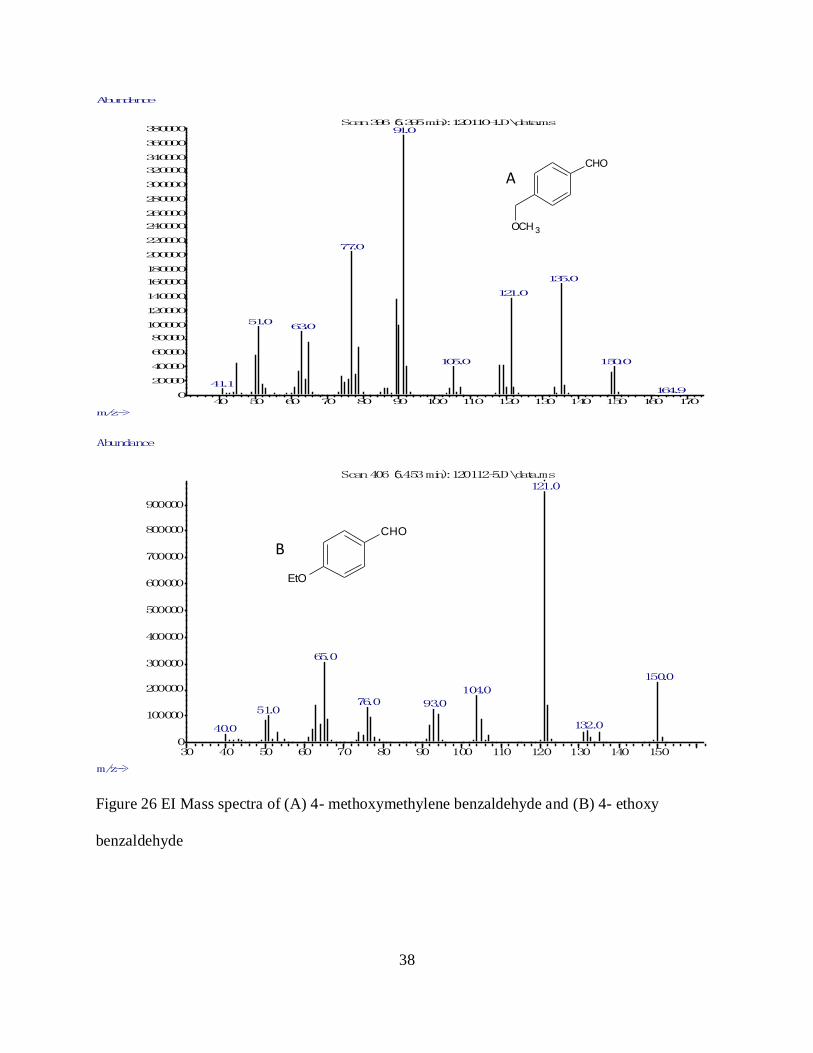
3.1.2 Mass spectra studies of 4- methoxymethylene benzaldehyde and 4- ethoxy
benzaldehyde
During the course of this research project, 4- methoxymethylene benzaldehyde and 4- ethoxy
benzaldehyde were available for comparison as two regioisomeric substituted benzyaldehydes
containing an ether functionality at the 4- position and side chain elemental composition of
C2H5O. The mass spectra for these two aldehydes are shown in Figure 26.
38
40 50 60 70 80 90 100 110 120 130 140 150 160 1700
20000
40000
60000
80000
100000
120000
140000
160000
180000
200000
220000
240000
260000
280000
300000
320000
340000
360000
380000
m/z-->
Abundance
Scan 396 (5.395 min): 120110-1.D\data.ms91.0
77.0
135.0
121.0
51.063.0
105.0 150.0
41.1164.9
CHO
OCH 3
A
CHO
EtO
30 40 50 60 70 80 90 100 110 120 130 140 1500
100000
200000
300000
400000
500000
600000
700000
800000
900000
m/z-->
Abundance
Scan 406 (5.453 min): 120112-5.D\data.ms121.0
65.0
150.0
104.076.0 93.0
51.0
132.040.0
B
Figure 26 EI Mass spectra of (A) 4- methoxymethylene benzaldehyde and (B) 4- ethoxy
benzaldehyde
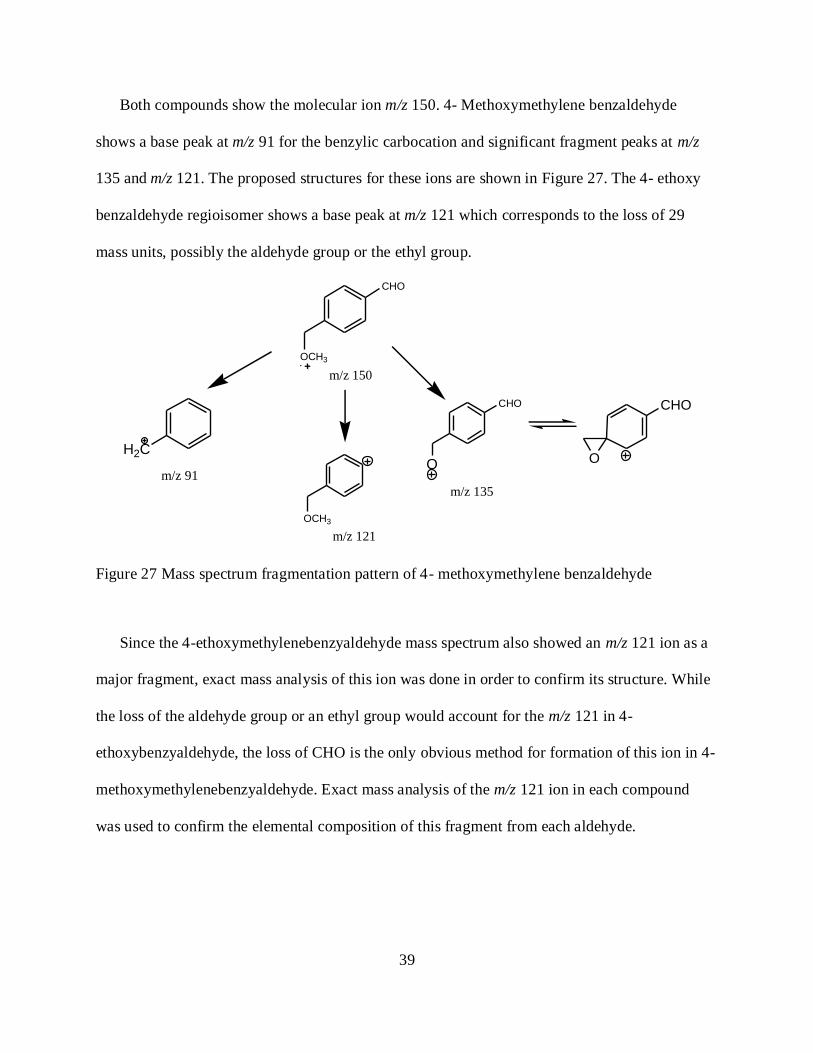
39
Both compounds show the molecular ion m/z 150. 4- Methoxymethylene benzaldehyde
shows a base peak at m/z 91 for the benzylic carbocation and significant fragment peaks at m/z
135 and m/z 121. The proposed structures for these ions are shown in Figure 27. The 4- ethoxy
benzaldehyde regioisomer shows a base peak at m/z 121 which corresponds to the loss of 29
mass units, possibly the aldehyde group or the ethyl group.
CHO
OCH3
m/z 150
m/z 91
OCH3
m/z 121
CHO
O
m/z 135
H2C
CHO
O
Figure 27 Mass spectrum fragmentation pattern of 4- methoxymethylene benzaldehyde
Since the 4-ethoxymethylenebenzyaldehyde mass spectrum also showed an m/z 121 ion as a
major fragment, exact mass analysis of this ion was done in order to confirm its structure. While
the loss of the aldehyde group or an ethyl group would account for the m/z 121 in 4-
ethoxybenzyaldehyde, the loss of CHO is the only obvious method for formation of this ion in 4-
methoxymethylenebenzyaldehyde. Exact mass analysis of the m/z 121 ion in each compound
was used to confirm the elemental composition of this fragment from each aldehyde.

40
3.1.3 GC-TOF analysis of 4-methoxymethylene benzaldehyde on certain characteristic
fragments
GC-TOF is an analytical method that can provide elemental composition information for
fragments in mass spectrometry, thus it is an important approach for confirming synthesis
results. Figure 28 shows the TOF mass spectrum of 4-methoxymethylene benzaldehyde. These
TOF mass spectra were generated under GC-MS conditions with 70eV electron ionization, thus,
these fragments are identical to those generated in the previous nominal mass experiments.
CHO
OCH3
as is
m/z40 60 80 100 120 140 160 180 200 220 240 260 280 300 320 340 360 380 400
%
0
100
Clark_ALDEHYDE_1_110208_2 143 (8.265) Cm (143-85:99x2.000) TOF MS EI+ 1.81e4135.0462
121.0655
91.0528
89.0372
77.0361
63.0195 92.0584
150.0700
151.0739
264.3471207.2178 347.1016334.4700364.4117
Figure 28 TOF mass spectra of 4-methoxymethylene benzaldehyde
The mass spectrum of 4-methoxymethylene benzaldehyde shows that the base peak is m/z
135 and other significant peaks are at m/z 150, m/z 121 and m/z 91. The m/z 150 peak is the
molecular ion peak, based on previous experience analyzing substituted benzenes; m/z 91 is
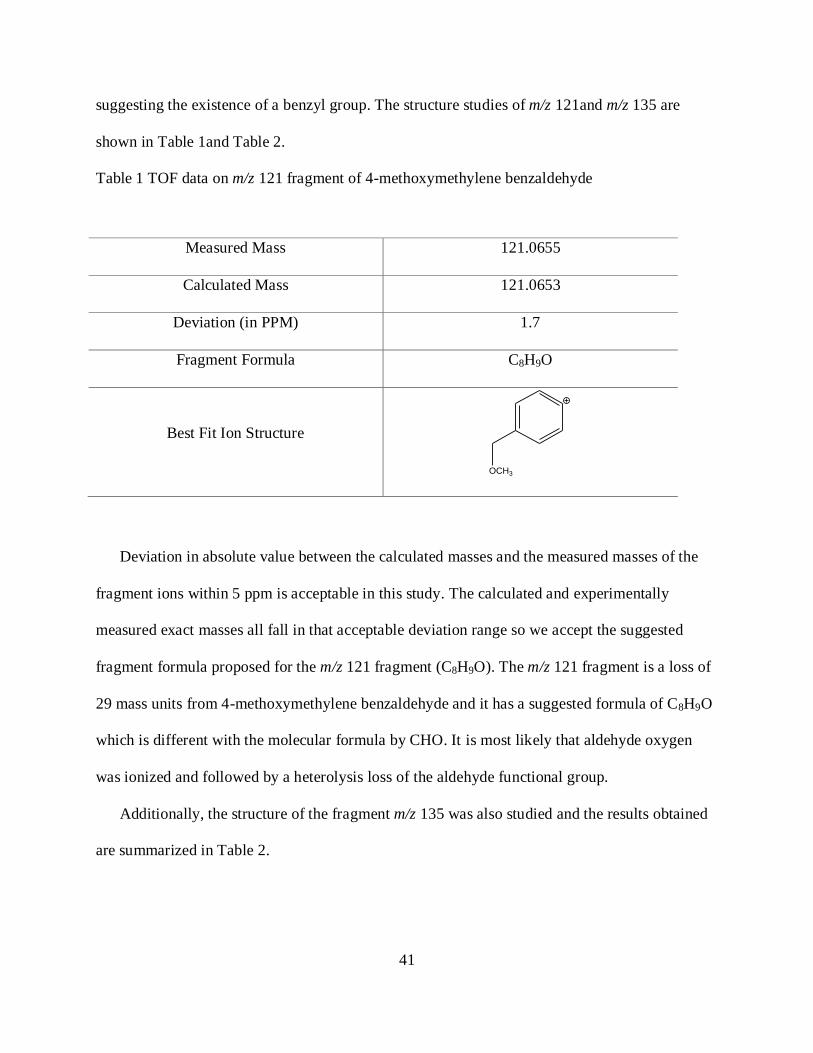
41
suggesting the existence of a benzyl group. The structure studies of m/z 121and m/z 135 are
shown in Table 1and Table 2.
Table 1 TOF data on m/z 121 fragment of 4-methoxymethylene benzaldehyde
Measured Mass 121.0655
Calculated Mass 121.0653
Deviation (in PPM) 1.7
Fragment Formula C8H9O
Best Fit Ion Structure
OCH3
Deviation in absolute value between the calculated masses and the measured masses of the
fragment ions within 5 ppm is acceptable in this study. The calculated and experimentally
measured exact masses all fall in that acceptable deviation range so we accept the suggested
fragment formula proposed for the m/z 121 fragment (C8H9O). The m/z 121 fragment is a loss of
29 mass units from 4-methoxymethylene benzaldehyde and it has a suggested formula of C8H9O
which is different with the molecular formula by CHO. It is most likely that aldehyde oxygen
was ionized and followed by a heterolysis loss of the aldehyde functional group.
Additionally, the structure of the fragment m/z 135 was also studied and the results obtained
are summarized in Table 2.

42
Table 2 TOF data on m/z 135 fragment of 4-methoxymethylene benzaldehyde
Measured Mass 135.0442
Calculated Mass 135.0446
Deviation (in PPM) -3.0
Fragment Formula C8H7O2
Best Fit Ion Structure
CHO
O
The m/z 135 fragment is a loss of 15 mass from the molecular ion for 4-methoxymethylene
benzaldehyde, and it has a suggested formula of C8H7O2 which is different with the molecular
formula by CH3. The most likely fragmentation is the loss of the methyl group from the side
chain methoxy methyl. A proposed structure for this ion is shown in Table 2 and Figure 27.
3.1.4 GC-TOF analysis on 4-ethoxy benzaldehyde m/z 121 fragment
GC-TOF is an analytical method that can provide elemental composition information for
fragments in mass spectrometry, thus it is an important approach for confirming synthesis results
and structural analysis. Figure 29 shows the TOF mass spectrum of 4-ethoxy benzaldehyde.

43
as is
m/z40 50 60 70 80 90 100 110 120 130 140 150 160 170
%
0
100
Ning_040912_3 240 (10.606) Cm (240-210:215) TOF MS EI+ 1.80e4121.0286
65.0340
63.018351.0176
104.030093.0326
76.027992.0275
105.0368
108.0642
150.0673
122.0368
132.0629149.0693 151.0763
CHO
EtO
Figure 29 TOF mass spectra of 4-ethoxy benzaldehyde
Mass spectrum of 4-ethoxy benzaldehyde shows that the base peak is the m/z 121 fragment,
and the other significant peak is the molecular ion m/z 150. The structure study of m/z 121 is
shown in Table 3.
Table 3 TOF data on m/z 121 fragment of 4-ethoxy benzaldehyde
Measured Mass 121.0286
Calculated Mass 121.0290
Deviation (in PPM) -3.3
Fragment Formula C7H5O2
Best Fit Ion Structure
CHO
O
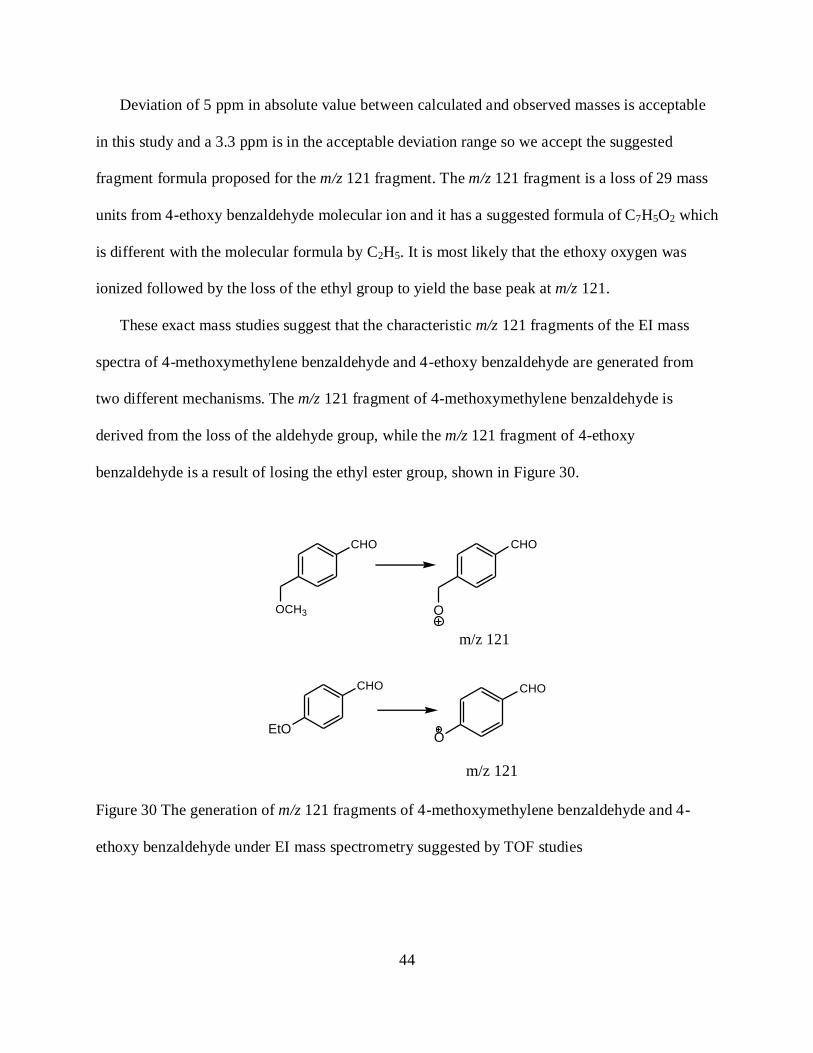
44
Deviation of 5 ppm in absolute value between calculated and observed masses is acceptable
in this study and a 3.3 ppm is in the acceptable deviation range so we accept the suggested
fragment formula proposed for the m/z 121 fragment. The m/z 121 fragment is a loss of 29 mass
units from 4-ethoxy benzaldehyde molecular ion and it has a suggested formula of C7H5O2 which
is different with the molecular formula by C2H5. It is most likely that the ethoxy oxygen was
ionized followed by the loss of the ethyl group to yield the base peak at m/z 121.
These exact mass studies suggest that the characteristic m/z 121 fragments of the EI mass
spectra of 4-methoxymethylene benzaldehyde and 4-ethoxy benzaldehyde are generated from
two different mechanisms. The m/z 121 fragment of 4-methoxymethylene benzaldehyde is
derived from the loss of the aldehyde group, while the m/z 121 fragment of 4-ethoxy
benzaldehyde is a result of losing the ethyl ester group, shown in Figure 30.
CHO
O
CHO
O
CHO
OCH3
CHO
EtO
m/z 121
m/z 121
Figure 30 The generation of m/z 121 fragments of 4-methoxymethylene benzaldehyde and 4-
ethoxy benzaldehyde under EI mass spectrometry suggested by TOF studies

45
3.1.5 GC-MS studies on isotopic labeled 4-methoxymethylene benzaldehyde
In order to further confirm the significant fragments shown in the mass spectrum of 4-
methoxymethylene benzaldehyde, i.e. the m/z 121 and m/z 135 fragments, analysis work of
deuterium labeled 4-methoxymethylene benzaldehyde was carried out during this research. The
isotopic labeling technique often provides valuable insights into the processes of fragmentation
in mass spectrometry. In this project, the methoxy methyl group hydrogens of 4-
methoxymethylene benzaldehyde were labeled with deuterium in order to further demonstrate
that the methyl position of the methoxy methyl group is actually lost to generate the m/z 135 ion.
If the previous interpretation for the m/z 135 peak is true, then the methoxy methyl group is lost
under electron ionization. Thus, an m/z 135 peak is expected in the mass spectra of deuterium
labeled 4-methoxymethylene benzaldehyde. If this methyl group remains a part of the fragment
in question the mass would be shifted by the number of the labeled deuterium atoms (m/z 138 in
this case).
Gas chromatography and mass spectra of isotopic labeled 4-methoxymethylene
benzaldehyde is shown in Figure 31 and Figure 32 below.

46
CHO
OCD3
4.00 5.00 6.00 7.00 8.00 9.00 10.00 11.00
100000
200000
300000
400000
500000
600000
700000
800000
900000
1000000
1100000
1200000
1300000
1400000
1500000
Time-->
Abundance
TIC: 120322-NY1.D\data.ms
Figure 31 Gas chromatography of isotopic labeled 4-methoxymethylene benzaldehyde. Column:
Rtx-35
CHO
OCD3
30 40 50 60 70 80 90 100 110 120 130 140 150 160 1700
10000
20000
30000
40000
50000
60000
70000
80000
90000
100000
110000
120000
130000
140000
m/z-->
Abundance
Scan 662 (6.946 min): 120322-NY1.D\data.ms135.0
124.1
91.1
153.177.1
51.1
63.1105.0
40.1
165.0
Figure 32 EI mass spectra of isotopic D3-methyl labeled 4-methoxymethylene benzaldehyde
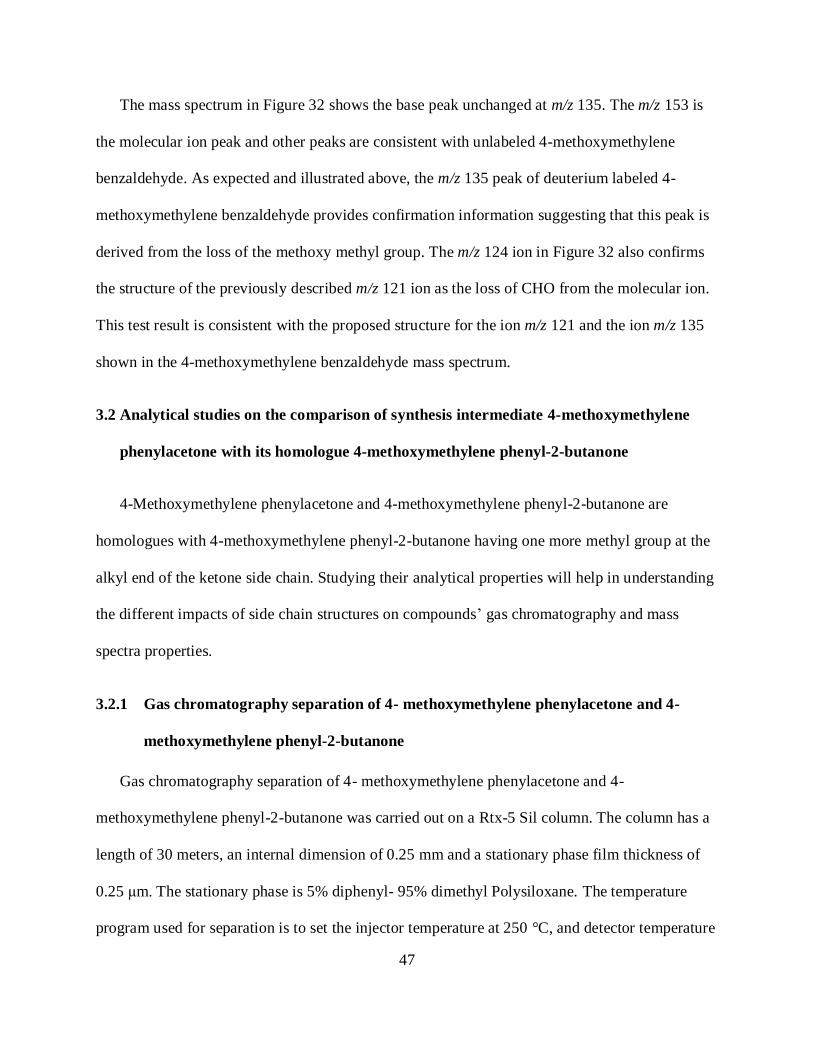
47
The mass spectrum in Figure 32 shows the base peak unchanged at m/z 135. The m/z 153 is
the molecular ion peak and other peaks are consistent with unlabeled 4-methoxymethylene
benzaldehyde. As expected and illustrated above, the m/z 135 peak of deuterium labeled 4-
methoxymethylene benzaldehyde provides confirmation information suggesting that this peak is
derived from the loss of the methoxy methyl group. The m/z 124 ion in Figure 32 also confirms
the structure of the previously described m/z 121 ion as the loss of CHO from the molecular ion.
This test result is consistent with the proposed structure for the ion m/z 121 and the ion m/z 135
shown in the 4-methoxymethylene benzaldehyde mass spectrum.
3.2 Analytical studies on the comparison of synthesis intermediate 4-methoxymethylene
phenylacetone with its homologue 4-methoxymethylene phenyl-2-butanone
4-Methoxymethylene phenylacetone and 4-methoxymethylene phenyl-2-butanone are
homologues with 4-methoxymethylene phenyl-2-butanone having one more methyl group at the
alkyl end of the ketone side chain. Studying their analytical properties will help in understanding
the different impacts of side chain structures on compounds’ gas chromatography and mass
spectra properties.
3.2.1 Gas chromatography separation of 4- methoxymethylene phenylacetone and 4-
methoxymethylene phenyl-2-butanone
Gas chromatography separation of 4- methoxymethylene phenylacetone and 4-
methoxymethylene phenyl-2-butanone was carried out on a Rtx-5 Sil column. The column has a
length of 30 meters, an internal dimension of 0.25 mm and a stationary phase film thickness of
0.25 μm. The stationary phase is 5% diphenyl- 95% dimethyl Polysiloxane. The temperature
program used for separation is to set the injector temperature at 250 °C, and detector temperature

48
at 280 °C. The column is started at 70 °C, held at that temperature for 1 minute then the
temperature was ramped up to 250 °C at a rate of 30 °C per minute and set at 250 °C for 5
minutes. The finish time is 20 minutes. GC results are shown in Figure 33.
3 .5 0 4 .0 0 4 .5 0 5 .0 0 5 .5 0 6 .0 0 6 .5 0 7 .0 0 7 .5 0 8 .0 0 8 .5 0 9 .0 0
5 0 0 0 0 0
1 0 0 0 0 0 0
1 5 0 0 0 0 0
2 0 0 0 0 0 0
2 5 0 0 0 0 0
3 0 0 0 0 0 0
3 5 0 0 0 0 0
4 0 0 0 0 0 0
4 5 0 0 0 0 0
5 0 0 0 0 0 0
T im e -->
A b u n d a n c e
T IC : 1 2 0 1 1 2 -2 .D \ d a ta .m s
Figure 33 Gas chromatography separation of (1): 4- methoxymethylene phenylacetone and (2):
4- methoxymethylene phenyl-2-butanone on column Rtx-5 Sil
The retention time of 4- methoxymethylene phenylacetone is 6.205 min, and the retention
time of 4- methoxymethylene phenyl-2-butanone is 6.671 min. These compounds are well
resolved in this system with the higher chain homologue butanone having the greater retention
time. The two compounds can be nicely separated on an Rtx-5 Sil stationary phase showing
baseline resolution with an analysis time in the six to seven minute range.
1
2

49
3.2.2 Mass spectra studies of 4- methoxymethylene phenylacetone and 4-
methoxymethylene phenyl-2-butanone
This research studied the mass spectra of 4- methoxymethylene phenylacetone and 4-
methoxymethylene phenyl-2-butanone for comparison and separation purposes under 70eV
electronic ionization, the result is shown in Figure 34.
4 0 5 0 6 0 7 0 8 0 9 0 1 0 0 1 1 0 1 2 0 1 3 0 1 4 0 1 5 0 1 6 0 1 7 0 1 8 0 1 9 00
1 0 0 0 0 0
2 0 0 0 0 0
3 0 0 0 0 0
4 0 0 0 0 0
5 0 0 0 0 0
6 0 0 0 0 0
7 0 0 0 0 0
8 0 0 0 0 0
9 0 0 0 0 0
1 0 0 0 0 0 0
1 1 0 0 0 0 0
1 2 0 0 0 0 0
1 3 0 0 0 0 0
1 4 0 0 0 0 0
m / z -->
A b u n d a n c e
S c a n 5 3 5 (6 .2 0 5 m in ): 1 2 0 1 1 0 -9 .D \ d a ta .m s1 0 4 .0
4 3 .0
9 1 .0
1 3 5 .07 7 .0
6 5 .01 1 9 .0
1 7 8 .01 4 9 .0 1 6 1 .0
OCH3
CH3
O

50
40 50 60 70 80 90 100 110 120 130 140 150 160 170 180 1900
100000
200000
300000
400000
500000
600000
700000
800000
m /z-->
A bundance
S can 615 (6.671 m in): 120112-2.D \data.m s104.0
57.091.0
135.078.0119.045.0
192.1161.1149.0 175.1
OCH3
O
CH3
Figure 34 EI Mass spectra of 4- methoxymethylene phenylacetone and 4- methoxymethylene
phenyl-2-butanone
Both compounds show a predominant unique base peak at m/z 104. Exact mass analysis of
the m/z 104 ion in each compound was used to analyze the elemental composition of this
fragment from each ketone. Other significant peaks in common are m/z 135 and m/z 91. The
unique peaks for 4- methoxymethylene phenylacetone are m/z 178 and m/z 43, corresponding to
the molecular ion and the acetyl ion. Unique peaks for 4- methoxymethylene phenyl butanone
are m/z 192 and m/z 57, corresponding to molecular ion and propionyl ion respectively. Thus, the
additional methyl group on the carbonyl side chain can bring small differences to mass spectra,
but will not significantly change the fragmentation pattern.

51
3.2.3 GC-TOF analysis on 4-methoxymethylene phenylacetone
GC-TOF is an analytical method that can provide elemental composition information for
fragments under the mass spectrum, thus it is an important approach for confirming analytical
results. Figure 35 below shows the TOF mass spectra of 4-methoxymethylene phenylacetone.
as is
m/z40 60 80 100 120 140 160 180 200 220 240 260 280 300
%
0
100
Clark_KETONE_1_110208_4 206 (10.612) Cm (186:297-12:151x2.000) TOF MS EI+ 2.82e5104.0623
91.0534
77.0362
59.0173
105.0692
135.0805
135.0475
178.1045150.0708
211.0814179.1056
253.0211271.0557
OCH3
CH3
O
Figure 35 TOF mass spectra of 4-methoxymethylene phenylacetone
Mass spectra of 4-methoxymethylene phenylacetone shows that the base peak is m/z 104, and
other significant peaks are m/z 178, m/z 135, m/z 91, and m/z 77. The m/z 178 peak is the
molecular ion peak and based on experience dealing with substituted benzene ring analysis, m/z
91 and m/z 77 and fragmentation series suggest the presence of the benzyl group. The m/z 135
fragment is 4-methoxymethylene benzyl cation derived from the loss of the acetyl group. The
TOF-MS structure study of m/z 104 is shown in Table 4.
.

52
Table 4 TOF data on m/z 104 fragment of 4-methoxymethylene phenylacetone
Measured Mass 104.0623
Calculated Mass 104.0626
Deviation (in PPM) -2.9
Fragment Formula C8H8
Best Fit Ion Structure
CH2
CH2
Deviation of 5 ppm in absolute value of the measured mass and the calculated masses is
acceptable in this study. Deviation of the m/z 104 piece falls in that acceptable deviation range
thus we accept the suggested fragment formula. The m/z 104 fragment is a loss of 74 mass from
4-methoxymethylene phenylacetone, and it has a suggested formula of C8H8 which is different
with the molecular formula by C3H6O2. Since there is no oxygen present in the m/z 104 piece, it
is highly likely that both the carbonyl side chain and the methoxy side chain are lost during
fragmentation. One possible pathway of fragmentation is shown in Figure 36.
53
Figure 36 Possible mechanisms for the formation of mass 104 fragment
In this fragmentation mechanism, the methoxy oxygen is ionized first. The following
homolytic cleavage completes a rearrangement by transferring the carbonyl side chain to the
methoxy oxygen. The next step is heterolytic cleavage, losing the rearranged methyl acetate side
chain and leaving the m/z 104 piece.
The previous section shows that both 4- methoxymethylene phenylacetone and 4-
methoxymethylene phenyl-2-butanone show a base peak at m/z 104 and this observation
contributes additional support to the proposed mechanism of formation of this unique ion. This
support is based on the change in structure of the alkyl side of the ketone making no difference in
the mass of the base peak fragment.
In order to further confirm this fragmentation and mechanism, this research designed an
isotope labeling procedure similar to that previously described for the corresponding aldehydes.

54
3.2.4 GC-MS studies on isotopic labeled 4-methoxymethylene phenylacetone
The isotopic labeling technique often provides valuable insights into the processes of
fragmentation in mass spectrometry. In this project, the methyl group hydrogens of 4-
methoxymethylene phenylacetone were labeled with deuterium in order to confirm whether that
the methyl of methoxy methyl group is actually lost to generate the m/z 104 ion. If the previous
interpretation for the m/z 104 peak is true, then the methoxy methyl group is lost under electron
ionization. Thus, the equivalent m/z 104 peak is expected to retain in the mass spectra of
deuterium labeled 4-methoxymethylene phenylacetone since the generation of m/z 104 requires
the loss of the methyl of the methoxy group. The gas chromatography and mass spectra analysis
of isotopic labeled 4-methoxymethylene phenylacetone is shown in Figure 37 and Figure 38.
OCD3
CH3
O
3.50 4.00 4.50 5.00 5.50 6.00 6.50 7.00 7.50 8.00 8.50 9.00 9.50 10.00
500000
1000000
1500000
2000000
2500000
3000000
3500000
4000000
4500000
5000000
5500000
6000000
6500000
7000000
7500000
8000000
8500000
9000000
9500000
Time-->
Abundance
TIC: 120322-45.D\data.ms
Figure 37 Gas chromatography of isotopic labeled 4-methoxymethylene phenylacetone. Column:
Rxi-50

55
OCD3
CH3
O
30 40 50 60 70 80 90 100 110 120 130 140 150 160 170 180 190 200 210 2200
200000
400000
600000
800000
1000000
1200000
1400000
1600000
1800000
2000000
2200000
2400000
2600000
2800000
3000000
3200000
m/z-->
Abundance
Scan 684 (7.074 min): 120322-45.D\data.ms
104.1
43.1138.1
181.178.1
119.163.1
164.1 217.9197.1
Figure 38 EI mass spectra of isotopic labeled 4-methoxymethylene phenylacetone
In the mass spectra, the base peak remained m/z 104 while the molecular ion peak is at m/z
181. 4-methoxymethylene benzyl cation with labeled CD3 group is at m/z 138 from the loss of
the acetyl group. These two significant peaks are consistent with the explanation provided for
their counterpart peaks of unlabeled 4-methoxymethylene phenylacetone. Most importantly, the
base peak m/z 104 of labeled 4-methoxymethylene phenylacetone proved that the methyl of the
methoxy methyl group was lost in the process of producing this fragment, since there is no mass
shift caused by the existence of isotope deuterium compared to the counterpart fragment m/z 104
of the unlabeled 4-methoxymethylene phenylacetone. The isotope labeling study further supports
the provided mechanism of the m/z 104 peak.
Since the proposed mechanism of the m/z 104 fragment involves the methoxymethylene
oxygen, we would like to study how the fragmentation pattern would be affected if the oxygen

56
position is moved one carbon away. Thus we designed an analytical procedure comparing 4-
methoxymethylene phenylacetone with its regioisomer, 4-ethoxy phenylacetone.
3.2.5 Analytical studies comparing 4-methoxymethylene phenylacetone with its
regioisomer 4-ethoxy phenylacetone
4- Methoxymethylene phenylacetone and 4- ethoxy phenylacetone are regioisomeric
substances based on the position of the ether oxygen in the side chain. A comparison of their
mass spectral properties will help understand the different impacts of the methoxymethylene
group and ethoxy group on the structure property relationships in these closely related
compounds, particularly on the mechanism of the generation of the unique m/z 104 fragment
shown in the mass spectrum of 4- methoxymethylene phenylacetone.
Gas chromatography separation of 4- methoxymethylene phenylacetone and 4- ethoxy
phenylacetone was carried out on two different columns, Rtx-1 and Rtx-5 Sil. The GC results
show that these two compounds have very similar retention times on both the Rtx-1 column and
Rtx-5 Sil column, thus they are not well resolved in this study. Study results are shown in Table
5 below.

57
Table 5 GC study results of 4- methoxymethylene phenylacetone and 4- ethoxy phenylacetone
under column Rtx-1 and Rtx-5 Sil
Compound Column Retention Time
4- methoxymethylene
phenylacetone
Rtx-1 5.925 min
Rtx-5 Sil 6.205 min
4- ethoxy phenylacetone
Rtx-1 6.059 min
Rtx-5 Sil 6.193 min
Mass spectrometry is a key analytical tool providing unique information of drug and
precursor substances for identification in forensic labs. This research compared of the mass
spectra of 4- methoxymethylene phenylacetone and 4- ethoxy phenylacetone for mass spectral
differentiation purposes under 70eV standard electronic ionization, the result is shown in Figure
39.

58
40 50 60 70 80 90 100 110 120 130 140 150 160 170 180 1900
100000
200000
300000
400000
500000
600000
700000
800000
900000
1000000
1100000
1200000
1300000
1400000
m/z-->
Abundance
Scan 535 (6.205 min): 120110-9.D\data.ms104.0
43.0
91.0
135.077.0
65.0119.0
178.0149.0 161.0
OCH3
CH3
O
EtO
CH3
O
40 50 60 70 80 90 100 110 120 130 140 150 160 170 180 1900
200000
400000
600000
800000
1000000
1200000
1400000
1600000
1800000
2000000
2200000
2400000
2600000
2800000
3000000
m/z-->
Abundance
Scan 533 (6.193 min): 120110-10.D\data.ms107.0
135.0
77.043.1
178.1
89.063.0
121.0 149.0 161.9
Figure 39 EI mass spectra of 4- methoxymethylene phenylacetone and 4- ethoxy phenylacetone
Both compounds show significant ions of m/z 178, m/z 135 and m/z 43 corresponding to the
molecular ion, methoxymethyl/ethoxy benzyl ion and acetyl ion, respectively. The most
significant difference between the two mass spectra is the mass of the base peaks, the

59
methoxymethylene substituted phenylacetone at m/z 104 while the ethoxy substituted ketone at
m/z 107. The base peak mass spectral difference is caused by substitution pattern variance in the
position of the ether oxygen in the substituent at the 4- position. This placement of the oxygen
allows for two quite different rearrangements to occur in these regioisomeric ketones. This study
further supports the mechanism of the generation of the fragment m/z 104, Figure 36, and the
fragment m/z 107, Figure 10. The support is based on the fact that as the positions of the ester
side chain oxygen are different, the EI mass spectra ions generated are different. The fact
suggests that the procedure for generating the m/z 104 and the m/z 107 involves the ester side
chain of oxygen.
3.2.6 GC-TOF analysis on 4-ethoxy phenylacetone
GC-TOF is an analytical method that can provide elemental composition information for
fragments under mass spectrum, thus it is an important approach for confirming synthesis result
purposes. Figure 40 shows the TOF mass spectrum of 4-ethoxy phenylacetone, a regioisomer of
methoxy methylenephenylacetone based on oxygen positioning in the side chain.

60
as is
m/z40 60 80 100 120 140 160 180 200 220 240 260 280 300 320 340 360 380 400
%
0
100
Clark_ETO_KETONE_1_110208_4 189 (9.989) Cm (189-53:69x2.000) TOF MS EI+ 1.79e5107.0490
77.0365
63.0191
78.0439
135.0822
178.1033
136.0861179.1068 220.4429
343.0689299.0810268.0664 386.9681
EtO
CH3
O
Figure 40 TOF mass spectra of 4-ethoxy phenylacetone
The mass spectrum of 4-ethoxy phenylacetone shows that the base peak is m/z 107, other
significant peaks are the molecular ion peak at m/z 178 and the m/z 135 ion. The m/z 135
fragment is the 4-ethoxy benzyl ion derived from the loss of the acetyl group (CH3CO). The
structure study of m/z 107 is shown in Table 6.
Table 6 TOF data on m/z 107 fragment of 4-ethoxy phenylacetone
Measured Mass 107.0490
Calculated Mass 107.0497
Deviation (in PPM) -6.5
Fragment Formula C7H7O
Best Fit Ion Structure
CH2
OH+

61
Deviation of 5 ppm in absolute value is acceptable in this study, calculated masses of the m/z
107 piece is somehow near that acceptable deviation range and is by far the nearest statistical fix
of any possible combination of atoms, we accept the suggested fragment formula. The m/z 107
fragment is a loss of 71 mass from 4-ethoxy phenylacetone, and it has a suggested formula of
C7H7O which is different with the molecular formula by C4H7O. The previous cleavage
mechanism works well in interpreting this 107 piece also, shown in Figure 41.
O
CH3
O
CH3
CH2
O
H
CH2
OH
m/z 107
Figure 41 Possible mechanisms for the formation of mass 107 piece
In this fragmentation mechanism, the methoxy oxygen is ionized first. The following
homolytic cleavage triggers the loss of the acetyl group. Finally, a charge initiated four
membered ring hydrogen rearrangement generates the m/z 107 fragment. The analytical result is
consistent with previously published study (Al-Hossaini A. M. et al., 2010), and the GC-TOF
exact mass confirms the mechanism of the m/z 107 generation involves the engagement of the

62
ester oxygen. This mechanism is very different from the generation of the m/z 104 fragment of
the methoxymethylene ring substituted phenethylamines
3.3 GC-MS studies of the 4-methoxymethylene amphetamine series compounds
3.3.1 GC separation of the 4-methoxymethylene amphetamine series compounds
Gas chromatography separation of the 4-methoxymethylene amphetamine series of
compounds was carried out on an Rtx-1 column. The column had a length of 30 meters, an
internal dimension of 0.25 mm and a stationary phase film thickness of 0.25 μm. The stationary
phase was 100% dimethyl polysiloxane. A temperature program was used for separation with the
injector temperature set at 250 °C, and detector temperature set at 280 °C. The column was
started at 70 °C, held at that temperature for 1 minute then the temperature was ramped up to 250
°C at a rate of 30 °C per minute and set at 250 °C for 5 minutes. The finish time is 20 minutes.
GC results are shown in Figure 42.

63
4 .4 0 4 .6 0 4 .8 0 5 .0 0 5 .2 0 5 .4 0 5 .6 0 5 .8 0 6 .0 0 6 .2 0 6 .4 0 6 .6 0 6 .8 0 7 .0 0 7 .2 0 7 .4 0 7 .6 0 7 .8 0
5 0 0 0 0 0
1 0 0 0 0 0 0
1 5 0 0 0 0 0
2 0 0 0 0 0 0
2 5 0 0 0 0 0
3 0 0 0 0 0 0
3 5 0 0 0 0 0
4 0 0 0 0 0 0
4 5 0 0 0 0 0
5 0 0 0 0 0 0
5 5 0 0 0 0 0
6 0 0 0 0 0 0
6 5 0 0 0 0 0
7 0 0 0 0 0 0
7 5 0 0 0 0 0
8 0 0 0 0 0 0
8 5 0 0 0 0 0
T im e -->
A b u n d a n c e
T IC : 1 2 0 2 1 5 -5 .D \ d a ta .m s
1
2
34
Figure 42 Gas chromatography separation of (1) 4-methoxymethylene amphetamine (2) 4-
methoxymethylene methamphetamine (3) N-ethyl-4-methoxymethylene amphetamine (4) N, N-
dimethyl-4-methoxymethylene amphetamine on an Rtx-1 column
The retention time of 4-methoxymethylene amphetamine is 5.762 minute, the retention time
of 4-methoxymethylene methamphetamine is 6.019 minute, the retention time of 4-
methoxymethylene ethylamphetamine is 6.234 minute and that of 4-methoxymethylene
dimethylamphetamine is 6.322 minute. Thus, the 4-methoxymethylene amphetamine series
compounds can be nicely separated on column Rtx-1.
3.3.2 Mass spectra studies of the 4-methoxymethylene amphetamine series
This research studied the mass spectra of the 4-methoxymethylene amphetamine series
compounds for comparison and separation purposes under 70eV electronic ionization, the results
are shown in Figure 43.

64
4 0 5 0 6 0 7 0 8 0 9 0 1 0 0 1 1 0 1 2 0 1 3 0 1 4 0 1 5 0 1 6 0 1 7 0 1 8 0 1 9 00
5 0 0 0
1 0 0 0 0
1 5 0 0 0
2 0 0 0 0
2 5 0 0 0
3 0 0 0 0
3 5 0 0 0
4 0 0 0 0
4 5 0 0 0
5 0 0 0 0
5 5 0 0 0
6 0 0 0 0
6 5 0 0 0
m / z -->
A b u n d a n c e
S c a n 4 8 5 (5 .9 1 4 m in ): 1 2 0 2 1 5 -5 .D \ d a ta .m s4 4 .1
1 0 4 .1
9 1 .1
7 0 .1
1 3 5 .01 1 9 .15 8 .01 6 4 .11 4 8 .0 1 7 7 .0 1 9 1 .2
OCH3
NH2
CH3
1
4 0 5 0 6 0 7 0 8 0 9 0 1 0 0 1 1 0 1 2 0 1 3 0 1 4 0 1 5 0 1 6 0 1 7 0 1 8 0 1 9 0 2 0 0 2 1 00
2 0 0 0 0
4 0 0 0 0
6 0 0 0 0
8 0 0 0 0
1 0 0 0 0 0
1 2 0 0 0 0
1 4 0 0 0 0
1 6 0 0 0 0
1 8 0 0 0 0
2 0 0 0 0 0
2 2 0 0 0 0
2 4 0 0 0 0
2 6 0 0 0 0
2 8 0 0 0 0
3 0 0 0 0 0
3 2 0 0 0 0
3 4 0 0 0 0
m / z - - >
A b u n d a n c e
S c a n 5 0 0 ( 6 . 0 0 1 m in ) : 1 2 0 2 1 5 - 5 . D \ d a t a . m s5 8 . 1
9 1 . 14 4 . 11 0 4 . 1
7 7 . 1
1 1 9 . 1 1 3 5 . 11 7 8 . 11 6 2 . 1 1 9 2 . 11 4 8 . 1 2 0 7 . 0
OCH3
NH
CH3
CH32

65
4 0 5 0 6 0 7 0 8 0 9 0 1 0 0 1 1 0 1 2 0 1 3 0 1 4 0 1 5 0 1 6 0 1 7 0 1 8 0 1 9 0 2 0 0 2 1 00
5 0 0 0
1 0 0 0 0
1 5 0 0 0
2 0 0 0 0
2 5 0 0 0
3 0 0 0 0
3 5 0 0 0
4 0 0 0 0
4 5 0 0 0
5 0 0 0 0
5 5 0 0 0
6 0 0 0 0
6 5 0 0 0
m / z -->
A b u n d a n c e
S c a n 5 4 7 (6 .2 7 5 m in ): 1 2 0 2 1 5 -5 .D \ d a ta .m s7 2 .1
4 4 .1
5 8 .19 1 .1 1 0 4 .1
1 3 5 .11 1 9 .1
1 9 2 .21 6 1 .11 4 8 .2 2 0 5 .91 7 6 .7
OCH3
NH
CH3
CH3
3
4 0 5 0 6 0 7 0 8 0 9 0 1 0 0 1 1 0 1 2 0 1 3 0 1 4 0 1 5 0 1 6 0 1 7 0 1 8 0 1 9 0 2 0 0 2 1 00
1 0 0 0 0 0
2 0 0 0 0 0
3 0 0 0 0 0
4 0 0 0 0 0
5 0 0 0 0 0
6 0 0 0 0 0
7 0 0 0 0 0
8 0 0 0 0 0
9 0 0 0 0 0
1 0 0 0 0 0 0
1 1 0 0 0 0 0
1 2 0 0 0 0 0
1 3 0 0 0 0 0
1 4 0 0 0 0 0
1 5 0 0 0 0 0
1 6 0 0 0 0 0
1 7 0 0 0 0 0
1 8 0 0 0 0 0
m / z -->
A b u n d a n c e
S c a n 5 5 6 (6 .3 2 7 m in ): 1 2 0 2 1 5 -5 .D \ d a ta .m s7 2 .1
9 1 .14 2 .1 1 0 4 .15 6 .1
1 3 5 .11 1 9 .1 1 6 0 .1 1 9 2 .21 7 6 .2 2 0 6 .2
OCH3
N
CH3
CH3
CH3
4
Figure 43 EI mass spectra of the 4-methoxymethylene amphetamine series
The base peak of each one of the mass spectra is derived from the ionization of nitrogen
followed by α-cleavage. The base peak fragment structures of these four are shown in Figure 44.

66
CH3
NH2
CH3
NH
CH3
m/z 44
m/z 58
O
NH2
O
HN
O
HN
CH3
NH
CH3
m/z 72
O
N
CH3
N+
CH3
CH3
m/z 72
Figure 44 Base peak fragment structures of the 4-methoxymethylene amphetamine series under
EI mass spectrometry
The mass spectrum of 4-methoxymethylene N-ethylamphetamine show a certain abundance
of m/z 44, while the mass spectrum of 4-methoxymethylene N, N-dimethylamphetamine barely
shows any m/z 44 peak. The m/z 44 peak is generated from a 4-membered ring H-rearrangement
from the previous m/z 72 fragment, the most likely mechanism of this rearrangement is shown in
Figure 45. The difference of the m/z 44 peak abundance in these two compounds is because only
the N-ethylamine m/z 72 precursor has available β-hydrogen, which is required for the
occurrence of the 4-membered ring H-rearrangement.

67
CH3
NH
H
m/z 72
CH3
NH2
m/z 44
Figure 45 Mechanism proposed for the generation of m/z 44 fragment of 4-methoxymethylene
N-ethylamphetamine under mass spectrometry
Another characteristic of the mass spectra of the 4-methoxymethylene amphetamine series
compounds is that each spectrum shows the existence of the m/z 104 fragment. This is a
predominant difference from the mass spectra of the 4-ethoxy amphetamine series compounds
studied in previous work. The key characteristic of the mass spectra of the 4-ethoxy
amphetamine series compounds is the existence of the m/z 107 fragment, which is generated by
the mechanism shown in Figure 10.
Other than the structure information revealed by EI mass spectrometry discussed above, there
is not much other information shown. In fact, this is a prevalent characteristic of mass spectra of
regioisomer and isobaric amines related to MDA, MDMA, MDEA and MDMMA, generating
huge challenges for identification work.
3.4 GC-MS studies of the 4-methoxymethylene butanamine series compounds
3.4.1 GC separation of the 4-methoxymethylene butanamine series compounds
Gas chromatography separation of the 4-methoxymethylene butanamine series compounds
was carried out on an Rxi-50column. The column had a length of 30 meters, an internal
dimension of 0.25 mm and a stationary phase film thickness of 0.25 μm. The stationary phase
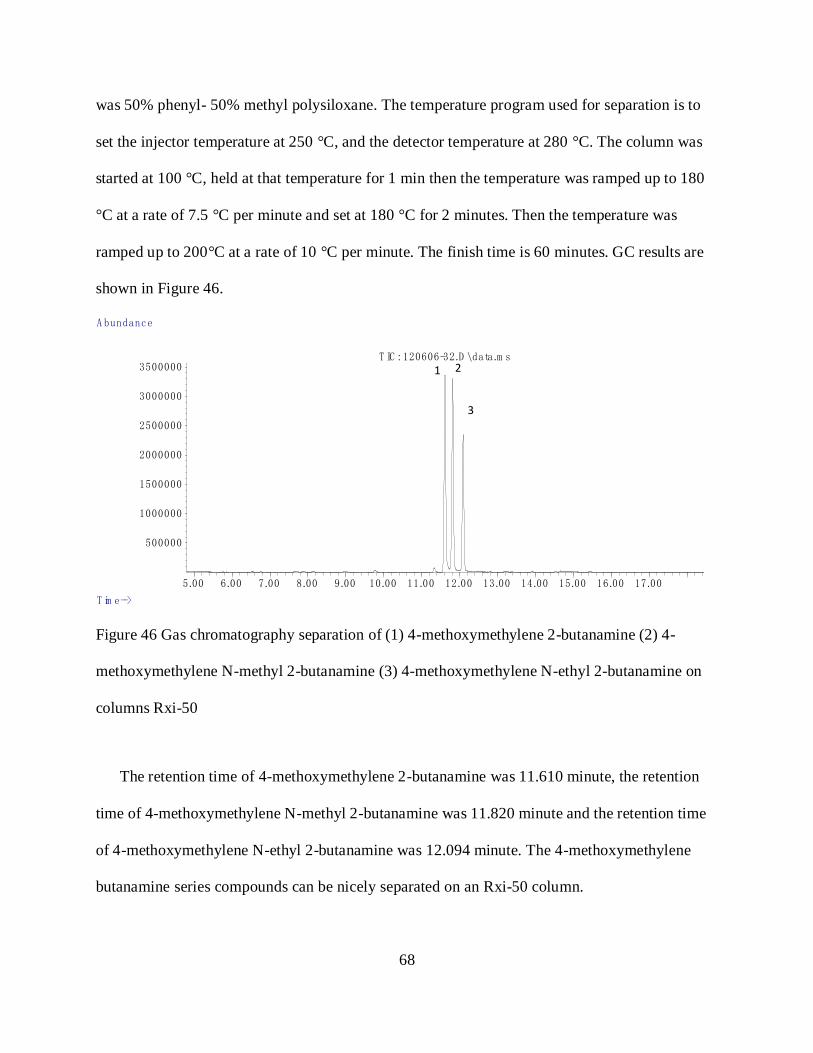
68
was 50% phenyl- 50% methyl polysiloxane. The temperature program used for separation is to
set the injector temperature at 250 °C, and the detector temperature at 280 °C. The column was
started at 100 °C, held at that temperature for 1 min then the temperature was ramped up to 180
°C at a rate of 7.5 °C per minute and set at 180 °C for 2 minutes. Then the temperature was
ramped up to 200°C at a rate of 10 °C per minute. The finish time is 60 minutes. GC results are
shown in Figure 46.
5.00 6.00 7.00 8.00 9.00 10.00 11.00 12.00 13.00 14.00 15.00 16.00 17.00
500000
1000000
1500000
2000000
2500000
3000000
3500000
T im e-->
A bundance
T IC : 120606-32.D \data.m s1 2
3
Figure 46 Gas chromatography separation of (1) 4-methoxymethylene 2-butanamine (2) 4-
methoxymethylene N-methyl 2-butanamine (3) 4-methoxymethylene N-ethyl 2-butanamine on
columns Rxi-50
The retention time of 4-methoxymethylene 2-butanamine was 11.610 minute, the retention
time of 4-methoxymethylene N-methyl 2-butanamine was 11.820 minute and the retention time
of 4-methoxymethylene N-ethyl 2-butanamine was 12.094 minute. The 4-methoxymethylene
butanamine series compounds can be nicely separated on an Rxi-50 column.
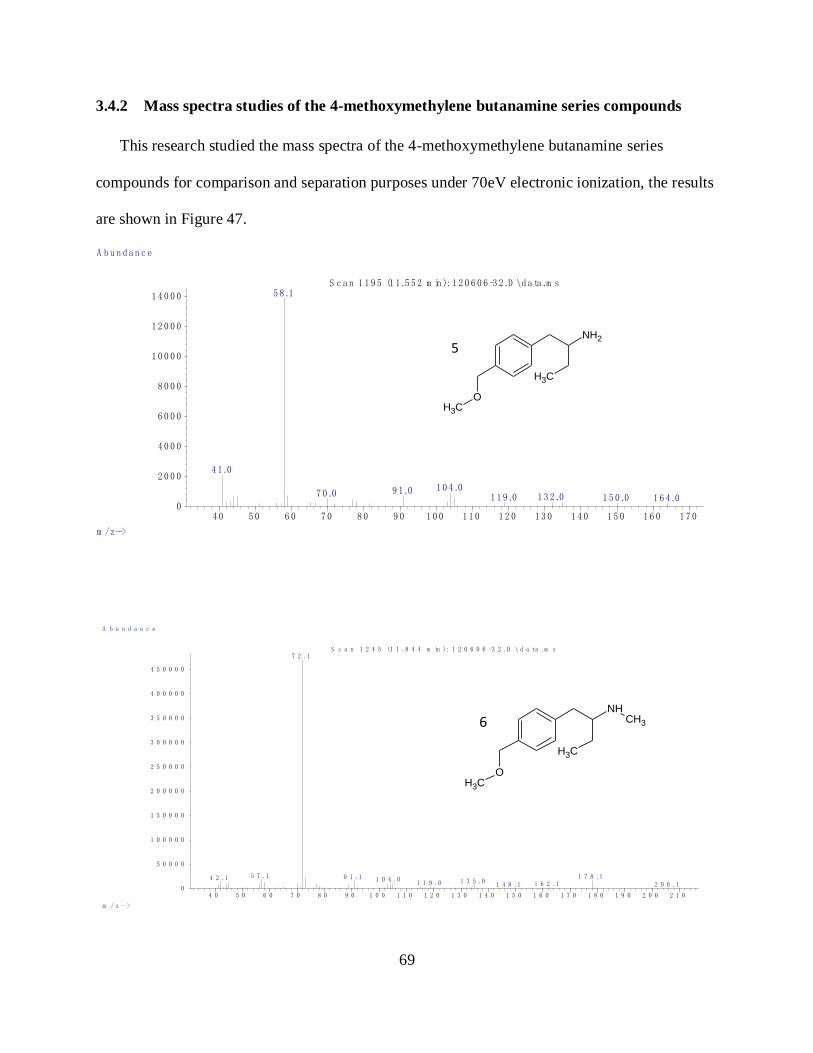
69
3.4.2 Mass spectra studies of the 4-methoxymethylene butanamine series compounds
This research studied the mass spectra of the 4-methoxymethylene butanamine series
compounds for comparison and separation purposes under 70eV electronic ionization, the results
are shown in Figure 47.
4 0 5 0 6 0 7 0 8 0 9 0 1 0 0 1 1 0 1 2 0 1 3 0 1 4 0 1 5 0 1 6 0 1 7 00
2 0 0 0
4 0 0 0
6 0 0 0
8 0 0 0
1 0 0 0 0
1 2 0 0 0
1 4 0 0 0
m /z-->
A b u n d a n c e
S c a n 1 1 9 5 (1 1 .5 5 2 m in ): 1 2 0 6 0 6 -3 2 .D \d a ta .m s5 8 .1
4 1 .0
1 0 4 .09 1 .07 0 .0 1 3 2 .01 1 9 .0 1 5 0 .0 1 6 4 .0
OCH3
NH2
CH3
5
4 0 5 0 6 0 7 0 8 0 9 0 1 0 0 1 1 0 1 2 0 1 3 0 1 4 0 1 5 0 1 6 0 1 7 0 1 8 0 1 9 0 2 0 0 2 1 00
5 0 0 0 0
1 0 0 0 0 0
1 5 0 0 0 0
2 0 0 0 0 0
2 5 0 0 0 0
3 0 0 0 0 0
3 5 0 0 0 0
4 0 0 0 0 0
4 5 0 0 0 0
m / z -->
A b u n d a n c e
S c a n 1 2 4 5 (1 1 .8 4 4 m in ): 1 2 0 6 0 6 -3 2 .D \ d a ta .m s7 2 .1
5 7 .1 1 7 8 .19 1 .14 2 .1 1 0 4 .0 1 3 5 .01 1 9 .0 1 6 2 .1 2 0 6 .11 4 8 .1
OCH3
NH
CH3
CH36

70
4 0 5 0 6 0 7 0 8 0 9 0 1 0 0 1 1 0 1 2 0 1 3 0 1 4 0 1 5 0 1 6 0 1 7 0 1 8 0 1 9 00
1 0 0 0
2 0 0 0
3 0 0 0
4 0 0 0
5 0 0 0
6 0 0 0
7 0 0 0
8 0 0 0
9 0 0 0
1 0 0 0 0
1 1 0 0 0
1 2 0 0 0
1 3 0 0 0
1 4 0 0 0
1 5 0 0 0
1 6 0 0 0
1 7 0 0 0
1 8 0 0 0
m / z -->
A b u n d a n c e
S c a n 1 2 9 8 (1 2 .1 5 3 m in ): 1 2 0 6 0 6 -3 2 .D \ d a ta .m s8 6 .1
5 8 .1
7 2 .1
4 1 .0
1 0 4 .01 9 2 .11 3 5 .0
1 1 9 .1 1 6 0 .0
OCH3
NH
CH3
CH3
7
Figure 47 Mass spectra of the 4-methoxymethylene butanamine series compounds
The base peak of each one of the mass spectra is derived from the ionization of nitrogen
followed by α-cleavage. The base peak fragment structures of these four compounds are shown
in Figure 48.

71
OCH3
NH2
CH3
OCH3
HN
CH3
CH3
OCH3
HN
CH3
CH3
NH2
CH3
NH
CH3
CH3
NH
CH3
CH3
m/z 58
m/z 72
m/z 86
Figure 48 Base peak fragment structures of the 4-methoxymethylene butanamine series
compounds under EI mass spectrometry
A major characteristic of the mass spectra of the 4-methoxymethylene butanamine series
compounds is that each spectrum shows the existence of the m/z 104 fragment. This is a
predominant difference from the mass spectra of the 4-ethoxy butanamine series compounds
studied in previous work. The key characteristic of the mass spectra of the 4-ethoxy
amphetamine series of compounds is the existence of an m/z 107 fragment, which is generated by
the mechanism shown in Figure 10.
Other than the structure information revealed by EI mass spectrometry discussed above, there
is not much other information shown. In fact, this is a prevalent characteristic of mass spectra of
regioisomer and isobaric amines related to MDA, MDMA, MDEA and MDMMA, generating
huge challenges for identification work.

72
From the study results, the major character of the mass spectra of the methoxymethylene ring
substituted phenethylamines is that each compound shows a certain amount of the m/z 104
fragment. This is very different from the unique m/z 107 peak we saw in the previous ethoxy
counterpart compounds. The difference reveals that the generation of both the m/z 104 fragment
and the m/z 107 fragment involves the oxygen on the ester side chain.
3.5 GC-MS analysis on HFBA derivatized 4-methoxymethylene phenethylamines:
compound 1-3 and 5-7
3.5.1 GC separation of the HFBA derivatized 4-methoxymethylene amphetamine series
and 4-methoxymethylene butanamine series
Gas chromatography separation of the 4-methoxymethylene amphetamine series of
compounds and the 4-methoxymethylene butanamine series of compounds were carried out
separately on Rtx-5 amine columns. The column has a length of 30 meters, an internal dimension
of 0.25 mm and a stationary phase film thickness of 0.25 μm. The stationary phase is 5%
diphenyl- 95% dimethyl polysiloxane. The temperature program used for separation is to set the
injector temperature at 250 °C, and the detector temperature at 280 °C. The column is started at
70 °C, held at that temperature for 1 minute then the temperature was ramped up to 250 °C at a
rate of 30 °C per minute and set at 250 °C for 5 minutes. The finish time is 20 minutes. GC
results are shown in Figure 49 and Figure 50.
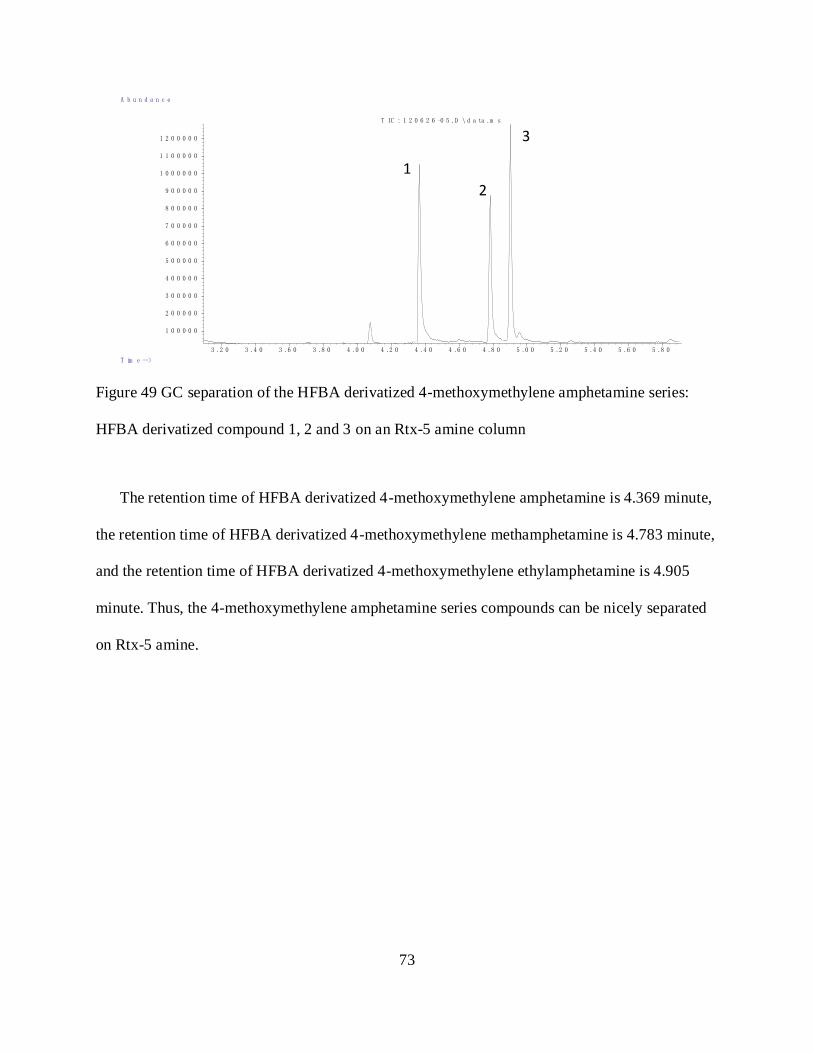
73
3 .2 0 3 .4 0 3 .6 0 3 .8 0 4 .0 0 4 .2 0 4 .4 0 4 .6 0 4 .8 0 5 .0 0 5 .2 0 5 .4 0 5 .6 0 5 .8 0
1 0 0 0 0 0
2 0 0 0 0 0
3 0 0 0 0 0
4 0 0 0 0 0
5 0 0 0 0 0
6 0 0 0 0 0
7 0 0 0 0 0
8 0 0 0 0 0
9 0 0 0 0 0
1 0 0 0 0 0 0
1 1 0 0 0 0 0
1 2 0 0 0 0 0
T im e -->
A b u n d a n c e
T IC : 1 2 0 6 2 6 -0 5 .D \ d a ta .m s
1
2
3
Figure 49 GC separation of the HFBA derivatized 4-methoxymethylene amphetamine series:
HFBA derivatized compound 1, 2 and 3 on an Rtx-5 amine column
The retention time of HFBA derivatized 4-methoxymethylene amphetamine is 4.369 minute,
the retention time of HFBA derivatized 4-methoxymethylene methamphetamine is 4.783 minute,
and the retention time of HFBA derivatized 4-methoxymethylene ethylamphetamine is 4.905
minute. Thus, the 4-methoxymethylene amphetamine series compounds can be nicely separated
on Rtx-5 amine.

74
3 . 5 0 4 . 0 0 4 . 5 0 5 . 0 0 5 . 5 0 6 . 0 0 6 . 5 0
5 0 0 0 0
1 0 0 0 0 0
1 5 0 0 0 0
2 0 0 0 0 0
2 5 0 0 0 0
3 0 0 0 0 0
3 5 0 0 0 0
4 0 0 0 0 0
4 5 0 0 0 0
5 0 0 0 0 0
5 5 0 0 0 0
6 0 0 0 0 0
6 5 0 0 0 0
T im e - - >
A b u n d a n c e
T I C : 1 2 0 6 2 6 - 0 9 . D \ d a t a . m s
5 6
7
Figure 50 GC separation of the HFBA derivatized 4-methoxymethylene butanamine series:
compound 5, 6 and 7 on an Rtx-5 amine column
The retention time of HFBA derivatized 4-methoxymethylene 2-butanamine is 4.643 minute,
the retention time of HFBA derivatized 4-methoxymethylene N-methyl 2-butanamine is 4.999
minute and the retention time of HFBA derivatized 4-methoxymethylene N-ethyl 2-butanamine
is 5.139 minute. The HFBA derivatized 4-methoxymethylene butanamine series compounds can
be nicely separated on column Rtx-5 amine.
3.5.2 Mass spectra studies of the HFBA derivatized 4-methoxymethylene amphetamine
series and 4-methoxymethylene butanamine series
This research studied the mass spectra of the HFBA derivatized 4-methoxymethylene
amphetamine series compounds and the HFBA derivatized 4-methoxymethylene butanamine
series for comparison and separation purposes under 70eV electronic ionization, the results are
shown in Figure 51 and Figure 55.
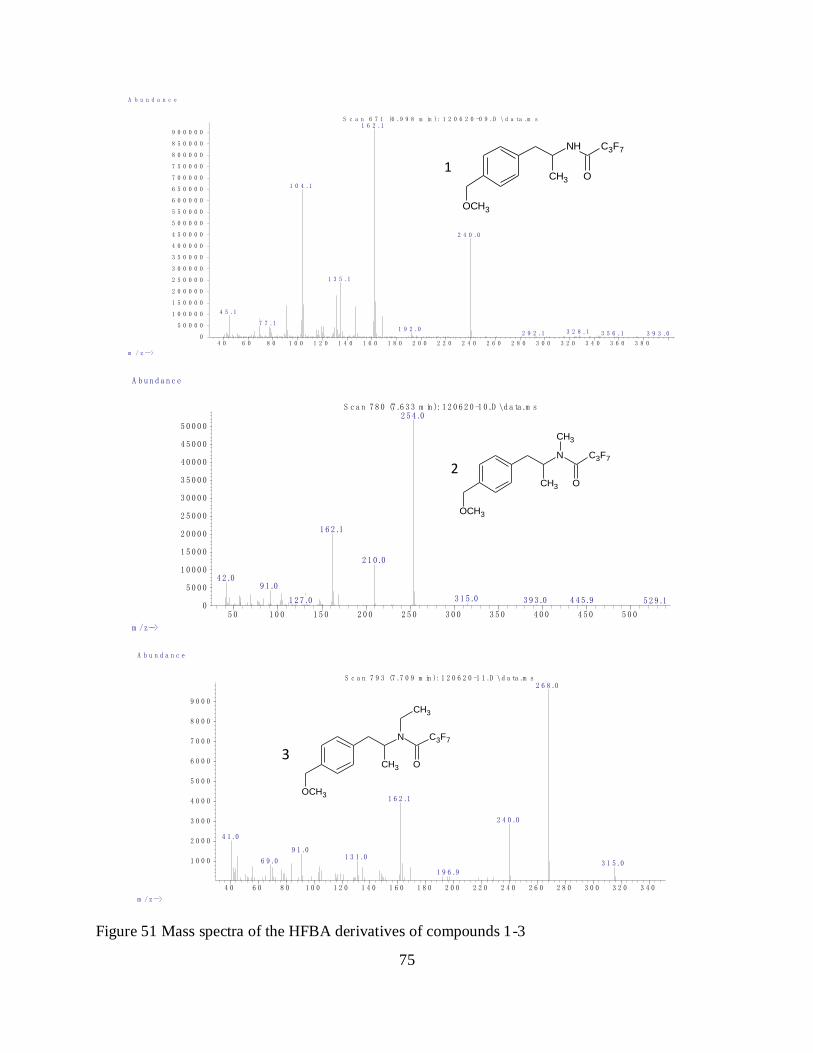
75
4 0 6 0 8 0 1 0 0 1 2 0 1 4 0 1 6 0 1 8 0 2 0 0 2 2 0 2 4 0 2 6 0 2 8 0 3 0 0 3 2 0 3 4 0 3 6 0 3 8 00
5 0 0 0 0
1 0 0 0 0 0
1 5 0 0 0 0
2 0 0 0 0 0
2 5 0 0 0 0
3 0 0 0 0 0
3 5 0 0 0 0
4 0 0 0 0 0
4 5 0 0 0 0
5 0 0 0 0 0
5 5 0 0 0 0
6 0 0 0 0 0
6 5 0 0 0 0
7 0 0 0 0 0
7 5 0 0 0 0
8 0 0 0 0 0
8 5 0 0 0 0
9 0 0 0 0 0
m / z -->
A b u n d a n c e
S c a n 6 7 1 (6 .9 9 8 m in ): 1 2 0 6 2 0 -0 9 .D \ d a ta .m s1 6 2 .1
1 0 4 .1
2 4 0 .0
1 3 5 .1
4 5 .1
7 7 .11 9 2 .0 3 2 8 .12 9 2 .1 3 5 6 .1 3 9 3 .0
OCH3
NH
CH3
C3F7
O1
5 0 1 0 0 1 5 0 2 0 0 2 5 0 3 0 0 3 5 0 4 0 0 4 5 0 5 0 00
5 0 0 0
1 0 0 0 0
1 5 0 0 0
2 0 0 0 0
2 5 0 0 0
3 0 0 0 0
3 5 0 0 0
4 0 0 0 0
4 5 0 0 0
5 0 0 0 0
m /z-->
A b u n d a n c e
S c a n 7 8 0 (7 .6 3 3 m in ): 1 2 0 6 2 0 -1 0 .D \d a ta .m s2 5 4 .0
1 6 2 .1
2 1 0 .0
4 2 .09 1 .0
3 1 5 .0 3 9 3 .0 4 4 5 .91 2 7 .0 5 2 9 .1
OCH3
N
CH3
C3F7
CH3
O
2
4 0 6 0 8 0 1 0 0 1 2 0 1 4 0 1 6 0 1 8 0 2 0 0 2 2 0 2 4 0 2 6 0 2 8 0 3 0 0 3 2 0 3 4 0
1 0 0 0
2 0 0 0
3 0 0 0
4 0 0 0
5 0 0 0
6 0 0 0
7 0 0 0
8 0 0 0
9 0 0 0
m / z -->
A b u n d a n c e
S c a n 7 9 3 (7 .7 0 9 m in ): 1 2 0 6 2 0 -1 1 .D \ d a ta .m s2 6 8 .0
1 6 2 .1
2 4 0 .0
4 1 .0
9 1 .01 3 1 .0
6 9 .0 3 1 5 .01 9 6 .9
OCH3
N
CH3
C3F7
CH3
O3
Figure 51 Mass spectra of the HFBA derivatives of compounds 1-3

76
The mass spectra of the HFBA derivatives of the 4-methoxymethylene amphetamine series
show several characteristic fragments in each compound that allow for identification. The HFBA
derivatized 4-methoxymethylene amphetamine (compound 1) shows unique peaks such as m/z
240, m/z 162 (base peak) and m/z 104. The formation of the m/z 240 fragment is an α-cleavage
followed by the ionization of the amine nitrogen, shown in Figure 52. The formation of the base
fragment m/z 162 is from the ionization of the acyl oxygen, followed by 6 membered ring
hydrogen rearrangement. Charge initiated hetero bond cleavage will generate the m/z 162
fragement, shown in Figure 53. The mechanism of the formation of the m/z 104 fragment was
discussed previously.
The HFBA derivatized 4-methoxymethylene methylamphetamine (compound 2) shows
unique peaks such as m/z 254(base peak), m/z 162 and m/z 210. The formation of base peak m/z
254 fragment is α-cleavage followed by the ionization of the amine nitrogen, shown in Figure 52.
Further 4 membered ring rearrangement of the fragment m/z 254 will yield the fragment m/z 210,
shown in Figure 54. The formation of m/z 162 is from the ionization of the acyl oxygen,
followed by 6 membered ring hydrogen rearrangement. Charge initiated hetero bond cleavage
will generate the m/z 162 fragement, shown in Figure 53.
The HFBA derivatized N-ethyl 4-methoxymethylene amphetamine (compound 3) shows
unique peaks such as m/z 268(base peak), m/z 162 and m/z 240. The formation of base peak m/z
268 fragment is α-cleavage followed by the ionization of the amine nitrogen, shown in Figure 52.
Since the ionized nitrogen center has available β-hydrogens, further 4-membered ring
rearrangement of the m/z 268 fragment will induce a loss of 28 mass units (C2H4) and generate
the m/z 240 fragment. The formation of m/z 162 is from the ionization of the acyl oxygen,

77
followed by 6 membered ring hydrogen rearrangement. Charge initiated hetero bond cleavage
will generate the m/z 162 fragement, shown in Figure 53.
OCH3
N
R1
C3F7
O
O
R1 N+ C3F7
R2
R2
Compound 1: R1= CH3 R2= H m/z=240Compound 2: R1= CH3 R2= CH3 m/z=254Compound 3: R1= CH3 R2= C2H5 m/z=268Compound 5: R1= C2H5 R2= H m/z=254Compound 6: R1= C2H5 R2= CH3 m/z=268Compound 7: R1= C2H5 R2 = C2H5 m/z=282
Figure 52 Formation of m/z 240, m/z 254, m/z 268 and m/z 282 fragments from perfluoroacyl
derivatives of compound 1-3 and compound 5-7
H
O
OCH3
N
R1
R
C3F7 OH
OCH3
HC N
R1
R
C3F7
OCH3
HC
R1
R1= CH3 m/z=162
R1= C2H5 m/z=176
Figure 53 Formation of m/z 162 from perfluoroacyl derivative of 4-methoxymethylene
amphetamine series and m/z 176 from perfluoroacyl derivative of 4-methoxymethylene
butanamine series

78
Compound 2: R=CH3 m/z=254Compound 6: R=C2H5 m/z=268
H3C
N+
C3F7
OR
H3C
N+
C3F7
O
R
H3C N+ C3F7
m/z= 210
Figure 54 Formation of m/z 210 fragments from m/z 254 of N-methyl compound 2 and m/z 268
of N-methyl compound 6
4 0 6 0 8 0 1 0 0 1 2 0 1 4 0 1 6 0 1 8 0 2 0 0 2 2 0 2 4 0 2 6 0 2 8 0 3 0 0 3 2 0 3 4 00
2 0 0 0
4 0 0 0
6 0 0 0
8 0 0 0
1 0 0 0 0
1 2 0 0 0
1 4 0 0 0
1 6 0 0 0
1 8 0 0 0
2 0 0 0 0
m / z -->
A b u n d a n c e
S c a n 7 2 6 (7 .3 1 8 m in ): 1 2 0 6 2 0 -1 2 .D \ d a ta .m s1 7 6 .1
1 0 4 .0
4 1 .0
1 3 5 .02 0 4 .0
2 5 4 .0
6 9 .0
3 1 5 .02 7 8 .0
OCH3
NH
CH3
C3F7
O5
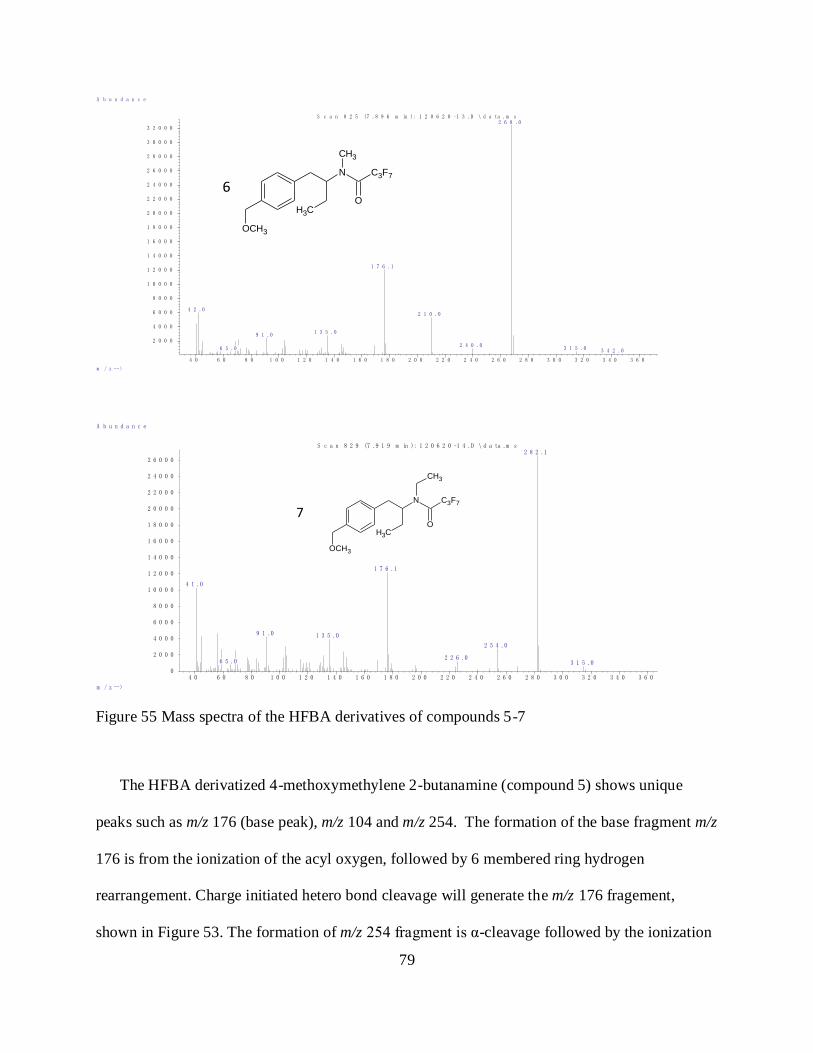
79
4 0 6 0 8 0 1 0 0 1 2 0 1 4 0 1 6 0 1 8 0 2 0 0 2 2 0 2 4 0 2 6 0 2 8 0 3 0 0 3 2 0 3 4 0 3 6 0
2 0 0 0
4 0 0 0
6 0 0 0
8 0 0 0
1 0 0 0 0
1 2 0 0 0
1 4 0 0 0
1 6 0 0 0
1 8 0 0 0
2 0 0 0 0
2 2 0 0 0
2 4 0 0 0
2 6 0 0 0
2 8 0 0 0
3 0 0 0 0
3 2 0 0 0
m / z -->
A b u n d a n c e
S c a n 8 2 5 (7 .8 9 6 m in ): 1 2 0 6 2 0 -1 3 .D \ d a ta .m s2 6 8 .0
1 7 6 .1
4 2 .02 1 0 .0
1 3 5 .09 1 .0
2 4 0 .03 1 5 .06 5 .0 3 4 2 .0
OCH3
N
CH3
C3F7
CH3
O
6
4 0 6 0 8 0 1 0 0 1 2 0 1 4 0 1 6 0 1 8 0 2 0 0 2 2 0 2 4 0 2 6 0 2 8 0 3 0 0 3 2 0 3 4 0 3 6 00
2 0 0 0
4 0 0 0
6 0 0 0
8 0 0 0
1 0 0 0 0
1 2 0 0 0
1 4 0 0 0
1 6 0 0 0
1 8 0 0 0
2 0 0 0 0
2 2 0 0 0
2 4 0 0 0
2 6 0 0 0
m / z -->
A b u n d a n c e
S c a n 8 2 9 (7 .9 1 9 m in ): 1 2 0 6 2 0 -1 4 .D \ d a ta .m s2 8 2 .1
1 7 6 .1
4 1 .0
9 1 .0 1 3 5 .0
2 5 4 .0
2 2 6 .06 5 .0 3 1 5 .0
OCH3
N
CH3
C3F7
CH3
O
7
Figure 55 Mass spectra of the HFBA derivatives of compounds 5-7
The HFBA derivatized 4-methoxymethylene 2-butanamine (compound 5) shows unique
peaks such as m/z 176 (base peak), m/z 104 and m/z 254. The formation of the base fragment m/z
176 is from the ionization of the acyl oxygen, followed by 6 membered ring hydrogen
rearrangement. Charge initiated hetero bond cleavage will generate the m/z 176 fragement,
shown in Figure 53. The formation of m/z 254 fragment is α-cleavage followed by the ionization
80
of the amine nitrogen, shown in Figure 52.The mechanism of the formation of the m/z 104
fragment was discussed previously.
The HFBA derivatized 4-methoxymethylene N-methyl 2-butanamine (compound 6) shows
unique peaks such as m/z 176, m/z 268 (base peak) and m/z 210. The formation of the base peak
m/z 268 fragment is due to α-cleavage followed by the ionization of the amine nitrogen, shown in
Figure 52. Further 4 membered ring rearrangement of the fragment m/z 268 will yield the
fragment m/z 210, shown in Figure 54. The formation of m/z 176 is from the ionization of the
acyl oxygen, followed by 6 membered ring hydrogen rearrangement. Charge initiated hetero
bond cleavage will generate the m/z 176 fragement, shown in Figure 53.
The HFBA derivatized 4-methoxymethylene N-ethyl 2-butanamine (compound 3) shows
unique peaks such as m/z 282(base peak), m/z 176 and m/z 254. The formation of base peak m/z
282 fragment is due to α-cleavage followed by the ionization of the amine nitrogen, shown in
Figure 52. Since the ionized nitrogen center has available β-hydrogens, further 4-membered ring
rearrangement of the m/z 282 fragment will induce a loss of 28 mass units (C2H4) and generate
the m/z 254 fragment. The formation of m/z 176 is from the ionization of the acyl oxygen,
followed by 6 membered ring hydrogen rearrangement. Charge initiated hetero bond cleavage
will generate the m/z 176 fragement, shown in Figure 53.

81
4. Experimental
4.1 Materials, Instruments, GC-Columns and Temperature Programs
4.1.1 Materials
Analysis comparison compound 4-ethoxybenzaldehyde as well as most of the synthesis
materials, such as Red-Al sodium bis (2-methoxyethoxy) aluminum hydride solution in toluene,
Nitroethane, 1-nitropropane, methylamine hydrochloride, ethylamine hydrochloride,
dimethylamine hydrochloride, chromium (VI) oxide, sodium stick, iron powder and sodium
cyanoborohydride, were purchased from Aldrich chemical company (Milwaukee, WI, USA).
4-Chloromethylbenzoyl chloride was purchased from TCI America (Portland, OR, USA).
Pyridine and sodium sulfate (anhydrous) were purchased from EMD chemicals, USA
(Gibbstown, NJ, USA). Potassium hydroxide pellets was purchased from Acros Organics
(Morris Plains, NJ, USA). Iron (III) chloride anhydrous and ammonium acetate were purchased
from Sigma-Aldrich Company (St. Louis, MO, USA). Celite was purchased from Fisher
Scientific (Fair Lawn, NJ, USA).
Organic solvents such as HPLC grade acetonitrile, methylene chloride, methanol, and toluene
were purchased from Fisher Scientific Company (Atlanta, GA, USA). Benzene was purchased
from Fisher Scientific (Fair Lawn, NJ, USA).

82
Silica gel was purchased from Natland International Corporation (Research Triangle Park,
NC).
4.1.2 Instruments
GC-MS analysis of targets compounds and related intermediates were performed using a
7890A gas chromatograph with an auto injector 7683B, coupled with a mass selective detector
5975C VL, purchased from Agilent Technologies (Santa Clara, CA). The GC was operated in
splitless mode under a constant helium (grade 5) flow with a rate at 0.7 mL/min. The GC column
head pressure is 10 psi. The GC injector was maintained at 250 °C and the transfer temperature is
280 °C. The MS detector operated in the electron impact (EI) mode with an ionization voltage of
70 eV and a source temperature of 230 °C. The MS has a scan rate at 2.86 scans/s.
GC-TOF analysis was performed by a gas chromatograph with an auto injector 7683B,
coupled with a Waters GCT Premier benchtop orthogonal acceleration time-of flight (oa-TOF)
mass spectrometer, located in the Mass Spectrometry Center, Auburn University. The GC-TOF
was purchased from Agilent Technologies (Santa Clara, CA). An accurate mass method was
used to confirm the elemental composition of target fragments. The TOF detector compares
exact mass of calculated model and the measured mass, the theoretical acceptable deviation is 5
ppm. Isotope marking was also adopted to confirm the elemental composition of specific
fragments.
4.1.3 GC-Columns
GC-Columns used for analytical separations related to this research are listed in Table 7. All
GC-Columns were purchased from Restek Corporation (Bellefonte, PA, USA). All the columns

83
are 30 meters long with 0.25 mm internal dimension and coated with 0.25 μm silicone complex
film.
Table 7 List of GC-Columns and their stationary phase composition
Column Name Column Composition
Rtx-1 100% Dimethyl Polysiloxane
Rtx-35 35% Diphenyl- 65% Dimethyl Polysiloxane
Rtx-50 50% Phenyl- 10% Methyl Polysiloxane
Rxi-50 50% Phenyl- 50% Methyl Polysiloxane
Rtx-200 100% Trifluoropropyl Methyl Ploysiloxane
Rtx-5 Sil 5% Diphenyl- 95% Dimethyl Polysiloxane
Rtx-5 Amine 5% Diphenyl- 95% Dimethyl Polysiloxane
4.1.4 Temperature Programs
To get the best analytical and separation results, the following temperature programs were
used during this research period.
Temperature program 1: injector temperature at 250 °C, detector temperature at 280 °C.
Initial temperature for column is 70 °C, hold that temperature for 1 minute then the temperature
was ramped up to 250 °C at a rate of 30 °C per minute and set at 250 °C for 5 minutes. The
finish time is 20 minutes.
Temperature program 2: injector temperature at 250 °C, detector temperature at 280 °C.
Column is started at 100 °C, hold that temperature for 1 min then the temperature was ramped up

84
to 180 °C at a rate of 7.5 °C per minute and set at 180 °C for 2 minutes. Then the temperature
was ramped up to 200°C at a rate of 10 °C per minute. The finish time is 60 minutes.
4.2 Synthesis of 4-methoxymethylene benzaldehyde
Sodium metal weighing 1.83 g (80 mmol) was cut into small pieces and placed in a 3 neck
flask, and then methanol was added under nitrogen. 4-Chloromethylbenzyl chloride (5 g, 26.4
mmol) dissolved in methanol was added drop wise into that 3 neck flask. The resulting mixture
was refluxed for 3 hours then the mixture was cooled to room temperature. The mixture was
further cooled in an ice bath and 6 mL 12 M aqueous hydrochloride (80 mmol) was added drop
wise. The methanol was evaporated using a rotary evaporator and the resulting aqueous residue
was extracted with methylene chloride. The organic layer was dried with sodium sulfate and then
evaporated under reduced pressure to remove methylene chloride. The product methyl 4-
methoxymethyl benzoate was obtained as a light yellow oil.
A solution of 5 g methyl 4-(methoxymethyl) benzoate (0.028 mol) in 80 ml benzene was
added to a 500 ml three neck flask and stirred at room temperature under nitrogen. A syringe was
used to inject 10 mL of sodium bis (2-methoxyethoxy) aluminum hydride (Red-Al) solution in
toluene (65% wt) slowly into the reaction solution through a rubber septum fitted to one neck of
the flask. The resulting solution was stirred overnight at room temperature.
The excess Red-Al was relinquished by the consecutive addition of 14 mL 2M sodium
hydroxide solution, 28 mL water and 42 mL 2M sodium hydroxide solution. The resulting
precipitated aluminum salts were removed by filtration and the filtrate was evaporated under
vacuum to remove the benzene. The remaining solution was extracted with methylene chloride
and the organic layer was dried with sodium sulfate and then evaporated under reduced pressure

85
to remove methylene chloride. The target product 4-methoxymethyl benzylalcohol was obtained
as light yellow oil.
4.3 Synthesis of 4-methoxymethylene benzyl aldehyde
Chromium trioxide (50 g, 0.5 mol) was added rapidly with stirring to 92 mL of 6 M
hydrochloric acid solution. After 5 minute, the homogenous solution was cooled to 0 °C and 35g
of pyridine (0.5 mol) was carefully added over 10 minutes. Cooling the mixture to 0 °C over an
ice bath again resulted in the formation of a yellow orange solid precipitate. The solid was
collected by filtration and dried over vacuum for one hour to give dry pyridinium
chlorochromate (PCC).
A solution of 5 g of 4-methoxymethyl benzyl alcohol (0.033 mol) was dissolved in 100 mL
of methylene chloride in a 250 mL round bottle flask. To the stirring solution was added 10.80 g
of freshly made pyridinium chlorochromate (0.05 mol) and 10.80 g celite. The resulting mixture
was stirred at room temperature for 3 hours.
The reaction mixture was filtered through a bed of silica gel in a Buchner funnel and then the
filtrate was evaporated under reduced pressure to get a yellow liquid, 4-methoxymethylene
benzaldehyde as a crude product. Kugelrohr distillation of the crude product gave a purified
yellow oil, 4-methoxymethylene benzaldehyde, molecular formula: C9H10O2, molecular mass
150 g/mol.

86
4.4 Synthesis of 4-methoxymethylene phenylacetone
4.4.1 Synthesis of 4-methoxymethylene phenyl 2-nitropropene
4-Methoxymethylene benzaldehyde (5.0 g, 0.033 mol) was dissolved in 80 mL benzene in a
250 mL round bottom flask, followed by the addition of 8mL of n-butylamine (0.11 mol). The
reaction mixture was refluxed overnight using a Dean Stark trap to remove water. Cooling the
reaction mixture to room temperature and the solvent was evaporated under reduced pressure to
give the crude imine intermediate yellow oil. The imine intermediate was dissolved in 20ml of
glacial acetic acid in a 250 mL round bottom flask, and 8 mL of nitroethane (0.11 mol) was
added drop wise. The resulting reaction mixture was refluxed for one hour. During reflux, yellow
green crystals of 4-methoxymethylene phenyl 2-nitropropene were formed in the reaction
mixture. After the reaction, another 25 ml of glacial acetic acid was added to the reaction mixture
which was then cooled down to room temperature on an ice bath. The reaction mixture was
poured over crushed ice and was acidify the mixture to pH 1 using concentrated hydrochloric
acid. Yellow green crystals of 4-methoxymethylene phenyl 2-nitropropene were isolated by
vacuum filtration, washed with water, air dried for further use.
4.4.2 Synthesis of 4-methoxymethylene phenylacetone
4-Methoxymethylene phenyl 2-nitropropene (3.0 g, 0.014 mol) was dissolved in 15 mL
toluene and 15 mL water in a 250 mL round bottle flask. The resulting solution was mixed with
4.5 g powdered iron (0.08 mol); 0.9 g ferric chloride (0.006 mol) and 6 mL concentrated
hydrochloric acid. The mixture was stirred vigorously and refluxed over a day. After cooled to
room temperature, 30 mL toluene and 30 mL water was added and the mixture was filtered under
reduced pressure. The precipitate was washed with additional toluene and water. The toluene

87
layer was separated, and washed with 6M hydrochloric acid, water and saturated sodium
bicarbonate solution. The organic layer was dried over sodium sulfate, filtered and the solvent
was evaporated to give dark brown crude product 4-methoxymethylene phenylacetone.
Kugelrohr distillation of the crude product gave purified yellow oil 4-methoxymethylene
phenylacetone, molecular formula: C11H14O2, molecular mass 178 g/mol.
4.5 Synthesis of the 4-methoxymethylene amphetamine series compounds
4.5.1 Synthesis of 4-methoxymethylene amphetamine
4-Methoxymethylene phenylacetone (0.5 g, 0.0028 mol) was dissolved in 25 mL methanol,
and then 2.165 g of ammonium acetate (0.028 mol) and 1.765 g of sodium cyanoborohydride
(0.028 mol) were added to the stirring solution. The reaction mixture was stirred at room
temperature for three days and the mixture pH was maintained at 7 by adding concentrated
hydrochloric acid. The reaction mixture was then evaporated under reduced pressure to yield a
white solid residue. The residue was suspended in 40 mL cold water, and slowly acidified by the
addition of concentrated hydrochloric acid. The resulting solution mixture was stirred under
room temperature over night. After that the aqueous acidic solution was washed with methylene
chloride. The aqueous layer was separated and alkalized by the addition of potassium hydroxide
pellets. The aqueous basic suspension was extracted with methylene chloride and the organic
layer wad dried with sodium sulfate. The organic layer was evaporated under reduced pressure to
give 4-methoxymethylene amphetamine as light yellow oil. The product has a molecular formula
of C11H17NO and a molecular mass of 179 g/mol.

88
4.5.2 Synthesis of 4-methoxymethylene methamphetamine
4-Methoxymethylene phenylacetone (0.5 g, 0.0028 mol) was dissolved in 25 mL methanol,
and then 1.875g of methylamine hydrochloride (0.028 mol) and 1.765 g of sodium
cyanoborohydride (0.028 mol) were added to the stirring solution. The reaction mixture was
stirred at room temperature for three days and the mixture pH was maintained at 7 by adding
concentrated hydrochloric acid. The reaction mixture was then evaporated under reduced
pressure to yield a white solid residue. The residue was suspended in 40 mL cold water, and
slowly acidified by the addition of concentrated hydrochloric acid. The resulting solution
mixture was stirred under room temperature over night. After that the aqueous acidic solution
was washed with methylene chloride. The aqueous layer was separated and alkalized by the
addition of potassium hydroxide pellets. The aqueous basic suspension was extracted with
methylene chloride and the organic layer wad dried with sodium sulfate. The organic layer was
evaporated under reduced pressure to give 4-methoxymethylene methamphetamine as light
yellow oil. The product has a molecular formula of C12H19NO and a molecular mass of 193
g/mol.
4.5.3 Synthesis of 4-methoxymethylene ethylamphetamine
4- Methoxymethylene phenylacetone (0.5 g, 0.0028 mol) was dissolved in 25 mL methanol,
and then 2.29 g of ethylamine hydrochloride (0.028 mol) and 1.765 g of sodium
cyanoborohydride (0.028 mol) were added to the stirring solution. The reaction mixture was
stirred at room temperature for three days and the mixture pH was maintained at 7 by adding
concentrated hydrochloric acid. The reaction mixture was then evaporated under reduced
pressure to yield a white solid residue. The residue was suspended in 40 mL cold water, and
slowly acidified by the addition of concentrated hydrochloric acid. The resulting solution

89
mixture was stirred under room temperature over night. After that the aqueous acidic solution
was washed with methylene chloride. The aqueous layer was separated and alkalized by the
addition of potassium hydroxide pellets. The aqueous basic suspension was extracted with
methylene chloride and the organic layer wad dried with sodium sulfate. The organic layer was
evaporated under reduced pressure to give 4-methoxymethylene ethylamphetamine as light
yellow oil. The product has a molecular formula of C13H21NO and a molecular mass of
207g/mol.
4.5.4 Synthesis of 4-methoxymethylene dimethylamphetamine
4-Methoxymethylene phenylacetone (0.5 g, 0.0028 mol) was dissolved in 25 mL methanol,
and then 2.29 g of dimethylamine hydrochloride (0.028 mol) and 1.765 g of sodium
cyanoborohydride (0.028 mol) were added to the stirring solution. The reaction mixture was
stirred at room temperature for three days and the mixture pH was maintained at 7 by adding
concentrated hydrochloric acid. The reaction mixture was then evaporated under reduced
pressure to yield a white solid residue. The residue was suspended in 40 mL cold water, and
slowly acidified by the addition of concentrated hydrochloric acid. The resulting solution
mixture was stirred under room temperature over night. After that the aqueous acidic solution
was washed with methylene chloride. The aqueous layer was separated and alkalized by the
addition of potassium hydroxide pellets. The aqueous basic suspension was extracted with
methylene chloride and the organic layer wad dried with sodium sulfate. The organic layer was
evaporated under reduced pressure to give 4-methoxymethylene dimethylamphetamine as light
yellow oil. The product has a molecular formula of C13H21NO and a molecular mass of 207
g/mol.

90
4.6 Synthesis of 4-methoxymethylene phenyl-2-butanone
4.6.1 Synthesis of 4-methoxymethylene phenyl 2-nitrobutene
4-Methoxymethylene benzaldehyde (5.0 g, 0.033 mol) was dissolved in 80 mL benzene in a
250 mL round bottom flask, followed by the addition of 8 mL of n-butylamine (0.11 mol). The
reaction mixture was refluxed overnight using a Dean Stark trap to remove water. Cooling the
reaction mixture to room temperature and the solvent was evaporated under reduced pressure to
give the crude imine intermediate yellow oil. The imine intermediate was dissolved in 20ml of
glacial acetic acid in a 250 mL round bottom flask, and 10 mL nitropropane (0.11 mol) was
added drop wise. The resulting reaction mixture was refluxed for one hour. During reflux, yellow
green oil of 4-methoxymethylene phenyl 2-nitrobutene were formed in the reaction mixture.
After the reaction, another 25ml of glacial acetic acid was added to the reaction mixture which
was then cooled down to room temperature on an ice bath. The reaction mixture was poured over
crushed ice and was acidify the mixture to pH 1 using concentrated hydrochloric acid. The
resulting solution was extracted with methylene chloride and the organic layer was dried with
sodium sulfate. The methylene chloride was removed under vacuum evaporator to give green oil
of 4-methoxymethylene phenyl 2-nitrobutene product.
4.6.2 Synthesis of 4-methoxymethylene phenyl-2-butanone
4-Methoxymethylene phenyl 2-nitrobutene (3.0 g, 0.014 mol) was dissolved in 15 mL
toluene and 15 mL water in a 250 mL round bottle flask. The resulting solution was mixed with
4.5 g powdered iron (0.08 mol); 0.9g ferric chloride (0.006 mol) and 6 mL concentrated
hydrochloric acid. The mixture was stirred vigorously and refluxed over a day. After cooled to
room temperature, 30 mL toluene and 30 mL water was added and the mixture was filtered under

91
reduced pressure. The precipitate was washed with additional toluene and water. The toluene
layer was separated, and washed with 6 M hydrochloric acid, water and saturated sodium
bicarbonate solution. The organic layer was dried over sodium sulfate, filtered and the solvent
was evaporated to give dark brown crude product 4-methoxymethylene phenyl-2-butanone.
Kugelrohr distillation of the crude product gave purified yellow oil 4-methoxymethylene phenyl-
2-butanone, molecular formula: C12H16O2, molecular mass 192 g/mol.
4.7 Synthesis of the 4-methoxymethylene butanamine series compounds
4.7.1 Synthesis of 4-methoxymethylene butanamine
4-Methoxymethylene phenyl-2-butanone (0.5 g, 0.0028 mol) was dissolved in 25 mL
methanol, and then 2.007 g of ammonium acetate (0.026 mol) and 1.765g of sodium
cyanoborohydride (0.028 mol) were added to the stirring solution. The reaction mixture was
stirred at room temperature for three days and the mixture pH was maintained at 7 by adding
concentrated hydrochloric acid. The reaction mixture was then evaporated under reduced
pressure to yield a white solid residue. The residue was suspended in 40 mL cold water, and
slowly acidified by the addition of concentrated hydrochloric acid. The resulting solution
mixture was stirred under room temperature over night. After that the aqueous acidic solution
was washed with methylene chloride. The aqueous layer was separated and alkalized by the
addition of potassium hydroxide pellets. The aqueous basic suspension was extracted with
methylene chloride and the organic layer wad dried with sodium sulfate. The organic layer was
evaporated under reduced pressure to give 4-methoxymethylene butanamine as light yellow oil.
The product has a molecular formula of C12H19NO and a molecular mass of 193 g/mol.
92
4.7.2 Synthesis of 4-methoxymethylene N-methyl butanamine
4-Methoxymethylene phenyl-2-butanone (0.5 g, 0.0028 mol) was dissolved in 25 mL
methanol, and then 1.738g of methylamine hydrochloride (0.026 mol) and 1.765g of sodium
cyanoborohydride (0.028 mol) were added to the stirring solution. The reaction mixture was
stirred at room temperature for three days and the mixture pH was maintained at 7 by adding
concentrated hydrochloric acid. The reaction mixture was then evaporated under reduced
pressure to yield a white solid residue. The residue was suspended in 40 mL cold water, and
slowly acidified by the addition of concentrated hydrochloric acid. The resulting solution
mixture was stirred under room temperature over night. After that the aqueous acidic solution
was washed with methylene chloride. The aqueous layer was separated and alkalized by the
addition of potassium hydroxide pellets. The aqueous basic suspension was extracted with
methylene chloride and the organic layer wad dried with sodium sulfate. The organic layer was
evaporated under reduced pressure to give 4-methoxymethylene N-methyl butanamine as light
yellow oil. The product has a molecular formula of C13H21NO and a molecular mass of 207
g/mol.
4.7.3 Synthesis of 4-methoxymethylene N-ethyl butanamine
4-Methoxymethylene phenyl-2-butanone (0.5 g, 0.0028 mol) was dissolved in 25 mL
methanol, and then 2.124 g of ethylamine hydrochloride (0.026 mol) and 1.765g of sodium
cyanoborohydride (0.028 mol) were added to the stirring solution. The reaction mixture was
stirred at room temperature for three days and the mixture pH was maintained at 7 by adding
concentrated hydrochloric acid. The reaction mixture was then evaporated under reduced
pressure to yield a white solid residue. The residue was suspended in 40 mL cold water, and
slowly acidified by the addition of concentrated hydrochloric acid. The resulting solution

93
mixture was stirred under room temperature over night. After that the aqueous acidic solution
was washed with methylene chloride. The aqueous layer was separated and alkalized by the
addition of potassium hydroxide pellets. The aqueous basic suspension was extracted with
methylene chloride and the organic layer wad dried with sodium sulfate. The organic layer was
evaporated under reduced pressure to give 4-methoxymethylene N-ethyl butanamine as light
yellow oil. The product has a molecular formula of C14H23NO and a molecular mass of 221
g/mol.
4.7.4 Synthesis of 4-methoxymethylene N, N-dimethyl butanamine
4-Methoxymethylene phenyl-2-butanone (0.5 g, 0.0028 mol) was dissolved in 25 mL
methanol, and then 2.124 g dimethylamine hydrochloride (0.026 mol) and 1.765 g of sodium
cyanoborohydride (0.028 mol) were added to the stirring solution. The reaction mixture was
stirred at room temperature for three days and the mixture pH was maintained at 7 by adding
concentrated hydrochloric acid. The reaction mixture was then evaporated under reduced
pressure to yield a white solid residue. The residue was suspended in 40 mL cold water, and
slowly acidified by the addition of concentrated hydrochloric acid. The resulting solution
mixture was stirred under room temperature over night. After that the aqueous acidic solution
was washed with methylene chloride. The aqueous layer was separated and alkalized by the
addition of potassium hydroxide pellets. The aqueous basic suspension was extracted with
methylene chloride and the organic layer wad dried with sodium sulfate. The organic layer was
evaporated under reduced pressure to give 4-methoxymethylene N, N-dimethyl butanamine as
light yellow oil. The product has a molecular formula of C14H23NO and a molecular mass of 221
g/mol.

94
4.8 Synthesis of deuterium labeled 4-methoxymethylene benzyl aldehyde
4.8.1 Synthesis of deuterium labeled methyl 4-methoxymethyl benzoate
Sodium metal weighing 1.83 g (80 mmol) was cut into small pieces and placed in a 3 neck
flask, and then deuterited methanol was added under nitrogen. 5 g (26.4 mmol) of 4-
chloromethylbenzyl chloride was dissolved in deuterited methanol was added drop wise into that
3 neck flask. The resulting mixture was refluxed for 3 hours then the mixture was cooled to room
temperature. The mixture was further cooled in an ice bath and 6 mL of aqueous hydrochloride
(80 mmol) was added drop wise. The deuterited methanol was evaporated using a rotary
evaporator and the resulting aqueous residue was extracted with methylene chloride. The organic
layer was dried with sodium sulfate and then evaporated under reduced pressure to remove
methylene chloride. The product methyl 4-methoxymethyl benzoate with two methyl group
labeled with deuterium was obtained as light yellow oil.
4.8.2 Synthesis of deuterium labeled 4-methoxymethyl benzyl alcohol
A solution of 5 g D-labeled methyl 4-(methoxymethyl) benzoate (0.028 mol) in 80ml
benzene was added to a 500 ml three neck flask and stirred at room temperature under nitrogen.
A syringe was used to inject 10 mL of sodium bis (2-methoxyethoxy) aluminum hydride (Red-
Al) solution in toluene (65% wt) slowly into the reaction solution through a rubber septum fitted
to one neck of the flask. The resulting solution was stirred overnight at room temperature.
The excess Red-Al was relinquished by the consecutive addition of 14 mL 2 M sodium
hydroxide solution, 28 mL water and 42 mL 2 M sodium hydroxide solution. The resulting
precipitated aluminum salts were removed by filtration and the filtrate was evaporated under
vacuum remove the benzene. The remaining solution was extracted with methylene chloride and

95
the organic layer was dried with sodium sulfate and then evaporated under reduced pressure to
remove methylene chloride. The target product D-labeled 4-methoxymethyl benzylalcohol was
obtained as light yellow oil.
4.8.3 Synthesis of deuterium labeled 4-methoxymethylene benzyl aldehyde
Chromium trioxide (50 g, 0.5 mol) was added rapidly with stirring to 92 mL of 6 M
hydrochloric acid solution. After 5 minute, the homogenous solution was cooled to 0 °C and 35g
of pyridine (0.5 mol) was carefully added over 10 minutes. Cooling the mixture to 0 °C over an
ice bath again resulted in the formation of a yellow orange solid precipitate. The solid was
collected by filtration and dried over vacuum for one hour to give dry pyridinium
chlorochromate (PCC).
4.8.4 Synthesis of deuterium labeled 4-methoxymethylene benzaldehyde
A solution of 5 g of D-labeled 4-methoxymethyl benzyl alcohol (0.033 mol) was dissolved in
100 mL of methylene chloride in a 250 mL round bottle flask. To the stirring solution was added
10.80 g of freshly made pyridinium chlorochromate (0.05 mol) and 10.80 g celite. The resulting
mixture was stirred at room temperature for 3 hours.
The reaction mixture was filtered through a bed of silica gel in a Buchner funnel and then the
filtrate was evaporated under reduced pressure to get a yellow liquid, labeled 4-
methoxymethylene benzaldehyde as a crude product. Kugelrohr distillation of the crude product
gave purified yellow oil, labeled 4-methoxymethylene benzaldehyde, molecular formula:
C9H7D3O2, molecular mass 153 g/mol.
96
4.8.5 Synthesis of deuterium labeled 4-methoxymethylene phenylacetone
4.8.5.1 Synthesis of deuterium labeled 4-methoxymethylene phenyl 2-nitropropene
D-labeled 4-methoxymethylene benzaldehyde (5.0 g, 0.033 mol) was dissolved in 80 mL
benzene in a 250 mL round bottom flask, followed by the addition of 8mL of n-butylamine (0.11
mol). The reaction mixture was refluxed overnight using a Dean Stark trap to remove water.
Cooling the reaction mixture to room temperature and the solvent was evaporated under reduced
pressure to give the crude imine intermediate yellow oil. The imine intermediate was dissolved
in 20ml of glacial acetic acid in a 250 mL round bottom flask, and 8 mL of nitroethane (0.11
mol) was added drop wise. The resulting reaction mixture was refluxed for one hour. During
reflux, yellow green crystals of D-labeled 4-methoxymethylene phenyl 2-nitropropene were
formed in the reaction mixture. After the reaction, another 25 ml of glacial acetic acid was added
to the reaction mixture which was then cooled down to room temperature on an ice bath. The
reaction mixture was poured over crushed ice and was acidify the mixture to pH 1 using
concentrated hydrochloric acid. Yellow green crystals of D-labeled 4-methoxymethylene phenyl
2-nitropropene were isolated by vacuum filtration, washed with water, air dried for further use.
4.8.5.2 Synthesis of deuterium labeled 4-methoxymethylene phenylacetone
D-labeled 4-methoxymethylene phenyl 2-nitropropene (3.0 g, 0.014 mol) was dissolved in 15
mL toluene and 15 mL water in a 250 mL round bottle flask. The resulting solution was mixed
with 4.5g powdered iron (0.08 mol); 0.9 g ferric chloride (0.006 mol) and 6 mL concentrated
hydrochloric acid. The mixture was stirred vigorously and refluxed over a day. After cooled to
room temperature, 30 mL toluene and 30 mL water was added and the mixture was filtered under
reduced pressure. The precipitate was washed with additional toluene and water. The toluene

97
layer was separated, and washed with 6 M hydrochloric acid, water and saturated sodium
bicarbonate solution. The organic layer was dried over sodium sulfate, filtered and the solvent
was evaporated to give dark brown crude product D-labeled 4-methoxymethylene
phenylacetone. Kugelrohr distillation of the crude product gave purified yellow oil D-labeled 4-
methoxymethylene phenylacetone, molecular formula: C11H11D3O2, molecular mass 181 g/mol.
4.8.6 Synthesis of HFBA derivatized 4-methoxymethylene phenethylamines compound 1-
3 and 5-7
The product amine 0.3 mg and 50 μL ethyl acetate was added to the glass test tube, then 250
μL derivatization agent heptafluorobutyramide (HFBA) was added in the reaction solution. The
reaction solution was incubated in capped tubes at 70 °C for 20 min, and then the solvent was
evaporated under stream of air at 55 °C. After that, 200 μL ethyl acetate and 50 μL pyridine was
added to the glass tube for reconstitute. Dilute 50 μL of the above solution with 200 μL HPLC
grade acetonitrile for GC analysis.

98
5. References
Aalberg L., DeRuiter J., Sippola E. and Clark C. R. Gas Chromatographic Optimization
Studies on the Side Chain and Ring Regioisomers of Methylenedioxymethamphetamine. Journal
of Chromatographic Science. 42 (2004): 293-298
Al-Hossaini A. M., Awad T., DeRuiter J. and Clark R. C. GC-MS and GC-IRD analysis of
ring and side chain regioisomers of ethoxyphenethylamines related to the controlled substances
MDEA, MDMMA and MBDB. Forensic Science International. 200(2010), 73-86.
Awad T., Belal T., DeRuiter J., Kramer K. and Clark C. R. Comparison of GC-MS and GC-
IRD methods for the differentiation of methamphetamine and regioisomeric substances. Forensic
Science International. 185(2009), 67-77.
Awad T., DeRuiter J. and Clark C. R. GC-MS analysis of acylated derivatives of the side
chain and ring terioisomers of methylenedioxymethamphetamine. Journal of Chromatographic
Science. 43(2005).
Awad T., DeRuiter J. and Clark C.R. Chromatographic and mass spectral studies on methoxy
methyl methamphetamines related to 3, 4-methylenedioxymethamphetamine. Journal of
Chromatographic Science. 45(2007), 466-476.
Belal T., Awad T., DeRuiter J. and Clark C.R. GC–MS studies on acylated derivatives of 3-
methoxy-4-methyl- and 4-methoxy-3-methyl-phenethylamines: Regioisomers related to 3, 4-
MDMA. Forensic Science International. 178(2008), 61-82.
99
Belal T., Awad T., DeRuiter J and Clark C. R. GC-IRD methods for the identification of
isomeric ethoxyphenethylamines and methoxymethcathinones. Forensic Science International.
184(2009), 54-63.
Belal T., Awad T., Clark C. R. and DeRuiter J. GC-MS evaluation of a series of acylated
derivatives of 3, 4-methylenedioxymethamphetamine. Journal of Chromatographic Science.
47(2009), 359-364.
Bogen I. L., Hauq K. H., Myhre O. and Fonnum F. Short- and long- term effects of MDMA
(“ecstasy”) on synaptosomal and vesicular uptake of neurotransmitters in vitro and ex vivo.
Neurochemistry International. 43(2003), 393-400.
Brown C. and Osterloh J. Multiple severe complications from recreational ingestion of
MDMA (ecstasy). The Journal of The American Medical Association. 258(1987), 780-781.
Cole J. C and Sumnall H. R. The pre-clinical behavioural pharmacology of 3, 4-
methylenedioxymethamphetamine (MDMA). Neuroscience And Biobehavioral Reviews. 27
(2003), 199-217.
Greer G. and Tolbert R. Subjective reports of effects of MDMA in a clinical setting. Journal
of Psychoactive Drugs. 18(1986), 319-327.
Henry J. A., Jeffreys K. J., Dawling S. Toxicity and deaths from 3, 4-
methylenedioxymethamphetamine (“ecstasy”). The Lancet. 340(1992), 384-387.
Hiramatsu M., Kumagai Y., Unger S. E. and Cho A. K. Metabolism of
methylenedioxymethamphetamine: formation of dihydroxymetham-phetamine and a quinone
identified as its glutathione adduct. Journal of Pharmacology And Experimental Therapeutics.
254 (1990), 521-527.

100
Kasuya Y. Synthesis of aralkylamines and their quarternary ammonium derivatives. Journal
of The Pharmaceutical Society of Japan. 78(1958): 509-511.
Aalberg L., DeRuiter J., Sippola E. and Clark R. C. Gas chromatographic optimization
studies on the side chain and ring regioisomers of methylenedioxymethamphetamine. Journal of
Chromatographic Science. 42(2004), 293-298.
Lawn J. C. Schedules of controlled substances; scheduling of 3, 4- methylenedioxy
methamphetamine (MDMA) into Schedule I of the Controlled Substance Act. Federal Register
51(1986), 36552-36560.
Lyles J. and Cadet J. L. Methylenedioxymethamphetamine (MDMA, Ecstasy) neurotoxicity:
cellular and molecular mechanisms. Brain Research Review. 42(2003), 155-168.
Maldonado E. and Navarro J.F. Effects of 3, 4-methylenedioxy-methamphetamine (MDMA)
on anxiety in mice tested in the light-dark box.Progress in Neuro-Psychopharmacol and
Biological Psychiatry. 24(2000), 463-472.
Mannich C. and Jacobsohn W., Hydroxyphenylalkylamines and
dihydroxyphenylalkylamines. Berichte. 43 (1910) 189–197.
McKenna D. J. and Peroutka S. J. Neurochemistry and neurotoxicity of 3, 4-
methylenedioxymethamphetamine (MDMA, ‘ecstasy’). Journal of Neurochemistry. 54 (1990),
14–22.
Noggle F.T. Jr ., Clark C.R., Alan K. V. and DeRuiter J. Liquid chromatographic and mass
spectral analysis of N-substituted analogues of 3, 4-methylenedioxyamphetamine. Journal of
Chromatographic Science. 26(1988), 410-415.
Richard S. C. Subjective reports on the effects of the MDMA (‘ecstasy’) experience in
humans. Neuro-Psychopharmacol and Boil Psychiat. 19(1995), 1137-1145.

101
Sanchez V., Camarero J., Esteban B., Peter M. J., Green A. R. and Colado M. I. The
mechanisms involved in the long-lasting neuroprotective effect of fluoxetine against MDMA
(ecstasy)-induced degeneration of serotonin nerve ending in rat brain. British Journal of
Pharmacol. 134(2001), 46-57.
Shulgin A.T., Nichols D.E. Characterization of three new psychotomimetics. The
Psychophamacology of Hallucinogens. Pergamon press, New York, 1978, 74-83.
Tehan B., Hardern R., Bodenham A. Hyperthermia associated with 3, 4-
methylenedioxyethamphetamine (“Eve”). Anaesthesia. 48 (1993): 507-510
White S.R., Obradovic T., Imel K. M. and Wheaton M. J. The effects of
methylenedioxymethamphetamine (MDMA ,“Ecstasy”) on monoaminergic neurotransmission in
the central nervous system. Progress in Neurobiology. 49(1996), 455-479.