GBIHC285MR Oncology Therapeutics Market in India to … · Oncology Therapeutics Market in India to...
16
Oncology Therapeutics Market in India to 2018 Introduction of Market-Based Pricing to Fuel Price Wars and Intense Competition Among Domestic and Multinational Players
Transcript of GBIHC285MR Oncology Therapeutics Market in India to … · Oncology Therapeutics Market in India to...

Oncology Therapeutics Market in India to 2018 Introduction of Market-Based Pricing to Fuel Price Wars and Intense Competition Among Domestic and Multinational Players

GBI Research Report Guidance
GBIHC285MR / Published APR 2013 Page 2
© GBI Research. This is a licensed product and is not to be photocopied
GBI Research Report Guidance
The report starts with an executive summary of the key points influencing the Indian oncology therapeutics market.
Chapter two summarizes the scope of the report.
Chapter three gives an overview of the oncology therapeutics market, looking at trends and recent developments.
Chapter four covers the therapeutic landscape, looking at the five major indications covered in the report with detailed descriptions of market size, treatment usage pattern, Annual Cost of Therapy (ACT) and staging.
Chapter five provides detailed analysis of the current pipeline for the oncology therapeutics market in India.
Chapter six analyzes the top companies operating in the Indian oncology market, comprising benchmarking and detailed profiles of the top five companies on the basis of sales revenue.
Chapter seven covers the strategic consolidations that have taken place between 2008 and 2012, as well as key licensing agreements and co-developments.

GBIHC285MR / Published APR 2013
Page 3 © GBI Research. This is a licensed product and is not to be photocopied
Executive Summary
Executive Summary
The Oncology Therapeutics Market in India is Expected to Witness Slower Growth Due to the Impending Price War
The Indian oncology therapeutics market for breast cancer, lung cancer, colorectal cancer, prostate cancer and Non-Hodgkin's Lymphoma (NHL), was estimated to be worth $XXm in 2011, having grown at a Compound Annual Growth Rate (CAGR) of XX% from 2004. It is expected to reach $XXm by 2018 at a CAGR of XX%.
The strong growth rate between 2004 and 2011 was helped by major products such as Avastin (bevacizumab), Herceptin (trastuzumab), Tarceva (erlotinib), Taxotere (docetaxel), Mabthera (rituximab), Reditux (rituximab), Gemcite (gemcitabine), Zoladex (goserelin), Geftinat (gefitinib), Iressa (gefitinib), Erbitux (cetuximab) and Xeloda (capecitabine). The market will however witness slower growth during the 2011–2018 forecast period due to reductions in the price of leading marketed products for breast cancer, colorectal cancer, lung cancer and NHL. The price war is expected to stem from the government’s plan to approve market-based pricing for all XX drug products listed in National List of Essential Medicines (NLEM), which currently covers only XX drug products. According to the Drug Price Control Order of 1995, NLEM retail prices are based on the cost of manufacture, but with the implementation of the market-based pricing regulation policy, prices are expected to decline by XX–XX%.
In November 2012, domestic drug major Cipla announced a XX% price reduction for of its three anti-cancer products, Erlocip (erlotinib), Docetax (docetaxel) and Capegard (capecitabine). In March 2012, Swiss drugmaker Roche announced that it would slash Indian prices of two of its anti-cancer drugs, MabThera (rituximab) and Herceptin (trastuzumab). GBI Research expects these price cuts and the imminent introduction of market-based pricing for all XX NLEM drugs to trigger a price war in the Indian oncology therapeutics market. Market growth will however be driven by a rise in cancer incidence, prevalence and diagnosis; better medical insurance coverage; improved access to cancer therapies; and higher spending by pharmaceutical majors.
Oncology Therapeutics Market, India, Revenue Forecast ($m), 2004–2018
2004 2011 2018
Rev
enue
($m
)
XX%
XX%
Source: GBI Research’s Proprietary Epidemiology and Market Size Database [accessed November 13, 2012]
The price war is expected to stem from the government’s plan to approve market-based pricing for all XX drug products listed in National List of Essential Medicines (NLEM)

GBIHC285MR / Published APR 2013
Page 6 © GBI Research. This is a licensed product and is not to be photocopied
Table of Contents
1 Table of Contents
1 Table of Contents................................................................................................................................. 6 1.1 List of Tables............................................................................................................................. 8 1.2 List of Figures...........................................................................................................................10
2 Oncology Therapeutics Market in India – Introduction.........................................................................11 3 Oncology Therapeutics Market in India – Market Overview..................................................................12
3.1 Population Dynamics ...............................................................................................................12 3.2 Cancer Registration Background in India...................................................................................13 3.3 Most Common Cancers in India................................................................................................14 3.4 Cancer Mortality Rate ..............................................................................................................15 3.5 Market Characterization and Forecasts.....................................................................................16 3.6 Annual Cost of Therapy............................................................................................................18 3.7 Treatment Usage Pattern.........................................................................................................19
3.7.1 Diseased Population.........................................................................................................20 3.7.2 Prescription Population ....................................................................................................20
3.8 Drivers and Barriers .................................................................................................................21 3.8.1 Drivers.............................................................................................................................21 3.8.2 Restraints ........................................................................................................................22
4 Oncology Therapeutics Market in India – Therapeutic Landscape.........................................................24 4.1 Breast Cancer ..........................................................................................................................24
4.1.1 Disease Overview.............................................................................................................24 4.1.2 Staging ............................................................................................................................24 4.1.3 Market Size......................................................................................................................26 4.1.4 Annual Cost of Therapy ....................................................................................................28 4.1.5 Treatment Usage Pattern .................................................................................................29 4.1.6 Key Marketed Products ....................................................................................................30 4.1.7 Competitive Landscape.....................................................................................................31
4.2 Colorectal Cancer.....................................................................................................................32 4.2.1 Disease Overview.............................................................................................................32 4.2.2 Staging ............................................................................................................................32 4.2.3 Market Size......................................................................................................................34 4.2.4 Annual Cost of Therapy ....................................................................................................35 4.2.5 Treatment Usage Pattern .................................................................................................36 4.2.6 Key Marketed Products ....................................................................................................37 4.2.7 Competitive Landscape.....................................................................................................38
4.3 Prostate Cancer .......................................................................................................................39 4.3.1 Disease Overview.............................................................................................................39 4.3.2 Staging ............................................................................................................................39 4.3.3 Market Size......................................................................................................................41 4.3.4 Annual Cost of Therapy ....................................................................................................42 4.3.5 Treatment Usage Pattern .................................................................................................43 4.3.6 Key Marketed Products ....................................................................................................44 4.3.7 Competitive Landscape.....................................................................................................45
4.4 Lung Cancer.............................................................................................................................46 4.4.1 Disease Overview.............................................................................................................46 4.4.2 Staging ............................................................................................................................46 4.4.3 Market Size......................................................................................................................49 4.4.4 Annual Cost of Therapy ....................................................................................................50 4.4.5 Treatment Usage Pattern .................................................................................................51 4.4.6 Key Marketed Products ....................................................................................................52 4.4.7 Competitive Landscape.....................................................................................................53
GBIHC285MR / Published APR 2013
Page 7 © GBI Research. This is a licensed product and is not to be photocopied
Table of Contents
4.5 Non-Hodgkin’s Lymphoma .......................................................................................................54 4.5.1 Disease Overview.............................................................................................................54 4.5.2 Staging ............................................................................................................................54 4.5.3 Market Size......................................................................................................................55 4.5.4 Annual Cost of Therapy ....................................................................................................56 4.5.5 Treatment Usage Pattern .................................................................................................57 4.5.6 Key Marketed Products ....................................................................................................58 4.5.7 Competitive Landscape.....................................................................................................59
5 Oncology Therapeutics Market in India – Pipeline Analysis...................................................................60 5.1 Introduction ............................................................................................................................60 5.2 Breast Cancer ..........................................................................................................................61
5.2.1 Introduction.....................................................................................................................61 5.3 Colorectal Cancer.....................................................................................................................64
5.3.1 Introduction.....................................................................................................................64 5.4 Prostate Cancer .......................................................................................................................66
5.4.1 Introduction.....................................................................................................................66 5.5 Lung Cancer.............................................................................................................................68
5.5.1 Introduction.....................................................................................................................68 5.6 Non-Hodgkin’s Lymphoma .......................................................................................................71
5.6.1 Introduction.....................................................................................................................71 6 Oncology Therapeutics Market in India – Competitive Landscape.........................................................73
6.1 Market Share Analysis..............................................................................................................73 6.2 Competitive Profiling ...............................................................................................................74
6.2.2 Dr. Reddy’s Laboratories...................................................................................................75 6.2.3 Natco Pharma..................................................................................................................76 6.2.4 AstraZeneca.....................................................................................................................77 6.2.5 Cipla ................................................................................................................................78
7 Oncology Therapeutics Market in India – Strategic Consolidations .......................................................79 7.1 Introduction ............................................................................................................................79 7.2 Merger & Acquisition Deals......................................................................................................80
7.2.1 M&A by Year....................................................................................................................80 7.3 Licensing Agreements ..............................................................................................................82
7.3.1 Deals by Year ...................................................................................................................82 7.3.2 Major Licensing Deals ......................................................................................................82
7.4 Co-Development Deals.............................................................................................................84 7.4.1 Deals by Year ...................................................................................................................84 7.4.2 Major Co-Development Deals ...........................................................................................85
8 Oncology Therapeutics Market in India – Appendix..............................................................................86 8.1 Market Definitions...................................................................................................................86 8.2 Abbreviations ..........................................................................................................................86 8.3 Bibliography ............................................................................................................................87 8.4 Research Methodology ............................................................................................................87
8.4.1 Coverage .........................................................................................................................87 8.4.2 Secondary Research .........................................................................................................88 8.4.3 Primary Research .............................................................................................................88 8.4.4 Expert Panel Validation ....................................................................................................89
8.5 Contact Us...............................................................................................................................89 8.6 Disclaimer................................................................................................................................89
GBIHC285MR / Published APR 2013
Page 8 © GBI Research. This is a licensed product and is not to be photocopied
Table of Contents
1.1 List of Tables
Table 1: Oncology Therapeutics Market, India, Incidence and Prevalence by Cancer Type, 2008 ............14 Table 2: Oncology Therapeutics Market, India, Estimated Cancer Deaths by Cancer Type, 2010.............15 Table 3: Oncology Therapeutics Market, India, Revenue ($m), 2004–2011 ............................................17 Table 4: Oncology Therapeutics Market, India, Revenue Forecast ($m), 2011–2018...............................17 Table 5: Oncology Therapeutics Market, India, Annual Cost of Therapy ($), 2004–2011 .........................18 Table 6: Oncology Therapeutics Market, India, Annual Cost of Therapy ($), 2011–2018 .........................18 Table 7: Oncology Therapeutics Market, India, Treatment Usage Pattern (‘000), 2004–2011 .................19 Table 8: Oncology Therapeutics Market, India, Treatment Usage Pattern (‘000), 2011–2018 .................19 Table 9: Breast Cancer Therapeutics Market, India, Staging Description, 2012.......................................24 Table 10: Breast Cancer Therapeutics Market, India, Staging Grouping, 2012 ..........................................25 Table 11: Breast Cancer Therapeutics Market, India, Revenue ($m), 2004–2011......................................27 Table 12: Breast Cancer Therapeutics Market, India, Revenue Forecast ($m), 2011–2018........................27 Table 13: Breast Cancer Therapeutics Market, India, Annual Cost of Therapy ($), 2004–2011 ..................28 Table 14: Breast Cancer Therapeutics Market, India, Annual Cost of Therapy ($), 2011–2018 ..................28 Table 15: Breast Cancer Therapeutics Market, India, Treatment Usage Pattern (‘000), 2004–2011...........29 Table 16: Breast Cancer Therapeutics Market, India, Treatment Usage Pattern (‘000), 2011–2018...........30 Table 17: Breast Cancer Therapeutics Market, India, Key Marketed Products, 2011.................................30 Table 18: Colorectal Cancer Therapeutics Market, India, Staging Description, 2012 .................................32 Table 19: Colorectal Cancer Therapeutics Market, India, Staging Grouping, 2012 ....................................33 Table 20: Colorectal Cancer Therapeutics Market, India, Revenue ($m), 2004–2011................................34 Table 21: Colorectal Cancer Therapeutics Market, India, Revenue Forecast ($m), 2011–2018..................34 Table 22: Colorectal Cancer Therapeutics Market, India, Annual Cost of Therapy ($), 2004–2011.............35 Table 23: Colorectal Cancer Therapeutics Market, India, Annual Cost of Therapy ($), 2011–2018.............35 Table 24: Colorectal Cancer Therapeutics Market, India, Treatment Usage Pattern (‘000), 2004–2011.....37 Table 25: Colorectal Cancer Therapeutics Market, India, Treatment Usage Pattern (‘000), 2011–2018.....37 Table 26: Colorectal Cancer Therapeutics Market, India, Key Marketed Products, 2011...........................37 Table 27: Prostate Cancer Therapeutics Market, India, Staging Description, 2012....................................39 Table 28: Prostate Cancer Therapeutics Market, India, Staging Grouping, 2012 .......................................40 Table 29: Prostate Cancer Therapeutics Market, India, Revenue ($m), 2004–2011...................................41 Table 30: Prostate Cancer Therapeutics Market, India, Revenue Forecast ($m), 2011–2018.....................41 Table 31: Prostate Cancer Therapeutics Market, India, Annual Cost of Therapy ($), 2004–2011 ...............42 Table 32: Prostate Cancer Therapeutics Market, India, Annual Cost of Therapy ($), 2011–2018 ...............42 Table 33: Prostate Cancer Therapeutics Market, India, Treatment Usage Pattern (‘000), 2004–2011 .......44 Table 34: Prostate Cancer Therapeutics Market, India, Treatment Usage Pattern (‘000), 2011–2018 .......44 Table 35: Prostate Cancer Therapeutics Market, India, Key Marketed Products, 2011..............................44 Table 36: Lung Cancer Therapeutics Market, India, Staging Description, 2012 .........................................46 Table 37: Lung Cancer Therapeutics Market, India, Staging Grouping, 2012.............................................48 Table 38: Lung Cancer Therapeutics Market, India, Revenue ($m), 2004–2011 ........................................49 Table 39: Lung Cancer Therapeutics Market, India, Revenue Forecast ($m), 2011–2018 ..........................49 Table 40: Lung Cancer Therapeutics Market, India, Annual Cost of Therapy ($), 2004–2011.....................50 Table 41: Lung Cancer Therapeutics Market, India, Annual Cost of Therapy ($), 2011–2018.....................50 Table 42: Lung Cancer Therapeutics Market, India, Treatment Usage Pattern (‘000), 2004–2011.............52 Table 43: Lung Cancer Therapeutics Market, India, Treatment Usage Pattern (‘000), 2011–2018.............52 Table 44: Lung Cancer Therapeutics Market, India, Key Marketed Products, 2011 ...................................52 Table 45: Non-Hodgkin’s Lymphoma Therapeutics Market, India, Staging Description, 2012....................54 Table 46: Non-Hodgkin’s Lymphoma Therapeutics Market in India, Revenue ($m), 2004–2011................55 Table 47: Non-Hodgkin’s Lymphoma Therapeutics Market, India, Revenue Forecast ($m), 2011–2018.....55 Table 48: Non-Hodgkin’s Lymphoma Therapeutics Market, India, Annual Cost of Therapy ($), 2004–2011
...............................................................................................................................................56 Table 49: Non-Hodgkin’s Lymphoma Therapeutics Market, India, Annual Cost of Therapy ($), 2011–2018
...............................................................................................................................................56 Table 50: Non-Hodgkin’s Lymphoma Therapeutics Market, India, Treatment Usage Pattern (‘000), 2004–
2011.......................................................................................................................................58 Table 51: Non-Hodgkin’s Lymphoma Therapeutics Market, India, Treatment Usage Pattern (‘000), 2011–
2018.......................................................................................................................................58 Table 52: Non-Hodgkin’s Lymphoma Therapeutics Market, India, Key Marketed Products, 2011..............58 Table 53: Oncology Therapeutics Market, India, Breast Cancer Pipeline by Phase, 2012...........................61
GBIHC285MR / Published APR 2013
Page 9 © GBI Research. This is a licensed product and is not to be photocopied
Table of Contents
Table 54: Oncology Therapeutics Market, India, Breast Cancer Pipeline, Phase I, 2012 ............................62 Table 55: Oncology Therapeutics Market, India, Breast Cancer Pipeline, Phase I/II, 2012.........................62 Table 56: Oncology Therapeutics Market, India, Breast Cancer Pipeline, Phase II, 2012 ...........................62 Table 57: Oncology Therapeutics Market, India, Breast Cancer Pipeline, Phase III, 2012...........................63 Table 58: Oncology Therapeutics Market, India, Colorectal Cancer Pipeline by Phase, 2012.....................64 Table 59: Oncology Therapeutics Market, India, Colorectal Cancer Pipeline, Phase I/II, 2012 ...................65 Table 60: Oncology Therapeutics Market, India, Colorectal Cancer Pipeline, Phase II, 2012......................65 Table 61: Oncology Therapeutics Market, India, Colorectal Cancer Pipeline, Phase II/III, 2012 .................65 Table 62: Oncology Therapeutics Market, India, Colorectal Cancer Pipeline, Phase III, 2012.....................65 Table 63: Oncology Therapeutics Market, India, Prostate Cancer Pipeline by Phase, 2012........................66 Table 64: Oncology Therapeutics Market, India, Prostate Cancer Pipeline, Phase II, 2012 ........................66 Table 65: Oncology Therapeutics Market, India, Prostate Cancer Pipeline, Phase III, 2012 .......................67 Table 66: Oncology Therapeutics Market, India, Lung Cancer Pipeline by Phase, 2012 .............................68 Table 67: Oncology Therapeutics Market, India, Lung Cancer Pipeline, Phase I/II, 2012............................68 Table 68: Oncology Therapeutics Market, India, Lung Cancer Pipeline, Phase II, 2012..............................69 Table 69: Oncology Therapeutics Market, India, Lung Cancer Pipeline, Phase III, 2012.............................70 Table 70: Oncology Therapeutics Market, India, Non-Hodgkin’s Lymphoma Pipeline by Phase, 2012 .......71 Table 71: Oncology Therapeutics Market, India, Non-Hodgkin’s Lymphoma Pipeline, Phase II/III, 2012....71 Table 72: Oncology Therapeutics Market, India, Non-Hodgkin’s Lymphoma Pipeline, Phase III, 2012 .......72
GBIHC285MR / Published APR 2013
Page 10 © GBI Research. This is a licensed product and is not to be photocopied
Table of Contents
1.2 List of Figures
Figure 1: Oncology Therapeutics Market, India, Population Growth Forecast (million), 2001–2025 .........12 Figure 2: Oncology Therapeutics Market, India, Revenue Forecast ($m), 2004–2018...............................16 Figure 3: Oncology Therapeutics Market, India, Annual Cost of Therapy ($), 2004–2018 .........................18 Figure 4: Oncology Therapeutics Market, India, Treatment Usage Pattern (‘000), 2004–2018 .................19 Figure 5: Oncology Therapeutics Market, India, Key Drivers and Barriers, 2012.......................................21 Figure 6: Breast Cancer Therapeutics Market, India, Revenue Forecast ($m), 2004–2018........................26 Figure 7: Breast Cancer Therapeutics Market, India, Annual Cost of Therapy ($), 2004–2018 ..................28 Figure 8: Breast Cancer Therapeutics Market, India, Treatment Usage Pattern (‘000), 2004–2018...........29 Figure 9: Breast Cancer Therapeutics Market, India, Top Manufacturers, Market Share, 2011.................31 Figure 10: Colorectal Cancer Therapeutics Market, India, Revenue Forecast ($m), 2004–2018..................34 Figure 11: Colorectal Cancer Therapeutics Market, India, Annual Cost of Therapy ($), 2004–2018.............35 Figure 12: Colorectal Cancer Therapeutics Market, India, Treatment Usage Pattern (‘000), 2004–2018.....36 Figure 13: Colorectal Cancer Therapeutics Market, India, Top Manufacturers, Market Share, 2011...........38 Figure 14: Prostate Cancer Therapeutics Market, India, Revenue Forecast ($m), 2004–2018.....................41 Figure 15: Prostate Cancer Therapeutics Market, India, Annual Cost of Therapy ($), 2004–2018 ...............42 Figure 16: Prostate Cancer Therapeutics Market, India, Treatment Usage Pattern (‘000), 2004–2018 .......43 Figure 17: Prostate Cancer Therapeutics Market, India, Top Manufacturers, Market Share (%), 2011........45 Figure 18: Lung Cancer Therapeutics Market, India, Revenue Forecast ($m), 2004–2018 ..........................49 Figure 19: Lung Cancer Therapeutics Market, India, Annual Cost of Therapy ($), 2004–2018.....................50 Figure 20: Lung Cancer Therapeutics Market, India, Treatment Usage Pattern (‘000), 2004–2018.............51 Figure 21: Lung Cancer Therapeutics Market, India, Top Manufacturers, Market Share (%), 2011 .............53 Figure 22: Non-Hodgkin’s Lymphoma Therapeutics Market, India, Revenue Forecast ($m), 2004–2018.....55 Figure 23: Non-Hodgkin’s Lymphoma Therapeutics Market, India, Annual Cost of Therapy ($), 2004–2018
...............................................................................................................................................56 Figure 24: Non-Hodgkin’s Lymphoma Therapeutics Market, India, Treatment Usage Pattern (‘000), 2004–
2018.......................................................................................................................................57 Figure 25: Non-Hodgkin’s Lymphoma Therapeutics Market, India, Top Manufacturers, Market Share (%),
2011.......................................................................................................................................59 Figure 26: Oncology Therapeutics Market, India, R&D Pipeline by Indication (%), 2012.............................60 Figure 27: Oncology Therapeutics Market, India, Breast Cancer Pipeline by Phase (%), 2012.....................61 Figure 28: Oncology Therapeutics Market, India, Colorectal Cancer Pipeline by Phase (%), 2012...............64 Figure 29: Oncology Therapeutics Market, India, Prostate Cancer Pipeline by Phase (%), 2012..................66 Figure 30: Oncology Therapeutics Market, India, Lung Cancer Pipeline by Phase (%), 2012 .......................68 Figure 31: Oncology Therapeutics Market, India, Non-Hodgkin’s Lymphoma Pipeline by Phase (%), 2012..71 Figure 32: Oncology Therapeutics Market, India, Top Manufacturers, Market Share (%), 2011..................73 Figure 33: Oncology Therapeutics Market, India, Hoffmann-La Roche, SWOT Analysis, 2011.....................74 Figure 34: Oncology Therapeutics Market, India, Dr. Reddy’s Laboratories, SWOT Analysis, 2011..............75 Figure 35: Oncology Therapeutics Market, India, Natco Pharma, SWOT Analysis, 2011 .............................76 Figure 36: Oncology Therapeutics Market, India, AstraZeneca, SWOT Analysis, 2011 ................................77 Figure 37: Oncology Therapeutics Market, India, Cipla, SWOT Analysis, 2011 ...........................................78 Figure 38: Oncology Therapeutics Market, India, Strategic Consolidation, Deals by Type, 2008–2012........79 Figure 39: Oncology Therapeutics Market, India, M&A by Year, 2008–2012..............................................80 Figure 40: Oncology Therapeutics Market, India, Licensing Agreements by Year, 2008–2012 ....................82 Figure 41: Oncology Therapeutics Market, India, Co-Development Deals by Year, 2008–2012...................84
GBIHC285MR / Published APR 2013
Page 11 © GBI Research. This is a licensed product and is not to be photocopied
Oncology Therapeutics Market in India – Introduction
2 Oncology Therapeutics Market in India – Introduction
The Indian oncology therapeutics market for breast cancer, lung cancer, colorectal cancer, prostate cancer and Non-Hodgkin's Lymphoma (NHL) was estimated to be worth $XXm in 2011, having grown at a Compound Annual Growth Rate (CAGR) of XX% from 2004. It is expected to reach $XXm by 2018 at a CAGR of XX% from 2011. The slower growth in the forecast period is expected to be due to reductions in the price of the leading marketed products for breast cancer, colorectal cancer, lung cancer and NHL after all XX drugs on the National List of Essential Medicines (NLEM) are covered under market-based pricing.
The limitations of the current market are unclear patent laws, restrictive pricing and reimbursement policies, ailing infrastructure, and an insufficient level of government aid. Low patient affordability is also a major restraint, and one that reimbursement and insurance policies must address if the market is to develop in the future.

GBIHC285MR / Published APR 2013
Page 16 © GBI Research. This is a licensed product and is not to be photocopied
Oncology Therapeutics Market in India – Market Overview
3.5 Market Characterization and Forecasts
The following figure shows the cumulative revenue generated by the Indian oncology therapeutics market during the 2004–2011 historic period and the 2011–2018 forecast period for breast cancer, lung cancer, colorectal cancer, prostate cancer and NHL.
The market was estimated to be worth $XXm in 2011, having grown at a CAGR of XX% from 2004 and expected to reach $XXm by 2018 at a CAGR of XX% from 2011.
Growth in the historic period was driven by sales of Avastin (bevacizumab), Herceptin (trastuzumab), Tarceva (erlotinib), Taxotere (docetaxel) and Xeloda (capecitabine).
The slow growth predicted in the forecast period is mainly due to price reductions of the leading marketed products for breast cancer, colorectal cancer, lung cancer and NHL. The price war is expected to stem from the government’s plan to approve market-based pricing for all XX drug products listed in National List of Essential Medicines (NLEM), which currently covers only XX drug products. According to the Drug Price Control Order of 1995, NLEM retail prices are based on the cost of manufacturing the product. With the implementation of the market-based price regulation policy, prices are expected to decline by XX–XX%.
In November 2012, domestic drug major Cipla announced a XX% price reduction of three anti-cancer products: Erlocip (erlotinib), Docetax (docetaxel) and Capegard (capecitabine). In March 2012, Swiss drug maker Roche announced plans to slash Indian prices of anti-cancer drugs MabThera and Herceptin. GBI Research expects these price cuts and the expected introduction of market-based pricing for all XX NLEM drugs to trigger a price war in the Indian oncology therapeutics market.
Figure 2: Oncology Therapeutics Market, India, Revenue Forecast ($m), 2004–2018
2004 2005 2006 2007 2008 2009 2010 2011 2012 2013 2014 2015 2016 2017 2018
Rev
enue
($m
)
CAGR (2004–2011): XX%CAGR (2011–2018): XX% Price reduction of marketed products
for breast cancer, lung cancer, colorectal cancer and NHL
Source: GBI Research’s Proprietary Epidemiology and Market Size Database [accessed November 13, 2012]
The slow growth predicted in the forecast period is mainly due to price reductions of the leading marketed products for breast cancer, colorectal cancer, lung cancer and NHL
GBIHC285MR / Published APR 2013
Page 17 © GBI Research. This is a licensed product and is not to be photocopied
Oncology Therapeutics Market in India – Market Overview
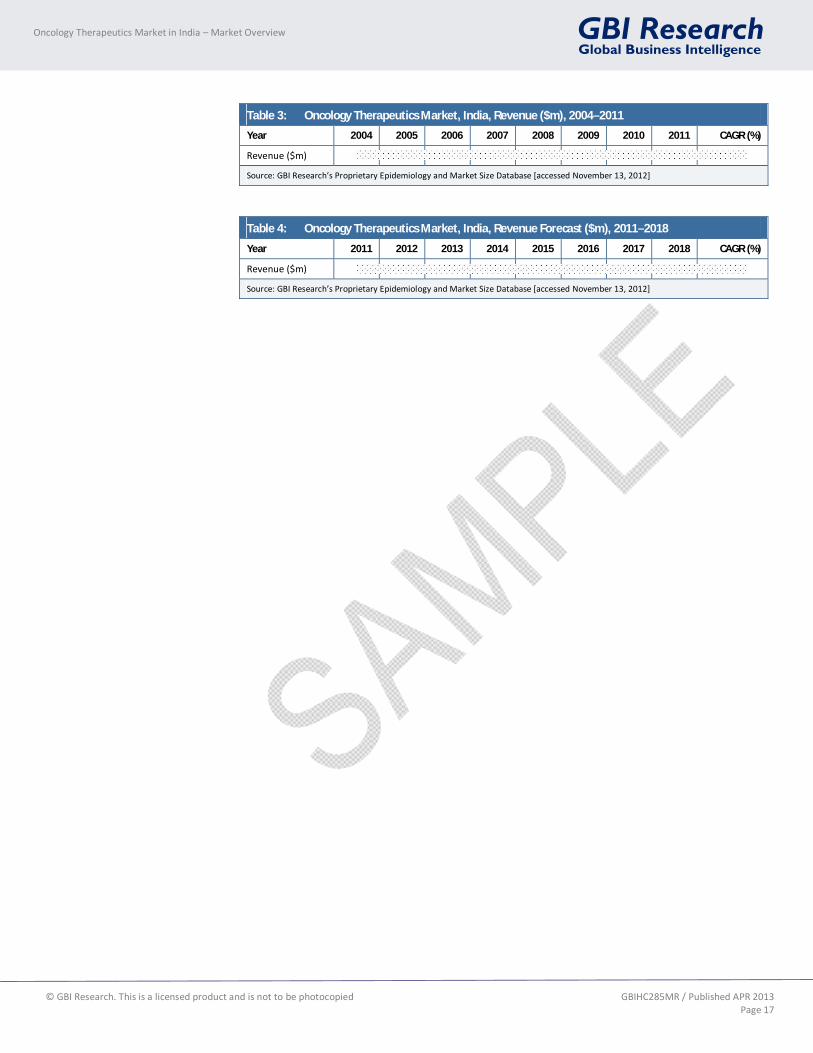
Table 3: Oncology Therapeutics Market, India, Revenue ($m), 2004–2011
Year 2004 2005 2006 2007 2008 2009 2010 2011 CAGR (%)
Revenue ($m)
Source: GBI Research’s Proprietary Epidemiology and Market Size Database [accessed November 13, 2012]
Table 4: Oncology Therapeutics Market, India, Revenue Forecast ($m), 2011–2018
Year 2011 2012 2013 2014 2015 2016 2017 2018 CAGR (%)
Revenue ($m)
Source: GBI Research’s Proprietary Epidemiology and Market Size Database [accessed November 13, 2012]
GBIHC285MR / Published APR 2013
Page 60 © GBI Research. This is a licensed product and is not to be photocopied
Oncology Therapeutics Market in India – Pipeline Analysis
5 Oncology Therapeutics Market in India – Pipeline Analysis
5.1 Introduction
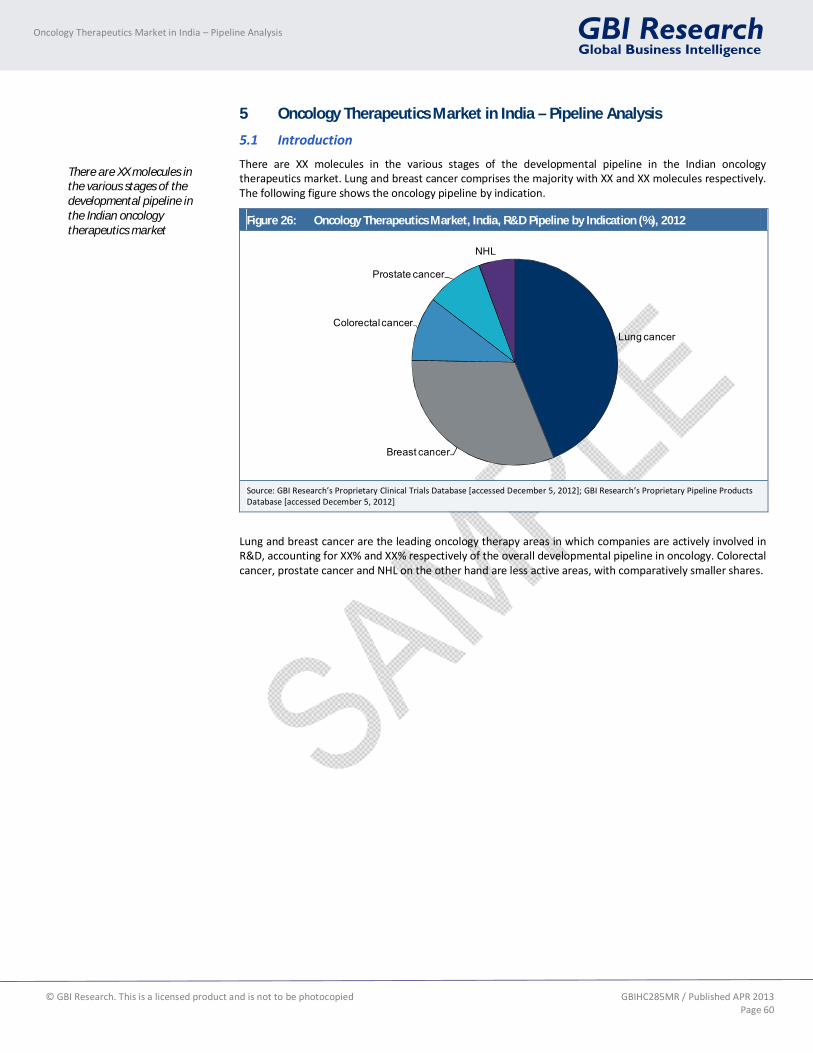
There are XX molecules in the various stages of the developmental pipeline in the Indian oncology therapeutics market. Lung and breast cancer comprises the majority with XX and XX molecules respectively. The following figure shows the oncology pipeline by indication.
Figure 26: Oncology Therapeutics Market, India, R&D Pipeline by Indication (%), 2012
Lung cancer
Breast cancer
Colorectal cancer
Prostate cancer
NHL
Source: GBI Research’s Proprietary Clinical Trials Database [accessed December 5, 2012]; GBI Research’s Proprietary Pipeline Products Database [accessed December 5, 2012]
Lung and breast cancer are the leading oncology therapy areas in which companies are actively involved in R&D, accounting for XX% and XX% respectively of the overall developmental pipeline in oncology. Colorectal cancer, prostate cancer and NHL on the other hand are less active areas, with comparatively smaller shares.
There are XX molecules in the various stages of the developmental pipeline in the Indian oncology therapeutics market

GBIHC285MR / Published APR 2013
Page 86 © GBI Research. This is a licensed product and is not to be photocopied
Oncology Therapeutics Market in India – Appendix
8 Oncology Therapeutics Market in India – Appendix
8.1 Market Definitions
The Indian oncology therapeutics market includes breast cancer, colorectal cancer, prostate cancer, lung cancer and NHL.
Prevalence (diseased) population: The prevalence population is the estimated number of people at any given point of time who are affected by cancer.
Prescription population: The prescription rate is the percentage of the diagnosed population that is prescribed medication for cancer.
Annual cost of treatment: The ACT is the weighted average cost of prescription drugs consumed by a cancer patient in a year, taking into account the line of treatment, available treatment options, treatment duration and price and affordability of various drugs.
8.2 Abbreviations
ACT: Annual Cost of Therapy
CAGR: Compound Annual Growth Rate
GSK: GlaxoSmithKline
HBCR: Hospital-Based Cancer Registry
IARC: International Agency for Research on Cancer
ICMR: Indian Council of Medical Research
MNC: Multinational Company
MRI: Magnetic Resonance Imaging
NCRP: National Cancer Registry Programme
NHL: Non-Hodgkin’s Lymphoma
NLEM: National List of Essential Medicines
PBCR: Population-Based Cancer Registry
PET: Positron Emission Tomography
PSA: Prostate-Specific Antigen
TNM: Tumor, Node, Metastases

GBIHC285MR / Published APR 2013
Page 87 © GBI Research. This is a licensed product and is not to be photocopied
Oncology Therapeutics Market in India – Appendix
8.3 Bibliography
American Joint Committee on Cancer (2012a). Breast Cancer Staging. Available from: http://www.cancerstaging.org/staging/posters/breast8.5x11.pdf.
American Joint Committee on Cancer (2012b). Colorectal Cancer Staging. Available from: http://www.cancerstaging.org/staging/posters/colon8.5x11.pdf.
American Joint Committee on Cancer (2012c). Lung Cancer Staging. Available from: http://www.cancerstaging.org/staging/posters/lung8.5x11.pdf.
American Joint Committee on Cancer (2012d). Prostate Cancer Staging. Available from: http://www.cancerstaging.org/staging/posters/prostate8.5x11.pdf.
American Joint Committee on Cancer (2012e). NHL Staging. Available from: http://www.cancerstaging.org/staging/posters/nhl8.5x11.pdf.
Census of India (2011). Population Size. Available from: http://censusindia.gov.in/2011census/censusinfodashboard/index.html. [Accessed November 21, 2012].
Globocan (2008). Estimated Cancer Prevalence, Adult Population: Both Sexes. Available from: http://globocan.iarc.fr/summary_table_pop_prev.asp?selection=92356&title=India&sex=0&window=1&sort=0&submit=%A0Execute%A0. [Accessed on November 06, 2012].
International Agency for Research on Cancer (2008). Indian cancer statistics. Available from: http://www.iarc.fr/en/media-centre/pr/2012/pdfs/pr210_E.pdf.
National Cancer Institute (2012a). Stages of Breast Cancer. Available from: 'http://www.cancer.gov/cancertopics/pdq/treatment/breast/Patient/page2. [Accessed on November 06, 2012].
National Cancer Institute (2012b). Stages of Colorectal Cancer. Available from: 'http://www.cancer.gov/cancertopics/pdq/treatment/colon/Patient/page2. [Accessed on November 06, 2012].
National Cancer Institute (2012c). Stages of Non-Small Cell Lung Cancer. Available from: http://www.cancer.gov/cancertopics/pdq/treatment/non-small-cell-lung/Patient/page2. [Accessed on November 06, 2012].
National Cancer Institute (2012d). Stages of Prostate Cancer. Available from: 'http://www.cancer.gov/cancertopics/pdq/treatment/prostate/Patient/page2. [Accessed on November 06, 2012].
8.4 Research Methodology
GBI Research’s dedicated research and analysis teams consist of experienced professionals with a pedigree in marketing, market research, consulting backgrounds in the medical devices industry, and advanced statistical expertise.
GBI Research adheres to the codes of practice of the Market Research Society (www.mrs.org.uk) and the Strategic and Competitive Intelligence Professionals (www.scip.org).
All GBI Research databases are continuously updated and revised.
8.4.1 Coverage
The objective of updating GBI Research’s coverage is to ensure that it represents the most up-to-date vision of the industry possible.
Changes to the industry taxonomy are decided on the basis of extensive research of company, association and competitor sources.
Company coverage is based on three key factors: market capitalization, revenues, and media attention/innovation/market potential.
GBIHC285MR / Published APR 2013
Page 88 © GBI Research. This is a licensed product and is not to be photocopied
Oncology Therapeutics Market in India – Appendix
An exhaustive search of 56 member exchanges is conducted, and companies are prioritized on the basis of their market capitalization;
The estimated revenues of all major companies, including private and governmental, are gathered and used to prioritize coverage; and,
Companies which are making the news, or which are of particular interest due to their innovative approach, are prioritized.
GBI Research aims to cover all major news events and deals in the medical industry, with its databases updated on a daily basis.
The coverage is further streamlined and strengthened with additional inputs from GBI Research’s expert panel (see below).
8.4.2 Secondary Research
The research process begins with exhaustive secondary research on internal and external sources being carried out to source qualitative and quantitative information relating to each market.
The secondary research sources that are typically referred to include, but are not limited to:
Company websites, annual reports, financial reports, broker reports, investor presentations and US Securities and Exchanges Commission (SEC) filings.
Industry trade journals, scientific journals and other technical literature.
Internal and external proprietary databases.
Relevant patent and regulatory databases.
National government documents, statistical databases and market reports.
Procedure registries.
News articles, press releases and webcasts specific to the companies operating in the market.
8.4.3 Primary Research
GBI Research conducts hundreds of primary interviews each year with industry participants and commentators, in order to validate its data and analysis. A typical research interview fulfills the following functions:
It provides first-hand information on the market size, market trends, growth trends, competitive landscape, future outlook, etc.
Helps in validating and strengthening the secondary research findings; and
Further develops the analysis team’s expertise and market understanding.
Primary research involves email interactions, telephone interviews, and face-to-face interviews for each market, category, segment and sub-segment across geographies.
The participants who typically take part in such a process include, but are not limited to:
Industry participants: CEOs, VPs, marketing/product managers, market intelligence managers and national sales managers.
Hospital stores, laboratories, pharmacies, distributors and paramedics.
Outside experts: Investment bankers, valuation experts, research analysts specializing in specific medical equipment markets; and
Key Opinion Leaders: Physicians and surgeons specializing in different therapeutic areas corresponding to different kinds of medical equipment.

GBIHC285MR / Published APR 2013
Page 89 © GBI Research. This is a licensed product and is not to be photocopied
Oncology Therapeutics Market in India – Appendix
8.4.4 Expert Panel Validation
GBI Research uses a panel of experts to cross-verify its databases and forecasts.
GBI Research’s expert panel comprises marketing managers, product specialists, international sales managers from medical device companies, academics from research universities, and key opinion leaders from hospitals.
Historic data and forecasts are relayed to GBI Research’s expert panel for feedback and adjusted in accordance with their feedback.
8.6 Disclaimer
All Rights Reserved.
No part of this publication may be reproduced, stored in a retrieval system or transmitted in any form by any means, electronic, mechanical, photocopying, recording or otherwise, without the prior permission of the publisher, GBI Research.