GBE price reform — effects on household expenditure · 1 GBE price reform — effects on...
31
GBE price reform — effects on household expenditure Industry Commission Staff Information Paper
Transcript of GBE price reform — effects on household expenditure · 1 GBE price reform — effects on...

GBE price reform — effects onhousehold expenditure
Industry Commission Staff Information Paper

Commonwealth of Australia 1996
ISBN 0 642 25955 0
This work is copyright. Apart from any use as permitted under the Copyright Act1968, the work may be reproduced in whole or in part for study or trainingpurposes, subject to the inclusion of an acknowledgment of the source.Reproduction for commercial usage or sale requires prior written permissionfrom the Australian Government Publishing Service. Requests and inquiriesconcerning reproduction and rights should be addressed to the Manager,Commonwealth Information Services, AGPS, GPO Box 84, Canberra ACT 2601.
The views expressed in this paper do not necessarily reflectthose of the Industry Commission.
Inquiries
Publications OfficerIndustry CommissionLocked Bag 2Collins Street East Post OfficeMelbourne Vic 8003
Phone: (03) 9653 2244
An appropriate citation for this paper is:
IC (Industry Commission) 1996, GBE Price Reform — Effects on HouseholdExpenditure, Staff Information Paper, Industry Commission, Melbourne.
Forming the Productivity Commission
The Commonwealth Government, as part of its broader microeconomic reform agenda,is merging the Bureau of Industry Economics, the Economic Planning AdvisoryCommission and the Industry Commission to form the Productivity Commission. Thethree agencies are now co-located in the Treasurer’s portfolio and amalgamation hasbegun on an administrative basis. While appropriate arrangements are being finalised,the work program of each of the agencies will continue. The relevant legislation will beintroduced soon. This report has been produced by the Industry Commission.
i i i
Acknowledgments
This paper was researched and written by Dr Martin Johnson, MatthewCole and Lee Davis. Assistance was provided by Dr Graeme Woodbridge,Anthea Goddard, Kate Pearson, Anita Kovac and Gavan Dwyer. Commentsfrom Professor Richard Snape, Dr Lynne Williams and Clive Brooks aregratefully acknowledged. The project was supervised by Dr John Salerian,Assistant Commissioner of the Economic Projects Branch.
October 1996

iv
Companion publications
Annual Report 1995-96
The Commission’s Annual Report outlines the importance of a broad-based
microeconomic reform program in raising productivity and improving living
standards. The reform program includes areas with obvious social and equity
considerations. The report explores what productivity gains through broad-based
microeconomic reform mean for equity in our society.
Regulation and its Review: 1995–96
This publication discusses issues and developments in regulation. It also covers
developments in regulatory review policies and practices and the operations of the
Office of Regulation Review.
Reform and the Distribution of Income — An Economy-wide Approach
This Staff Information Paper illustrates the effects on the distribution of household
income caused by industry structural change arising from a set of reforms, relating
to tariffs, contracting out by government, electricity and telecommunications.
v
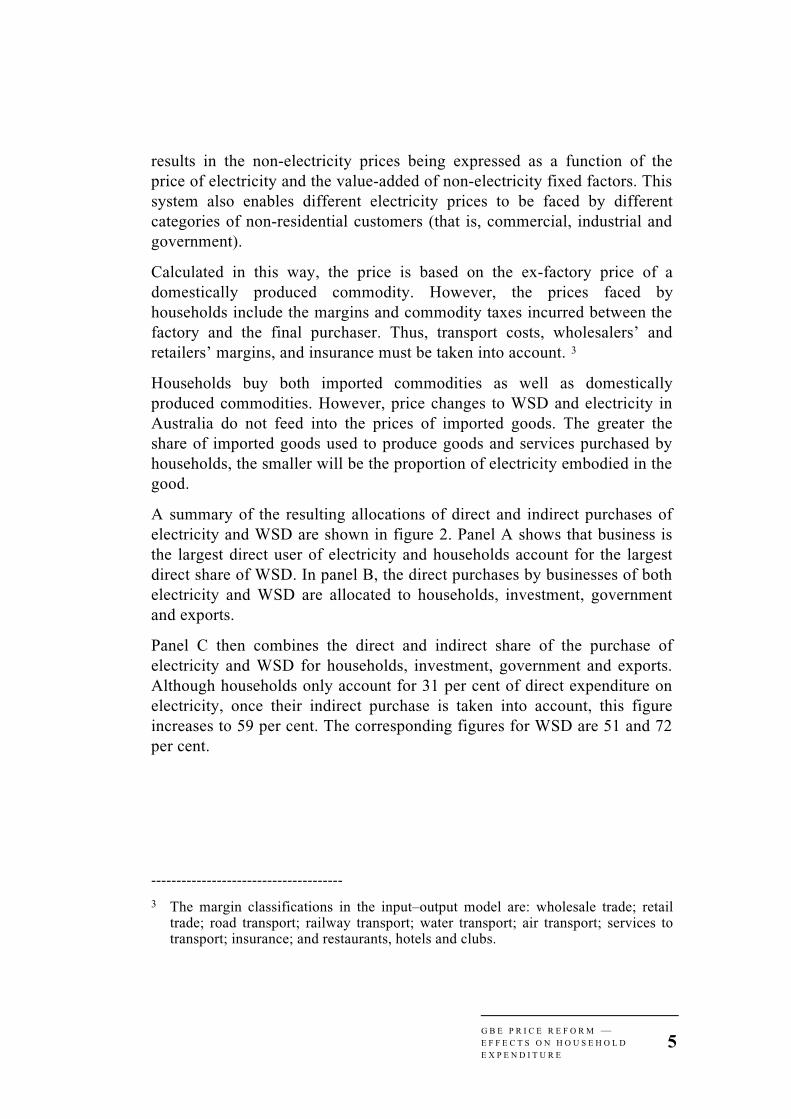
Contents
SECTIONS
Abbreviations vii
Introduction 1
Framework 2
Direct and indirect purchases by household income group 9
Cost effects of GBE price reform 10
Summary 20
References 23
TABLES
1 Shares of electricity and WSD in the c ost of other goods andservices and the share of goods and services in householdexpenditure (per cent) 8
2 Direct and indirect shares of electricity and WSD in householdexpenditure by household income group (per cent) 10
3 Change in real electricity prices from 1986–87 to 1990–91 andfrom 1990–91 to 1994–95 (per cent) 12
4 Change in household expenditure from changes in electricityprices by income group 13
5 Share of households by income group whose exp enditureincreases after changes in electricity prices 14
4 Change in real WSD prices, 1990–91 to 1994–95 (per cent) 15
5 Change in household expenditure due to WSD price changes byincome groups 16
6 Share of households by income group whose expenditureincreases after changes in WSD prices 17

v i
7 Combined change in expenditure due to electricity and WSDprice changes by income group (per cent) 18
8 Share of households by income group whose expenditureincreases after combining electricity and WSD price changes 19
FIGURES
1 Mapping direct and indirect purchases of electricity and WSD 3
2 Direct, indirect and total purchases of electricity and WSD,1989–90 6

v i i
Abbreviations
ABS Australian Bureau of Statistics
CPI Consumer price index
GBE Government business enterprise (includes governmenttrading and government financial enterprises)
HES Household Expenditure Survey
IC Industry Commission
WSD Water, sewerage and drainage

1
GBE price reform — effects onhousehold expenditure
This paper examines direct and indirectexpenditure by households on electricity andwater, sewerage and drainage services. Indirectexpenditure arises because firms include theexpenditure on these services in the prices ofthe goods and services they sell to households.Price reforms in electricity and water, sewerageand drainage that reduce cross-subsidies fromfirms to households cut the cost of producingthe other goods and services that householdsbuy. In part, this offsets any direct priceincreases that households experience. Averagenational price changes from 1990–91 to 1994–95 are used to illustrate these effects. Forelectricity, the overall effect is a reduction intotal household expenditure. For water,sewerage and drainage, it is an increase. Theseeffects also vary with the level of income. Theresults of this study illustrate how consideringonly the direct effects of GBE price reform mayoverstate any negative impacts on householdexpenditure.
INTRODUCTION
Many studies assess the impacts of price reform by government businessenterprises (GBEs) on household expenditure by focussing solely on thechange in the price charged to the households for the service. Largelyneglected are the effects of changes in GBE prices on the prices of the othergoods and services consumed by households. These indirect effects becomemore important as GBE reform spreads throughout Australia.

2 I N D U S T R Y C O M M I S S I O NS T A F F I N F O R M A T I O N
P A P E R
This paper illustrates both the short-run direct and indirect effects onhousehold expenditure of price changes in the electricity and water,sewerage and drainage (WSD) sectors. These sectors were chosen because:
• electricity and WSD are important services to both households andindustries;
• reforms have been occurring in both these industries; and
• the charges for these services have high visibility to householdsbecause of the periodic way in which they are billed.
The direct and indirect price effects on expenditure are estimated using datafrom the ABS Household Expenditure Survey (HES) and an input–outputmodel of the economy. The next section outlines the method used todetermine the expenditure effects. The third section discusses how directand indirect purchases of electricity and WSD vary across householdincome groups. The changes in household expenditure that arise fromobserved changes in average national electricity and WSD prices arediscussed in the fourth section. The final section provides a summary of theexercise.
FRAMEWORK
GBE price reform affects household expenditure in two ways:
• directly — through the purchase of GBE services; and
• indirectly — through the purchase of goods and services frombusinesses which, in turn, purchased GBE services.
Figure 1 illustrates direct and indirect purchases of electricity and WSD.Direct purchases of electricity and WSD services are made by households,businesses and government. 1 Businesses then produce goods and services,which use varying amounts of electricity and WSD in their production. Theoutput of businesses are ultimately purchased by governments andhouseholds, and used for investment and exports. Households are‘indirectly’ purchasing the electricity and WSD purchased by businessbecause business includes these costs in the price they charge.
--------------------------------------
1 Exporters and investors do make direct purchases of electricity and WSD sales, butas they account for less than 1 per cent of electricity and WSD sales, they are notillustrated.

G B E P R I C E R E F O R M —E F F E C T S O N H O U S E H O L DE X P E N D I T U R E
3
This study concentrates solely on ‘price’ effects and assumes thathouseholds do not adjust their consumption of goods and services inresponse to changing prices. That is, a household facing a higher price forelectricity does not respond by trying to use less. The model assesses howmuch more or less a household has to pay to buy the same quantities ofgoods and services as it did before the price changes.
Figure 1: Mapping direct and indirect purchases of electricity andWSD
Sales of electricityand WSD
governmentdirect
householdsdirect
investment
exports
business goods andservices
direct
indirect
indirect
indirect
indirect
Similarly, businesses are assumed to be unresponsive to changing prices.For example, if the price of electricity falls, the model assumes that thetypes of goods and services, their levels of production and the productionprocesses used are unaffected. In addition, businesses are assumed to passon the changes in the prices of electricity and WSD completely to theircustomers through changes in the prices of their goods and services.
The model also assumes that the prices and quantity of imports areunchanged and that commodity taxes are ad valorem. Further, there are noflow-on effects, such as changes in the industrial structure of the economy,employment by industry, and wages. A companion publication to this paper(IC 1996b) illustrates some of these aspects of microeconomic reform usinga general equilibrium framework.
Although these assumptions are restrictive, they simplify calculationsconsiderably and complement many of those made commonly in studies ofthe direct effects on households of price reform by GBEs. The analysis is auseful starting point to give an illustration of the relative magnitudes of

4 I N D U S T R Y C O M M I S S I O NS T A F F I N F O R M A T I O N
P A P E R
direct and indirect effects inherent in price changes and, in particular, tohighlight how indirect effects may offset direct effects.
To calculate indirect purchases of electricity and WSD by householdsrequires knowledge of the goods and services purchased by households andthe amount of electricity and WSD that goes into producing them. Theseare discussed below.
CALCULATING INDIRECT PURCHASES USING AN INPUT–OUTPUT MODEL
Information on the amount of electricity and WSD embodied in the goodsand services purchased by households is obtained from an input–outputmodel of the economy. This model is based on the 1989–90 Orani database(Kenderes and Strzelecki 1995) which is a modified version of the ABSinput–output tables.
In the input–output model, each industry produces only one commodity, sothere are 107 commodities and 107 industries. The price of a commodity isdefined as its average cost. In turn, the average cost of a commodity is thesum of its per unit requirements for each input multiplied by the price ofeach input.
The price of any commodity may be expressed as the sum of the value-added in Australia (including indirect taxes incurred in production), importsand commodity taxes on final demand. The contribution of a particularindustry, say electricity or WSD, to the price of a commodity is then givenby the percentage of the product price accounted for by value-added fromthat industry. This approach takes account of the complex input–outputlinkages present in the economy, and avoids double counting across allcommodities.
To calculate the contribution of each industry to the price of eachcommodity, a system of 107 price determination equations is solved. 2
To calculate the effect of changes in the real price of electricity or WSD onthe price of commodities which use this GBE service, the price equation forthat service is excluded from the system of price determination equations.For example, excluding the electricity price equation from the system
--------------------------------------
2 Methods for manipulating such systems of equations are discussed in IAC (1989).
G B E P R I C E R E F O R M —E F F E C T S O N H O U S E H O L DE X P E N D I T U R E
5
results in the non-electricity prices being expressed as a function of theprice of electricity and the value-added of non-electricity fixed factors. Thissystem also enables different electricity prices to be faced by differentcategories of non-residential customers (that is, commercial, industrial andgovernment).
Calculated in this way, the price is based on the ex-factory price of adomestically produced commodity. However, the prices faced byhouseholds include the margins and commodity taxes incurred between thefactory and the final purchaser. Thus, transport costs, wholesalers’ andretailers’ margins, and insurance must be taken into account. 3
Households buy both imported commodities as well as domesticallyproduced commodities. However, price changes to WSD and electricity inAustralia do not feed into the prices of imported goods. The greater theshare of imported goods used to produce goods and services purchased byhouseholds, the smaller will be the proportion of electricity embodied in thegood.
A summary of the resulting allocations of direct and indirect purchases ofelectricity and WSD are shown in figure 2. Panel A shows that business isthe largest direct user of electricity and households account for the largestdirect share of WSD. In panel B, the direct purchases by businesses of bothelectricity and WSD are allocated to households, investment, governmentand exports.
Panel C then combines the direct and indirect share of the purchase ofelectricity and WSD for households, investment, government and exports.Although households only account for 31 per cent of direct expenditure onelectricity, once their indirect purchase is taken into account, this figureincreases to 59 per cent. The corresponding figures for WSD are 51 and 72per cent.
--------------------------------------
3 The margin classifications in the input–output model are: wholesale trade; retailtrade; road transport; railway transport; water transport; air transport; services totransport; insurance; and restaurants, hotels and clubs.

6 I N D U S T R Y C O M M I S S I O NS T A F F I N F O R M A T I O N
P A P E R
Figure 2: Direct, indirect and total purchases of electricity andWSD, 1989–90
Electricity WSD
Panel A: Share of direct purchases by final user a,b
Households31%
Business59%
Government10%
Households51%Business
43%
Government6%
Panel B: Share of indirect purchases by final consumer of business’s electricity and WSD
Households48%
Government9%
Exports25%
Investment18%
Households48%
Investment15%
Exports21%
Government16%
Panel C: Share of total purchases of electricity and WSD by final consumer
Households59%
Government16%
Exports15%
Investment11%
Households72%
Government13%
Exports9%
Investment6%
a Exports and investment (fixed capital expenditure) account for less than 1 per cent of electricity and WSD sales.
b Household share of WSD includes all sales to the industry Ownership of Dwellings. No distinction ismade between home owners and renters.
Source: Commission estimates

G B E P R I C E R E F O R M —E F F E C T S O N H O U S E H O L DE X P E N D I T U R E
7
CALCULATING DIRECT AND INDIRECT EXPENDITURESHARES USING THE HOUSEHOLD EXPENDITURE SURVEY
The database on household expenditure is obtained from the unit record fileof the ABS 1988–89 HES (ABS 1989). This file contains expenditure on421 commodity groups by 7225 households selected to be representative ofhouseholds in private dwellings and caravan parks across Australia.
To estimate a household’s indirect purchases of electricity or WSD, the 421HES commodity groupings were first mapped into the 107 input–outputcommodity groupings using an unpublished ABS concordance. For eachhousehold in the database, the share of indirect electricity and WSD in eachcommodity was used to scale the effects of changes in electricity and WSDexpenditure on each commodity. Summing these across all commoditygroups gives the change in expenditure arising from the indirect purchase ofelectricity and WSD.
Households were then allocated to household income equivalent deciles bydividing household incomes by household size (using an equivalent adultscale).4 The equivalent adult weighting scheme of Agrawal (1987) wasused. In this scheme, the first adult receives a weight of 1, additional adultsor dependent children aged 15–20 who are studying full-time receive aweight of 0.7 and dependent children aged less than 15 years receive aweight of 0.4.
Throughout this paper income deciles are referred to as income groups. Thelowest income group (decile) consists of households in the bottom 10 percent of the ranking, the second income group is the next 10 per cent and soon.
Table 1 shows the share of electricity and WSD in the cost of a good orservice, recognising that this includes both their direct use in the productionof the good or service and their use in the production of other inputs, whichin turn are used to produce the good or service.
--------------------------------------
4 Household total expenditure is interpreted as a proxy for household incomebecause HES income estimates underestimate actual income (ABS 1989 p. 2 andWright and Dolan 1992).

8 I N D U S T R Y C O M M I S S I O NS T A F F I N F O R M A T I O N
P A P E R
Table 1: Shares of electricity and WSD in the cost of other goodsand services and the share of goods and services inhousehold expenditure (per cent)
Share in the cost of other goods and services
Commodityshare in
householdCommodity Electricity WSD expenditure
Current housing costs excludingwater and sewerage ratesa 0.88 1.70 12.19
Water and sewerage rates 3.71 na 0.87
Fuel and power excluding electricity 0.72 0.32 0.52
Electricity na 0.36 1.82
Food and non-alcoholic beverages 1.25 0.51 17.40
Alcoholic beverages 1.00 0.34 3.08
Tobacco 0.40 0.13 1.25
Clothing and footwear 0.86 0.26 5.57
Household furnishings and equipment 0.91 0.24 6.80
Household services and operation 1.15 0.29 4.39
Medical care and health expenses 1.08 0.54 3.96
Transport 0.72 0.22 14.69
Recreation 1.00 0.38 11.42
Personal care 1.25 0.30 1.80
Miscellaneous goods and services 0.87 0.36 7.09
Other capital housing costs 0.95 0.21 4.08
Superannuation and life insurance 0.82 0.63 3.06
na not applicable.a Payments on mortgage principal are excluded as they reflect a change in debt–equity, not consumption.Source: Commission estimates
Share sizes are small because the electricity and WSD sectors are smallcompared to the economy, but there is considerable variation acrosscommodities and services. For example, electricity’s share in personal careitems (1.25 per cent) is more than three times its share in tobacco(0.40 per cent). The low shares of electricity and WSD in tobacco reflect, inpart, the high level of tax on tobacco.

G B E P R I C E R E F O R M —E F F E C T S O N H O U S E H O L DE X P E N D I T U R E
9
High shares do not necessarily correspond with high use because differentuser groups may pay different prices. For example, in 1989–90, WSDcharges were often assessed according to property values rather than thelevel of WSD service provided. Melbourne Water estimated that chargesassessed according to property values before WSD reform led to aresidential user in a house paying an effective price of $0.66 per kilolitre ofwater and an office tower in the Melbourne central business district payingan effective price of $10.16 per kilolitre of water (Tasman EconomicResearch 1992). Thus the high cost share of WSD in superannuation andlife insurance, for example, may reflect these considerations.
DIRECT AND INDIRECT PURCHASES BYHOUSEHOLD INCOME GROUP
This section discusses how direct and indirect purchases of electricity andWSD vary across household income groups.
The average expenditure shares of electricity and WSD (as a share of totalexpenditure) in each income group are presented in table 2.
Four features are worth noting:
• the direct and indirect expenditure shares are small for both electricityand WSD;
• the direct shares are larger than the indirect shares for both electricityand WSD, with the electricity share generally larger than that forWSD;
• the direct shares of both electricity and WSD and the indirect sharesfor WSD fall with income; and
• the indirect shares for electricity vary little with income — the sharesof electricity in the different combinations of commodities purchased,by each income group, average out to about the same total share.
In making these observations, it is important to realise that thecharacteristics of households and their expenditure patterns differ betweenand within income groups. These are determined by a range of demographicand socio-economic factors. These factors are likely to include prices of

10 I N D U S T R Y C O M M I S S I O NS T A F F I N F O R M A T I O N
P A P E R
Table 2: Direct and indirect shares of electricity and WSD inhousehold expenditure by household income group(per cent)
Electricity WSD Total
Income group Direct Indirect Direct Indirect
First (lowest) 2.46 0.95 0.91 0.64 4.96
Second 2.86 0.97 1.30 0.60 5.73
Third 2.38 0.97 1.07 0.56 4.97
Fourth 2.23 0.97 0.99 0.53 4.72
Fifth 1.97 0.97 1.01 0.47 4.42
Sixth 1.82 0.96 0.84 0.50 4.12
Seventh 1.66 0.96 0.87 0.48 3.97
Eighth 1.54 0.96 0.73 0.50 3.73
Ninth 1.47 0.97 0.71 0.51 3.66
Tenth (highest) 1.30 0.97 0.75 0.50 3.51
Average 1.82 0.97 0.87 0.51 4.17
Source: Commission estimates
commodities, source of income, family size, the age of family members,nature of housing occupancy, geographic location and climate. Forexample, the majority of households in the bottom three groups rely ongovernment benefits for their principal source of income while householdsin the top three groups rely overwhelmingly on wage and salary income.Thus price changes will affect households differently. Further statisticalwork on the relative importance of different factors to householdexpenditure patterns (both direct and indirect) is currently being undertakenat the Commission.
COST EFFECTS OF GBE PRICE REFORM
This section considers the changes in household expenditure that arise fromthe observed changes in average national electricity and WSD prices from1990–91 to 1994–95. 1990–91 is taken as a starting point because inJuly 1991 the Special Premiers’ Conference agreed to examine a proposalto start a national electricity grid (IC 1995). The effects of price changes inelectricity and WSD are considered separately and then together. In so
G B E P R I C E R E F O R M —E F F E C T S O N H O U S E H O L DE X P E N D I T U R E
11
doing, the estimates illustrate how, from 1990–91 to 1994–95, the indirecteffects on households of price reductions to business could offset directeffects of price increases to households and how the degree of offset variesacross households.
Price reform — changes in residential and business prices — is aconsequence of a number of aspects of GBE reform, including theelimination of cross-subsidies from business to households, the reduction ofGBE costs through more productive use of labour and capital, and pricingschemes that recover the full costs of capital (IC 1995). Year–to–yearmovements in prices will also reflect changes in the cost of primary inputs.For instance, the cost of coal in electricity generation, and changes in thecosts of other inputs. Consequently, observed price changes cannot beattributed solely to GBE reform.
Estimates of direct price changes reflect nationwide averages. Price reformacross states and municipalities is more complex than the average changesused in the calculations. Indeed, significant features of electricity and WSDprice reform have been the development of pricing schemes that promoteefficiency and conservation, by charging consumers based on their use of,access to, and cost of service. Analysis of the effects of reform for specificstates or municipalities requires specific information. Caution must beexercised in applying the estimated average effects to any individualhousehold or business. Nevertheless, the use of nationwide averages shouldgive approximate indications of the relative and absolute sizes of direct andindirect cost effects of electricity and WSD reform.
ELECTRICITY PRICE CHANGES
Electricity price changes from 1990–91 to 1994–95 vary across states. Allstates except Victoria had relatively stable residential prices over the four-year period (table 3).5 In contrast, New South Wales, South Australia andWestern Australia had significant reductions in the prices charged tobusiness. Consequently, the average residential price increased by 3 percent and average business price fell by 13 per cent over the four-yearperiod. On average, cross-subsidies have been reduced by keeping
--------------------------------------
5 Price changes for the previous four years are given as points of comparison.

12 I N D U S T R Y C O M M I S S I O NS T A F F I N F O R M A T I O N
P A P E R
residential prices
Table 3: Change in real electricity prices from 1986–87 to 1990–91 and from 1990–91 to 1994–95a (per cent)
Residential Business
State1986–87 to 1990–
911990–91 to 1994–
951986–87 to 1990–
911990–91 to 1994–
95
NSW -4 -1 -5 -24
Vic -6 18 -18 -8
Qld -22 -4 -18 1
SA -6 1 -14 -20
WA -6 -4 -11 -17
Tas 1 4 -4 3
NT -19 -1 -22 -1
ACT -1 0 2 -5
Total -8 3 -12 -13
a Calculated from residential, commercial and industrial prices using consumption quantities for 1990–91.
Source: ESAA (1992, 1996)
relatively stable in real terms and lowering prices to business. Victoria, incontrast, chose to pass on cost savings initially to taxpayers by increasingthe return to existing capital, with consumers to benefit later as competitionin electricity generation is introduced (IC 1995).
Applying the estimated price changes to household expenditure patterns,the overall effect — taking into account both direct and indirect effects —is a reduction in household expenditure of 0.14 per cent or $50 a year perhousehold (table 4). The reduction in expenditure tends to increase in bothpercentage and dollar terms as income increases.
Household consumption patterns vary within income groups. Althoughexpenditure in each income group declines on average after the electricityprice changes, it increases for 5 per cent of households by an average of$9 a year per household (table 5). This compares with an average reductionof $50 a year per household for all households (table 4). In the lowestincome group, household expenditure increases for 11 per cent of

G B E P R I C E R E F O R M —E F F E C T S O N H O U S E H O L DE X P E N D I T U R E
13
households. Most households in the lower three income groups whose
Table 4: Change in household expenditure from changes inelectricity prices by income groupa,b
Income groupDirect effects
(per cent)Indirect
effects(per cent)
Totalc
(per cent)1995–96
$ per year
First (lowest) 0.07 -0.19 -0.11 -29
Second 0.09 -0.19 -0.11 -18
Third 0.07 -0.19 -0.12 -29
Fourth 0.07 -0.19 -0.13 -37
Fifth 0.06 -0.19 -0.13 -50
Sixth 0.05 -0.19 -0.14 -56
Seventh 0.05 -0.19 -0.14 -63
Eighth 0.05 -0.19 -0.14 -68
Ninth 0.04 -0.19 -0.15 -71
Tenth (highest) 0.04 -0.19 -0.15 -84
Average 0.05 -0.19 -0.14 -50
a Calculated assuming that the underlying quantities purchased do not change.b Dollar values have been inflated from the 1988–89 values in the HES to aid interpretation. In so doing
two points are worth noting. First, changes in the CPI reflect, in part, the reform that has beenintroduced to date. Second, the CPI is based on the expenditure pattern of a representative householdand this may not be representative for each income group.
c Totals may not add due to rounding.Source: Commission estimates
household expenditure increases, have government payments as theirprincipal source of income. 6
--------------------------------------
6 These include age, invalid or wife’s pensions; sole parent or widow’s pensions;unemployment benefits; sickness benefits; veterans affairs pensions; and family,student, child endowment or other government benefits.

14 I N D U S T R Y C O M M I S S I O NS T A F F I N F O R M A T I O N
P A P E R
Table 5: Share of households by income group whoseexpenditure increases after changes in electricitypricesa,b
Households whose expenditure increases
Income group
Share whoseexpenditure
increases(per cent)
Averagechange in cost
(per cent)
Averagechange in cost
(1995–96$ per year)
Proportion whoseprincipal source of
income is governmentpayments (per cent)
First (lowest) 11 0.09 11 74
Second 13 0.07 6 93
Third 6 0.10 11 86
Fourth 6 0.05 7 38
Fifth 3 0.05 7 10
Sixth 2 0.03 5 0
Seventh 3 0.10 15 1
Eighth 3 0.03 7 0
Ninth 1 0.06 10 0
Tenth (highest) 2 0.08 14 0
Average 5 0.07 9 57
a Calculated assuming that the underlying quantities purchased do not change.b Dollar values have been inflated from the 1988–89 values in the HES to aid interpretation. In so doing,
two points are worth noting. First, changes in the CPI reflect, in part, the reforms that have beenintroduced. Second, the CPI is based on the expenditure pattern of a representative household and thismay not be representative for each income group.
Source: Commission estimates
Often a household’s receipt of government payments entitles it to electricityand WSD price concessions. No attempt was made to estimate changes inelectricity and WSD concessions to these groups that may have occurredfrom 1990–91 to 1994–95. Any increased concession that offsets anaverage price increase would lessen the impact of residential price increaseson concession groups and in such cases the estimated increase inexpenditure would overstate what actually occurred. By the same token,increased concessions would also mean that households that did not receivethese concessions would pay prices greater than the estimated average,although the difference is likely to be small because there are morehouseholds that do not receive concessions than households that do.

G B E P R I C E R E F O R M —E F F E C T S O N H O U S E H O L DE X P E N D I T U R E
15
WSD PRICE CHANGES
Data were not available to assess changes in WSD prices throughoutAustralia. Instead data from water authorities in Sydney, Melbourne andSouth Australia were used to calculate the price changes. Price changeshave been relatively modest for these water authorities except for those tocommercial and industrial users by the Sydney Water Corporation andthose to residential and other users by the Melbourne Water Industry(table 6).
Table 6: Change in real WSD prices, 1990–91 to 1994–95(per cent)
Municipality Residential Commercial Industrial Other
Sydney Water Corporation 7 -31 -18 1
Melbourne Water Industry a 23 2 8 21
Engineering and Water SupplyDept (Metropolitan)b 2 -4 5 -2
Engineering and Water SupplyDept (Country)b 5 10 5 -4
Averagec 12 -15 -6 9
a The Melbourne Water Industry is a statistical aggregation of the three retail water businesses and thewholesale water business created when Melbourne Water was disaggregated on 1 January 1995.
b The Engineering and Water Supply Department was corporatised to form the South Australian WaterCorporation from 1 July 1995.
c Calculated using revenue weights from 1990–91.Source: SCGTE (1996)
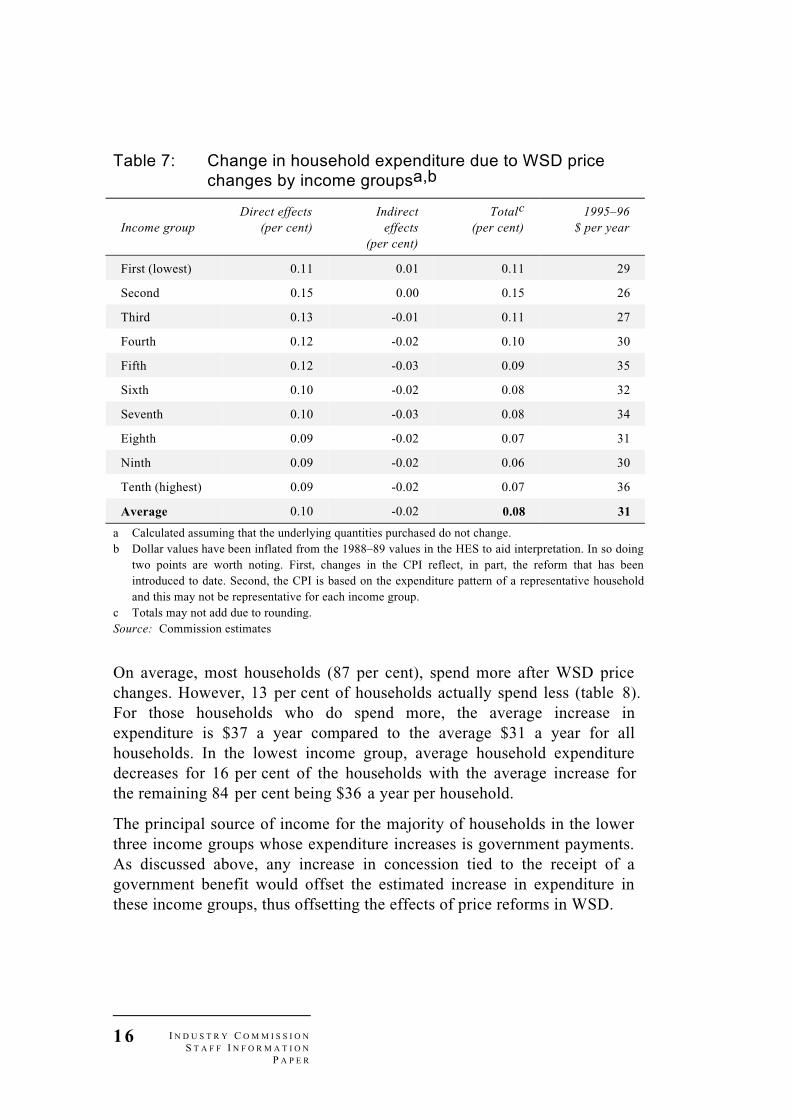
The direct effect of WSD price changes on households is an increase intheir expenditure. In contrast, the indirect effect is a reduction in the cost ofother goods and services to households because of the reduction in averageWSD prices to commercial and industrial users. The net effect of thechanges is an increase in the average household expenditure for eachincome group (table 7). In percentage terms, the increase in expendituretends to decrease with income. The dollar value of the cost changes varieswith income with a slight and uneven upward trend.
16 I N D U S T R Y C O M M I S S I O NS T A F F I N F O R M A T I O N
P A P E R
Table 7: Change in household expenditure due to WSD pricechanges by income groupsa,b
Income groupDirect effects
(per cent)Indirect
effects(per cent)
Totalc
(per cent)1995–96
$ per year
First (lowest) 0.11 0.01 0.11 29
Second 0.15 0.00 0.15 26
Third 0.13 -0.01 0.11 27
Fourth 0.12 -0.02 0.10 30
Fifth 0.12 -0.03 0.09 35
Sixth 0.10 -0.02 0.08 32
Seventh 0.10 -0.03 0.08 34
Eighth 0.09 -0.02 0.07 31
Ninth 0.09 -0.02 0.06 30
Tenth (highest) 0.09 -0.02 0.07 36
Average 0.10 -0.02 0.08 31
a Calculated assuming that the underlying quantities purchased do not change.b Dollar values have been inflated from the 1988–89 values in the HES to aid interpretation. In so doing
two points are worth noting. First, changes in the CPI reflect, in part, the reform that has beenintroduced to date. Second, the CPI is based on the expenditure pattern of a representative householdand this may not be representative for each income group.
c Totals may not add due to rounding.Source: Commission estimates
On average, most households (87 per cent), spend more after WSD pricechanges. However, 13 per cent of households actually spend less (table 8).For those households who do spend more, the average increase inexpenditure is $37 a year compared to the average $31 a year for allhouseholds. In the lowest income group, average household expendituredecreases for 16 per cent of the households with the average increase forthe remaining 84 per cent being $36 a year per household.
The principal source of income for the majority of households in the lowerthree income groups whose expenditure increases is government payments.As discussed above, any increase in concession tied to the receipt of agovernment benefit would offset the estimated increase in expenditure inthese income groups, thus offsetting the effects of price reforms in WSD.

G B E P R I C E R E F O R M —E F F E C T S O N H O U S E H O L DE X P E N D I T U R E
17
Table 8: Share of households by income group whoseexpenditure increases after changes in WSD pricesa,b
Households whose expenditure increases
Income group
Share whoseexpenditure
increases(per cent)
Averagechange in cost
(per cent)
Averagechange in cost
(1995–96$ per year)
Proportion whoseprincipal source of
income is governmentpayments (per cent)
First (lowest) 84 0.15 36 63
Second 90 0.18 30 81
Third 87 0.15 33 62
Fourth 87 0.13 36 31
Fifth 90 0.11 40 9
Sixth 90 0.09 37 5
Seventh 87 0.10 42 2
Eighth 84 0.09 40 0
Ninth 86 0.08 37 1
Tenth (highest) 88 0.08 44 0
Average 87 0.10 37 25
a Calculated assuming that the underlying quantities purchased do not change.b Dollar values have been inflated from the 1988–89 values in the HES to aid interpretation. In so doing,
two points are worth noting. First, changes in the CPI reflect, in part, the reform that has beenintroduced to date. Second, the CPI is based on the expenditure pattern of a representative householdand this may not be representative for each income group.
Source: Commission estimates
COMBINING REFORMS
In this section, electricity and WSD price changes are considered jointly toillustrate how they interact.
For most income groups, the average expenditure savings to householdsfrom electricity price reforms are larger than the average increases inexpenditure from WSD price changes (table 9). Therefore for households inthese groups, when the effects of the two reforms are considered together,their average expenditure decreases. For the second income group, theaverage savings from electricity price changes are less than the averageexpenditure increases from WSD price changes. Average householdexpenditure thus increases for households in this income group.

18 I N D U S T R Y C O M M I S S I O NS T A F F I N F O R M A T I O N
P A P E R
Table 9: Combined change in expenditure due to electricity andWSD price changes by income groupa,b,c (per cent)
Income group Electricity WSD Total
First (lowest) -0.11 0.11 0.00
Second -0.11 0.15 0.05
Third -0.12 0.11 -0.01
Fourth -0.13 0.10 -0.03
Fifth -0.13 0.09 -0.04
Sixth -0.14 0.08 -0.06
Seventh -0.14 0.08 -0.06
Eighth -0.14 0.07 -0.08
Ninth -0.15 0.06 -0.09
Tenth (highest) -0.15 0.07 -0.09
Average -0.14 0.08 -0.05
a Calculated assuming that the underlying quantities purchased do not change.b Dollar values have been inflated from the 1988–89 values in the HES to aid interpretation. In so doing,
two points are worth noting. First, changes in the CPI reflect, in part, the reform that has beenintroduced to date. Second, the CPI is based on the expenditure pattern of a representative householdand may not be representative of the expenditure pattern of each income group.
c Totals may not add due to rounding.Source: Commission estimates
The average reduction in expenditure for most income groups masks thevariation of outcomes across income groups. For example, although averagehousehold expenditure increases for 39 per cent of all households(table 10), reductions in average expenditure occurs for more than half ofthe households in each of the upper seven income groups.

G B E P R I C E R E F O R M —E F F E C T S O N H O U S E H O L DE X P E N D I T U R E
19
Table 10: Share of households by income group whoseexpenditure increases after combining electricity andWSD price changesa,b
Households whose expenditure increases
Income group
Share whoseexpenditure
increases(per cent)
Averagechange in cost
(per cent)
Averagechange in cost
(1995–96$ per year)
Proportion whoseprincipal source of
income is governmentpayments (per cent)
First (lowest) 53 0.15 28 65
Second 66 0.19 25 85
Third 55 0.16 26 72
Fourth 45 0.14 27 35
Fifth 39 0.11 28 14
Sixth 32 0.10 25 9
Seventh 30 0.12 33 2
Eighth 30 0.09 27 1
Ninth 21 0.10 29 2
Tenth (highest) 24 0.11 35 0
Average 39 0.13 28 39
a Calculated assuming that the underlying quantities purchased do not change.b Dollar values have been inflated from the 1988–89 values in the HES to aid interpretation. In so doing,
two points are worth noting. First, changes in the CPI reflect, in part, the reform that has beenintroduced to date. Second, the CPI is based on the expenditure pattern of a representative householdand may not be representative of the expenditure pattern of each income group.
Source: Commission estimates
As before, most households in the lower three income groups whoseexpenditure increases after combined price changes also receive somegovernment payment as their principal source of income. Any increases inconcessions in electricity and WSD charges to these groups would reducetheir estimated increase in expenditure. However, it should be noted thateven without allowing for compensation mechanisms related to the receiptof government benefits, average expenditure does decrease for 47 per centof those in the lowest income group. In addition, as only two sectors areconsidered here, it is quite possible that the households whose expenditureincreases after electricity and WSD price changes would gain in an evenbroader package of GBE price changes.

20 I N D U S T R Y C O M M I S S I O NS T A F F I N F O R M A T I O N
P A P E R
SUMMARY
Much of the rationale for price reforms in GBEs is to obtain a moreefficient and equitable allocation of costs to users. Price reforms affecthousehold expenditure not only through their direct effects on the prices ofthe products subject to reform, but through indirect effects of the reformson the costs of other goods and services consumed by households. It isimportant to be aware of these distributional effects as part of understandingthe overall impact of price reforms in GBEs.
Traditionally, little attempt has been made to estimate the indirect effects ofprice reforms on the distribution of income. In this paper, a first attempt hasbeen made to estimate both the direct and indirect effects of price reform inelectricity and water, sewerage and drainage on the distribution of incomeby looking at expenditure by income group.
Although the caveats attached to the models used in this exercise need to beborne in mind when interpreting the results, the analysis illustrates theimportance of allowing for indirect effects when estimating distributionalimpacts.
In the case of electricity, the reduction in household expenditure from theindirect price effects more than offsets the increase in expenditure from thedirect effects for all income groups. The price reforms therefore result in anoverall decrease in household expenditure in each income group. Thisoverall decrease in expenditure appears to increase with income, bothrelatively and absolutely.
In the case of WSD, the results do not exhibit the same smooth trends.Here, the direct price effects increase household expenditure in each incomegroup. Apart from households in the lowest income group, the relativeincreases in expenditure appear to decrease with income. However, thechange in expenditure from the indirect price effects are insufficient tooffset those from the direct price effects. Therefore, the overall price effectsof this reform result in an increase in expenditure for each income group.Both the relative increase in expenditure and the absolute increase tend todecrease with income.
The results illustrate how overall increases in expenditure from one reform(WSD in this case) can be partly offset by overall decreases in expenditurefrom another reform (electricity). Considering both reforms together, mostincome groups realise small expenditure decreases, although the changes

G B E P R I C E R E F O R M —E F F E C T S O N H O U S E H O L DE X P E N D I T U R E
21
are almost totally offsetting for the lowest income group, with the secondlowest income group experiencing a small increase in expenditure.
The study suggests that considering only the direct effects of GBE pricereform is likely to overstate the negative impacts on household expenditure.

22 I N D U S T R Y C O M M I S S I O NS T A F F I N F O R M A T I O N
P A P E R
G B E P R I C E R E F O R M —E F F E C T S O N H O U S E H O L DE X P E N D I T U R E
23
References
ABS (Australian Bureau of Statistics) 1989, 1988–89 HouseholdExpenditure Survey, Australia: Unit Record Files on Magnetic Tape,ABS Catalogue no. 6538.0, Canberra.
Agrawal, N. 1987, Analysing Distributional Issues Using Equivalent AdultDisposable Incomes, IMPACT Project Preliminary Working Paper no.IP–32, University of Melbourne, July, available from MonashUniversity.
ESAA (Electricity Supply Association of Australia Limited) 1992,Electricity Australia 1992, Equity Press, Sydney.
——1996, Electricity Tariffs in Australia 1 July 1996, ESAA, Sydney.
IAC (Industries Assistance Commission) 1989, Using Input–OutputAnalysis and Multipliers, Working Paper no. 12, IAC, Canberra.
IC (Industry Commission) 1995, The Growth and Revenue Implications ofHilmer and related Reforms, A Report by the Industry Commission tothe Council of Australian Governments, Final Report, AGPS,Canberra.
——1996a, Annual Report 1995–96, AGPS, Canberra.
——1996b, Reform and the Distribution of Income — An Economy-wideApproach, Staff Information Paper, Industry Commission, Melbourne.
Kenderes, M. and Strzelecki, A. 1995, Listing of the 1989–90 OraniDatabase, Research Memorandum OA-635, Industry Commission,Canberra, April.
SCGTE (Steering Committee on National Performance Monitoring ofGovernment Trading Enterprises) 1996, Government TradingEnterprises Performance Indicators 1990–91 to 1994–95, Volume 2:Data, Melbourne.
Tasman Economic Research 1992, Distributional Effects of Cost BasedPricing: A Report for the Industry Commission Examining the Effectsof Alternative Pricing Strategies on Melbourne Water Users, TasmanInstitute, Melbourne.

24 I N D U S T R Y C O M M I S S I O NS T A F F I N F O R M A T I O N
P A P E R
Wright, J. and Dolan, A. 1992, ‘The use of HES Data in DistributionalAnalysis’, Commonwealth Treasury, Paper presented at the 21Conference of Economists, University of Melbourne, July 8–10.