Gayle B. Zydlewski
18
Fish interactions with marine renewable devices: lessons learned, from ecological design to improving cost- effectiveness Gayle B. Zydlewski Haley Viehman, Garrett Staines Haixue Shen, James McCleave, Jeffrey Vieser
Transcript of Gayle B. Zydlewski
Fish interactions with marine
renewable devices: lessons learned, from ecological
design to improving cost-effectiveness
Gayle B. Zydlewski Haley Viehman, Garrett Staines
Haixue Shen, James McCleave, Jeffrey Vieser

N.S.
N. B.
Maine
Eastport
Lubec
DEER ISLAND (CAN)
WASHINGTON COUNTY (MAINE)
Proposed project area
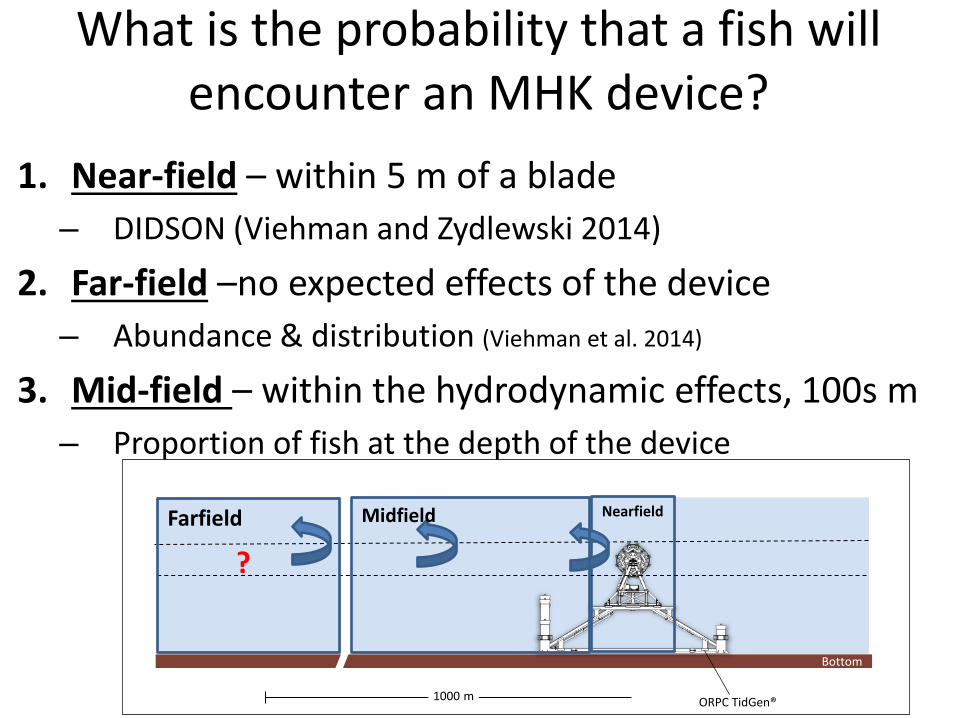
What is the probability that a fish will encounter an MHK device?
1. Near-field – within 5 m of a blade – DIDSON (Viehman and Zydlewski 2014)
2. Far-field –no expected effects of the device – Abundance & distribution (Viehman et al. 2014)
3. Mid-field – within the hydrodynamic effects, 100s m – Proportion of fish at the depth of the device
1000 m
Bottom
ORPC TidGen®
Nearfield Farfield
?
Midfield

Why consider multiple space and time scales?
N 30 m
Space
Subtidal
Vieser, MS Thesis
Fall
Summer

1. Nearfield
N 30 m
Nearfield
ORPC TidGen®

• Pass By (51%)
•Through Turbine (48%): – Into Turbine – Out of turbine
•Active Avoidance (1%):
– Above – Reverse – Below
Approach Depart
Flow
Viehman and Zydlewski. 2014. Estuaries and Coasts.
Spatial Scale: within 5 m
3.3m

2. Farfield
1000 m 15 m
Bottom
N 1000 m
Project Control/reference N 30 m N 30 m
Nearfield
ORPC TidGen®
Project
Control/Reference

Seasonal patterns of relative abundance
Control/Reference Bottom support frame deployed Turbine deployed Project Site
2011
J F M A M J J A S O N D Month
Volu
me
back
scat
ter (
dB)
2012
J F M A M J J A S O N D
Sites different

Proportion of fish at different depths
1000 m 15 m
Bottom
Project
ORPC TidGen®
Control/Reference
N 30 m
Device • Beside • In-line

2011 Project Control/
Reference
Mar
Au
g Se
p
Viehman et al. 2014
2013 Beside turbine
Control/ Reference
In line w/turbine
Proportion of backscatter
0 0.5 0
25 Distance from
bottom
(m)
• Evidence of avoidance (?) – Beside and in-line
• Possible avoidance during construction – Decreased density at project site
• 3 surveys while deployed (not enough!)

3. Midfield: 100s m
NEARFIELD
ORPC TidGen®
N 30 m
60 m 15 m
Bottom
Area viewed by mobile surveys (200 m up- and
downstream of turbine)
Mobile surveys
ORPC TidGen® N 30 m
Beside turbine
In-line with turbine

Spatial scale: 200 m
Fish track Turbine
Flow
Upstream
Wake After wake
0
0.1
0.2
0.3
0.4
0.5
0.6
Transect 1 Transect 2 Transect 4 Transect 8
Fish
per
met
er
UpstreanWakeAfter wake
Upstream

Project integration–Probability of encounter (P) 1. Near-field - DIDSON (Viehman and Zydlewski 2014)
– Within 3.3m, only 1% of fish at turbine level avoided
2. Far-field - Abundance & distribution (Viehman et al. 2014) – Proportion of fish at turbine depth, without the turbine (p1, p2) – Proportion of fish at turbine depth, with turbine (p2)
3. Mid-field - Mobile transects – Proportion of fish at turbine depth, with turbine (p3)
1000 m
Bottom
ORPC TidGen®
Nearfield Farfield
p1 Midfield
p2 p3
px = f(time of day, tide, month, year)

Most of the picture… What about temporal resolution?
NEARFIELD
ORPC TidGen®
N 30 m
Area viewed by mobile surveys (200
m up- and downstream of
turbine)
60 m 15 m
Bottom
Mobile surveys (7° split beam echosounder)
Stationary 24-hr surveys (31° single beam echosounder) Nearfield
(DIDSON) Beside turbine
ORPC TidGen®
In-line with turbine
N 30 m
Determine sampling periodicity to represent variability over a month

Acknowledgments • Zydlewski Lab
– Megan Altenritter – Matthew Altenritter – Matthew Dzaugis – Patrick Erbland – Brittney Fleenor – Andrew George – Alexander Jensen – Amy Wyman
• Chris Bartlett • Captain Butch Harris and crew • Fishermen and community partners • UMaine’s Sustainability Solutions Initiative • ORPC
Award EPS-0904155

Limitations 1. Near-field - DIDSON (Viehman and Zydlewski 2014)
Limitations: resolution and sampling volume, large amount of data, time required for data processing
2. Far-field - Abundance & distribution (Viehman et al. 2014)
Limitations: 24 h surveys representing seasonal data, sampling close enough to device, inability to discriminate species
3. Mid-field - Mobile transects Limitations: low long-term temporal resolution, inability to discriminate species

Area viewed by mobile surveys (200
m up- and downstream of
turbine)
60 m 15 m
Bottom
Mobile surveys (7° split beam echosounder)
Stationary 24-hr surveys (31° single beam echosounder) Area viewed by DIDSONs
(at the test turbine) Beside turbine
ORPC TidGen®
In-line with turbine
Mobile survey data exclusion zone
N 30 m

Natural variation: in Space and Time