
Gavin Fay [email protected] @gavin_fay Using size increment data in age-structured stock assessment...
27
Gavin Fay [email protected] @gavin_fay www.thefaylab.com Using size increment data in age- structured stock assessment models CAPAM growth workshop: Nov 2014 Acknowledgements Megan Winton (CFF) Rick Methot (NMFS) Alex da Silva, Mark Maunder (IATTC) Laura Lee (NCDENR) Geoff Tuck (CSIRO)
-
Upload
angel-catton -
Category
Documents
-
view
216 -
download
2
Transcript of Gavin Fay [email protected] @gavin_fay Using size increment data in age-structured stock assessment...

Gavin [email protected]
@gavin_faywww.thefaylab.com
Using size increment data in age-structured stock assessment models
CAPAM growth workshop: Nov 2014
AcknowledgementsMegan Winton (CFF)Rick Methot (NMFS)Alex da Silva, Mark Maunder (IATTC)Laura Lee (NCDENR)Geoff Tuck (CSIRO)
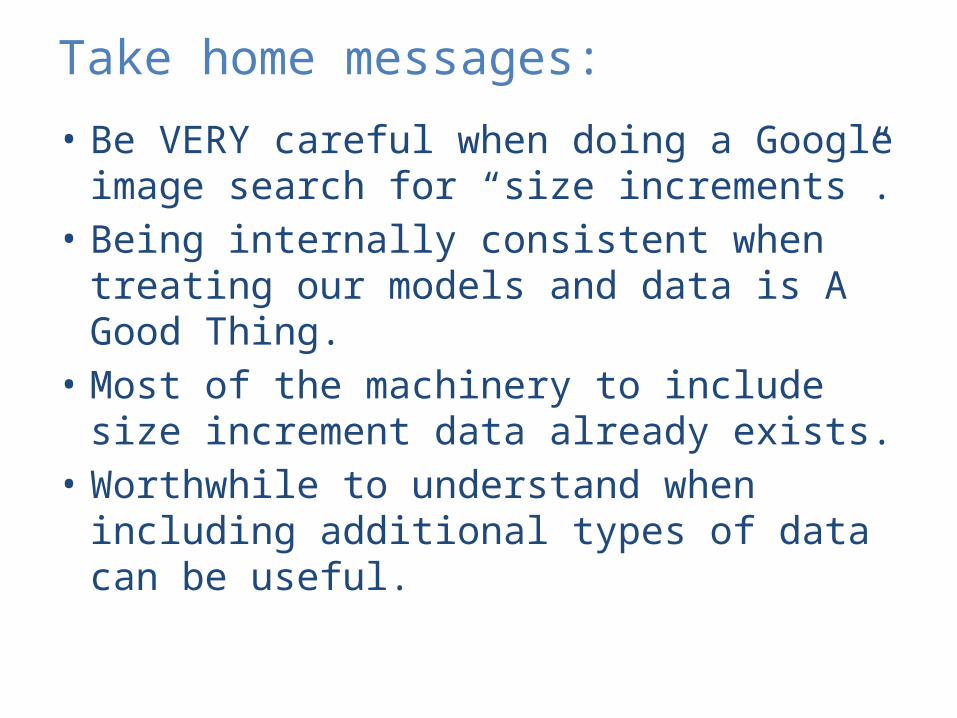
Take home messages:
• Be VERY careful when doing a Google image search for “size increments”.
• Being internally consistent when treating our models and data is A Good Thing.
• Most of the machinery to include size increment data already exists.
• Worthwhile to understand when including additional types of data can be useful.

Size increment data from tag recaptures
• Models external to assessments• Challenges for including in assessment models• An Approach (with Synthesis in mind)• Stock Synthesis modifications for
implementation.
some time passes….

How have size increment data been used?
External from assessment model• Estimate growth parameters e.g. Fabens (1965), Laslett et al. (2002)• Used to corroborate assessment model estimates of
growth
Internally in assessment model• CASAL (multinomial size at recapture)• Estimate size transition matrices [see Punt later for size-structured models]
Generally, growth increments have not been included among data used to fit age-structured stock assessment models.
CHALLENGES ARISE
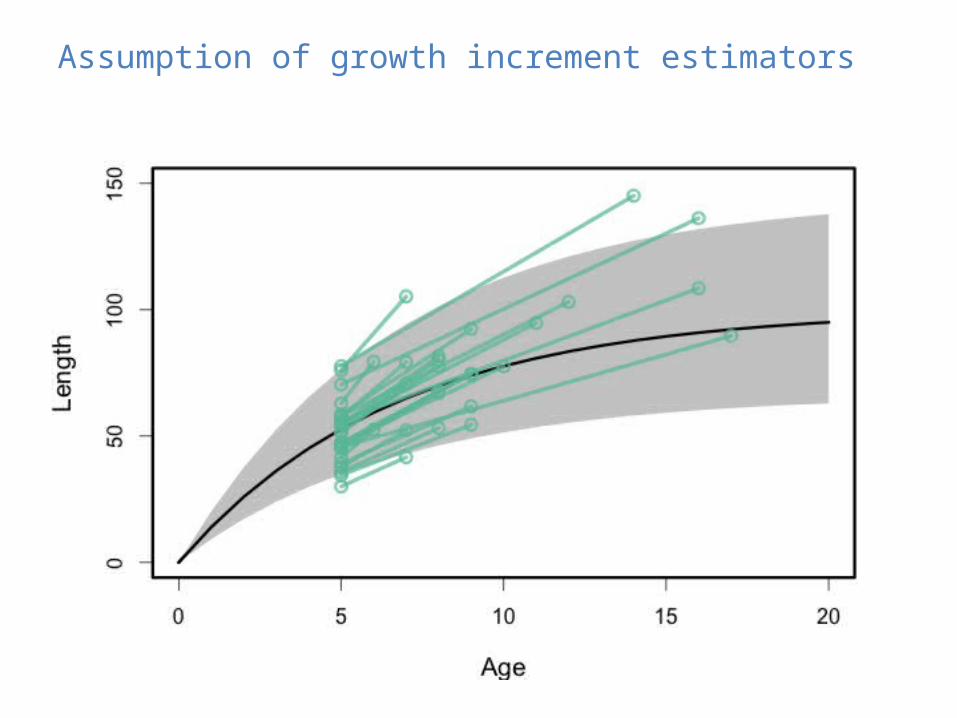
Assumption of growth increment estimators

Assumption of growth increment estimators

Assumption of most age-structured stock assessment models

Assumption of most age-structured stock assessment models

Selectivity can also produce bias

Selectivity can also produce bias
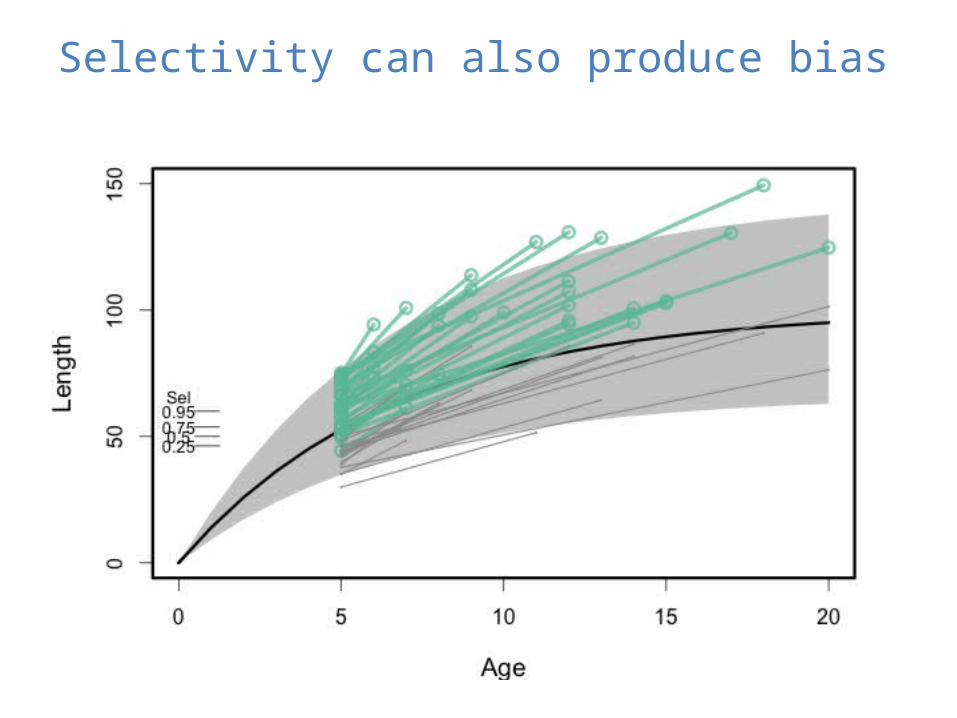
Selectivity can also produce bias
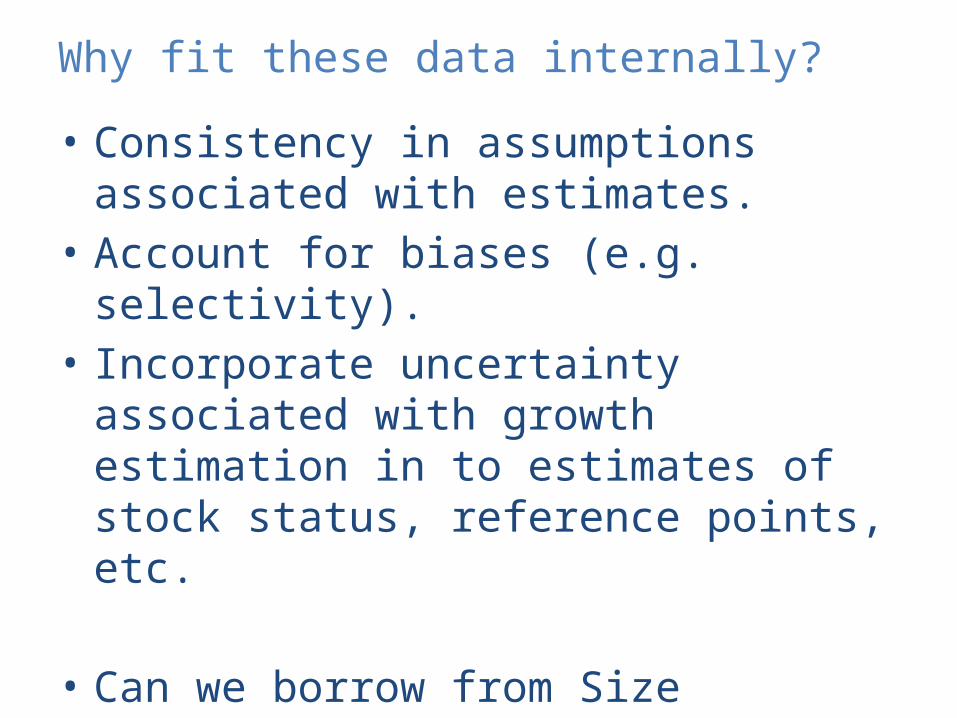
Why fit these data internally?
• Consistency in assumptions associated with estimates.
• Account for biases (e.g. selectivity).• Incorporate uncertainty associated with
growth estimation in to estimates of stock status, reference points, etc.
• Can we borrow from Size structured models?

Methods
• Fabens (1965) [and extensions]– Growth increment given time at liberty– Often model individual variation in one or more
parameters.• Laslett et al. (2002) [LEP]
– Join distribution of sizes at release and recapture given time at liberty, integrate over age at release.
– Individual variation in Linfinity
• Multinomial size at recaptureQ: When is it OK to use the simple(r) methods?

LEP-ish in something like Stock Synthesis
Need to obtain distribution for age at release.If condition on size at release, this is the conditional age at length!
Size at recapture
Size at release
Time at liberty
Age at release Model parameters
Conditional age-at-length
Aires da Silva et al. 2014. Fish Res.

Conditional age given size at release
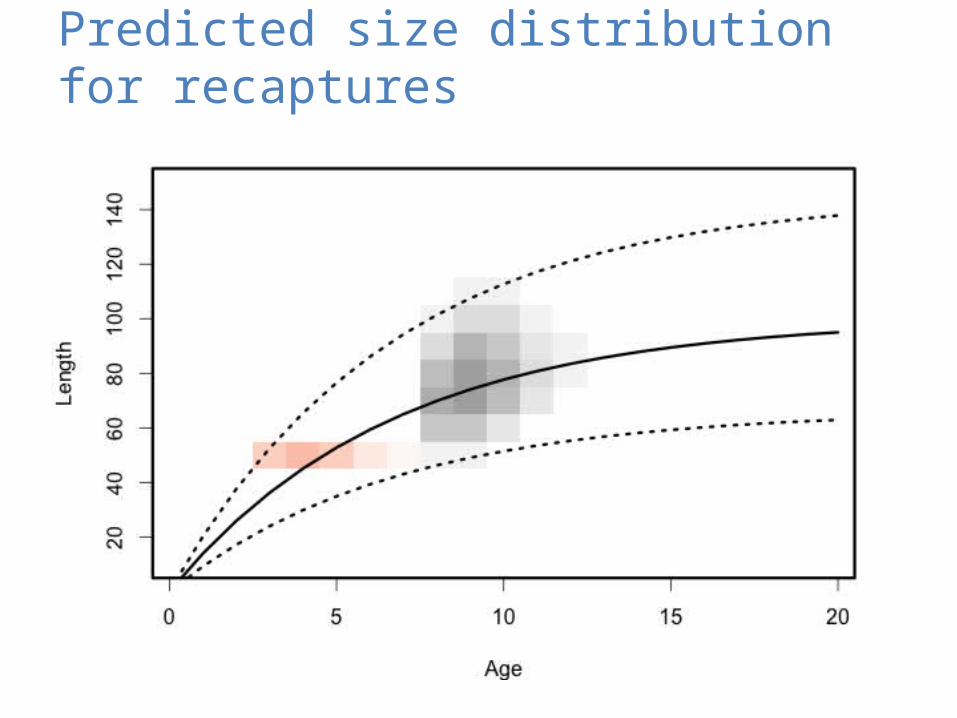
Predicted size distribution for recaptures

Integrate across ages to compare to observations

Tagging in Stock Synthesis
• Tag releases assigned to ‘tag groups’– Collection of tags all released at same time– Each group assigned same age at release
• Tag recaptures by group negative binomial– Multinomial tag recaptures by fleet/area – Why not extend this to length bin?
(e.g. MAST, Taylor et al.)

Predicted size distribution for recaptures

Modifications to Stock Synthesis
• Likelihood for LEP ‘easily’ added.• Creates inconsistency with approach used to
model tag recaptures.• Alternative is to model tag recapture numbers
by expected size, rather than adding likelihood component.
• Solution? Define tag groups as releases by length.
• Opportunity to expand on tagging module, provide full functionality to tagging parameters.

Curse of longitudinal data….
• Still no correlation between length at release and length at recapture, except for age.
Possible solutions:• Send in the Platoons?• Estimate covariance
in deviations from meanlength? (cf Laslett et al.)

Next steps
• Get this working in a simple SCAA model, step to Stock Synthesis
• Identify case studies with unique properties; what situations do we want to evaluate these data for?
• Simulation testing to understand relative performance of applying different methods.
• What do we gain from including these data?• Can we expand this to multiple observations
of size increments for a single individual?e.g. otolith growth chronology

Take home messages:
• Be VERY careful when doing a Google image search for “size increments”.
• Being internally consistent when treating our models and data is A Good Thing.
• Most of the machinery to include size increment data already exists.
• Still not perfect, but we’re not all Thorson.• Worthwhile to understand when including
additional types of data can be useful.

Discussion questions
• Are there options for estimating ‘dependence’ in length other than plmph?(plmph = platoon – morph – phenotype)
• Case studies with unique properties?• Can we expand this to multiple observations
of size increments for a single individual?e.g. otolith growth chronology

CSIRO. Fay, Tuck and Haddon. Evaluating Macquarie Island Toothfish Assessment. July 2010
Evaluating Tagging in Stock SynthesisHow does the assignment of ages to tag releases impact the performance of the assessment model?
fix: assume fixed age of releases
1, 3, 5, 7: number of tag groups
lots: ages assigned individually
spawning biomass
trawl available biomass
unfished-4
0-2
00
2040
2010 2010/unfished
pre-tagging
-40
-20
020
40
fix 1 3 5 7 lots
2009
fix 1 3 5 7 lots
2009/pre-tagging
fix 1 3 5 7 lots
% r
ela
tive
err
or
of e
stim
ate
# tag groups