Gatwick sub-region WCS - Horsham
196
CIN-JBAU-XX-XX-RP-EN-0001-A1-C03-WCS_Report.docx i Gatwick Sub-Region Water Cycle Study Final Report August 2020 www.jbaconsulting.com Crawley Borough Council, Horsham District Council, Mid Sussex District Council & Reigate and Banstead District Council
Transcript of Gatwick sub-region WCS - Horsham

CIN-JBAU-XX-XX-RP-EN-0001-A1-C03-WCS_Report.docx i
Gatwick Sub-Region
Water Cycle Study
Final Report
August 2020
www.jbaconsulting.com
Crawley Borough Council, Horsham District Council,
Mid Sussex District Council & Reigate and Banstead District Council

Gatwick sub-region Water Cycle Study ii
JBA Project Manager
Ed Hartwell BSc MSc MCIWEM C.WEM FRGS
35 Perrymount Rd
Haywards Heath
RH16 3BW
Revision History
Revision Ref/Date Amendments Issued to
S3-P01 – 28/02/2020 Draft Report Crawley Borough Council
Horsham District Council
Mid Sussex District Council
Reigate and Banstead District Council
South East Water
SES Water
Southern Water
Thames Water
Environment Agency
S3-P02 – 20/07/2020 Draft Final Crawley Borough Council
Horsham District Council
Mid Sussex District Council
Reigate and Banstead District Council
A1-P03 – 28/08/2020 Final Crawley Borough Council
Horsham District Council
Mid Sussex District Council
Reigate and Banstead District Council
Contract
This report describes work commissioned by Crawley Borough Council. Richard Pardoe, Holly
Cavill and Saskia Salwey of JBA Consulting carried out this work.
Prepared by .................................. Louise Morgan BSc
Technical Assistant
.................................................... Saskia Salwey BSc
Assistant Analyst
.................................................... Holly Cavill BSc
Analyst
.................................................... Richard Pardoe MSc MEng
Analyst

Gatwick sub-region Water Cycle Study iii
Reviewed by .................................. Paul Eccleston BA CertWEM CEnv MCIWEM C.WEM
Technical Director
Purpose
This document has been prepared as a Final Report for Crawley Borough Council acting on behalf
of the councils in the Gatwick Sub-Region (Crawley Borough Council, Horsham District Council,
Mid Sussex District Council, and Reigate and Banstead District Council, hereby referred to as “the
Councils”). JBA Consulting accepts no responsibility or liability for any use that is made of this
document other than by the Councils for the purposes for which it was originally commissioned
and prepared.
JBA Consulting has no liability regarding the use of this report except to Crawley Borough Council.
Copyright
© Jeremy Benn Associates Limited 2020.
Carbon Footprint
JBA is aiming to reduce its per capita carbon emissions.

Gatwick sub-region Water Cycle Study iv
Executive Summary
In November 2019, JBA Consulting was commissioned by Crawley Borough Council acting on
behalf of the councils in the Gatwick Sub-Region (Crawley Borough Council, Horsham District
Council, Mid Sussex District Council and Reigate and Banstead Council), to undertake a joint
Water Cycle Study (WCS) to inform and provide updated evidence for the councils pre-existing
and emerging Local or District Plans. This study assesses the potential issues relating to future
development within the Gatwick Sub-Region and the impacts on water supply, wastewater
collection and treatment and water quality. The Water Cycle Study is required to assess the
constraints and requirements that will arise from potential growth on the water infrastructure.
New homes require the provision of clean water, safe disposal of wastewater and protection from
flooding. The allocation of large numbers of new homes in certain locations may result in the
capacity of existing available infrastructure being exceeded, a situation that could potentially
cause service failures to water and wastewater customers, adverse impacts to the environment,
or high costs for the upgrade of water and wastewater assets being passed on to the bill payers.
In addition to increased housing demand, future climate change presents further challenges to
the existing water infrastructure network, including increased intensive rainfall events and a
higher frequency of drought events. Sustainable planning for water must now take this into
account. The water cycle can be seen in the figure below and shows how the natural and man-
made processes and systems interact to collect, store or transport water in the environment.
The Water Cycle
Source: Environment Agency – Water Cycle Study Guidance
This study will assist the councils in the Gatwick Sub-Region to select and develop sustainable
development allocations where there is minimal impact on the environment, water quality, water
resources, infrastructure and flood risk. This has been achieved by identifying areas where there
may be conflict between any proposed development, the requirements of the environment (and
the environmental legislative tests) and by recommending potential solutions to these conflicts.
The Water Cycle Study has been carried out in co-operation with the water companies, the
Environment Agency (EA) and Natural England (NE) whilst also using published information from
the neighbouring Local Planning Authorities (LPAs).
Potential development sites were provided by Crawley Borough Council (CBC), Horsham District
Council (HDC), Mid Sussex District Council (MSDC) and Reigate & Banstead Borough Council

Gatwick sub-region Water Cycle Study v
(RBBC) and wastewater treatment works (WwTW) likely to serve growth in the area were
identified using the Environment Agency Consented Discharges to Controlled Waters database.
Each development site was then allocated to a WwTW in order to understand the additional
wastewater flow resulting from the planned growth. Available information was collated on water
policy and legislation, water resources, water quality, and environmental designations within the
study area.
The objective of the study is to provide evidence to guide development towards the most
sustainable sites. Red / Amber /Green (RAG) assessments have been prepared at the site scale
where possible for the different aspects of the water cycle. It should be remembered that where
a development is scored amber or red in a water supply or wastewater infrastructure assessment,
it does not mean that development cannot or should not take place in that location, merely that
significant infrastructure may be required to accommodate it. The decision on the suitability of
sites is made up of a number of assessments outside the scope of this report.
Many of the assessments in this report are based on the assumption that every identified potential
allocation will come forward during the plan period and as such represents the ‘worst case’ for
growth within each wastewater catchment. In reality the level of growth in each catchment is
likely to be less and further analysis will be undertaken based on the final selection of sites.
Water Resources
South East Water (SEW), SES Water (SESW) and Southern Water (SW) are responsible for
supplying the study area with water. In common with most of the south east, all of the Gatwick
Sub-Region is an area of serious water stress. The more stringent water efficiency target for new
development of 110 l/p/d allowed under Building Regulations is justified, however there is a clear
need to go further than this. Southern Water have made reducing per capita consumption to
100 l/p/d an integral part of their water resource management plan.
The WCS therefore recommends that the councils adopt a policy requiring all new development
to achieve 100 l/p/d and to achieve 80 l/p/d in strategic developments. This approach is
supported by all three water supply companies in the study area, the Environment Agency and
Natural England.
Growth plans defined in Water Resource Management Plans (WRMPs) are broadly in line with
Ministry of Housing Communities and Local Government household projections. Planned growth
during the plan period for Horsham, Mid Sussex and Reigate and Banstead exceeds the
percentage level of growth accounted for in WRMPs. In Crawley it is in line with the WRMP.
SES Water, SEW and SW have confirmed that they have sufficient water resources to serve the
proposed level of growth, however challenges have been identified in the Hardham catchment
and discussions are ongoing to investigate the sustainability of this abstraction.
Water supply infrastructure
All the sites assessed in the study were given a green or amber score by SEW and SW based on
the size of the development, and the likelihood of network reinforcement being required. No
constraints to providing this reinforcement were identified. SESW did not provide a site by site
assessment, advising that this would be done on a case by case process and the local plan
develops.
Wastewater collection infrastructure
Southern Water and Thames Water (TW) provide wastewater services to the Gatwick Sub-Region
Sewerage Undertakers have a duty under Section 94 of the Water Industry Act 1991 to provide
sewerage and treat wastewater arising from new domestic development. Except where strategic
upgrades are required to serve very large or multiple developments, infrastructure upgrades are
usually only implemented following an application for a connection, adoption, or requisition from
a developer. Early developer engagement with SW and TW is therefore essential to ensure that
sewerage capacity can be provided without delaying development.
Wastewater infrastructure upgrades would be required in order to serve the proposed level of
growth. No constraints to providing this infrastructure have been identified by SW or TW.

Gatwick sub-region Water Cycle Study vi
Wastewater treatment capacity
SW and TW provided an assessment of the WwTW serving growth in their area based on the size
of the development. JBA also performed a flow permit assessment in parallel to this based on
the current flows provided by the water companies, flow permit and the additional effluent from
growth.
Nine wastewater treatment works (WwTW) in the Gatwick Sub-Region are predicted to or are
already exceeding their flow permit during the plan period. This is based on every identified
potential allocation coming forward in each wastewater catchment and as such represents the
‘worst case’ for growth.
At these WwTWs upgrades may be required in order to accommodate planned growth. Phasing
of these development sites needs to be carefully considered and early engagement with SW and
TW is required to ensure that additional capacity is provided prior to occupation.
The Mayfield development, which consists of 7,000 houses, is closest to Henfield WwTW. This
WwTW does not have capacity to serve this level of growth and SW are currently discussion with
the EA how this development could be served including an option for a new WwTW. It is important
that phasing of this significant development is aligned with delivery of a solution, and early
engagement between Horsham District Council, Southern Water, the Environment Agency and
developers is required.
If no action were taken, Crawley WwTW would exceed its flow permit during the plan period.
Options exist to pump this flow to Horley, but both WwTWs are scored as “red” by Thames water
indicating the scale of upgrades required. Schemes to address capacity concerns at these works
may take a considerable time to deliver (3 to 5 years) it is therefore important that phasing of
development within these wastewater catchments is aligned with the delivery of additional
capacity, and early and continues discussion with Thames Water is required.
Odour
Ten sites were identified that were within 800 m of a WwTW. At these sites it is recommended
that an odour assessment it carried out as part of the planning process. The cost of this should
be met by the developer.
Water quality
The impact of growth on water quality in receiving watercourses was modelled using the
Environment Agency’s SIMCAT water quality modelling tool.
It was predicted that growth would cause a significant deterioration in water quality at many sites
in the study area, but in most cases, this could be prevented by treatment at the technically
achievable limit (TAL).
At Hogsmill and Rusper deterioration cannot be prevented by treatment at TAL. At Henfield
WwTW, growth could prevent good ecological status being achieved in the receiving watercourse
in the future. A strategic solution is required for the Mayfield development that was modelled as
being served by Henfield WwTW. Discussions are ongoing between SW and the EA.
Flood risk from additional foul flow
The impact of increased effluent flows at WwTW from any of the proposed development has been
assessed and is not predicted to have a significant impact upon flood risk in any of the receiving
watercourses.
Environmental constraints
A number of Special Areas of Conservation (SAC), Special Protection Areas (SPA), Sites of Special
Scientific Interest (SSSI) and Ramsar sites exist within or close to the Gatwick Sub-Region as
well as many Priority Habitats and Rivers.
An assessment of water quality in the watercourses adjacent to protected sites identified a risk
of deterioration of the conservation status as a result of higher phosphate concentrations. In all
cases, improvement in treatment processes at WwTW to treat at the technically achievable limit
could prevent this deterioration.

Gatwick sub-region Water Cycle Study vii
Runoff from development sites is a potential source of diffuse pollution and could be managed
through implementation of a Sustainable Drainage System (SuDS) with a focus on treating water
quality of surface runoff from roads and development sites. Opportunities also exist for these
SuDS schemes to offer multiple benefits of flood risk reduction, amenity value and biodiversity.
In the wider area, opportunities also exist to implement natural flood management techniques to
achieve the same multiple benefits as SuDS.
Gatwick sub-region Water Cycle Study viii
Contents
1 Introduction 17 1.1 Terms of Reference 17 1.2 The Water Cycle 17 1.3 Impacts of Development on the Water Cycle 18 1.4 Objectives 18 1.5 Study Area 18 1.6 Record of Engagement 19
Introduction 19 Scoping Study Engagement 19
2 Future Growth in the Gatwick Sub-Region 21 2.1 Growth in the Gatwick Sub-Region 21 2.2 Crawley Borough Council 23 2.3 Reigate and Banstead Borough Council 26 2.4 Horsham District Council 28 2.5 Mid Sussex District Council 30 2.6 Growth Outside the Gatwick Sub-Region 32
Epsom and Ewell Borough Council 32 Royal Borough of Kingston Upon Thames 32 Sutton London Borough Council 33 Croydon London Borough Council 33 Tandridge District Council 34 Wealden District Council 34 Lewes District Council 35 Brighton and Hove City Council 35 Adur District Council 35
Worthing Borough Council 35 Arun District Council 35 Chichester District Council 36 Waverley Borough Council 36 Mole Valley District Council 36
3 Legislative and Policy Framework 37 3.1 Introduction 37 3.2 National Policy 37
National Planning Policy Framework 37 Planning Practice Guidance: Flood Risk and Coastal Change 38 Planning Practice Guidance: Water Supply, Wastewater and Water Quality 38 Planning Practice Guidance: Housing – Optional Technical Standards 41 Building Regulations 41 BRE Standards 41 Sustainable Drainage Systems (SuDS) 42
3.3 Regional Policy 44 Catchment Flood Management Plans 44 Surface Water Management Plans (SWMPs) 44 Water Resource Management Plans 44
3.4 Local Planning Policy 45 Localism Act 45
3.5 International Environmental Policy 45 Ramsar 45
3.6 European Environmental Policy 46 Urban Wastewater Treatment Directive (UWWTD) 46 Habitats Directive 46

Gatwick sub-region Water Cycle Study ix
The Water Framework Directive 46 Protected Area Objectives 47 Groundwater Source Protection Zones 48 European Derived Legislation and Brexit 49
3.7 UK Environmental Policy 49 Conservation of Habitats and Species Regulations 2017 (as amended) 49 Wildlife and Countryside Act 1981 50 The Natural Environment Rural Communities Act (NERC) 50
3.8 Water Industry Policy 51 The Water Industry in England 51 Regulations of the Water Industry 51 Drainage and Wastewater Management Plans 51 Developer Contributions and Utility Companies 52 Changes to Charging Rules for New Connections 52 Design and Construction Guidance (DCG) 53
4 Water Resources and Water Supply 54 4.1 Introduction 54
Objectives 54 Surface Waters 54 Groundwaters 56 Geology 58
4.2 Availability of Water Resources 61 Abstraction Licencing Strategy 61 Resource Availability Assessment 63 Adur and Ouse ALS 64 Arun and Western Streams ALS 64 Mole ALS 65 Medway ALS 65 London ALS 66
4.3 Recommendations for Better Management Practices 72 Abstraction at Hardham 72
4.4 Water Resource Assessment: Water Resource Management Plans 72 Introduction 72 Water Companies and Water Resources Zones 72 Water Resources in the South East 73 Methodology 74
4.5 Water Resource Management Plan Reviews 76 SES Water 76 Southern Water 77 South East Water 78 Household Growth – Water Supply Boundaries 80 Household Growth – Local Authority Boundaries 82 Summary 85
4.6 SES Water Assessment 86 4.7 Southern Water Assessment 86 4.8 South East Water Assessment 86 4.9 Water Efficiency and Water Neutrality 87
Introduction 87 Required evidence 87 Water Stress 87 River Basin Management Plans 88 National Water Resources Framework 88

Gatwick sub-region Water Cycle Study x
Impact on viability 89 Target 100 89 Water Neutrality Concept 89 Consumer Water Efficiency Measures 91
Rainwater and Greywater Recycling 93 Energy and Water Use 94 Funding for Water Neutrality 94
4.10 Conclusions 95 4.11 Recommendations 95 5 Water Supply Infrastructure 97 5.1 Introduction 97 5.2 Methodology 97 5.3 Results 97
Southern Water Assessment 97 SES Water Assessment 98 South East Water Assessment 98
5.4 Conclusions 99 5.5 Recommendations 99 6 Wastewater Collection 100 6.1 Sewerage Undertakers 100 6.2 Sewerage System Capacity Assessment 100 6.3 Methodology 101 6.4 Data Collection 101 6.5 Results 102
Foul Sewer Network Assessment 102 6.6 Summary 108 6.7 Conclusions 108 6.8 Recommendations 108 7 Wastewater Treatment 109 7.1 Wastewater Treatment Works in the Gatwick Sub-Region 109 7.2 Wastewater Treatment Works Flow Permit Assessment 110
Introduction 110 7.3 Methodology 111 7.4 Results 113
Southern Water 113 Thames Water 114 JBA flow capacity assessment 115 Conclusions 122
7.5 Recommendations 122 8 Odour Assessment 124 8.1 Introduction 124 8.2 Methodology 124 8.3 Data Collection 124 8.4 Results 124 8.5 Conclusions 125 8.6 Recommendations 126 9 Water Quality 127 9.1 Introduction 127 9.2 Methodology 128
General approach 128 Modelling approach 129
9.3 Results 130

Gatwick sub-region Water Cycle Study xi
Overview 130 Modelling Results 132 Priority substances 141
9.4 Conclusions 141 9.5 Recommendations 142 10 Flood Risk from Effluent Discharge 143 10.1 Introduction 143 10.2 Methodology 143 10.3 Results 143 10.4 Conclusions 145 10.5 Recommendations 145 11 Environmental Opportunities and Constraints 146 11.1 Introduction 146 11.2 Sources of pollution 146 11.3 Pathways 146 11.4 Receptors 146 11.5 Assessment of impact risk 147
Methodology 147 River Adur 147 River Arun catchment 150 River Eden catchment 154 River Mole catchment 156 River Medway catchment 158 River Ouse catchment 160
11.6 Summary of water quality impact on protected sites 163 11.7 Protection and mitigation 164
Groundwater Protection 164 11.8 Surface Water Drainage and SuDS 167
Use of SuDS in Water Quality Management 168 Additional Benefits 170 Suitable SuDS Techniques 171
11.9 Nutrient reduction options 171 Natural Flood Management 171 Multiple Benefits of NFM 172 Integrated Constructed Wetlands 173 Agricultural Management 174 Conclusions 175
11.10 Recommendations 176 12 Climate Change Impact Assessment 178 12.1 Approach 178 12.2 Summary of UK Climate Projections 178
Water resources 179 Wastewater infrastructure 180
12.3 Water company assessments 180 12.4 Conclusions and Recommendations 181 13 Summary and Overall Conclusions 183 13.1 Summary 183 13.2 Recommendations 186

Gatwick sub-region Water Cycle Study xii
List of Figures
Figure 1.1: The Water Cycle 18 Figure 2.1: Map of the Water Cycle Study Area 22 Figure 2.2 Growth in Crawley 25 Figure 2.3 Growth in Reigate and Banstead 27 Figure 2.4 Growth in Horsham 29 Figure 2.5 Growth in Mid Sussex (not yet adopted) 31 Figure 3.1: Flood Risk and the Preparation of Local Plans 39 Figure 3.2: PPG: Water Supply, Wastewater and Water Quality Considerations for Plan-Making and
Planning Applications 40 Figure 4.1 Significant surface waterbodies 55 Figure 4.2 Groundwater bodies 57 Figure 4.3 Bedrock Geology of the Gatwick Sub-Region 59 Figure 4.4 Superficial Geology of the Gatwick Sub-Region 60 Figure 4.5 CAMS Boundaries Covering the Gatwick Sub-Region 62 Figure 4.6: Water Resource Availability of the Adur and Ouse ALS 67 Figure 4.7: Water Resource Availability of the Arun and Western Streams ALS 68 Figure 4.8: Water Resource Availability of the Mole ALS 69 Figure 4.9: Water Resource Availability of the Medway ALS 70 Figure 4.10: Water Resource Availability of the London ALS 71 Figure 4.11: Water Resource Zones within the Gatwick Sub-Region 75 Figure 4.12: Consumer Water-Efficiency Measures 91 Figure 7.1 Location of WwTW serving growth in the study area 110 Figure 7.2: Overview of typical combined sewerage system and WwTW discharges 111 Figure 7.3 JBA flow capacity assessment 117 Figure 9.1 Water quality impact assessment following EA West Thames guidance 129 Figure 9.2 WFD Cycle 2 – Ecological status of Watercourses in the study 131 Figure 9.3: Water quality assessment – deterioration 133 Figure 9.4: Water quality results – GES assessment 135 Figure 11.1 Protected sites within the Adur catchment 149 Figure 11.2 Protected sites in the Arun catchment 153 Figure 11.3 Protected sites in the River Eden catchment 155 Figure 11.4 Protected sites in the River Mole catchment 157 Figure 11.5 Protected sites in the River Medway catchment 159 Figure 11.6 Protected sites in the River Ouse catchment 162 Figure 11.7: Source Protection Zones in the Study Area 166 Figure 11.8 Considerations for Suds Design for Water Quality 169 Figure 12.1 NIC Assessment of additional water resources capacity 180 Figure 13.1 Flow Capacity Assessment for Billingshurst 191 Figure 13.2 Flow Capacity Assessment for Crawley WwTW 191 Figure 13.3 Flow Capacity Assessment for Felbridge WwTW 192 Figure 13.4 Flow Capacity Assessment for Goddards Green WwTW 192 Figure 13.5 Flow Capacity Assessment for Handcross WwTW 193 Figure 13.6 Flow Capacity Assessment for Henfield WwTW 193 Figure 13.7 Flow Capacity Assessment for Monks Gate 194 Figure 13.8 Flow Capacity Assessment for Reigate (Earlswood) WwTW 194 Figure 13.9 Flow Capacity Assessment for Rusper WwTW 195

Gatwick sub-region Water Cycle Study xiii
List of Tables
Table 2.1: Summary of Growth in Crawley 23 Table 2.2: Summary of growth in Reigate and Banstead 26 Table 2.3: Summary of growth in Horsham 28 Table 2.4: Summary of growth in Mid Sussex 30 Table 2.5: Summary of Growth in Epsom and Ewell Served by Shared Infrastructure 32 Table 2.6: Summary of Growth in Kingston Served by shared infrastructure 32 Table 2.7: Summary of Growth in Sutton Served by Shared Infrastructure 33 Table 2.8: Summary of Growth in Croydon Served by Shared Infrastructure 33 Table 2.9: Summary of Growth in Tandridge Served by Shared Infrastructure 34 Table 2.10: Summary of Growth in Wealden Served by Shared Infrastructure (based on withdrawn
draft Local Plan) 34 Table 2.11: Summary of Growth in Lewes Served by Shared Infrastructure 35 Table 2.12: Summary of Growth in Mole Valley Served by Shared Infrastructure 36 Table 4.1 WFD status of groundwater bodies 56 Table 4.2: Implications of Surface Water Resource Availability Colours 63 Table 4.3: WRZs Impacting the Gatwick Sub-Region 73 Table 4.4: Baseline Demand Forecast (Dry Year Annual Average) 76 Table 4.5: South East Water Forecast Demand Increase 79 Table 4.6: South East Water – Haywards Heath WRZ Preferred Plan 79 Table 4.7: MHCLG 2014-Based Household Growth - SES Water 80 Table 4.8: Water Resources Market Information - Household Growth – SES Water 80 Table 4.9: MHCLG 2014-Based Household Growth - Southern Water 80 Table 4.10: Water Resources Market Information - Household Growth - Southern Water 81 Table 4.11: MHCLG 2014-Based Household Growth - South East Water 82 Table 4.12: Water Resources Market Information - Household Growth in the South East Water
Haywards Heath WRZ 82 Table 4.13: Horsham Housing Provision Forecast – Local Plan 82 Table 4.14: Horsham Housing Provision Forecast – MHCLG 2014-Based 83 Table 4.15: Crawley Housing Provision Forecast – Local Plan 83 Table 4.16: Crawley Housing Provision Forecast – MHCLG 2014-Based 83 Table 4.17: Reigate and Banstead Housing Provision Forecast – Local Plan 84 Table 4.18: Reigate and Banstead Housing Provision Forecast – MHCLG 2014-Based 84 Table 4.19: Mid Sussex Housing Provision Forecast – Local Plan 85 Table 4.20: Mid Sussex Housing Provision Forecast – MHCLG 2014-Based 85 Table 4.21: Recommendations for Water Resources in The Gatwick Sub-Region 95 Table 5.1: SW Guidance for Water Supply Assessment 98 Table 5.2: SEW RAG Assessment guidelines 99 Table 5.3: Recommendations for water supply infrastructure 99 Table 6.1: SW RAG assessment guidance 102 Table 6.2: Thames Water Wastewater Network Assessment 103 Table 6.3: Recommendations from Wastewater Network Assessment 108 Table 7.1: Per Capita Consumption Values Used in Water Demand Calculations 112 Table 7.2: SW RAG assessment guidance for wastewater treatment 113 Table 7.3 Thames Water assessment of WwTW capacity 114 Table 7.4: Summary of WwTW Flow Assessment 118 Table 7.5: Recommendations for Wastewater Treatment 122 Table 8.1: Sites within 800m of WwTWs in the Gatwick Sub-Region 125 Table 8.2: Recommendations from the Odour Assessment 126 Table 9.1: Water quality assessment results 136 Table 9.2 Water quality recommendations 142 Table 10.1: Summary of additional effluent as a % of Q30 and Q100 Peak Flows 143 Table 10.2: Recommendations from the Flood Risk Assessment 145 Table 11.1 Protected sites in the Adur catchment adjacent to watercourses 148 Table 11.2 Adur Estuary WQ Impact assessment 148 Table 11.3 Protected sites in the Arun catchment 150

Gatwick sub-region Water Cycle Study xiv
Table 11.4 River Arun catchment WQ Impact assessment 152 Table 11.5 Protected sites in the River Eden catchment 154 Table 11.6 River Eden catchment WQ impact assessment 154 Table 11.7 Protected sites in the River Mole catchment 156 Table 11.8 River Mole catchment WQ impact assessment 156 Table 11.9 Protected sites in the River Medway catchment 158 Table 11.10 River Medway catchment WQ impact assessment 158 Table 11.11 Protected sites in the River Ouse catchment 160 Table 11.12 River Ouse catchment WQ impact assessment 161 Table 11.13: Summary of SuDS Categories 171 Table 11.14: Recommendations from Environmental Constraints and Opportunities Section176 Table 12.1: Climate Change Pressures Scoring Matrix 178 Table 12.2: Climate Change Consequences Scoring for The Water Cycle Study 181 Table 12.3: Conclusions and Recommendations from Climate Change Assessment 182 Table 13.1: Summary of Conclusions from the Study 183 Table 13.2: Summary of Recommendations 186

Gatwick sub-region Water Cycle Study xv
Abbreviations / Glossary
ALS Abstraction Licensing Strategy
AMP Asset Management Plan
AONB Area of Outstanding Natural Beauty
AP Assessment Point
ASNW Ancient Semi-Natural Woodland
BIDS Business, Industrial, distribution and Storage
BOD Biochemical Oxygen Demand
BREEAM Building Research Establishment Environmental Assessment Methodology
CAMS Catchment Abstraction Management Strategies
CAPEX Capital Expenditure
CBC Crawley Borough Council
CFMP Catchment Flood Management Plan
CSO Combined Sewer Overflow
DCLG Department of Communities and Local Government (Replaced by MHCLG)
DWF Dry Weather Flow
DWI Drinking Water Inspectorate
DWMP Drainage and Wastewater Management Plan
EA Environment Agency
EFI Ecological Flow Indicator
EP Environmental Permit
EU European Union
FEH Flood Estimation Handbook
FWMA Flood and Water Management Act
FZ Flood Zone
GIS Geographic Information Systems
HDC Horsham District Council
HOF Hands-Off Flow
HOL Hands-off Level
JBA Jeremy Benn Associates
LLFA Lead Local Flood Authority
LPA Local Planning Authority
l/p/d Litres per person per day
Ml/d Mega (Million) litres per day
MHCLG Ministry of Housing Communities and Local Government
MSDC Mid Sussex District Council
NH4 Ammonia
NMP Nutrient Management Plan
NPPF National Planning Policy Framework
OAN Objectively Assessed Need
OfWAT Water Service Regulation Authority
OS Ordnance Survey
P Phosphorous
RAG Red / Amber / Green assessment
RBD River Basin District

Gatwick sub-region Water Cycle Study xvi
RBBC Reigate and Banstead Borough Council
RBMP River Basin Management Plan
ReFH Revitalised Flood Hydrograph
RoFSW Risk of Flooding from Surface Water (replaced uFMfSW)
RQP River Quality Planning tool
SA Sustainability Appraisals
SAC Special Area of Conservation
SBP Strategic Business Plan
SEA Strategic Environmental Assessment
SESW SES Water
SEW South East Water
SfA Sewers for Adoption
SFRA Strategic Flood Risk Assessment
SHELAA Strategic Housing and Economic Land Availability Assessment
SHMA Strategic Housing Market Assessment
SPA Special Protection Area
SPD Supplementary Planning Document
SPS Sewage Pumping Station
SPZ Source Protection Zone
SS Suspended Solids
SSSI Site of Special Scientific Interest
SU Sewerage Undertaker
SuDS Sustainable Drainage Systems
SW Southern Water
SWMP Surface Water Management Plan
TW Thames Water
UWWTD Urban Waste Water Treatment Directive
WaSC Water and Sewerage Company
WCS Water Cycle Study
WFD Water Framework Directive
WINEP Water Industry National Environment Programme
WRMP Water Resource Management Plan
WRZ Water Resource Zone
WTW Water Treatment Works
WwTW Wastewater Treatment Works

Gatwick sub-region Water Cycle Study 17
1 Introduction
1.1 Terms of Reference
JBA Consulting was commissioned by Crawley Borough Council acting on behalf of the
councils in the Gatwick Sub-Region (Crawley Borough Council, Horsham District Council,
Mid Sussex District Council and Reigate and Banstead Council), to undertake a joint
Water Cycle Study (WCS) to inform the councils emerging Local or District Plans. This
study assesses the potential issues relating to future development within the Gatwick
Sub-Region and the impacts on water supply, wastewater collection and treatment and
water quality. Unmitigated future development and climate change can adversely affect
the environment and water infrastructure capability. A WCS will provide the required
evidence, together with an agreed strategy to ensure that planned growth occurs within
environmental constraints, with the appropriate infrastructure in place in a timely
manner so that planned allocations are deliverable.
1.2 The Water Cycle
Planning Practice Guidance on Water Supply, Wastewater and Water Quality1 describes
a water cycle study as:
“A voluntary study that helps organisations work together to plan for sustainable growth.
It uses water and planning evidence and the expertise of partners to understand
environmental and infrastructure capacity. It can identify joined up and cost-effective
solutions, that are resilient to climate change for the lifetime of the development.
The study provides evidence for Local Plans and sustainability appraisals and is ideally
done at an early stage of plan-making. Local authorities (or groups of local authorities)
usually lead water cycle studies, as a chief aim is to provide evidence for sound Local
Plans, but other partners often include the Environment Agency and water companies.”
The Environment Agency's guidance on WCS2 recommends a phased approach:
• Phase 1: Scoping study, focussing on formation of a steering group, identifying
issues for consideration and the need for an outline study.
• Phase 2: Outline study, to identify environmental constraints, infrastructure
constraints, a sustainability assessment and consideration of whether a detailed
study is required.
• Phase 3: Detailed study, to identify infrastructure requirements, when they are
required, how they will be funded and implemented and an overall assessment of
the sustainability of proposed infrastructure.
Figure 1.1 below shows the main elements that compromise the Water Cycle and shows
how the natural and man-made processes and systems interact to collect, store or
transport water in the environment.
———————————————————————————————————————————— 1 Planning Practice Guidance: Water supply, wastewater and water quality, Department for Communities and Local Government (2014).
Accessed online at: http://planningguidance.planningportal.gov.uk/blog/guidance/ on:
14/02/2020
2 Water Cycle Study Guidance, Environment Agency (2009). Accessed online at: http://webarchive.nationalarchives.gov.uk/20140328084622/http://cdn.environment-agency.gov.uk/geho0109bpff-e-e.pdf on:
14/02/2020

Gatwick sub-region Water Cycle Study 18
Figure 1.1: The Water Cycle
Source: Environment Agency – Water Cycle Study Guidance
1.3 Impacts of Development on the Water Cycle
New homes require the provision of clean water, safe disposal of wastewater and
protection from flooding. It is possible that allocating large numbers of new homes at
some locations may result in the capacity of the existing available infrastructure being
exceeded. This situation could potentially lead to service failures to water and
wastewater customers, have adverse impacts on the environment or cause the high cost
of upgrading water and wastewater assets being passed on to bill payers. Climate
change presents further challenges such as increased intensity and frequency of rainfall
and a higher frequency of drought events that can be expected to put greater pressure
on the existing infrastructure.
1.4 Objectives
As a WCS is not a mandatory document, Local Planning Authorities are advised to
prioritise the different stages of the WCS to integrate with their Local and District Plan
programme. This report is written to support the emerging Local or District Plans of
councils in the Gatwick Sub-Region.
The WCS brief stated that the overall objective of the WCS is to understand the
environmental and physical constraints of development and identify opportunities for
more sustainable planning and improvements that may be required to achieve the
required level of development. This should be assessed by considering the following
issues:
• Water demand and supply
• Wastewater infrastructure and treatment
• Water quality and the environment
• Flood risk and drainage.
1.5 Study Area
The Gatwick Sub-Region covers an area of approximately 1,040km2 and has a population
of 515,593 reported in the 2011 census. The region is made up of four local authorities,
Crawley Borough Council (CBC), Horsham District Council (HDC), Mid Sussex District
Council (MSDC) and Reigate & Banstead Borough Council (RBBC). The main urban areas
are Crawley, Horsham, Redhill, East Grinstead, Haywards Heath, Horley and Burgess
Hill.

Gatwick sub-region Water Cycle Study 19
The Gatwick Sub-Region is located within the Thames river basin and the South East
river basin. The sub-region contains the River Mole, River Arun, River Medway, River
Ouse and River Adur.
Water supply is provided by SES Water (SESW), Southern Water (SW), South East Water
(SEW) and Thames Water (TW). The region falls within the Thames and Southern
Sewerage Service Boundaries.
Wastewater is managed by Thames Water in the north of the study area and Southern
Water in the south of the study area.
1.6 Record of Engagement
Introduction
Preparation of a WCS requires significant engagement with stakeholders, within the Local
Planning Authority area, with water and wastewater utilities, with the Environment
Agency, and where there may be cross-boundary issues, with neighbouring local
authorities. This section forms a record of engagement for the WCS.
Scoping Study Engagement
The preparation of this WCS was supported by the following engagement:
Inception Meeting
Engaged
Parties
Crawley Borough Council
Horsham District Council
Mid Sussex District Council
Reigate & Banstead Borough Council
West Sussex County Council
Natural England
SES Water
South East Water
Southern Water
The Environment Agency and Thames Water were invited but could
not attend.
Neighbouring Authorities
Engaged
Parties
Epsom and Ewell Borough Council
Sutton London Borough Council
Croydon London Borough Council
Tandridge District Council
Wealden District Council
Lewes District Council
Brighton and Hove City Council
Adur District Council
Arun District Council
Chichester District Council
Waverley Borough Council
Mole Valley District Council
Details
JBA prepared a WCS for Tandridge District Council who were
contacted to confirm that the growth scenario used was still current.
Growth information from the remaining councils was taken from
published local plan documents with a focus on housing growth that
would be served by WwTW within or shared with the Gatwick Sub-
Region.

Gatwick sub-region Water Cycle Study 20
Collaboration with Water and Wastewater Companies
Engaged
Parties
Water Companies Wastewater Companies
SES Water (SESW)
Southern Water (SW)
South East Water (SEW)
Thames Water (TW)
Southern Water (SW)
Details Water company assessments of water and wastewater infrastructure
and capacity constraints.

Gatwick sub-region Water Cycle Study 21
2 Future Growth in the Gatwick Sub-Region
2.1 Growth in the Gatwick Sub-Region
The councils in the Gatwick Sub-Region are at different stages in their Local and District
Plan process. The following section summarises how each council is expected to grow
during their respective plan period and allows a forecast to be created that can be used
to estimate the volume of water and wastewater required in the future and the resulting
pressure on water infrastructure.
This forecast consists of:
• Allocations - sites allocated, or planned to be allocated in Local Plans
• Committed sites – sites already in the planning system
• Recent completions – sites completed in the last year that may not yet appear in
flow data provided by the water companies
• Windfall – sites that have not been specifically identified in the Local Plan. They
normally comprise previously developed sites that have unexpectedly become
available
• Neighbouring authority growth – growth served by infrastructure within or shared
with the study area
Each council provided information on expected growth during the plan period which was
collated into a forecast for housing and employment. This is summarised for each council
in Table 2.1 to Table 2.4: Summary of growth in Mid Sussex. As each council’s local
plan period varies, the growth forecast collated for this WCS does not necessarily match
the published figures in draft or adopted plans and is used for the purposes of estimating
water demand.
A map of the study area showing the relative locations of the local authorities is found
in Figure 2.1.
In light of the COVID-19 pandemic, and its significant impacts on aviation and related
sectors that are of important within the Gatwick sub-region, there is considerable
uncertainty in the employment forecasts. Many of these may need to be revisited as the
medium to long term impacts are understood.

Gatwick sub-region Water Cycle Study 22
Figure 2.1: Map of the Water Cycle Study Area

Gatwick sub-region Water Cycle Study 23
2.2 Crawley Borough Council
The emerging Northern West Sussex Strategic Housing Market Assessment (SHMA)
shows Crawley borough will have a housing need (based on the standard methodology)
of up to 11,820 (720pa) new homes over the plan period 2020 to 2035. Crawley Borough
Council has also produced its draft Local Plan 2020 – 20353 which is currently out for
public consultation.
The Local Plan makes provision for the development of a minimum of 5,355 net dwellings
in the borough in the period 2020 to 2035.
• Years 1-5 (2020-25): 500 dwellings per annum (dpa)
• Years 6-10 (2025-30): 450dpa
• Years 11-15 (2030-35): 121dpa
There will be a remaining unmet housing need, of approximately 5,925 dwellings, arising
from Crawley over the Plan period. The council will continue to work closely with its
neighbouring authorities, particularly those which form the Northern West Sussex
Housing Market Area, in exploring opportunities and resolving infrastructure and
environmental constraints in order to meet this need in sustainable locations. This will
include continued assessment of potential urban extensions to Crawley.
For the avoidance of doubt, this unmet need has been factored into all of the analysis
within this water cycle study.
CBC provided details of growth identified within the Borough, which is summarised in
Table 2.1 below. The Reg. 19 Draft Local Plan is planning for 33ha of employment land
based on the Employment Growth Assessment ‘continuation of past trends’ scenario.
The potential employment site allocations provided by CBC for this study are in excess
of 33ha, but not all of these sites will be developed. The wastewater capacity assessment
and water quality modelling in chapters 7 and 9 consider the ‘worst case’ scenario of all
of the sites promoted to the council coming forward. Further work is required to
understand the precise scale and location of these employment sites. The majority of
these sites are contained within the Crawley Area Action Plan zone shown in Figure 2.2.
Table 2.1: Summary of Growth in Crawley
Type of Growth Number of Houses Employment land
Allocations 2,367 33ha (Continuation of Past
Development Rates)
113ha (Baseline Labour
Supply) job growth based
on CBC standard figure of
752dpa indicates a job
growth figure of approx.
20,500 between 2019-36
of which approx. 9,750 are
in B Use Class sectors
Commitments 2,754
Completions (18/19) 512
Windfall 880
TOTAL 6,001
Objectively Assessed
Need (OAN) 11,820
Reg. 19 Draft Crawley
Borough Local Plan
(January 2020)
5, 355
Also present within Crawley Borough is Gatwick airport, the second largest airport in the
UK, handling an estimated 49 million passengers in 2020. The airport has a very large
water and wastewater demand, and changes to usage and passenger numbers can have
a significant impact on water infrastructure within the study area. Gatwick Airport
———————————————————————————————————————————— 3 Crawley Borough Council. January 2020. Crawley 2036 – Draft Crawley Borough local Plan 2020 - 2035

Gatwick sub-region Water Cycle Study 24
Limited (GAL) published its master plan in July 20194 and this contains three scenarios
for growth.
• Scenario 1 – retain the current single runway, two terminal configuration. In this
scenario passenger numbers are expected to grow to 61 million passengers per
annum by 2032.
• Scenario 2 – Bring the northern standby runway into operational use alongside
the existing runway. This would increase passenger numbers to 70 million by
2032.
• Scenario 3 – Build an additional runway to the south of the airport, using land
currently safeguarded. This scenario is not currently being pursued by GAL.
Scenarios 1 and 2 have been modelled in the WCS by translating the additional
passenger numbers into an increase in water demand for use in the study.
An Area Action Plan is proposed by the Draft Local Plan in the area north of Crawley
between the town and Gatwick Airport. This land had previously been safeguarded for
the purposes of building an additional runway at Gatwick Airport. This is shown in Figure
2.2.
———————————————————————————————————————————— 4 Gatwick Airport Master Plan, Gatwick airport Limited, (2019). Accessed online at:
https://www.gatwickairport.com/business-community/future-plans/long-term-plans/ on: 13/02/2020

Gatwick sub-region Water Cycle Study 25
Figure 2.2 Growth in Crawley

Gatwick sub-region Water Cycle Study 26
2.3 Reigate and Banstead Borough Council
Reigate and Banstead Borough Council’s Local Plan is in two parts. Its Core Strategy
was adopted on 3 July 2014. This includes provision of at least 460 dwellings per annum
between 2012 and 2027. On 2 July 2019, the Council completed a review of all the 2014
Core Strategy policies, which concluded that the Core Strategy remains up to date, and
that none of its policies currently need modifying or updating.
RBBC adopted its Development Management Plan (DMP) in September 2019. The DMP
includes specific site allocations to deliver the level of growth and the spatial strategy
set out in the Core Strategy.
The Objectively Assessed Need is 9,000-9,600 over the plan period (2012-27), however
the Housing Requirement in RBBC’s adopted and reviewed Core Strategy is 6,900 due
to constraints.
The indicative number of employees quoted in the table below is based on a standard
employment density being applied to the employment sites supplied to JBA for this study.
Actual employee numbers are likely to differ.
RBBC provided shapefiles of their allocated sites, commitments and recent completions
as well as an estimate of windfall. This is summarised in Table 2.2 and the distribution
of growth is shown in Figure 2.3.
Table 2.2: Summary of growth in Reigate and Banstead
Type of Growth Number of Houses Indicative No. Employees
Allocations 1,700* 11,701
Commitments 2,569* 716
Completions (18/19) 520* 0
Windfall 1,200 -
TOTAL 5,989 12,417
Objectively Assessed
Need (OAN)
RBBC’s objectively
6,900 N/A
*The wastewater capacity assessments and water quality model use figures originally provided in the study of 1,952, 2,816, and 384 for allocations, commitments and completions respectively. The figures quoted above are therefore a minor reduction from that modelled, but the impact on results and conclusions is not thought to be significant.

Gatwick sub-region Water Cycle Study 27
Figure 2.3 Growth in Reigate and Banstead

Gatwick sub-region Water Cycle Study 28
2.4 Horsham District Council
Horsham District Council are in the process of reviewing their Local Plan which will be
submitted in 2021.
Shapefiles identifying potential large sites were provided to JBA, as well details of
commitments, recent completions and windfall. This is summarised in Table 2.3 below,
and the distribution of growth shown in Figure 2.4.
In the WwTW capacity assessment and water quality modelling JBA used an earlier
estimate of Windfall of 500 houses over the plan period, which has since been increased
to 535 houses over the next five years and 125 houses per year over the remainder of
the plan period. As the assessment includes the ‘worst case’ of every allocation coming
forward in every wastewater catchment, the increase in windfall is not expected to make
a significant difference.
The indicative number of employees quoted in the table below is based on a standard
employment density being applied to the employment sites supplied to JBA for this study.
Actual employee numbers are likely to differ.
Table 2.3: Summary of growth in Horsham
Type of Growth Number of Houses Indicative No. Employees
Allocations 37,625* 0
Commitments 8,576 1,163
Completions (18/19) 1,368 0
Windfall 2,035 -
TOTAL 49,604 1,163
Objectively Assessed
Need (OAN) 15,440 N/A
* This figure represents every large site identified and is not the number of houses
planned to be delivered. Once broken down into wastewater catchments, this could be
thought of as a “worst case” for water demand in each catchment. The OAN has been
used in water resource estimation.

Gatwick sub-region Water Cycle Study 29
Figure 2.4 Growth in Horsham

Gatwick sub-region Water Cycle Study 30
2.5 Mid Sussex District Council
The Mid Sussex District Plan 2014 – 20315 was adopted in March 2018 and identified a
housing requirement of 16,390 over the plan period as well at 25ha of employment land.
MSDC provided shapefiles containing their allocations, commitments and recent
completions and an estimation of windfall. This is summarised on Table 2.4: Summary
of growth in Mid Sussex and the distribution of growth is shown in Figure 2.5.
The Mid Sussex adopted housing requirement is higher than the OAN as it contains an
element of unmet need from Crawley.
Table 2.4: Summary of growth in Mid Sussex
Type of Growth Number of Houses Indicative No. Employees
Allocations* 1,962 5,904
Commitments 10,381 0
Completions (2014/15-
2018/19**) 3,914 0
Windfall 588 -
TOTAL 16,845 5,904
Objectively Assessed
Need (OAN) 14,892 N/A
Adopted Housing
Requirement 16,390 N/A
*Represents proposed allocations in the Regulation 18 Site Allocations DPD (not yet adopted)
** Only completions from 2018/19 have been included in the growth forecast used in the WCS analysis
———————————————————————————————————————————— 5 Mid Sussex District Council. March 2018. Mid Sussex District Plan 2014 – 2031.

Gatwick sub-region Water Cycle Study 31
Figure 2.5 Growth in Mid Sussex (not yet adopted)

Gatwick sub-region Water Cycle Study 32
2.6 Growth Outside the Gatwick Sub-Region
The sewer catchments provided by Southern Water and Thames Water were used to
identify neighbouring Local Planning Authority (LPA) areas that may be served by
infrastructure within or shared with the Gatwick Sub-Region. Published information from
each LPA was then used to inform an estimate of growth. This was added to the growth
forecast collated from information within the study area. Where there was no trajectory
specified by the neighbouring councils, committed development was spread evenly over
the next five years (2019/20 to 2023/24) and Local Plan development was spread evenly
from 2019/20 to the end of the Local Plan period.
Epsom and Ewell Borough Council
The Strategic Housing Market Assessment (SHMA) Update (Sept,2013)6 was produced
to support the development of the Epsom and Ewell Local Plan. This report determines
that between 2019 and 2039, a minimum of 579 dwellings per annum are required in
the area.
This informs growth at Hogsmill WwTW, located in the Royal Borough of Kingston upon
Thames, which also serves the northern portion of Reigate and Banstead.
Table 2.5: Summary of Growth in Epsom and Ewell Served by Shared
Infrastructure
WwTW Proposed number of dwellings
(per annum) Time Period Shared With
Hogsmill 579 2019 - 2039 Reigate and Banstead
Royal Borough of Kingston Upon Thames
Although the Royal Borough of Kington Upon Thames does not share a boundary with
the study area, the entirety of the wastewater from the Local Authority area is managed
by Hogsmill WwTW, which also serves the northern portion of Reigate and Banstead.
The Local Plan Early Engagement document7 states that the annual housing target for
the Local Authority has been steadily increasing. Over the whole plan period proposed
for the new borough of Kingston Local Plan, 2019 to 2041, this would be about 1,364
new homes per annum over 22 years.
Table 2.6: Summary of Growth in Kingston Served by shared infrastructure
WwTW Proposed number of dwellings
(per annum) Time Period Shared With
Hogsmill 1,364 2019 - 2041 Reigate and Banstead
———————————————————————————————————————————— 6 Cobweb Consulting. September 2019. Strategic Housing Market Assessment Update - Epsom and Ewell Borough Council 7 The Royal Borough of Kingston Upon Thames. May 2019. Local Plan – Early Engagement (Regulation 18)

Gatwick sub-region Water Cycle Study 33
Sutton London Borough Council
The Sutton London Borough Council adopted their Local Plan as a Development Plan
Document (DPD) in February 20188. This document states that over the plan period
2016 – 2031, the aim is to deliver 427 residential dwellings per annum.
It is also stated that there will be at least ten additional hectares of land for industrial
uses, 23,000m2 additional gross office floorspace, 39,000m2 additional gross retail
floorspace and 10,000m2 additional gross floorspace for restaurants over the period.
This informs growth at Hogsmill WwTW and Beddington WwTW, which also serve the
northern portion of Reigate and Banstead. The Sutton Local Plan anticipates that growth
will be delivered in defined primary and secondary growth areas, including in Sutton,
Hackbridge, Wallington and other smaller district centres. Utilising this information, it is
assumed that approximately 38% on new growth will be served by Hogsmill WwTW and
62% at Beddington WwTW.
Table 2.7: Summary of Growth in Sutton Served by Shared Infrastructure
WwTW Proposed number of dwellings
(per annum) Time Period Shared With
Hogsmill 162 2016 – 2031 Reigate and Banstead
Beddington 265 2016 – 2031 Reigate and Banstead
Croydon London Borough Council
The Croydon Local Plan 20189 was adopted in February 2018. However, the Council is
currently updating this to reflect the strategic direction outlined in the Draft London Plan.
The Council is working towards the publication of the Local Plan in 2022. The Emerging
Croydon Local Plan has a plan period of 2019-2036.
The Strategic Housing Market Assessment Update10 states three figures for housing
need:
• The Standard Method housing need for Croydon results in 2,302 dwellings per
annum.
• Croydon Local Plan scenario identifies a need of 1,644 dwellings per annum.
• The Draft London Plan Scenario identifies a need of 2,949 dwellings per annum.
In this situation, the worst-case scenario of 2,949 dwellings per annum has been used.
West Croydon is served by Beddington WwTW and east Croydon is served by Longreach
WwTW. Beddington WwTW also serves the northern portion of Reigate and Banstead.
The Local Plan shows that growth will be concentrated in the western portion of the Local
Authority area. Therefore, two thirds of growth has been applied to Beddington STW.
Table 2.8: Summary of Growth in Croydon Served by Shared Infrastructure
WwTW Proposed number of dwellings
(per annum) Time Period Shared With
Beddington 1,966 2019 - 2036 Reigate and Banstead
———————————————————————————————————————————— 8 London Borough of Sutton. February 2018. Sutton Local Plan 2016 - 2031 9 London Borough of Croydon. February 2018. Croydon Local Plan 2018 10 GL Hearn. November 2019. Strategic Housing Market Assessment Update - London Borough of Croydon

Gatwick sub-region Water Cycle Study 34
Tandridge District Council
In 2015 Tandridge assessed its local housing needs. The Tandridge Local Plan aims to
provide 6,056 dwellings, or 303 dwellings per annum in the plan period to 2033. For
the longer term and beyond the Plan period, new homes will be delivered through the
development of the South Godstone Garden Community.
In December 2018, the Tandridge District Council Phase 3 Detailed Water Cycle Study
(WCS) was completed by JBA Consulting. Housing allocation sites, provided by
Tandridge District Council, show that over the plan period approximately 2,344 dwelling
would impact wastewater infrastructure shared with Reigate & Banstead and Mid Sussex.
Table 2.9: Summary of Growth in Tandridge Served by Shared Infrastructure
WwTW
Proposed number
of dwellings
(per annum)
Time Period Shared With
Beddington 133 2019 - 2033 Reigate and Banstead
Burstow 383 2019 - 2033 Reigate and Banstead
Reigate (Earlswood) 5 2019 - 2033 Reigate and Banstead
Felbridge 2 2019 - 2033 Mid Sussex
Wealden District Council
Wealden District Council withdrew their draft Local Plan 2019 on the 19th February 2020.
The Local Plan outlined the growth and change that would take place within Wealden
District between 2013 and 202811. This plan proposed to deliver 14,228 dwellings across
the plan period, comprising of 2,421 dwellings already completed, 5,279 dwellings with
extant planning permission, 4,012 dwellings on allocated sites, and 2,516 windfalls.
In the absence of any more up-to-date information, the withdrawn plan was used to
inform growth at Luxfords Lane East Grinstead WwTW, which serves both Wealden and
Mid Sussex within the Gatwick Sub Region. The report identifies that there is an
allowance of 33 properties per year across the plan period in the area served by Luxfords
Lane WwTW.
Table 2.10: Summary of Growth in Wealden Served by Shared Infrastructure
(based on withdrawn draft Local Plan)
WwTW
Proposed number
of dwellings
(per annum)
Time Period Shared With
Luxfords Lane East
Grinstead 33
2013 and
2028 Mid Sussex
———————————————————————————————————————————— 11 Wealden District Council. August 2018. Proposed Submission Document – Wealden Local Plan.
Gatwick sub-region Water Cycle Study 35
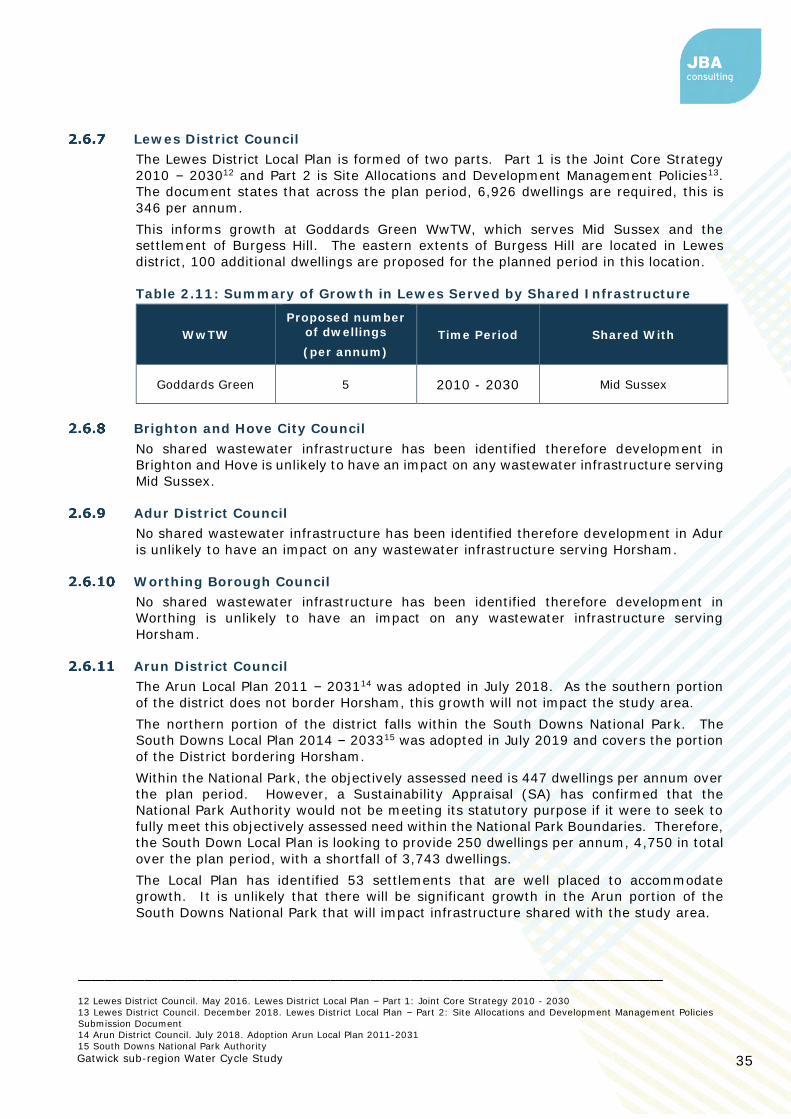
Lewes District Council
The Lewes District Local Plan is formed of two parts. Part 1 is the Joint Core Strategy
2010 – 203012 and Part 2 is Site Allocations and Development Management Policies13.
The document states that across the plan period, 6,926 dwellings are required, this is
346 per annum.
This informs growth at Goddards Green WwTW, which serves Mid Sussex and the
settlement of Burgess Hill. The eastern extents of Burgess Hill are located in Lewes
district, 100 additional dwellings are proposed for the planned period in this location.
Table 2.11: Summary of Growth in Lewes Served by Shared Infrastructure
WwTW
Proposed number
of dwellings
(per annum)
Time Period Shared With
Goddards Green 5 2010 - 2030 Mid Sussex
Brighton and Hove City Council
No shared wastewater infrastructure has been identified therefore development in
Brighton and Hove is unlikely to have an impact on any wastewater infrastructure serving
Mid Sussex.
Adur District Council
No shared wastewater infrastructure has been identified therefore development in Adur
is unlikely to have an impact on any wastewater infrastructure serving Horsham.
Worthing Borough Council
No shared wastewater infrastructure has been identified therefore development in
Worthing is unlikely to have an impact on any wastewater infrastructure serving
Horsham.
Arun District Council
The Arun Local Plan 2011 – 203114 was adopted in July 2018. As the southern portion
of the district does not border Horsham, this growth will not impact the study area.
The northern portion of the district falls within the South Downs National Park. The
South Downs Local Plan 2014 – 203315 was adopted in July 2019 and covers the portion
of the District bordering Horsham.
Within the National Park, the objectively assessed need is 447 dwellings per annum over
the plan period. However, a Sustainability Appraisal (SA) has confirmed that the
National Park Authority would not be meeting its statutory purpose if it were to seek to
fully meet this objectively assessed need within the National Park Boundaries. Therefore,
the South Down Local Plan is looking to provide 250 dwellings per annum, 4,750 in total
over the plan period, with a shortfall of 3,743 dwellings.
The Local Plan has identified 53 settlements that are well placed to accommodate
growth. It is unlikely that there will be significant growth in the Arun portion of the
South Downs National Park that will impact infrastructure shared with the study area.
———————————————————————————————————————————— 12 Lewes District Council. May 2016. Lewes District Local Plan – Part 1: Joint Core Strategy 2010 - 2030
13 Lewes District Council. December 2018. Lewes District Local Plan – Part 2: Site Allocations and Development Management Policies
Submission Document 14 Arun District Council. July 2018. Adoption Arun Local Plan 2011-2031
15 South Downs National Park Authority

Gatwick sub-region Water Cycle Study 36
Chichester District Council
The northern and southern portions of Chichester are covered by the Chichester Local
Plan 2014 – 202916. The southern portion does not share a boundary with the study
area and therefore growth will not impact the Gatwick Sub-Region. The Northern portion
shares a boundary with Horsham. As there is no wastewater infrastructure shared with
Horsham in this area, it is again unlikely that future growth will have an impact on the
study area.
The central portion of the District is covered by the South Downs Local Plan 2014 – 2033,
which has been discussed in Section 2.4.11. Minimal growth is proposed in the areas of
the National Park neighbouring the study area.
Waverley Borough Council
The Waverley Local Plan Part 1: Strategic Policies and Sites17 was adopted in February
2018 and covers a plan period 2013 - 2032. The plan sets out a strategy to developed
at least 11,210 dwellings within the plan period. This is 590 dwellings per annum, made
up of 507 dwellings and 83 dwellings to meet Woking’s unmet housing need.
Rudgewick WwTW, located in Horsham, serves Ellen’s Green, a small village located in
Waverley. The Local Plan does not identify growth in Ellen’s Green and therefore it is
unlikely that growth will impact shared wastewater infrastructure at this location.
Mole Valley District Council
The Mole Valley Local Development Framework Core Strategy18 was adopted in October
2009 and will cover a plan period 2006 - 2026. Over the plan period, Mole Valley must
make provision for at least 3,760 new dwellings in accordance with the South East Plan.
The Local Plan is currently under review and the Future Mole Valley 2018 – 2033
Consultation Draft Local Plan19 was available for review at the time of writing. This draft
document shows that the housing demand in the District is now 449 dwellings per
annum, totalling 6,735 across the 15-year plan period.
Based on the settlement hierarchy most development will be directed towards the
Principal Towns - Dorking (including North Holmwood) and Leatherhead and then the
Suburban Villages - Ashtead, Bookham and Fetcham. However, some limited
development may be considered in the rural villages.
Horley WwTWs is located within Reigate and Banstead but serves the large rural villages
of Charlwood and Hookwood in Mole Valley. There are three allocated sites in Hookwood:
• Land west of Reigate Road, Hookwood - 450 dwellings and two gypsy and
traveller pitches
• Land south of Kennel Lane, Hookwood – 21 dwellings
• Land Adjacent to Three Acres – 19 dwellings
This means around 490 dwellings are proposed in total during the plan period that would
drain to Horley WwTWs.
Table 2.12: Summary of Growth in Mole Valley Served by Shared
Infrastructure
WwTW
Proposed number
of dwellings
(per annum)
Time Period Shared With
Horley 490 2006 - 2026 Reigate and Banstead
———————————————————————————————————————————— 16 Chichester District Council. May 2015. Chichester Local Plan: Key Policies 2014 – 2029.
17 Waverley Borough Council. February 2018. Waverley Borough Local Plan Part 1: Strategic Policies and Sites. 18 Mole Valley District Council. October 2019. The Mole Valley Local Development Framework – Core Strategy
19 Mole Valley District Council. January 2020. Future Mole Valley 2018 – 2033 – Consultation Draft Local Plan.

Gatwick sub-region Water Cycle Study 37
3 Legislative and Policy Framework
3.1 Introduction
The following sections introduce several national, regional and local policies that must
be considered by the LPA, water companies and developers during the planning stage.
Key extracts from these policies relating to water consumption targets and mitigating
the impacts on the water from the new development are summarised below.
3.2 National Policy
National Planning Policy Framework
The National Planning Policy Framework (NPPF)20 was published on 27th March 2012, as
part of reforms to make the planning system less complex and more accessible, to
protect the environment and to promote sustainable growth. A comprehensive revision
was issued in July 2018. This was further revised in February 201921, but the changes
were not significant from the July 2018 version for policy areas relevant to the WCS.
The NPPF provides guidance to planning authorities to take account of flood risk and
water and wastewater infrastructure delivery in their Local Plans. Key paragraphs
include:
Paragraph 34:
Paragraph 149:
Paragraph 170 (e):
———————————————————————————————————————————— 20 National Planning Policy Framework, Department for Communities and Local Government (2012) 21 National Planning Policy Framework, Ministry of Housing, Communities and Local Government (2019). Accessed online at:
https://www.gov.uk/government/publications/national-planning-policy-framework--2 on: 04/11/2019
“Plans should set out the contributions expected from development. This should
include setting out the levels and types of affordable housing provision required,
along with other infrastructure (such as that needed for education, health, transport,
flood and water management, green and digital infrastructure). Such policies should
not undermine the deliverability of the plan.”
“Plans should take a proactive approach to mitigating and adapting to climate
change, taking into account the long-term implications for flood risk, coastal change,
water supply...”
“…preventing new and existing development from contributing to, being put at
unacceptable risk from, or being adversely affected by, unacceptable levels of soil,
air, water or noise pollution or land instability. Development should, wherever
possible, help to improve local environmental conditions such as air and water
quality, taking into account relevant information such as river basin management
plans”.

Gatwick sub-region Water Cycle Study 38
In March 2014, the Planning Practice Guidance was issued by the Department for
Communities and Local Government, with the intention of providing guidance on the
application of the National Planning Policy Framework (NPPF) in England. The MHCLG is
in the process of updating the Guidance to consider the necessary 2018 and 2019
updates of the NPPF. Of the sections relevant to this study, only the Water Supply,
Wastewater and Water Quality section has been updated.
• Flood Risk and Coastal Change22
• Water Supply, Wastewater and Water Quality23.
• Housing - Optional Technical Standards24.
Planning Practice Guidance: Flood Risk and Coastal Change
Diagram 1 in the Planning Practice Guidance sets out how flood risk should be considered
in the preparation of Local Plans (Figure 3.1). These requirements are addressed
principally in the Council’s Strategic Flood Risk Assessment.
Planning Practice Guidance: Water Supply, Wastewater and Water Quality
A summary of the specific guidance on how infrastructure, water supply, wastewater and
water quality considerations should be accounted for in both plan-making and planning
applications is summarised below in Figure 3.2.
———————————————————————————————————————————— 22 Planning Practice Guidance: Flood Risk and Coastal Change, Department for Communities and Local Government (2014). Accessed online at: http://planningguidance.planningportal.gov.uk/blog/guidance/flood-risk-and-coastal-change/ on: 05/11/2019. 23 Planning Practice Guidance: Water supply, wastewater and water quality, Department for Communities and Local Government (2014). Accessed online at: https://www.gov.uk/guidance/water-supply-wastewater-and-water-quality on: 05/11/2019 24 Planning Practice Guidance: Housing - Optional Technical Standards, Department for Communities and Local Government (2014). Accessed online at: https://www.gov.uk/guidance/housing-optional-technical-standards on: 05/11/2019

Gatwick sub-region Water Cycle Study 39
Figure 3.1: Flood Risk and the Preparation of Local Plans25
———————————————————————————————————————————— 25 Based on Diagram 1 of NPPF Planning Practice Guidance: Flood Risk and Coastal Change (paragraph 004, Reference ID: 7-021-
20140306

Gatwick sub-region Water Cycle Study 40
Figure 3.2: PPG: Water Supply, Wastewater and Water Quality Considerations
for Plan-Making and Planning Applications
Plan-Making Planning Applications In
frastr
uctu
re Identification of suitable sites for new
or enhanced infrastructure.
Consider whether new development is appropriate near to water and wastewater infrastructure.
Phasing new development so that water and wastewater infrastructure
will be in place when needed.
Wastewater considerations include:
First presumption is to provide a system for foul drainage discharging into a public sewer.
Phasing of development and infrastructure.
Circumstances where package sewage treatment plants or septic tanks are
applicable.
Wate
r S
up
ply
Not Specified
Planning for the necessary water supply would normally be addressed through the Local Plan, exceptions might
include:
Large developments not identified in
Local Plans;
Where a Local Plan requires enhanced water efficiency in new developments.
This is recommended in all areas of water stress.
Wate
r Q
uali
ty
How to help protect and enhance local surface water and groundwater in
ways that allow new development to proceed and avoids costly assessment
at the planning application stage.
The type or location of new
development where an assessment of the potential impacts on water bodies may be required.
Expectations relating to sustainable drainage systems.
Water quality is only likely to be a significant planning concern when a proposal would:
Involve physical modifications to a water body;
Indirectly affect water bodies, for example as a result of new development such as the redevelopment of land that may be affected by contamination etc. or through a lack of adequate infrastructure to deal with wastewater.
Waste
wate
r
The sufficiency and capacity of wastewater infrastructure.
The circumstances where wastewater from new development would not be
expected to drain to a public sewer.
If there are concerns arising from a planning application about the capacity of wastewater infrastructure, applicants
will be asked to provide information about how the proposed development
will be drained and wastewater dealt with.
Cro
ss-
Bo
un
dary
Co
ncern
s
Water supply and water quality concerns often cross local authority boundaries and can be best considered on a catchment basis. Recommends liaison from the outset.
No specific guidance (relevant to some developments).
SE
A a
nd
Su
sta
inab
ilit
y
Water supply and quality are considerations in strategic environmental assessment and
sustainability appraisal ... sustainability appraisal objectives could include preventing deterioration
of current water body status, taking climate change into account and seeking opportunities to improve
water bodies.
No specific guidance (should be
considered in applications).
Gatwick sub-region Water Cycle Study 41
Planning Practice Guidance: Housing – Optional Technical Standards
This guidance, advises planning authorities on how to gather evidence to set optional
requirements, including for water efficiency. It states that “all new homes already have
to meet the mandatory national standard set out in the Building Regulations (of 125
litres/person/day). Where there is a clear local need, local planning authorities can set
out Local Plan policies requiring new dwellings to meet the tighter Building Regulations
optional requirement of 110 litres/person/day. Planning authorities are advised to
consult with the EA and water companies to determine where there is a clear local need,
and also to consider the impact of setting this optional standard on housing viability. A
2014 study26 into the cost of implementing sustainability measures in housing found that
meeting a standard of 110 litres per person per day would cost only £9 for a four-
bedroom house. In some cases, the connection charge may also be waived by the water
company where developers can demonstrate that development will be water efficient
(110 l/p/d or less).
Building Regulations
The Building Regulations (2010) Part G27 was amended in early 2015 to require that all
new dwellings must ensure that the potential water consumption must not exceed 125
litres/person/day, or 110 litres/person/day where required under planning conditions.
BRE Standards
The Building Research Establishment (BRE) publish an internationally recognised
environmental assessment methodology for assessing, rating and certifying the
sustainability of a range of buildings.
New homes are most appropriately covered by the Home Quality Mark28, and
commercial, leisure, educational facilities and mixed-use buildings by the Building
Research Establishment Environmental Assessment Methodology (BREEAM) UK New
Construction Standard29.
Using independent, licensed assessors, BREEAM/HQM assesses criteria covering a range
of issues in categories that evaluate energy and water use, health and wellbeing,
pollution, transport, materials, waste, ecology and management processes.
In the Homes Quality Mark, 400 credits are available across 11 categories and lead to a
star rating. 18 credits are available for water efficiency and water recycling. A greater
number of credits are awarded for homes using water efficient fittings (with the highest
score achieving 100l/p/d or less), and further credits are awarded for the percentage of
water used in toilet flushing that is either sourced from rainwater or from grey water.
The BREEAM New Construction Standard awards credits across nine categories, four of
which are related to water: water consumption, water monitoring, leak detection and
water efficient equipment. This leads to a percentage score and a rating from “Pass” to
“Outstanding”.
The Councils have the opportunity to seek BREEAM or HQM status for all new, residential
and non-residential buildings.
———————————————————————————————————————————— 26 Housing Standards Review: Cost Impacts, Department for Communities and Local Government (2014). Accessed online at:
https://www.gov.uk/government/uploads/system/uploads/attachment_data/file/353387/021c_Cost_Report_11th_Sept_2014_FINAL.p
df on: 05/11/2019
27 The Building Regulations (2010) Part G - Sanitation, hot water safety and water efficiency, 2015 edition with 2016 amendments. HM
Government (2016). Accessed online at:
https://www.gov.uk/government/uploads/system/uploads/attachment_data/file/504207/BR_PDF_AD_G_2015_with_2016_amendmen
ts.pdf on: 05/11/2019
28 Home Quality Mark, BRE, (2018). Accessed online at: https://www.homequalitymark.com/professionals/standard/ on: 16/04/2020 29 BREEAM UK New Construction, BRE, (2018). Accessed online at: https://www.breeam.com/NC2018/
on: 16/04/2020

Gatwick sub-region Water Cycle Study 42
Sustainable Drainage Systems (SuDS)
From April 2015, Local Planning Authorities (LPA) have been given the responsibility for
ensuring that sustainable drainage is implemented on developments of 10 or more
homes or other forms of major development through the planning system. Under the
new arrangements, the key policy and standards relating to the application of SuDS to
new developments are:
• The National Planning Policy Framework, which requires that development in
areas already at risk of flooding should give priority to sustainable drainage
systems.
• The House of Commons written statement30 setting out governments intentions
that LPAs should “ensure that sustainable drainage systems for the management
of run-off are put in place, unless demonstrated to be inappropriate” and “clear
arrangements in place for ongoing maintenance over the lifetime of the
development.” This requirement is also now incorporated in the 2019 update of
the NPPF (paragraph 165). In practice, this has been implemented by making
Lead Local Flood Authorities (LLFAs) statutory consultees on the drainage
arrangements of major developments.
• The Defra non-statutory technical standards for sustainable drainage systems31.
These set out the government’s high-level requirements for managing peak flows
and runoff volumes, flood risk from drainage systems and the structural integrity
and construction of SuDS. This very short document is not a design manual and
makes no reference to the other benefits of SuDS, for example water quality,
habitat and amenity.
• Surrey County Council is the LLFA in the northern portion of the Gatwick Sub-
Region covering Reigate and Banstead. The Surrey County Council SuDS Design
Guidance32 provides advice relating to surface water drainages and sets out
minimum operating requirements as required in the NPPF.
• West Sussex Council is the LLFA in the southern portion of the Gatwick Sub-
Region, covering Crawley, Horsham and Mid Sussex. West Sussex has worked
with its partnering authorities to produce design guidance for developers,
highlighting the need to consider SuDS33, which is due to be implemented on the
1st April 2020. The County Council have also developed a Policy for the
Management of Surface Water34 which was updated in November 2018.
• An updated version of the CIRIA SuDS Manual35 was published in 2015. The
guidance covers the planning, design, construction and maintenance of SuDS for
effective implementation within both new and existing developments. The
guidance is relevant for a range of roles with the level of technical detail
increasing throughout the manual. The guidance does not include detailed
information on planning requirements, SuDS approval and adoption processes
and standards, as these vary by region and should be checked early in the
planning process.
———————————————————————————————————————————— 30 Sustainable drainage systems: Written statement - HCWS161, UK Government (2014). Accessed online at:
http://www.parliament.uk/business/publications/written-questions-answers-statements/written-statement/Commons/2014-12-
18/HCWS161/ on: 05/11/2019
31 Sustainable Drainage Systems: Non-statutory technical standards for sustainable drainage systems, Defra (2015). Accessed online
at: https://www.gov.uk/government/publications/sustainable-drainage-systems-non-statutory-technical-standards on: 05/11/2019
32 Surrey County Council. July 2019. Surrey County Council – SuDS Design Guidance. 33 Aecom. September 2013. Water. People. Places – A Guide for Master Planning Sustainable Drainage into Developments 34 West Sussex County Council, November 2018 – West Sussex LLFA Policy for the Management of Surface Water 35 The SuDS Manual (C753), CIRIA (2015).
Gatwick sub-region Water Cycle Study 43
• CIRIA also publish “Guidance on the Construction of SuDS” (C768)36, which
contains detailed guidance on all aspects of SuDS construction, with specific
information on each SuDS component available as a downloadable chapter.
• Prior to April 2020, Sewers for Adoption version 7, the standard for designing
sewers to be adopted by UK water companies did not include SuDS, and neither
Southern Water not Thames Water adopted SuDS.
• As of April 2020, the new Design and Construction Guidance (DCG) came into
force in England. This contains details of the water sector’s approach to the
adoption of SuDS, which meet the legal definition of a sewer. The guidance
replaces Sewers for Adoption 7, and compliance by water companies in England
is now mandatory. It is however, as of July 2020, the subject of a legal challenge
led by Thames Water which is supported by Southern Water.
———————————————————————————————————————————— 36 Guidance on the Construction of SuDS (C768), CIRIA (2017), Accessed online at: https://www.ciria.org/ItemDetail?iProductcode=C768&Category=BOOK on: 04/10/2019
Gatwick sub-region Water Cycle Study 44
3.3 Regional Policy
Catchment Flood Management Plans
Catchment Flood Management Plans (CFMP) are high level policy documents covering
large river basin catchments. They aim to set policies for sustainable flood risk
management for the whole catchment covering the next 50 to 100 years.
In the Thames River Basin District, the following CFMPs are relevant to the study are:
• Thames: Catchment Flood Management Plan37
• Medway: Catchment Flood Management Plan38
In the South East River Basin District, the following CFMPs are also relevant:
• Adur: Catchment Flood Management Plan39
• Arun and Western Streams: Catchment Flood Management Plan40
• River Ouse: Catchment Flood Management Plan41
Surface Water Management Plans (SWMPs)
SWMPs outline the preferred surface water management strategies in a given location
and establish a long-term action plan to manage surface water. SWMPs are undertaken,
when required, by LLFAs in consultation with key local partners who are responsible for
surface water management and drainage in their area.
The Gatwick Sub-Region is covered by West Sussex and Surrey County Councils. These
LLFAs have produced SWMPs in the areas identified in their Preliminary FRAs. As it
stands, only the Hassocks SWMP42 is within the Gatwick Sub-Region.
Water Resource Management Plans
Water Resource Management Plans (WRMPs) are 25-year strategies that water
companies are required to prepare, with updates every five years. In reality, water
companies prepare internal updates more regularly. WRMPs are required to assess:
• Future demand (due to population and economic growth)
• Future water availability (including the impact of sustainability reductions)
• Demand management and supply-side measures (e.g. water efficiency and
leakage reduction, water transfers and new resource development)
• How the company will address changes to abstraction licences
• How the impacts of climate change will be mitigated
Where necessary, they set out the requirements for developing additional water
resources to meet growing demand and describe how the balance between water supply
and demand will be balanced over the period 2015 to 2040.
• Using cost-effective demand management, transfer, trading and resource
development schemes to meet growth in demand from new development and to
restore abstraction to sustainable levels.
• In the medium to long term, ensuring that sufficient water continues to be
available for growth and that the supply systems are flexible enough to adapt to
climate change.
———————————————————————————————————————————— 37 Environment Agency. December 2009. Thames Catchment Flood Management Plan.
38 Environment Agency. December 2009. River Medway Catchment Flood Management Plan.
39 Environment Agency. December 2009. River Adur Catchment Flood Management Plan.
40 Environment Agency. December 2009. Arun and Western Streams Catchment Flood Management Plan. 41 Environment Agency. December 2009. River Ouse Catchment Flood Management Plan. 42 . Final Technical Report' Hassocks Surface Water Management Plan. Prepared for West Sussex County Council by CH2M, July 2016

Gatwick sub-region Water Cycle Study 45
The following WRMPs cover the Gatwick Sub-Region and have been reviewed in Section
4:
• Thames Water – Revised Draft WRMP 201943
• South East Water – WRMP 2020 - 208044
• Southern Water – WRMP 2020 - 207045
• SES Water – WRMP 201946
3.4 Local Planning Policy
Localism Act
The Localism Act (2011) changes the powers of local government, it re-distributes the
balance of decision making from central government back to councils, communities and
individuals. In relation to the planning of sustainable development, provision 110 of the
Act places a duty to cooperate on Local Authorities. This duty requires Local Authorities
to “engage constructively, actively and on an ongoing basis in any process by means of
which development plan documents are prepared so far as relating to a strategic
matter”47.
The Localism Act also provides new rights to allow local communities to come together
and shape the development and growth of their area by preparing Neighbourhood
Development Plans, or Neighbourhood Development Orders, where the ambition of the
neighbourhood is aligned with strategic needs and priorities for the area. This means
that local people can decide where new homes and businesses should go and also what
they should look like. As neighbourhoods draw up their proposals, Local Planning
Authorities are required to provide technical advice and support.
3.5 International Environmental Policy
Ramsar
The Convention on Wetlands of International Importance, more commonly known as the
Ramsar convention after the city where it was signed in 1971, aims to protect important
wetland sites. Under the treaty, member counties commit to:
• Wise use of all their wetlands
• Designating sites for the Ramsar list of “Wetlands of International Importance”
(Ramsar Sites) and their conservation
• Cooperating on transboundary wetlands and other shared interests.
“Wise use” of wetlands is defined under the convention as “the maintenance of their
ecological character, achieved through the implementation of ecosystem approaches,
within the context of sustainable development”. A handbook on the wise use of wetlands
is available from the Ramsar Convention Secretariat48.
Ramsar Sites are designated by the National Administrative Authority, responsible for
the Ramsar Convention in each country. In the case of the UK this is the Joint Nature
Conservation Committee (JNCC).
In general, the designation of UK Ramsar sites is underpinned through prior notification
of these areas as Sites of Special Scientific Interest (SSSIs) and as such receive statutory
protection under the Wildlife and Countryside Act 1981 (as amended). More recently,
———————————————————————————————————————————— 43 Thames Water. April 2019. Update to the Revised Draft Water Resources Management Plan 2019 – Technical Update Note.
44 South East Water. 2019. Water Resources Management Plan 2020 to 2080
45 Southern Water. Water Resources Management Plan 2020 to 2070 – Technical Overview
46 SES Water. August 2019. Water Resources Management Plan – Main Report – Issue No.1.
47 Localism Act 2011: Section 110, UK Government (2011). Accessed online at:
http://www.legislation.gov.uk/ukpga/2011/20/section/110 on: 30/07/2019 48 Wise use of wetlands, Ramsar Convention Secretariat (2010). Accessed online at:
https://www.ramsar.org/sites/default/files/documents/library/hbk4-01.pdf on: 11/05/2020
Gatwick sub-region Water Cycle Study 46
Paragraph 176 of the NPPF states that Ramsar sites should be given the same protection
in the planning process as sites designated under the EU Habitats Directive.
3.6 European Environmental Policy
Urban Wastewater Treatment Directive (UWWTD)
The UWWTD49 is an EU Directive that concerns the collection, treatment and discharge
of urban wastewater and the treatment and discharge of wastewater from certain
industrial sectors. The objective of the Directive is to protect the environment from the
adverse effects of wastewater discharges. More specifically Annex II A(a) sets out the
requirements for discharges from urban wastewater treatment plants to sensitive areas
which are subject to eutrophication. The Directive has been transposed into UK
legislation through enactment of the Urban Wastewater Treatment (England and Wales)
Regulations 1994 and 'The Urban Wastewater Treatment (England and Wales)
(Amendments) Regulations 2003'.
Habitats Directive
The EU Habitats Directive aims to protect the wild plants, animals and habitats that make
up our diverse natural environment. The directive created a network of protected areas
around the European Union of national and international importance called Natura 2000
sites. These include:
• Special Areas of Conservation (SACs) - support rare, endangered or vulnerable
natural habitats, plants and animals (other than birds).
• Special Protection Areas (SPAs) - support significant numbers of wild birds and
habitats.
Special Protection Areas and Special Areas of Conservation are established under the EC
Birds Directive and Habitats Directive respectively. The directive also protects over
1,000 animals and plant species and over 200 so called "habitat types" (e.g. special
types of forests, meadows, wetlands, etc.), which are of European importance.
The Water Framework Directive
The Water Framework Directive (WFD) was first published in December 2000 and
transposed into English and Welsh law in December 2003. It introduced a more rigorous
concept of what “good status” should mean than the previous environmental quality
measures. The WFD estimated that 95% of water bodies were at risk of failing to meet
“good status”.
River Basin Management Plans (RBMP) are required under the WFD and document the
baseline classification of each waterbody in the plan area, the objectives, and a
programme of measures to achieve those objectives. The Gatwick Sub-Region falls into
the Thames50 and South East51 River Basin Districts (RBD). Under the WFD the RBMPs,
which were originally published in December 2009 were reviewed and updated in
December 2015. A primary WFD objective is to ensure ‘no deterioration’ in
environmental status, therefore all water bodies must meet the class limits for their
status class as declared in the River Basin Management Plan. Another equally important
objective requires all water bodies to achieve good ecological status. Future
development needs to be planned carefully so that it helps towards achieving the WFD
and does not result in further pressure on the water environment and compromise WFD
objectives. The issues and WFD objectives, outlined in the updated RBMPs are
summarised below:
———————————————————————————————————————————— 49 UWWTD. Accessed online at: https://ec.europa.eu/environment/water/water-urbanwaste/index_en.html
50 Defra and Environment Agency. December 2015. Thames River Basin District – River Basin Management Plan. 51 Defra and Environment Agency. December 2015. South East River Basin District – River Basin Management Plan.
Gatwick sub-region Water Cycle Study 47
Main Issues:
• Physical modifications
• Pollution from wastewater
• Pollution from towns, cities and transport
• Changes to the natural flow and level of water
• Negative effects of invasive non-native species
• Pollution from rural areas
Objectives:
• Prevent deterioration of the status of surface waters and groundwater
• Achieve objectives and standards for protected areas
• Achieve good status for all water bodies or, for heavily modified water bodies and
artificial water bodies, good ecological potential and good surface water chemical
status
• Reverse any significant and sustained upward trends in pollutant concentrations
in groundwater
• Stop discharges/emissions of priority hazardous substances into surface waters
• Progressively reduce the pollution of groundwater and prevent or limit the entry
of pollutants
LPAs must have regard to the Water Framework Directive as implemented in the
Environment Agency’s River Basin Management Plans. It is of primary importance when
assessing the impact of additional wastewater flows on local river quality.
Protected Area Objectives
The WFD specifies that areas requiring special protection under other EC Directives, and
waters used for the abstraction of drinking water, are identified as protected areas.
These areas have their own objectives and standards.
Article 4 of the WFD required Member States to achieve compliance with the standards
and objectives set for each protected area by 22 December 2015, unless otherwise
specified in the Community legislation under which the protected area was established.
Some areas may require special protection under more than one EC Directive or may
have additional (surface water and/or groundwater) objectives. In these cases, all the
objectives and standards must be met.
The types of protected areas are:
• Areas designated for the abstraction of water for human consumption (Drinking
Water Protected Areas)
• Areas designated for the protection of economically significant aquatic species
(Freshwater Fish and Shellfish)
• Bodies of water designated as recreational waters, including Bathing Waters;
• Nutrient-sensitive areas, including areas identified as Nitrate Vulnerable Zones
under the Nitrates Directive or areas designated as sensitive under Urban
Wastewater Treatment Directive (UWWTD)
• Areas designated for the protection of habitats or species where the maintenance
or improvement of the status of water is an important factor in their protection
including relevant Natura 2000 sites
Many WFD protected areas coincide with water bodies; these areas will need to achieve
the water body status objectives in addition to the protected area objectives. Where
water body boundaries overlap with protected areas the most stringent objective applies;

Gatwick sub-region Water Cycle Study 48
that is the requirements of one EC Directive should not undermine the requirements of
another. The objectives for Protected Areas relevant to this study are as follows:
Drinking Water Protected Areas
• Ensure that, under the water treatment regime applied, the drinking water
produced meets the requirements of the Drinking Water Directive plus any UK
requirements to make sure that drinking water is safe to drink
• Ensure the necessary protection to prevent deterioration in the water quality in
the protected area in order to reduce the level of purification treatment required
Economically Significant Species (Freshwater Fish Waters)
• Protect or improve the quality of running or standing freshwater to enable them
to support fish belonging to indigenous species offering a natural diversity; or
species, the presence of which is judged desirable for water management
purposes by the competent authorities of the Member States
Nutrient Sensitive Areas (Nitrate Vulnerable Zones)
• Reduce water pollution caused or induced by nitrates from agricultural sources
• Prevent further such pollution
Nutrient Sensitive Areas (Urban Wastewater Treatment Directive)
• Protect the environment from the adverse effects of urban wastewater discharges
and wastewater discharges from certain industrial sectors
Natura 2000 Protected Areas (water dependent SACs and SPAs)
The objective for Natura 2000 Protected Areas identified in relation to relevant areas
designated under the Habitats Directive or Birds Directive is to:
• Protect and, where necessary, improve the status of the water environment to
the extent necessary to achieve the conservation objectives that have been
established for the protection or improvement of the site's natural habitat types
and species of importance
Groundwater Source Protection Zones
The Environment Agency has a Groundwater Protection Policy to help prevent
groundwater pollution. In conjunction with this the Environment Agency have defined
groundwater Source Protection Zones (SPZs) to help identify high risk areas and
implement pollution prevention measures. The SPZs show the risk of contamination
from activities that may cause pollution in the area, the closer the activity, the greater
the risk. There are three main zones (inner, outer and total catchment) and a fourth
zone of special interest which is occasionally applied.
Zone 1 (Inner Protection Zone)
This zone is designed to protect against the transmission of toxic chemicals and water-
borne disease. It indicates the area in which pollution can travel to the borehole within
50 days from any point within the zone and applies at and below the water table. There
is also a minimum 50 metre protection radius around the borehole.
Zone 2 (Outer Protection Zone)
This zone indicates the area in which pollution takes up to 400 days to travel to the
borehole, or 25% of the total catchment area, whichever area is the largest. This is the
minimum length of time the Environment Agency think pollutants need to become diluted
or reduce in strength by the time they reach the borehole.
Gatwick sub-region Water Cycle Study 49
Zone 3 (Total Catchment)
This is the total area needed to support removal of water from the borehole, and to
support any discharge from the borehole.
Zone of Special Interest
This is defined on occasions, usually where local conditions mean that industrial sites
and other polluters could affect the groundwater source even though they are outside
the normal catchment.
The Environment Agency's approach to Groundwater protection52 sets out a series of
position statements that detail how the Environment Agency delivers government policy
on groundwater and protects the resources from contamination. The position statements
that are relevant to this study with regard to discharges to groundwaters, include surface
water drainage and the use of SuDS, discharges from contaminated surfaces (e.g. lorry
parks) and from treated sewage effluent.
European Derived Legislation and Brexit
Much of the legislation behind the regulation of the water environment derives from the
UK enactment of European Union (EU) directives. Following the departure of the United
Kingdom from the European Union on 31st January 2020, this legislation remains in force
during the transition period, until 31st December 2020. The UK government has signalled
that “the UK will in future develop separate and independent policies in areas such as …
the environment … maintaining high standards as we do so.”53
As the details of future changes to environmental regulation are not yet known, this
study has used existing, European Union derived environmental legislation, most
significantly the Water Framework Directive, to assess the environmental impacts of
planned development during the plan period for the Local Plan. Should this situation
change, a review of this Water Cycle Study may be required considering any new
emerging regulatory regime.
3.7 UK Environmental Policy
Conservation of Habitats and Species Regulations 2017 (as amended)
The Conservation of Habitats and Species Regulations 2010 (commonly referred to as
the Habitats Regulations) consolidated the Conservation (Natural Habitats, &c.)
Regulations 1994, and transposed the EU Habitats Directive in England and Wales. This
was further amended in 2017.
The Habitats Regulations define the requirement for a Habitats Regulations Assessment
(HRA) to be carried out. The purpose of this is to determine if a plan or project may
affect the protected features of a “habitats site”. These include:
• A special area of conservation (SAC)
• A site of Community Importance
• A site hosting a priority natural habitat type or priority species protected in
accordance with Article 5(4) of the Habitats Directive
• A Special Protection Area (SPA)
• A potential SPA
All plans and projects (including planning applications) which are not directly connected
with, or necessary for the conservation management of a habitat site require
———————————————————————————————————————————— 52 The Environment Agency's approach to groundwater protection, Environment Agency (2018). Accessed online at:
https://www.gov.uk/government/uploads/system/uploads/attachment_data/file/598778/LIT_7660.pdf
on: 30/07/2019 53 The Future Relationship between the UK and the EU (2020) Accessed online at https://www.gov.uk/government/speeches/the-future-
relationship-between-the-uk-and-the-eu on 25/02/2020

Gatwick sub-region Water Cycle Study 50
consideration of whether the plan or project is likely to have significant effects on that
site.
This is referred to as the “Habitats Regulations Assessment screening” and should take
into account the potential effects of both the plan/project itself and in combination with
other plans or projects.
Part 6 of the conservation of Habitats and Species Regulations 2017 states that where
the potential for likely significant effects cannot be excluded, a competent authority must
make an appropriate assessment of the implications of the plan or project for that site,
in view of the site’s conservation objectives.
The competent authority may agree to the plan or project only after having rules out
adverse effects on the integrity of the habitats site.
If adverse effects cannot be rules out, and where there are no alternative solutions, the
plan r project can only proceed if there are imperative reasons of over-riding public
interest and if the necessary compensatory measures can be secured.
The “People over Wind” ECJ ruling (C-323/17) clarifies that when making screening
decisions for the purposes of deciding whether an appropriate assessment is required,
competent authorities cannot take into account any mitigation measures. This must be
part of the appropriate assessment itself.
Wildlife and Countryside Act 1981
Sites of Special Scientific Interest (SSSI) are designated and legally protected under the
Wildlife and Countryside Act 1981, Section 28G places a duty to take reasonable steps,
consistent with the proper exercise of the authority’s functions, to “further to the
conservation and enhancement of the flora, fauna or geological or physiographical
features by reason of which the site is of special scientific interest.”54
The Government’s 25-year Environment Plan55 has a target of “restoring 75% of our one
million hectares of terrestrial and freshwater protected sites to favourable condition,
securing their wildlife value for the long term.” In line with this, and the Wildlife and
Countryside Act 1981, Local Authorities should look put forward options that contribute
to conservation or restoration of favourable condition, and at the very least must not
introduce policies that hinder the restoration of favourable condition by increasing
existing issues.
A site is said to be in “favourable condition” when the designated feature(s) within a unit
are being adequately conserved and the results from monitoring demonstrate that the
feature(s) in the unit are meeting all the mandatory site specific monitoring targets set
out in the favourable condition targets (FCT).
The Natural Environment Rural Communities Act (NERC)
The Natural Environment and Rural Communities Act 2006 (commonly referred to the
as the NERC Act), was intended to implement key aspects of the Government’s Rural
Strategy published in 2004 and established Natural England as a new independent body
responsible for conserving, enhancing and managing England’s natural environment.
Section 40 of the NERC Act places a duty to conserve biodiversity on public authorities,
including Local Planning Authorities and water companies. “The public authority must, in
exercising its functions, have regard, so far as is consistent with the proper exercise of
those functions, to the purpose of conserving biodiversity.”56
———————————————————————————————————————————— 54 Wildlife and Countryside Act 1981, HM Government (1981). Accessed online at:
http://www.legislation.gov.uk/ukpga/1981/69/section/28G on: 11/05/2020
55 A Green Future: Our 25 Year Plan to Improve the Environment, HM Government (2018). Accessed online at:
https://assets.publishing.service.gov.uk/government/uploads/system/uploads/attachment_data/file/693158/25-year-environment-
plan.pdf on: 11/05/2020 56 Natural Environment and Rural Communities Act 2006, HM Government (2006). Accessed online at:
http://www.legislation.gov.uk/ukpga/2006/16/section/40 on: 11/05/2020

Gatwick sub-region Water Cycle Study 51
Section 41 requires the Secretary of State to publish and maintain a list of species and
types of habitat which in the Secretary of State’s opinion (in consultation with Natural
England) are of “principal importance for the purpose of conserving biodiversity.”
3.8 Water Industry Policy
The Water Industry in England
Water and sewerage services in England and Wales are provided by 10 Water and
Sewerage Companies (WaSCs) and 12 ‘water-only’ companies. The central legislation
relating to the industry is the Water Industry Act 1991. The companies operate as
regulated monopolies within their supply regions, although very large water users and
developments are able to obtain water and/or wastewater services from alternative
suppliers - known as inset agreements.
The Water Act 2014 aims to reform the water industry to make it more innovative and
to increase resilience to droughts and floods. Key measures could influence the future
provision of water and wastewater services include:
• Non-domestic customers have been able to switch their water supplier and/or
sewerage undertaker from April 2017
• New businesses are now able to enter the market to supply these services
• Measures to promote a national water supply network
• Enabling developers to make connections to water and sewerage systems
Regulations of the Water Industry
The water industry is primarily regulated by three regulatory bodies;
• The Water Services Regulation Authority (OfWAT) – economic/ customer service
regulation
• Environment Agency - environmental regulation
• Drinking Water Inspectorate (DWI) - drinking water quality
Every five years the industry submits a Business Plan to OfWAT for a Price Review (PR).
These plans set out the companies’ operational expenditure (OPEX) and capital
expenditure (CAPEX) required to maintain service standards, enhance service (for
example where sewer flooding occurs), to accommodate growth and to meet
environmental objectives defined by the Environment Agency. OfWAT assesses and
compares the plans with the objective of ensuring what are effectively supply monopolies
and operating efficiently. The industry is currently in Asset Management Plan 6 (AMP6)
which runs from 2015 to 2020.
When considering investment requirements to accommodate growing demand, water
companies are required to ensure a high degree of certainty that additional assets will
be required before funding them. Longer term growth is, however, considered by the
companies in their internal asset planning processes and in their 25-year Strategic
Direction Statements and WRMPs.
Drainage and Wastewater Management Plans
The UK Water Industry Research (UKWIR) “21st Century Drainage” programme has
brought together water companies, governments, regulators, local authorities,
academics and environmental groups to consider how planning can help to address the
challenges of managing drainage in the future. These challenges include climate change,
population growth, urban creep and meeting the Water Framework Directive.
The group recognised that great progress has been made by the water industry in its
drainage and wastewater planning over the last few decades, but that, in the future,
there needs to be greater transparency and consistency of long-term planning. The

Gatwick sub-region Water Cycle Study 52
Drainage and Wastewater Management Plan (DWMP) framework57 sets out how the
industry intends to approach these goals, with the objective of the water companies
publishing plans by the end of 2022, in order to inform their business plans for the 2024
Price Review.
DWMPs will be prepared for wastewater catchments or groups of catchments and will
encompass surface water sewers within those areas which do not drain to a treatment
works. The framework defines drainage to include all organisations and all assets which
have a role to play in drainage, although, as the plans will be water company led, it does
not seek to address broader surface water management within catchments.
LPAs and LLFAs are recognised as key stakeholders and will be invited to join, alongside
other stakeholders, the Strategic Planning Groups (SPGs) organised broadly along river
basin district catchments.
DWMPs cannot inform this study, as process is only just commencing. In the future,
however, DWMPs will provide more transparent and consistent information on sewer
flooding risks and the capacity of sewerage networks and treatment works, and this
should be taken into account in SFRAs, Water Cycle Studies, as well as in site-specific
FRAs and Drainage Strategies.
Developer Contributions and Utility Companies
Developments with planning permission have a right to connect to the public water and
sewerage systems, however, there is no guarantee that the capacity exists to serve a
development.
Developers may requisition a water supply connection or sewerage system or self-build
the assets and offer these for adoption by the water company or sewerage undertaker.
Self-build and adoption are usually practiced for assets within the site boundary, whereas
requisitions are normally used where an extension of upgrading the infrastructure
requires construction on third party land. The cost of requisitions is shared between the
water company and developer as defined in the Water Industry Act 1991.
Where a water company is concerned that a new development may impact upon their
service to customers or the environment (for example by causing foul sewer flooding or
pollution) they may request the LPA to impose a Grampian condition, whereby the
planning permission cannot be implemented until a third-party secures the necessary
upgrading or contributions.
The above arrangements are third party transactions because the Town and Country
Planning Act Section 106 agreements and Community Infrastructure Levy agreements
may not be used to obtain funding for water or wastewater infrastructure.
Changes to Charging Rules for New Connections
OfWAT, the water industry's economic regulator, has published new rules covering how
water and wastewater companies may charge customers for new connections58. These
rules apply to all companies in England and commenced on 1st April 2018.
The four relevant water companies for the study area have now published their charging
arrangements which can be found in the footnotes59,60,61,62.
The key changes include:
———————————————————————————————————————————— 57 A framework for the production of Drainage and Wastewater Management Plans, UK Water Industry Research (2018). Accessed
online at:
http://www.water.org.uk/wp-content/uploads/2018/12/Water-UK-DWMP-Framework-Report-Main-Document.pdf on: 30/07/2019.
58 Charging rules for new connection services (English undertakers), OfWAT (2017). Accessed online at:
https://www.ofwat.gov.uk/publication/charging-rules-new-connection-services-english-undertakers/ on: 30/07/2019
59 Thames Water. Charging Arrangements for New Connection Services – 1st April 2019 to 31st March 2020
60 Southern Water. January 2019. New Connections Services – Charging Arrangements 2019 – 2020. 61 South East Water. Charging Arrangements for New Connection Services 2019 – 2020.
62 SES Water. January 2019. Developer Services – Charging Arrangements for 2019/20

Gatwick sub-region Water Cycle Study 53
• More charges will be fixed and published on water company websites. This will
provide greater transparency to developers and will also allow alternative
connection providers to offer competitive quotations more easily
• There will be a fixed infrastructure charge for water and one for wastewater
• The costs of network reinforcement will no longer be charged directly to the
developer in their connection charges. Instead, the combined costs of all of the
works required on a company's networks, over a five-year rolling period, will be
covered by the infrastructure charges payed for all new connections.
• The definition of network reinforcement has changed and will now apply only to
works required as a direct consequence of the increased demand due to a
development. Where the water company has not been notified of a specific
development, for example when developing long-term strategic growth schemes,
the expenditure cannot be recovered through infrastructure charges.
• Some suppliers offer charging incentives to encourage environmentally
sustainable development
Design and Construction Guidance (DCG)
The Design and Construction Guidance contains details of the water sector’s approach
to the adoption of SuDS, which meet the legal definition of a sewer. This replaces Sewers
for Adoption and differs from previous sewers for adoption guidance as compliance by
water companies in England will be mandatory.
Sewers for Adoption, up to and including Version 7, had a narrow definition of adoptable
sewers as below-ground systems comprising of gravity sewers and manholes, pumping
stations and rising mains. This essentially excluded the adoption of SuDS by water
companies, with the exception of below-ground storage comprising of oversized pipes or
chambers.
The new DCG provides a mechanism for water companies to secure the adoption of a
wide range of SuDS components which are now compliant with the legal definition of a
sewer. There are however several non- adoptable components such as green roofs,
pervious pavements and filter strips. These components may still form part of a drainage
design so long as they remain upstream of the adoptable components.
The Design and Construction Guidance states that the drainage layout of a new
development should be considered at the earliest stages of design. It is hoped that the
new guidance will lead to better managed and more integrated surface water systems
which incorporate amenity, biodiversity and water quality benefits.

Gatwick sub-region Water Cycle Study 54
4 Water Resources and Water Supply
4.1 Introduction
Objectives
The aim of the water resources assessment is to ensure that sufficient water is available
in the region to serve the proposed level of growth, and that it can be abstracted without
a detrimental impact on the environment, both during the plan period and into the future.
The report characterises the study area, identifying the key surface water and
groundwater bodies, and local geology. It highlights the pressures on water resources in
the region, identifies existing constraints on abstraction and provides evidence for
adopting tighter water efficiency targets.
Surface Waters
Figure 4.1 shows the main watercourses within the study area. These watercourses are
located within the Thames and South East River Basin Management Plan (RBMP)
catchments.
The River Mole flows in a north-westerly direction through Reigate and Banstead in the
north portion of the study area. The River Mole discharges into the River Thames
between East Molesey and Thames Ditton.
The River Arun flows in a westerly direction through the northern portion of Horsham
and southwards along the western boundary of the study area. This watercourse
discharges into the English Channel at Littlehampton.
The River Adur catchment dominates the southern portion of the study area, flowing
southwards through Horsham and Mid Sussex, eventually reaching the English Channel
at Shoreham-by-Sea.
In the eastern portion of the study area, the upper reaches of the River Medway and
River Ouse both flow in an easterly direction through Mid Sussex and out of the study
area. The Ardingly Reservoir is located on the River Ouse within Mid Sussex. Weir Wood
Reservoir is located in Wealden District, directly on the Mid Sussex boundary.

Gatwick sub-region Water Cycle Study 55
Figure 4.1 Significant surface waterbodies

Gatwick sub-region Water Cycle Study 56
Groundwaters
There are twelve groundwater bodies within the study area which are shown in Figure
4.2 and their corresponding WFD classification is summarised in Table 4.1 below. Seven
of these have poor quantitative status, which in the case of five of these, is due to over-
abstraction for water supply. The effect of further abstraction in these areas could be a
reduction in river flow in dependent surface waterbodies, or a deterioration in dependent
water sensitive ecosystems.
Table 4.1 WFD status of groundwater bodies
Groundwater Body Quantitative
Status
Chemical Status Overall Status - WFD
Cycle 2 (2016)
Adur & Ouse
Hastings Beds
Good Good Good
Arun & Western
Streams Hastings
Beds
Good Good Good
Brighton Chalk
Block
Poor
(Groundwater
abstraction –
water supply
Poor Poor
Chichester Chalk Poor
(Groundwater
abstraction –
water supply
Poor Poor
Copthorne
Tunbridge Wells
Sands
Good Good Good
Dorking North
Downs Chalk
Poor
(Groundwater
abstraction –
Water
supply)
Good Poor
Epsom North
Downs Chalk
Poor
(Groundwater
abstraction –
Water
supply)
Good Poor
Kent Weald
Western – Medway
Poor Poor Poor
Lower Greensand
Adur & Ouse
Good Good Good
Lower Greensand
Arun & Western
Streams
Good Poor Poor
Reigate Lower
Greensand
Poor Good Poor
Worthing Chalk Poor
(Groundwater
abstraction –
Water
supply)
Good Poor

Gatwick sub-region Water Cycle Study 57
Figure 4.2 Groundwater bodies

Gatwick sub-region Water Cycle Study 58
Geology
The geology of the catchment is an important influencing factor in the way that water
runs off the ground surface. This is primarily due to variations in the permeability of the
surface material and bedrock stratigraphy.
Figure 4.3 shows the varying bedrock geology of the Gatwick Sub-Region.
In general, the northern portion of Reigate and Banstead is underlain by chalks, whereas
the southern portion is underlain by mudstones, siltstones and sandstones.
The north western portion of Crawley is made up of mudstone, siltstone and sandstone
and the south eastern portion is interbedded sandstones and siltstones. There is some
faulting between these two geologies.
The northern portion of Mid Sussex is largely underlain by interbedded sandstones and
siltstones with areas of mudstone siltstone and sandstone. The northern portion of
Horsham in made up of a combination of the same interbedded sandstones and siltstones
with more significant areas of mudstone siltstone and sandstone. The southern portions
of Mid Sussex and Horsham are made up of mudstone siltstones and sandstones and
chalk is located along the southern boundary of the study area.
Figure 4.4 shows superficial deposits of clay, silt, gravel and sand across the Gatwick
Sub-Region.

Gatwick sub-region Water Cycle Study 59
Figure 4.3 Bedrock Geology of the Gatwick Sub-Region

Gatwick sub-region Water Cycle Study 60
Figure 4.4 Superficial Geology of the Gatwick Sub-Region

Gatwick sub-region Water Cycle Study 61
4.2 Availability of Water Resources
Abstraction Licencing Strategy
The Environment Agency (EA), when working through their Catchment Abstraction
Management Strategy (CAMS) process, prepare an Abstraction Licensing Strategy (ALS)
for each sub-catchment within a river basin. This licensing strategy sets out how water
resources are managed in different areas of England and contributes to the
implementation of the Water Framework Directive (WFD). The ALS report provides
information on the resources available and what conditions might apply to new licences.
The licences require abstractions to stop or reduce when a flow or water level falls below
a specific threshold, as a restriction to protect the environment and manage the balance
between supply and demand for water users. Thresholds are usually defined by the flow
percentiles which can be calculated using gauged daily flow data, where for example Q10
is the flow exceeded or equalled for 10% of the time. The CAMS process is published in
a series of ALSs for each river basin.
All new licences, and some existing licenses, are time limited. This allows time for a
periodic review of the specific area as circumstances may have changed since the
licences were initially granted. These are generally given for a twelve-year duration, but
shorter license durations may also be granted. This is usually based on the resource
assessment and environmental sustainability. In some cases, future plans or changes
may mean that the EA will grant a shorter time limited licence, so it can be re-assessed
following the change. If a licence is only required for a short time period, it can be
granted either as a temporary licence or with a short time limit. If a licence is considered
to pose a risk to the environment it may be granted with a short time limit while
monitoring is carried out. The licences are then replaced with a changed licence, revoked
or renewed near to the expiry date.
The ALS are important in terms of the Water Resource Management Plan (WRMP) as this
helps to determine the current and future pressures on water resources and how the
supply and demand will be managed by the relevant water companies63. The Gatwick
Sub-Region is covered by five ALS areas which are shown in Figure 4.5 below:
• Arun and Western Streams
• Adur and Ouse
• Medway
• Mole
• London
———————————————————————————————————————————— 63 Environment Agency (2018) Managing Water Abstraction. Accessed Online at:
https://www.gov.uk/government/collections/water-abstraction-licensing-strategies-cams-process on: 03/09/2019

Gatwick sub-region Water Cycle Study 62
Figure 4.5 CAMS Boundaries Covering the Gatwick Sub-Region

Gatwick sub-region Water Cycle Study 63
Resource Availability Assessment
In order to abstract surface water, it is important to understand what water resources
are available within a catchment and where abstraction for consumptive purposes will
not pose a risk to resources or the environment. The Environment Agency has developed
a classification system which shows:
• The relative balance between the environmental requirements for water and how
much has been licensed for abstraction;
• whether there is more water available for abstraction in the area;
• areas where abstraction may need to be reduced.
The availability of water for abstraction is determined by the relationship between the
fully licensed (all abstraction licences being used to full capacity) and recent actual flows
(amount of water abstracted in the last 6 years) in relation to the Environmental Flow
Indicator (EFI). Results are displayed using different water resource availability colours,
further explained in Table 4.2. In some cases, water may be scarce at low flows, but
available for abstraction at higher flows. Licences can be granted that protect low flows,
this usually takes the form of a "Hands-off Flow" (HOF) or Hands-off Level (HOL)
condition on a licence, which mean abstractions have to stop when the river flow or level
falls below a particular value. This value is known as the HOF or HOL and ensures there
is always a minimum flow in the river. Surface Water Flows can be assessed at
Assessment Points (APs) which are significant points on the river, often where two main
rivers join or at a gauging station.
Groundwater availability as a water resource is assessed similarly, unless better
information on principle aquifers is available or if there are local issues that need to be
taken into account.
Table 4.2: Implications of Surface Water Resource Availability Colours
Water Resource Availability Colour
Implications for Licensing
High hydrological regime
There is more water than required to meet the needs of the environment. Due to the need to maintain the near pristine nature of the water body, further abstraction is severely restricted.
Water available for licensing
There is more water than required to meet the needs of the environment.
Licences can be considered depending on local/downstream impacts.
Restricted water available for
licensing
Fully Licensed flows fall below the Environmental Flow Indicator (EFI).
If all licensed water is abstracted there will not be enough water left for the needs of the environment. No new consumptive licences would be granted. It may also be appropriate to investigate the
possibilities for reducing fully licensed risks. Water may be available via licence trading.
Water not available for licensing
Recent Actual flows are below the Environmental Flow Indicator (EFI).
This scenario highlights water bodies where flows are below the indicative flow requirement to help support Good Ecological Status. No further licences will be granted. Water may be available via
licence trading.

Gatwick sub-region Water Cycle Study 64
HMWBs (and /or discharge rich water
bodies)
These water bodies have a modified flow that is influenced by reservoir compensation releases or they have flows that are augmented. There may be water available for abstraction in discharge rich catchments.
Water resource availability is assessed under four different flow conditions:
• Q95 – very low flows which are exceeded 95% of the time
• Q70 – low flows which are exceeded 70% of the time
• Q50 – median flows which are exceeded 50% of the time
• Q30 – high flows which are exceeded 30% of the time
Adur and Ouse ALS
The Adur and Ouse ALS64 encompasses the catchments of the River Adur, River Ouse
and their tributaries. It also contains the Brighton Chalk aquifer and is largely within the
South Downs National Park.
The Ouse River system is dominated by one large surface water abstraction, managed
by South East Water, which is supported by augmentation releases from Ardingly
reservoir. Comparatively, the River Adur is dominated by discharges from wastewater
treatment works. These outflows represent a large net loss of water from the ALS area
since only a third of wastewater is discharged as surface water.
The majority of the Adur and Ouse ALS encompassed by the Gatwick Sub-Region has
water available for licencing at Q30 and Q50 flows (high and median flows), with only a
small section in the North breaking this trend. Under Q70 and Q95 (low and very low
flows) conditions most of the area becomes influenced by heavily modified water bodies
and flows become dependent on reservoir compensation releases.
There are nine Assessment Points (APs) within the Adur and Ouse ALS, four of which fall
within the Gatwick Sub-Region, AP1, AP2, AP7 and AP8. There is water available for
licensing at AP1 and 2 and no water available at AP7 and AP8.
Where groundwater abstractions are known to directly impact surface water flows, the
groundwater availability in the Adur and Ouse ALS region is guided by the surface water
assessment points. However, this is not the case for the southern Brighton Chalk Block,
which does not contribute significantly to river flow. Here the largest abstraction issue
is to prevent saline intrusion. Resource availability maps for the Adur and Ouse ALS are
presented below.
All remaining streams within the region are managed on a case-by-case basis and
potential abstractors are encouraged to apply to take water during winter high flow
periods to provide reservoir storage for subsequent re-use during drier months.
Since the Environment Agency has no control over the operation of discharges, there is
no water available in the River Adur catchment during low and summer flows. Decisions
about applications are made on a case-by-case basis.
Arun and Western Streams ALS
The Arun and Western Streams ALS65 covers the south western boundary of the Gatwick
Sub-Region, encompassing the River Arun, Western Rother and the West Sussex coastal
plains. Chalk and Greensand aquifers underlay these catchments and provide the most
important water resources, supporting water supply and freshwater inputs to the
designated statutory conservation sites.
———————————————————————————————————————————— 64 Environment Agency. March 2019. Adur and Ouse Abstraction Licensing Strategy
65 Environment Agency. March 2019. Arun and Western Streams Abstraction Licensing Strategy
Gatwick sub-region Water Cycle Study 65
The majority of the Arun and Western Streams ALS becomes reliant on reservoir
compensation once flows decrease from Q30 (high flows). This cannot be relied on and
so the Environment Agency cannot grant licences made up from these discharges.
There are eleven APs within the Arun and Western Streams ALS, five of which fall within
the Gatwick sub-Region: AP1, AP5, AP6, AP7 and AP11. There is no water available for
licensing at these any of these APs except AP11 where abstraction is restricted.
The groundwater availability in the Arun and Western Streams ALS region is guided by
the surface water assessment unless specific information on principal aquifers exists or
local issues that need protecting overrule it.
There is water available in two of the groundwater abstraction areas and restricted water
available in the remaining three, meaning no new consumptive licences will be granted.
Resource availability for APs within the Gatwick sub-Region is presented below.
Mole ALS
The Mole ALS66 covers an area in the north of the Gatwick Sub-Region, including the
urban areas of Crawley, Horley, Reigate and Redhill. The area forms nearly 5% of the
River Thames catchment and contains the River Mole and its tributaries. Groundwater
abstraction accounts for 72% all licenced abstractions in this catchment, and the
majority of these come from a chalk aquifer.
The Mole ALS has water resources available at least 50% of the time, though limits are
dependent on the Thames Q50 (median) HoF. There are also areas within the Gatwick
Sub-Region with groundwater either fully available or available on a restricted basis.
There are six APs within the Mole ALS, three of which fall within the Gatwick Sub-Region:
AP4, AP5 and AP6. There is water resource availability 50% of the time at these
assessment points.
The groundwater availability in the Mole ALS is guided by the surface water assessment
unless specific information on principal aquifers exists or local issues that need protecting
overrule it.
Consumptive groundwater licences which do not have a direct impact upon main river
flows may be permitted but may be subject to restrictions such as prescribed
groundwater levels. Restrictions will be determined on a case-by-case basis, dependent
upon the nature and scale of any abstraction.
Resource availability for AP4, AP5 and AP6 is presented below.
Since the River Mole will eventually flow into the non-tidal River Thames, the abstraction
strategy of this watercourse must consider the flow requirements of the Thames. It is
for this reason that all surface abstractions will be subject to a dual HoF system, linked
to both local flows and the Q50 (median) HOF at Kingston Gauging station.
Medway ALS
The Medway ALS67 is the largest river basin in Kent and contains 260 km of main river.
However, only a small portion of the study area, the eastern edge of Mid Sussex, is
contained within this basin.
There are eight APs within the Medway ALS, none of which are located in the Gatwick
Sub-Region. In the area contained within the Gatwick Sub-Region, there is either
restricted water available for licensing or no water available for licensing. Water
resources are available less than 30% of the time in this area.
———————————————————————————————————————————— 66 Environment Agency. February 2013. Mole Abstraction Licensing Strategy
67 Environment Agency. February 2013. Medway Abstraction Licensing Strategy
Gatwick sub-region Water Cycle Study 66
London ALS
The London ALS68 covers the northern portion of Reigate and Banstead, north of the
M25, primarily Banstead. This catchment covers tributaries of the River Thames. The
hydrology across most of the catchment is influenced by the impermeable London Clay.
The Confined Chalk underneath London is designated as a principal aquifer.
There are ten AP points within the London ALS, none of which are located within the
Gatwick Sub-Region however, AP1, AP2 and AP3 are downstream of the study area.
In the study area, there is restricted water available for licencing, with consumptive
abstraction available at least 30% of the time.
———————————————————————————————————————————— 68 Environment Agency. March 2019. London Abstraction Licensing Strategy

Gatwick sub-region Water Cycle Study 67
Figure 4.6: Water Resource Availability of the Adur and Ouse ALS
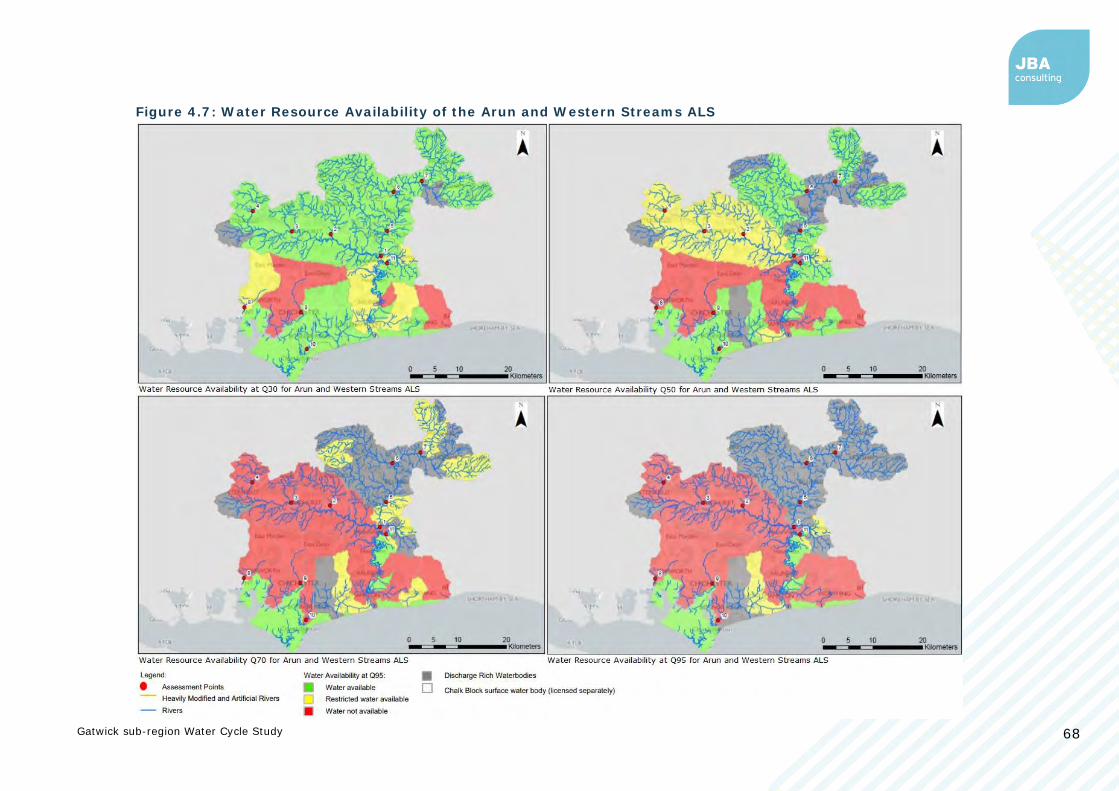
Gatwick sub-region Water Cycle Study 68
Figure 4.7: Water Resource Availability of the Arun and Western Streams ALS

Gatwick sub-region Water Cycle Study 69
Figure 4.8: Water Resource Availability of the Mole ALS
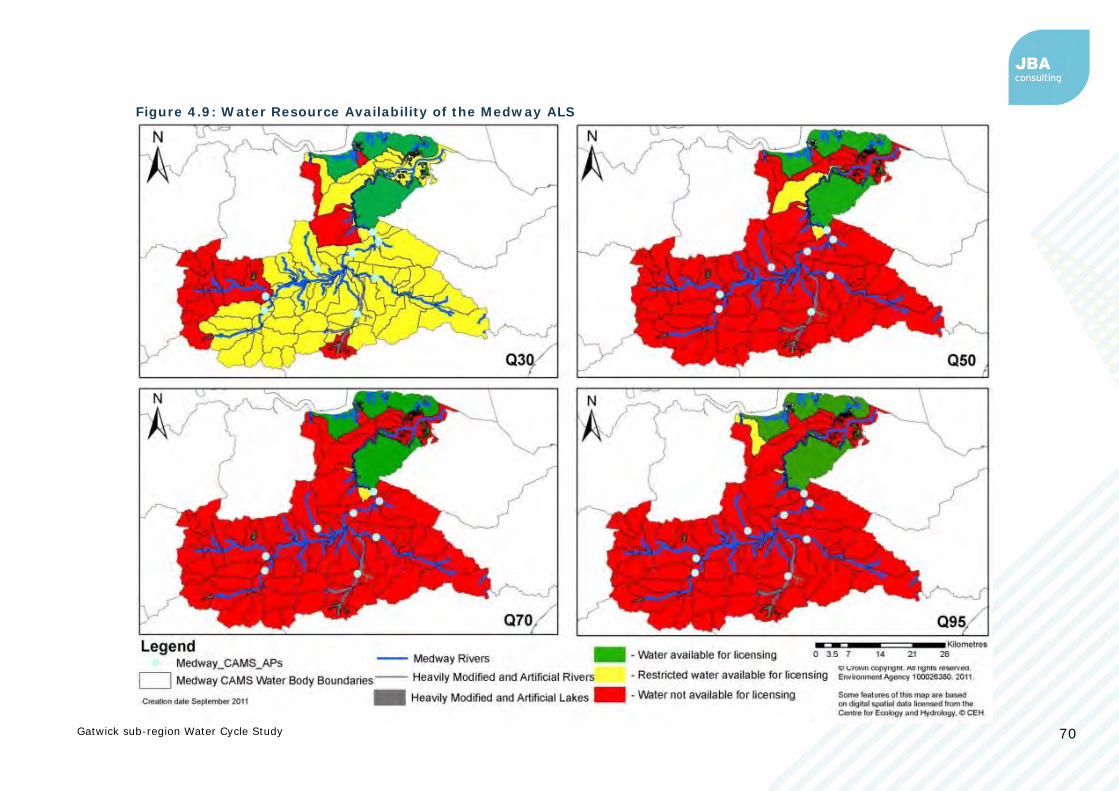
Gatwick sub-region Water Cycle Study 70
Figure 4.9: Water Resource Availability of the Medway ALS

Gatwick sub-region Water Cycle Study 71
Figure 4.10: Water Resource Availability of the London ALS

Gatwick sub-region Water Cycle Study 72
4.3 Recommendations for Better Management Practices
The main options identified in the ALSs are to adopt water efficiency and demand
management techniques, including:
• Testing the level of water efficiency before granting an abstraction licence,
• Promoting efficient use of water,
• Encouraging grey water recycling and alternative water sources such as effluent
reuse,
• Taking actions to limit the demand,
• Reducing leakage; and
• Embedding policies for low-water consumption design in new buildings into
spatial plans.
This would ultimately cut the growth in abstraction and limit the impacts on flow and the
ecology.
Abstraction at Hardham
The Environment Agency and Natural England made JBA aware of specific issues with
Southern Water’s abstraction at Hardham and its impact on the Arun Valley SPA/SAC
and Pulborough Brooks SSSI. Discussions on this abstraction are ongoing, and further
analysis of this issue is beyond the scope of the water cycle study, however this may
provide additional supply-demand challenges for Southern Water in the Sussex North
water resource zone (Figure 4.11 shows the extents of this zone which covers all of
Horsham District and most of Crawley Borough).
The EA recommends that LPAs “consider further discussions with Southern Water to
understand any impacts this may have for developments proposed in this Supply Zone
to understand whether phasing development would be required in line with infrastructure
investment”.
4.4 Water Resource Assessment: Water Resource Management Plans
Introduction
When new development within a Local Planning Authority is being planned, it is important
to ensure that there are sufficient water resources in the area to cover the increase in
demand without risk of shortages in the future or during periods of high demand, and
without causing a negative impact on the waterbodies from which water is abstracted.
The aim of this assessment was to compare the future additional demand as a result of
the development proposed within the emerging Local Plans, with the demand allowed
for by SES Water, Southern Water and South East Water in their Water Resource
Management Plans.
The water resources assessment has been carried out utilising two approaches; initially
by reviewing the water company Water Resource Management Plans (WRMPs) and
secondly by providing the water companies with a growth estimate, allowing them to
assess the impact of planned growth on their water resource zones.
Water Companies and Water Resources Zones
Three water companies supply the Gatwick Sub-Region.
• SES Water (SESW) serves Reigate and Banstead and the northern portion of
Crawley, notably including Gatwick Airport.
• Southern Water serves Horsham and the majority of Crawley.
• South East Water serves Mid Sussex and the south eastern edge of Crawley.

Gatwick sub-region Water Cycle Study 73
Water companies divide their supply areas into Water Resource Zones (WRZ), the WRZs
providing water to the study are shown in Table 4.3 and Figure 4.11.
Table 4.3: WRZs Impacting the Gatwick Sub-Region
Water
Company WRZ
Gatwick Sub-Region
LPA Other Local Authorities
SES Water
Sutton WRZ
Reigate and Banstead
Epsom and Ewell
London Borough of Sutton
London Borough of Merton
London Borough of Croydon
East Surrey
WRZ
Reigate and Banstead
Crawley (North)
Mole Valley
Guildford
Elmbridge
Tandridge
Croydon
Sevenoaks
Southern Water
Sussex North WRZ
Horsham
Crawley
Chichester
Arun
Sussex Brighton WRZ
Mid Sussex
Adur
Brighton and Hove
Lewes
South East
Water
Haywards Heath
WRZ
Mid Sussex
Crawley (South East)
Lewes
Wealden
Water Resources in the South East
All of these water companies are members of the Water Resources in the South East
(WRSE) Group, an alliance of six water companies, the Environment Agency, OfWAT,
Consumer Council for Water, Natural England and Defra. The group aims to develop an
affordable, sustainable and resilient approach to water resource management in the
region. They do this by:
• Developing and maintaining a regional water resources model, contributed to by
all of the water companies. This will be used to assess the impact of both demand
and supply-side measures, including testing new options for inter-company
transfers. This modelling has informed the 2019 WRMPs and is being further
developed to inform the next round of WRMPs, due to be finalised in 2024.
• WRSE is moving towards developing a regional plan covering multi-sector
resilience, considering the needs of the environment, industry and agriculture as
well as public water supply as is covered by WRMPs.
• WRSE is currently tendering for an organisation to produce forecasts of population
and properties for the entire WRSE region for the period 2019 to 2100 at the
Water Resource Zone (WRZ) level with locations of development sites earmarked
for future development by the local authorities.

Gatwick sub-region Water Cycle Study 74
Methodology
The following Water Resource Management Plans were reviewed:
• SES Water – Revised Draft Water Resources Management Plan 201969
• Southern Water – Water Resource Management Plan 202070
• South East Water – Water Resources Management Plan 2020 to 208071
Attention was mainly focussed upon:
• The available water resources and future pressures which may impact upon the
supply element of the supply/demand balance
• The allowance within those plans for housing and population growth and its
impact upon the demand side of the supply/demand balance
The spatial boundaries of the WRZs have been used to overlay the Local Authority
boundaries.
The Ministry for Housing, Communities and Local Government (MHCLG) 2014-based
estimates of household growth up to 204172 were collated for the local authorities which
lie within each WRZ. The percentage of the current population of each local authority
within the WRZ was estimated from the OS CodePoint dataset and the WRZ boundary.
The assessment has used MHCLG figures, because they are available for all LPAs within
the water resource zone, and over a consistent timescale and methodology. The
resulting total number of households in the base year within the WRZ is comparable with
the figures quoted in the WRMPs.
The results were assessed using a red/amber/green traffic light definition to score the
water resource zone:
Adopted WRMP has
planned for the increase
in demand, or sufficient
time to address supply
demand issues in the
next WRMP.
Adopted WRMP has
planned for the increase
in demand, or sufficient
time to address supply
demand issues in the
next WRMP. The site is
located in an area that is
significantly affected by
WFD WINEP and would
not be a favoured site.
Adopted WRMP does not
take into consideration
the planned increase in
demand. Additional
water resources may be
required.
———————————————————————————————————————————— 69 SES Water. April 2019. Revised Draft Water Resources Management Plan 2019 – Main Report.
70 Southern Water. Water Resource Management Plan 2020: Technical Overview
71 South East Water. Water Resources Management Plan 2020 to 2080
72 2014-Based Household Projections for England, Office for National Statistics (2018). Accessed online at: https://www.ons.gov.uk/peoplepopulationandcommunity/populationandmigration/populationprojections/datasets/householdprojections
forengland on: 31/10/2018

Gatwick sub-region Water Cycle Study 75
Figure 4.11: Water Resource Zones within the Gatwick Sub-Region

Gatwick sub-region Water Cycle Study 76
4.5 Water Resource Management Plan Reviews
SES Water
SES Water (SESW) is responsible for supplying Reigate and Banstead and the northern
portion of Crawley, including Gatwick Airport. For the purposes of water resource
planning, the SESW supply area has been divided into 2 Water Resource Zones (WRZ).
The Gatwick Sub-Region is covered by both the northern Sutton WRZ and the southern
East Surrey WRZ.
Currently, SESW supply 707,000 consumers in over 286,000 properties. At present,
85% of the water supplied is being extracted from groundwater resources and 15% from
Bough Beech Reservoir, supplied by a pumped river abstraction from the River Eden in
Kent.
The Revised Draft WRMP73 covers a plan period of 60 years, 2020 to 2080.
Change in Demand
The total number of households is expected to increase from 263,000 to 447,000, a 64%
increase over the 60-year plan period. The population is expected to increase by 41%
to just under one million by 2079/80. There is a decline in forecast occupancy rates
from 2.59 to 2.23 over the plan period.
As with the other water companies, SESW have forecast household consumption using
micro-component analysis and metering segmentation. Metering is forecast to increase
to 70% by 2025 and 93% by 2080 under baseline conditions. Normal year per capita
consumption (PCC) declines from 147.6 litres per person per day in the base year to
135.8 litres per person per day, whereas dry year PCC starts at 159.8 in the base year
and drops to 144.9 by 2080.
Non-household demand is largely stable and is forecast to maintain at current levels.
Dry year demand (in millions of litres per day (Ml/d)) within the SESW supply area from
each component is summarised in Table 4.4.
Table 4.4: Baseline Demand Forecast (Dry Year Annual Average)
Component Demand at 2020/21
(Ml/d)
Demand at 2079/80
(Ml/d)
Household demand 109.99 154.24
Non-household demand 27.63 27.94
Distribution Losses 15.82 13.55
Water Taken Unbilled 1.74 1.74
Distribution System
Operational Use 2.64 2.64
TOTAL 166.00 200.24
Supply-Demand Balance
This section of the WRMP compares the supply and demand forecasts, including
headroom, to determine whether resources are projected to be in surplus or deficit at
any point in the planning period.
There is a forecast surplus until 2048/49 and after this point there is a deficit. By the
end of the plan period, there is a projected deficit of 22.7 Ml/d.
———————————————————————————————————————————— 73 SES Water. April 2019. Revised Draft Water Resources Management Plan 2019 – Main Report.

Gatwick sub-region Water Cycle Study 77
Options
SESW has considered options that could resolve the supply-demand deficit. These
options explore enhancing supplies or reducing demand separately.
Supply-Side Options:
• Abstraction at new or existing sites, and those where new or additional treatment
would result in an increase in yield
• Water treatment options
• Pipeline transfer and bulk supplies
Demand-Side Options:
• Leakage management and reduction
• Improved household and non-household water efficiency
• Tariffs for sprinkler use or increasing volumetric charges
• Metering and smart metering
• Rainwater harvesting or greywater recycling.
A preferred programme of fourteen demand and supply options, plus a strategic transfer
to South East Water, was taken forward for public consultation.
SESW model outputs show that the identified demand management measures are
sufficient to solve the deficit in the baseline supply-demand. The plan, at a cost of
£170.2M, results in a surplus of over 7 Ml/d under average conditions by 2080.
Southern Water
Southern Water is responsible for supplying the entirety of Horsham and most of
Crawley. A small portion of southern Mid Sussex is also supplied by Southern Water.
For the purposes of water resource planning, the Southern Water supply area is divided
into fourteen WRZs. These fourteen WRZs have been amalgamated into three larger
sub-regional supply areas.
The Gatwick Sub-Region is covered by the Sussex North WRZ and Sussex Brighton WRZ,
two of three WRZs forming the Central supply area.
The Southern Water WRMP74 identifies strategies to water supply and demand over the
plan period 2020 to 2070. In the Central supply area, the next 10-15 years is dominated
with potential future uncertain sustainability reductions.
Southern Water is mainly dependant on groundwater sources in the chalk aquifer, and
this makes up 70% of the total water supply. River abstraction accounts for 23% of
water supply. Four surface water impounding reservoirs provide the remaining 7% water
supply in the Southern Water supply area.
Change in Demand
Southern Water have found that total household demand is forecast to increase from
305.3 Ml/d at present to 352.2Ml/d by 2069-70, an increase of 16% over the plan period.
Total non-household demand is forecast to increase by 10% from 116.4 Ml/d at present
to 127.7Ml/d by 2069-70.
Supply-Demand Balance
Southern Water anticipate that in the Central Area, the supply demand balance would
move into deficit early in the planning period, with a further decrease anticipated as a
result of potential sustainability reductions in 2027-28. Sustainability reductions are
reductions in the amount of water abstracted in order to ensure continued sustainability
———————————————————————————————————————————— 74 Southern Water. Water Resource Management Plan 2019: Technical Overview

Gatwick sub-region Water Cycle Study 78
of a water resource. For example, a reduction in river abstraction may be required in
order for a river to meet its WFD targets.
Options
Southern Water have assessed a range of options to both increase water supply and
reduce water demand.
• The following schemes are included within the strategy for the Central supply
area:
o Extend universal metering programme and enhance meter reading
frequency.
o Encourage the more efficient use of water
o Increased leakage reduction activity
o An indirect water reuse scheme from Littlehampton WwTW
o A desalination scheme on the tidal River Arun
o A coastal desalination scheme at Shoreham
o An indirect water reuse scheme from Brighton WwTW, working jointly with
South East Water
o An aquifer storage and recovery scheme north of Worthing
o Rehabilitation and enhancement of three existing sources in Sussex North
o Implement planned infrastructure development to allow the existing
Sussex Worthing to Sussex Brighton main to be enhanced.
o Catchment management and infrastructure solutions to reduce nitrates
and pesticides and increase resilience
The timing of these schemes can be found within the Technical Overview of Southern
Water’s WRMP.
Target 100
Southern Water have committed in their WRMP to water efficiency policy that aims to
achieve a per capita consumption (PCC) of 100 l/p/d by 2040. This consists of four key
strands:
• Installation of smart metering technology
• Home audits
• Proactive customer contact – this includes a system to engage with customers
where significant increases in consumption are identified
• Incentivising water efficiency behaviour
South East Water
South East Water (SEW) is responsible for supplying the majority of Mid Sussex and the
south eastern boundary of Crawley. For the purposes of water resource planning, the
South East Water supply area is divided into eight Water Resource Zones. The Gatwick
Sub-Region study area is covered by the Haywards Heath WRZ.
The SEW WRMP75 states that 73% of the supply comes from groundwater sources from
more than 250 boreholes and wells, 19% is from surface water abstractions, including
six river intakes, three surface water reservoirs and 8% from neighbouring water
companies.
In the Haywards Heath WRZ, 55% is supplied by two surface water sources and 38% of
water is supplied by fourteen groundwater sources from the Ashdown Beds and chalk
———————————————————————————————————————————— 75 South East Water. Water Resources Management Plan 2020 to 2080

Gatwick sub-region Water Cycle Study 79
aquifers. The remaining 7% is supplied by inter-company transfer from Southern Water,
with this contract due to be next reviewed in 2021.
Change in Demand
Across the entirety of the supply area, a deficit is reached at 2044/45 for both dry year
annual average and summer peak period. The supply demand balance is shown in Table
4.5.
Table 4.5: South East Water Forecast Demand Increase
Dry Year Annual Average (Ml/d) Summer Peak Period (Ml/d)
2019/2
0
2024/2
5
2044/4
5
2079/8
0
2019/2
0
2024/2
5
2044/4
5
2079/8
0
Supply forecast
635.6 616.4 559.2 556.0 763.3 740.7 683.1 679.4
Demand forecast
524.2 534.0 572.6 672.4 644.5 658.6 714.7 859.8
Target headroom
34.3 42.4 63.8 79.4 36.0 44.5 69.5 87.2
Demand + target
headroom
558.5 576.4 636.4 751.8 680.5 703.1 784.2 947.0
Supply demand
balance
77.1 40.0 -77.2 -195.8 82.8 37.6 -101.1 -267.6
Options
South East Water has defined a preferred plan to address the future deficit of water
supply. This plan includes:
• Adopting a mix of demand management and supply side options
• Addressing deficits in both dry year annual average and summer peak period for
all WRZs across the plan period
Within the Haywards Heath WRZ, the preferred plan is detailed in Table 4.6.
Table 4.6: South East Water – Haywards Heath WRZ Preferred Plan
Water Resource Zone
Year Preferred Plan
Haywards Heath
WRZ2
2020-2025 Reduced leakage
Water efficiency
2025-2045
Increased connectivity between WRZ2 and WRZ7 (Cranbrook)
Water re-use to the River Ouse
Improved connectivity within the zone
2045-2080
Internal transfer from WRZ3 to WRZ2
Integrated use of surface and groundwater near the
River Ouse
Goose Green Reservoir

Gatwick sub-region Water Cycle Study 80
Household Growth – Water Supply Boundaries
The MHCLG Household Projections (2014) is used throughout this section and defines a
“household” as “one person living alone, or a group of people (not necessarily related)
living at the same address with common housekeeping – that is, sharing a living room
or sitting room or at least 1 meal a day”. For purpose of this WCS one dwelling equals
one household.
SES Water
Table 4.7 shows the household growth forecasts for the SES Water supply area, using
the Ministry of Housing Communities and Local Government (MHCLG) 2014-based
household projections. The MHCLG 2014-based forecast show an 18.6% increase in the
number of households across the entirety of the SES water supply area.
Table 4.7: MHCLG 2014-Based Household Growth - SES Water
Forecast 2020 2035 % Increase
MHCLG 2014-based forecast – SES WRZ
309,950 367,704 18.6%
Table 4.8 shows the household growth forecast for the SES Water supply area, using
WRMP Water Resources Market Information76. This information has not been split
between the two WRZs and has been assessed for the entire supply area. The data
tables are based on the revised draft Water Resource Management Plan 2019. The Water
Resources Market Information forecasts a 16% increase in the number of households
across the two WRZs between 2020 and 2035.
Table 4.8: Water Resources Market Information - Household Growth – SES
Water
Forecast 2020 2035 % Increase
WRMP Water Resources Market Information – Sutton WRZ and East Surrey WRZ
299,154 347,810 16.3%
Southern Water
Table 4.9 shows the household growth forecasts for the two Southern Water WRZs within
the study area, using the Ministry of Housing Communities and Local Government
(MHCLG) 2014-based household projections. The MHCLG 2014-based projections
forecast a 15.6% increase in the number of households in the Sussex North WRZ and a
14.4% increase in the Sussex Brighton WRZ between 2020 and 2035.
Table 4.10 shows the household growth forecasts for the Southern Water WRZ within
the study area, using WRMP Water Resources Market Information77. The Water
Resources Market Information forecasts an 11.3% increase in the number of households
in the Sussex North WRZ and a 10.1% increase in the Sussex Brighton WRZ.
Table 4.9: MHCLG 2014-Based Household Growth - Southern Water
Forecast 2020 2035 % Increase
MHCLG 2014-based forecast – All LPAs in Sussex North WRZ
118,498 137,032 15.6%
———————————————————————————————————————————— 76 SES Water. Water Resources Market Information. https://www.waterplc.com/mobile/default.asp?pageid=912 77 Southern Water. Water Resources Market Information. https://www.southernwater.co.uk/our-story/water-resources-planning/water-
resources-management-plan-2020-70

Gatwick sub-region Water Cycle Study 81
Forecast 2020 2035 % Increase
MHCLG 2014-based forecast – All LPAs in Sussex Brighton WRZ
162,832 186,257 14.4%
Table 4.10: Water Resources Market Information - Household Growth -
Southern Water
Forecast 2020 2035 % Increase
WRMP Water Resources
Market Information –
Sussex North WRZ
119,230 132,652 11.3%
WRMP Water Resources Market Information –
Sussex Brighton WRZ
169,163 186,300 10.1%

Gatwick sub-region Water Cycle Study 82
South East Water
Table 4.11 shows the household growth forecast for the Haywards Heath WRZ, using the
Ministry of Housing Communities and Local Government (MHCLG) 2014-based household
projections. The MHCLG 2014-based projections forecast a 17.1% increase in the
number of households in the Haywards Heath WRZ from 2020 to 2035.
Table 4.12 shows the household growth forecast for the Haywards Heath WRZ, using
WRMP Water Resources Market Information78. The Water Resources Market Information
forecasts an 15.2% increase in the number of households in the Haywards Heath WRZ.
Table 4.11: MHCLG 2014-Based Household Growth - South East Water
Forecast 2020 2035 % Increase
MHCLG 2014-based forecast – All LPAs in Haywards Heath WRZ
135,358 158,522 17.1%
Table 4.12: Water Resources Market Information - Household Growth in the
South East Water Haywards Heath WRZ
Forecast 2020 2035 % Increase
WRMP Water Resources Market Information – Haywards Heath WRZ
138,942 160,033 15.2%
Household Growth – Local Authority Boundaries
Horsham District Council – Planned Growth
The Draft Local Plan states that the minimum local housing need is 965 dwellings per
annum across the 2019 to 2036 plan period, 17,370 dwellings in total79.
Table 4.13 uses the MHCLG 2014-Based 2019 housing forecast as a baseline and shows
the impact of the proposed growth over the plan period. The forecast percentage
increase in dwellings by 2036 is 29%.
Table 4.14 shows the MHCLG 2014-Based housing forecasts for 2019 and 2036. This
forecasts a 16% increase in dwellings across the plan period, less than the growth
proposed by the Horsham Draft Local Plan.
Horsham is likely to accommodate part of Crawley’s unmet need. For the purpose of this
study, Crawley’s unmet need of 5,925 has been divided between Mid Sussex (1,498
houses) and Horsham (4,427 houses).
Table 4.13: Horsham Housing Provision Forecast – Local Plan
MHCLG 2014-Based Household Forecast
2019
Horsham Local Plan
Housing Need
2019 - 2036
2036 Forecast Household Number
Forecast % Increase
59,734 15,440
+ 4,427
79,601
33%
———————————————————————————————————————————— 78 Southern Water. Water Resources Market Information. https://www.southernwater.co.uk/our-story/water-resources-planning/water-resources-management-plan-2020-70 79 Horsham District Council. The Horsham District Local Plan 2019-2036.

Gatwick sub-region Water Cycle Study 83
Table 4.14: Horsham Housing Provision Forecast – MHCLG 2014-Based
MHCLG 2014-Based Household Forecast
2019
MHCLG 2014-Based
Forecast Growth
MHCLG 2014-Based Household Forecast
2036
Forecast % Increase
59,734 9,839 69,573 16%
Using the water resources market information published by SW, it can be seen that over
the period covered by Horsham’s Local Plan, the Southern Water’s Sussex North WRZ is
predicted to experience 12% overall growth in households, considerably less than the
predicted increase in growth in Horsham District using either the Local Plan or MHCLG
forecasts.
Crawley Borough Council – Planned Growth
Crawley Borough Council is in the process of reviewing and updating its local plan to
cover the plan period 2020 to 2035. The Northern West Sussex Strategic Housing Market
Assessment80, states the minimum local housing need of 15,040 dwellings over the
period of 2019 to 2039. Taken over the 15 year Local Plan period 2020-2035, this
equates to a total need of 11,280 new homes, or 752 dwellings per annum.
The Local Plan makes provision for the ‘supply-led’ development of a minimum of 5,355
dwelling across the plan period resulting in an unmet housing need of approximately
5,925 dwellings, arising from Crawley over the Plan Period. This has been accounted for
within the equivalent assessment for Horsham and Mid Sussex. Table 4.15 uses the
MHCLG 2014-Based 2020 household forecast as a baseline and shows the impact of the
Local Plan proposed growth over the plan period. In Crawley, the forecast percentage
increase in dwellings is 24%.
Table 4.16 shows the MHCLG 2014-Based housing forecasts for 2020 and 2035. This
forecasts a 18% increase in dwellings across the plan period, more than the ‘supply-led’
growth that can be accommodated within Crawley as proposed by the Crawley Draft
Local Plan.
Table 4.15: Crawley Housing Provision Forecast – Local Plan
MHCLG 2014-Based Household Forecast
2020
Crawley Local Plan ‘Supply-led’ Housing
Need 2020 - 2035
2035 Forecast Household Number
Forecast % Increase
47,944 5,355 53,299 11%
Table 4.16: Crawley Housing Provision Forecast – MHCLG 2014-Based
MHCLG 2014-Based Household Forecast
2020
MHCLG 2014-Based
Forecast Growth
MHCLG 2014-Based Household Forecast
2035
Forecast % Increase
47,944 8,470 56,414 18%
Using the water resources market information published by SESW and SW, it is can be
seen that household numbers in the Sutton and East Surrey WRZ and Sussex – North
WRZ which cover the south and north of Crawley respectively are predicted to grow by
———————————————————————————————————————————— 80 Iceni. November 2019. Northern West Sussex Strategic Housing Market Assessment – Final Report

Gatwick sub-region Water Cycle Study 84
15% and 10% over Crawley’s Local Plan period. This is broadly in line with the
percentage growth predicted in Crawley in their Local Plan, but less than the MHCLG
projections, as their unmet need is being accommodated elsewhere.
Reigate and Banstead Borough Council – Planned Growth
Reigate and Banstead Borough Council adopted its Core Strategy on 3 July 2014. On 2
July 201981, the Council adopted a review of all of the 2014 Core Strategy policies, which
concluded that the Core Strategy remains up to date, and that none of its policies
currently need modifying or updating. The Development Management Plan adopted in
2019 allocates specific development sites to deliver the spatial strategy and housing
numbers established in the Core Strategy to 2027.
The Reigate and Banstead housing delivery policy states that at least 6,900 homes are
required between 2012 and 2027, equating to an average annual provision of 460
dwellings per annum.
Table 4.17 uses the MHCLG 2014 based household forecasts and shows the impact of
the proposed growth over the plan period. The forecast percentage increase in dwellings
in 2027 is 12%.
Table 4.18 shows the MHCLG 2014-Based housing forecasts for 2012 and 2027. This
shows a 22% increase in dwellings across the plan period, greater than the growth
proposed by the Adopted Core Strategy.
Table 4.17: Reigate and Banstead Housing Provision Forecast – Local Plan
MHCLG 2014-Based
Household Forecast
2012
Core Strategy Housing
Requirement
2012 - 2027
2027 Forecast Household Number
Forecast % Increase
56,304 6,900 63,204 12%
Table 4.18: Reigate and Banstead Housing Provision Forecast – MHCLG 2014-
Based
MHCLG 2014-Based Household Forecast
2012
MHCLG 2014-Based
Forecast Growth
MHCLG 2014-Based Household Forecast
2027
Forecast % Increase
56,304 12,412 68,716 22%
RBBC is within SESW’s Sutton and East Surrey’s WRZ, and using the published water
resource market information, it can be seen that a 7% increase in the number of
households is expected over the remaining RBBC plan period, less than the percentage
growth predicted by RBBC’s Local Plan or by the MHCLG forecasts.
Mid Sussex District Council – Planned Growth
Mid Sussex adopted the Mid Sussex District Plan in March 201882, covering the plan
period 2014-2031. The District Plan sets a minimum housing provision of 16,390
dwelling across the plan period 2014 – 2031 to meet the OAN as well as contributing
towards the unmet need of neighbouring authorities, primarily the unmet need arising
in the Northern West Sussex Housing Market Area from Crawley:
• 2014/15 to 2023/24: 876 dwellings per annum
• 2024/25 to 2030/31: 1,090 dwellings per annum
———————————————————————————————————————————— 81 Reigate and Banstead Borough Council. June 2019. Review of the Reigate & Banstead Local Plan: Core Strategy 82 Mid Sussex District Council. March 2018. Mid Sussex District Plan 2014 – 2031

Gatwick sub-region Water Cycle Study 85
Table 4.19 uses the MHCLG 2014 based household forecast as a baseline and shows the
impact of the proposed growth over the plan period. The forecast percentage increase
in dwellings across the plan period is 12%.
Table 4.20 shows the MHCLG 2014-Based housing forecasts for 2014 and 2013. This
shows a 20% increase in the number of dwellings across the plan period, less than the
growth proposed by the District Plan. The adopted District Plan housing requirement is
greater than the Objectively Assessed Need (OAN – based on MHCLG projections) as Mid
Sussex are accommodating an element of unmet housing need (1,498 houses) from
Crawley.
Table 4.19: Mid Sussex Housing Provision Forecast – Local Plan
MHCLG 2014-Based Household Forecast
2014
Mid Sussex District Plan Housing Need
2014 - 2031
2031 Forecast Household Number
Forecast % Increase
59,737 16,390 76,127 27%
Table 4.20: Mid Sussex Housing Provision Forecast – MHCLG 2014-Based
MHCLG 2014-Based Household Forecast
2014
MHCLG 2014-Based
Forecast Growth
MHCLG 2014-Based Household Forecast
2031
Forecast % Increase
59,737 12,139 71,876 20%
Mid Sussex is within SEW’s Haywards Heath WRZ, and using the published water
resource market information, an 11% increase in households is predicted for the
remaining Mid Sussex plan period. This is significantly less than the predicted
percentage growth in the Mid Sussex local plan and in the MHCLG forecasts.
Summary
• The water supply in the Gatwick Sub-Region is managed by SES Water, Southern
Water and South East Water.
• The study area divided between five Water Resource Zones.
• In the SES supply area, assessed as one area rather than two separate WRZ, the
2035 forecast number of houses is 5.4% greater in the MHCLG 2014-based
forecast compared to the Water Resources Market Information forecast, which is
used to inform the WRMP.
• In the Southern Water Sussex North WRZ, the 2035 forecast number of houses
is 3.2% greater in the MHCLG 2014-based forecast compared to the Water
Resources Market Information forecast. In the Sussex Brighton WRZ, the
difference between the MHCLG 2014-based forecast and the Water Resources
Market Information forecast is insignificant.
• In the South East Water Haywards Heath WRZ, the 2035 forecast number of
houses is 1.0% greater in the Water Resources Market Information forecast
compared to the MHCLG 2014-based forecast.
• Predicted growth in Horsham, Mid Sussex and Reigate and Banstead is higher
than the overall percentage growth forecast in the water resource zones that
cover them. Growth in Crawley is broadly in line with SESW’s Sutton and East
Surrey WRZ and SW’s Sussex North WRZ, however their unmet need is being
accommodated outside Crawley in Horsham and Mid Sussex

Gatwick sub-region Water Cycle Study 86
4.6 SES Water Assessment
SESW were provided details of development sites within the Gatwick sub-region. They
confirmed that “whilst we could accommodate the additional demand it would impact on
our infrastructure and demand management plans, and potentially transfers with other
companies.”
The growth information collated from this water cycle study in particular for Gatwick will
be used in SESW’s non-household demand forecast for the next Water Resource
Management Plan, work on which commences in 2020 with publication in 2024.
Household forecasts from both ONS trends and Local Plans will also be used to create
this plan.
SESW confirmed there is sufficient capacity at Water Treatment Works to serve this level
of growth and additional land is not required to be safeguarded for strategic
infrastructure or large-scale transfer.
SESW are in favour of, and will be promoting the importance of, Local Authority Local
Plan developments and those commercial developments specifically associated with
Gatwick Airport to incorporate grey water recycling and/or rainwater harvesting
alongside the incorporation of water-efficient fixtures and fittings.
Growth at Gatwick Airport represents a significant additional demand on water
resources. Gatwick Airport Limited (GAL) is understood to have put on hold its work on
Development Consent Order to bring the northern standby runway into operational use
whilst there is significant uncertainty over the impact of COVID-19, with work anticipated
to reconvene in 2021. GAL are aware of the SESW position on the use of greywater
recycling and rainwater harvesting.
4.7 Southern Water Assessment
Southern Water asked for all sites within their water resource zone to be given a “green”
assessment and commented that it “has recently published its Water Resources
Management Plan for the next 50 years 2020-2070. The strategy takes account of future
growth as well as various scenarios of climate change. Our strategy for the provision of
future water resources for the Central area (which includes Sussex North) can be found
here; “
https://www.southernwater.co.uk/media/2990/wrmp19-annex10-strategy-for-the-
central-area.pdf
Concerns over abstraction at Hardham in the Sussex North water resource zone, and its
impact on the Arun Valley SPA/SAC and Pulborough Brooks SSSI have been identified.
Further discussion with Southern Water to identify the impact on additional water
resource demands with this water resource zone are required (see also section 4.3.1).
4.8 South East Water Assessment
SEW commented that there is sufficient water resource to serve all of the planned growth
in the Gatwick Sub-Region supplied by SEW, as set out in their WRMP
https://corporate.southeastwater.co.uk/news-info/publications/wrmp19-wrmp/
“This plan was developed following engagement with the local planning authorities in our
supply area and accommodates all planned growth. It also incorporates an addition
‘headroom’ capacity to enable us to provide water if growth is greater than predicted.
Our resources tables for water resource zone 2 – (Haywards Heath) contains the area of
Mid Sussex and shows a positive Supply Demand Balance for the forecasted period based
on our preferred options. You can see in both Dry Year Annual Average and Critical
Period tables on Table 9.“
“Our WRMP takes account of water treatment work capacity along with a whole host of
other considerations such as network constraints, climate change, the amount of water
we can transfer between our water resources zones and from other water companies,
uncertainty, environmental constraints, and population growth.”

Gatwick sub-region Water Cycle Study 87
“We currently have no options within our preferred plan that requires any land to be
safeguarded for strategic infrastructure.”
4.9 Water Efficiency and Water Neutrality
Introduction
The Gatwick Sub-Region has been identified as an area of serious water stress, and there
are actions under the Water Industry National Environment Programme (WINEP)83 to
investigate sustainability of water resources within the study area and assess
groundwater abstraction.
It is widely recognised that the climate is changing, and Crawley Council are one of many
in the country to declare a climate emergency. Climate change is predicted to increase
pressure on water resources, increasing the potential for a supply-demand deficit in the
future, and making environmental damage from over abstraction of water resources
more likely. Furthermore, the delivery of water and wastewater services and the heating
of water in the home require high energy inputs, and therefore contribute directly to
emissions of greenhouse gases. Water efficiency therefore reduces energy use and
carbon emissions.
It is important that new development does not cause an unsustainable increase in water
abstraction. This can be done in a number of ways from reducing the water demand
from new houses through to achieving “water neutrality” in a region by offsetting a new
development’s water demand by improving efficiency in existing buildings.
Required evidence
It is for Local Authorities to establish a clear need to adopt the tighter water efficiency
target through the building regulations. This should be based on:
• Existing sources of evidence such as:
o The Environment Agency classification of water stress
o Water resource management plans produced by water companies
o River Basin Management Plans which describe the river basin district and
the pressure that the water environment faces. These include information
on where water resources are contributing to a water body being classified
as ‘at risk’ or ‘probably at risk’ of failing to achieve good ecological status,
due to low flows or reduced water availability.
• Consultations with the local water and sewerage company, the Environment
Agency and catchment partnerships
• Consideration of the impact on viability and housing supply of such a requirement
Water Stress
Water stress is a measure of the level of demand for water (from domestic, business
and agricultural users) compared to the available freshwater resources, whether surface
or groundwater. Water stress causes deterioration of the water environment in both the
quality and quantity of water, and consequently restricts the ability of a waterbody to
achieve a “Good” status under the WFD.
The Environment Agency has undertaken an assessment of water stress across the UK.
This defines a water stressed area as where:
• “The current household demand for water is a high proportion of the current
effective rainfall which is available to meet that demand; or
———————————————————————————————————————————— 83 WINEP sets out the actions that water companies will need to complete to meet their environmental obligations.

Gatwick sub-region Water Cycle Study 88
• The future household demand for water is likely to be a high proportion of the
effective rainfall available to meet that demand.
In the 2013 Environment Agency and Natural Resources Wales water stress
assessment84, the supply regions serving the Gatwick Sub-Region are classified as
follows in terms of final stress:
• SES Water – Serious Stress
• Southern Water - Serious Stress
• South East Water - Serious Stress
• Thames Water - Serious Stress
River Basin Management Plans
One of the challenges identified in both the Thames RBMP and the South East RBMP is
“changes to natural flow and levels of water”. The management recommendations from
both RBMP are listed below:
• All sectors take up or encourage water efficiency measures, including water
industry work on metering, leakage, audits, providing water efficient products,
promoting water efficiency and education.
• Local Government sets out local plan policies requiring new homes to meet the
tighter water efficiency standard of 110 litres per person per day as described in
Part G of Schedule 1 to the Building Regulations 2010.
• Industry manufacturing and other business implement tighter levels of water
efficiency, as proposed by changes to the Building Regulations.
• Agriculture and rural land management manage demand for water and use water
more efficiently to have a sustainable water supply for the future.
• Local government commissions water cycle studies to inform spatial planning
decisions around local water resources.
The RBMP goes on to state that “dealing with unsustainable abstraction and
implementing water efficiency measures is essential to prepare and be able to adapt to
climate change and increased water demand in the future.”
National Water Resources Framework
A new National Framework for Water Resources was published by the Government in
March 2020. This outlines the water resources challenges facing England and sets out
the strategic direction for the work being carried out by regional water resource groups.
A range of options were explored, and the most ambitious scenarios rely on policy change
to introduce mandatory labelling of water using fittings and associated standards. The
Government is currently reviewing policy on water efficiency following a recent
consultation. The framework proposes that regional groups plan to help customers
reduce their water use to around 110 l/p/d. This is achievable without policy
interventions.
This aligns with the tighter standard of 110 l/p/d per day as described in building
regulations. An adopted water efficiency target higher than 110 l/p/d would make the
overall target for the UK harder to achieve and considering the difficulty of retro-fitting
existing properties to reduce water demand, new build properties may need to be more
efficient than 110l/p/d in order to achieve this.
———————————————————————————————————————————— 84 Environment Agency. July 2013. Water Stressed Areas - Final Classification. Developed by the Environment Agency and Natural
Resources Wales

Gatwick sub-region Water Cycle Study 89
Impact on viability
As outlined in section 3.2.4 the cost of installing water-efficient fittings to target a per
capita consumption of 110l/d has been estimated as a one-off cost of £9 for a four-
bedroom house. Research undertaken for the devolved Scottish and Welsh governments
indicated potential annual savings on water and energy bills for householders of £24-
£64 per year as a result of such water efficiency measures85 . Water efficiency is
therefore not only viable but of positive economic benefit to both private homeowners
and tenants.
Target 100
The South East of England is under severe water stress and there is clear evidence for
the adoption of the tighter water efficiency target of 110l/p/d allowed for under Building
Regulations as a minimum for development sites in the Gatwick sub-region. However,
the Building Regulations were last updated some time ago, and are designed to apply
nationally. They do not take into account the situation in the South East, and the need
to adapt to climate change.
Southern Water have committed in their Water Resource Management Plan to a water
efficiency policy that aims to achieve a per capita consumption (PCC) of 100 l/p/d by
2040. SW have therefore advised the Councils that a target of 100 l/p/d should be
adopted in policy for new build properties, and 80l/p/d for strategic developments where
master planning and community level schemes can provide greater saving.
South East Water and SES Water have confirmed that they also support this approach.
The Environment Agency have commented that “We support the recommendation that
LPAs go beyond the 110l/p/d and welcome the higher ambition of Southern Water to
reduce consumption to an average of 100 litres per person per day which reflects both
the overall water stress in the area and the specific supply-demand challenges in some
locations. We also support consideration of water neutrality, a concept that whilst not
entirely new, has not been fully explored.”
Water Neutrality Concept
Water neutrality is a relatively new concept for managing water resources, but one that
is receiving increased interest as deficits in future water supply/demand are identified.
The definition adopted by the Government and the Environment Agency86 is:
It is useful to also refer to the refined definition developed by Ashton:
“For every new significant development, the predicted increase in total water demand in
the region due to the development should be offset by reducing demand in the existing
community, where practical to do so, and these water savings must be sustained over
time” (V Ashton, 2014)87
This definition states the need to sustain water saving measures over time, and the
wording “predicted increase in total water demand” reflects the need for water neutrality
to be designed in at the planning stage.
Both definitions refer to water use in the region or “wider area”, and the extent of this
area should be appropriate to Local Authority boundaries, Water Resource Zones, or
water abstraction boundaries depending on what is appropriate for that particular
location. For instance, if a development site is in an area of water stress relating to a
———————————————————————————————————————————— 85 Waterwise (2018) Advice on water efficient new homes in England. Accessed online at: https://waterwise.org.uk/wp-
content/uploads/2019/10/Advice-on-water-efficient-homes-for-England061118.pdf on: 06/04/2020 86 Water Neutrality: An improved and expanded water resources management definition (SC080033/SR1), Environment Agency, 2009.
87 Water Resources in the Built Environment, edited by Booth and Charlesworth (2014). Published by Wiley.
“For every development, total water use in the wider area after the
development must be equal to or less than total water use in the wider
area before development”.

Gatwick sub-region Water Cycle Study 90
particular abstraction source, offsetting water use in a neighbouring town that is served
by a different water source will not help to achieve water neutrality.
In essence, water neutrality is about accommodating growth in a region without
increasing overall water demand.
Water neutrality can be achieved in a number of ways:
• Reducing leakage from the water supply networks
• Making new developments more water-efficient
• “Offsetting” new demand by retrofitting homes with water-efficient devices
• Encouraging existing commercial premises to use less water
• Implementing metering and tariffs to encourage the wise use of water
• Education and awareness-raising amongst individuals
Suggestions for water-efficiency measures are listed in Figure 4.12 below.
Both the Environment Agency and Natural England welcome this concept, and NE advise
that “this is the only way for Sussex North that housing can be delivered – as the existing
abstraction cannot conclude no AEOI (Adverse Effect on Integrity) on Arun Valley. NE
welcome this concept and encourage the LPAs to embed this in the Local Plan”.

Gatwick sub-region Water Cycle Study 91
Consumer Water Efficiency Measures
Figure 4.12: Consumer Water-Efficiency Measures
Education and promotional
campaigns
• Encourage community establishments (e.g. schools, hospitals) to carry out self audits on their water use
• Deliver water conservation message to schools and provide visual material for schools
Water-efficient measures for
toilets
• Cistern displacement devices to reduce volume of water in cistern
• Retro-fit or replacement dual flush devices
• Retro-fit interuptable flush devices
• Replacement low-flush toilets
Water-efficient measures for taps
• Tap inserts, such as aerators
• Low flow restrictors
• Push taps
• Infrared taps
Water-efficient measures for
showers and baths
• Low-flow shower heads
• Aerated shower heads
• Low-flow restrictors
• Shower timers
• Reduced volume baths (e.g. 60 litres)
• Bath measures
Rainwater harvesting and
water reuse
• Large-scale rainwater harvesting
• Small-scale rainwater harvesting with water butt
• Grey water recycling
Water-efficient measures
addressing outdoor use
• Hosepipe flow restrictors
• Hosepipe siphons
• Hose guns (trigger hoses)
• Drip irrigation systems
• Mulches and composting

Gatwick sub-region Water Cycle Study 92
Source: Adapted from Booth and Charleswell (2014)
Many interventions are designed to reduce water use if operated in a particular way, and
so rely on the user being aware and engaged with their water use. The educational
aspect is therefore important to ensure that homeowners are aware of their role in
improving water efficiency.
Commercial properties
• Commercial water audits
• Rainwater recycling
• Grey water recycling
• Optimising processes
• Provide water efficiency information to all newly metered businesses
Metering
• Promote water companies free meter option
• Compulsory metering (in water stressed areas)
• Smart metering (to engage customer with their consumption)
• Provide interactive websites that allow customers to estimate the savings associated with metering (environmental and financial).
• Innovative tarrifs (seasonal, peak, rising block).
• Customer supply pipe leakage - supply pope repair and replacement
Other
• Household water audits, including DIY or with help of plumber
• Seek-and-fix internal leaks and/or dripping taps.
• Water efficient white goods, included washing achines and dishwashers
• Ask customers to spot and report leaks

Gatwick sub-region Water Cycle Study 93
Rainwater and Greywater Recycling
Rainwater Harvesting
Rainwater recycling or rainwater harvesting (RwH) is the capture of water falling on
buildings, roads or pathways that would normally be drained via a surface water sewer,
infiltrate into the ground or evaporate. In the UK this water cannot currently be used as
a drinking water supply as there are strict guidelines on potable water, but it can be
used in other systems within domestic or commercial premises.
Systems for collection of rainwater can be simple water butts attached to a drainpipe on
a house, or it could be a complex underground storage system, with pumps to supply
water for use in toilet flushing and washing machines. By utilising rainwater in this way
there is a reduced dependence on mains water supply for a large proportion of the water
use in a domestic property.
Greywater Harvesting
Greywater refers to water that has been “used” in the home in appliances such as
washing machines, showers and hand basins. Greywater recycling or greywater
harvesting (GwH) is the treatment and re-use of this water in other systems such as for
toilet flushing. By their nature, GwH systems require more treatment and are more
complex than RwH systems, and there are limited examples so far of their use in the
UK, although usage is increasing in other countries.
Greywater re-use refers to systems where wastewater is taken from source and used
without further treatment. An example of this would be water from a bath or shower
being used on plants in the garden. This sort of system is easy to install and maintain,
however as mentioned above the lack of treatment to remove organic matter means the
water cannot be stored for extended periods.
Greywater recycling refers to systems where wastewater undergoes some treatment
before it is used again. These systems are more complex and require a higher level of
maintenance than RwH or greywater re-use systems.
Benefits of Rainwater Harvesting
• RwH reduces the dependence on mains water supply – reducing bills for
homeowners and businesses
• Less water needs to be abstracted from river, lakes and groundwater
• Stormwater is stored in a RwH system reducing the peak runoff leaving a site
providing a flood risk benefit (for smaller storms)
• By reducing surface water flow, RwH can reduce the first flush effect whereby
polluted materials adhering to pavement surfaces during dry periods are
removed by the first flush of water from a storm and can cause pollution in
receiving watercourses.
Challenges of Rainwater Harvesting
• Dependency on rainfall can limit availability of harvested rainwater during
drought and hot weather events.
• Increased capital (construction) costs to build rainwater harvesting
infrastructure into new housing (£2,674 for a 3/4bed detached home)
• Payback periods are long as the cost of water is low so there is little
incentive for homeowners to invest. For further information see: https://assets.publishing.service.gov.uk/government/uploads/system/uploads/attachment_data/file/353387/021c_Cost_Report_11th_Sept_2014_FINAL.pdf

Gatwick sub-region Water Cycle Study 94
Domestic water demand can be significantly reduced by using GwH, and unlike with a
RwH system where the availability of water is dependent on the weather, the source of
water is usually constant (for instance if it is from bathing and showering).
The payback period for a GwH system is relatively long, as the initial outlay is large, and
the cost of water relatively low. This limits the viability of greywater systems for
individual domestic customers as a retro-fit option, and can make it less attractive than
RwH in a new build due to the increased maintenance cost.
However, these challenges can be overcome, and large water savings can be realised if
GwH schemes are incorporated at a communal level where costs can be shared between
multiple households. Whilst GwH systems at a communal scale can be retrofitted, they
are most cost effective when incorporated into a new housing scheme at the master-
planning stage.
Employment sites offer significant opportunities for both RwH and GwH.
SESW have recommended that new developments coming forward through the Local
Plan and those commercial developments specifically associated with Gatwick Airport
Limited’s growth plans incorporate greywater recycling and/or rainwater harvesting,
alongside the incorporation of water efficient fixtures and fittings.
Energy and Water Use
According to EU statistics (Eurostat 2017), 17% of the UK’s domestic energy usage is
for water heating. If less water was being used within the home, for instance through
more water efficient showers, less water would need to be heated, and overall domestic
energy usage would be reduced.
The Government is currently consulting on a Future Homes Standard that will involve
changes to Part L (conservation of fuel and power) of the Building Regulations for new
dwellings. Whilst there is no direct mention of water efficiency in this consultation, there
is an important link between water use and energy use, and therefore between water
use and carbon footprint.
Funding for Water Neutrality
Water neutrality is unlikely to be achieved by just one type of measure, and likewise it
is unlikely to be achieved by just one funding source. Funding mechanisms that may be
available could be divided into the following categories:
• Infrastructure-related funding (generally from developer payments)
• Fiscal incentives at a national or local level to influence buying decisions of
households and businesses
• Water company activities, either directly funded by the five-year price review or
as a consequence of competition and individual company strategies
• Joint funding through energy efficiency schemes (and possibly to integrate with
the heat and energy saving strategy).
Currently in the UK, the main funding resource for the delivery of water efficiency
measures is the water companies, with some discretionary spending by property owners
or landlords. For water neutrality to be achieved, policy shifts may be required in order
to increase investment in water efficiency. Possible measures could include:
• Further incentivisation of water companies to reduce leakage and work with
customers to reduce demand
• Require water efficient design in new development
• Developer funding to contribute towards encouraging water efficiency measures
• Require water efficient design in refurbishments, when a planning application is
made

Gatwick sub-region Water Cycle Study 95
• Tighter standards on water using fittings and appliances.
4.10 Conclusions
The Gatwick Sub-Region contains three water resource zones, all of which are classified
by the Environment Agency as being under serious water stress, justifying as a minimum
the more stringent target of 110l/p/d under building regulations. This is supported by
the River Basin Management Plans and aligns with the National Water Resources
Framework national target.
However, there is a clear requirement within the Gatwick sub-region to go further than
the optional target allowed for in Building Regulations.
Southern Water have committed to achieving a water demand of 100l/p/d day across
their supply region by 2040 and have advised the Councils to adopt this as policy for
new developments in their local plan, and to achieve 80l/p/d in strategic developments.
This approach is also supported by South East Water, SES Water, the Environment
Agency and Natural England.
Policies to reduce water demand from new developments, or to go further and achieve
water neutrality in certain areas, could be defined to reduce the potential environmental
impact of additional water abstractions in the Gatwick Sub-Region, and also help to
achieve reductions in carbon emissions
A comparison was carried out between the level of growth anticipated in each water
company’s water resource management plan, the MHCLG household projections dataset,
and the current local plan forecasts. It was found that the WRMPs were broadly in line
with MHCLG projections, but current local plan growth in Horsham, Mid Sussex and
Reigate and Banstead is higher than is accounted for in the WRMPs. This is the case
before factoring in unmet need from Crawley. Supply-led growth in Crawley is broadly
in line with the level of growth identified for the two WRZs that cover it, however unmet
need for Crawley is accommodated within Horsham and Mid Sussex.
Each local authority’s growth forecasts were shared with the water companies and asked
to comment on the availability of water resources to serve the expected level of growth.
SEW, SESW and SW responded that they have sufficient water resource to serve the
proposed level of growth. Although the predicted level of growth exceeds that accounted
for in the WRMPs, part of their analysis includes uncertainty in the forecast and
‘headroom’ is included in their supply-demand calculations. These calculations are also
reviewed on an annual basis and published as part of a WRMP every five years so there
is sufficient time to adapt to emerging population trends. However, issues have been
highlighted by the Environment Agency and Natural England on the sustainability of
abstractions at Hardham and further discussions are required in order to assess the
impact on Local Plan allocations within this water resource zone.
4.11 Recommendations
The recommendations for water resources are provided in Table 4.21 below.
Table 4.21: Recommendations for Water Resources in The Gatwick Sub-
Region
Action Responsibility Timescale
Continue to regularly review forecast and actual household growth across the supply region through WRMP Annual Update reports, and where significant change is
predicted, engage with Local Planning
Authorities.
SEW, SESW, SW Ongoing

Gatwick sub-region Water Cycle Study 96
Action Responsibility Timescale
Provide yearly profiles of projected housing growth to water companies to inform the
WRMP update. Councils Ongoing
Use planning policy to require all new
development to achieve a water efficiency of 100l/person/day in the Gatwick sub-region and 80l/p/d in strategic developments.
Councils In Local Plan Review
The concept of water neutrality has potentially a lot of benefit in terms of resilience to climate change and enabling all
waterbodies to be brought up to Good status.
Explore further with the water companies and the Environment Agency how the Council’s planning and climate change policies can encourage this approach.
Councils, EA, SEW,
SESW, SW
In Local Plan Review
and Climate Change Action Plan
Strategic residential developments, and commercial developments should consider incorporating greywater recycling and/or rainwater harvesting into development at
the master planning stage in order to reduce water demand.
Councils, SW, SESW, SEW
In Local Plan Review
Water companies should advise the Councils
of any strategic water resource
infrastructure developments within the study area, where these may require safeguarding of land to prevent other type of development occurring.
SEW, SESW, SW In Local Plan Review
Southern Water should engage with the
Councils on any requirement to phase development in the Sussex North Water Resource Zone in order to align development with infrastructure investment in response to sustainability concerns on the Hardham abstraction
SW, Councils, EA, NE In Local Plan Review
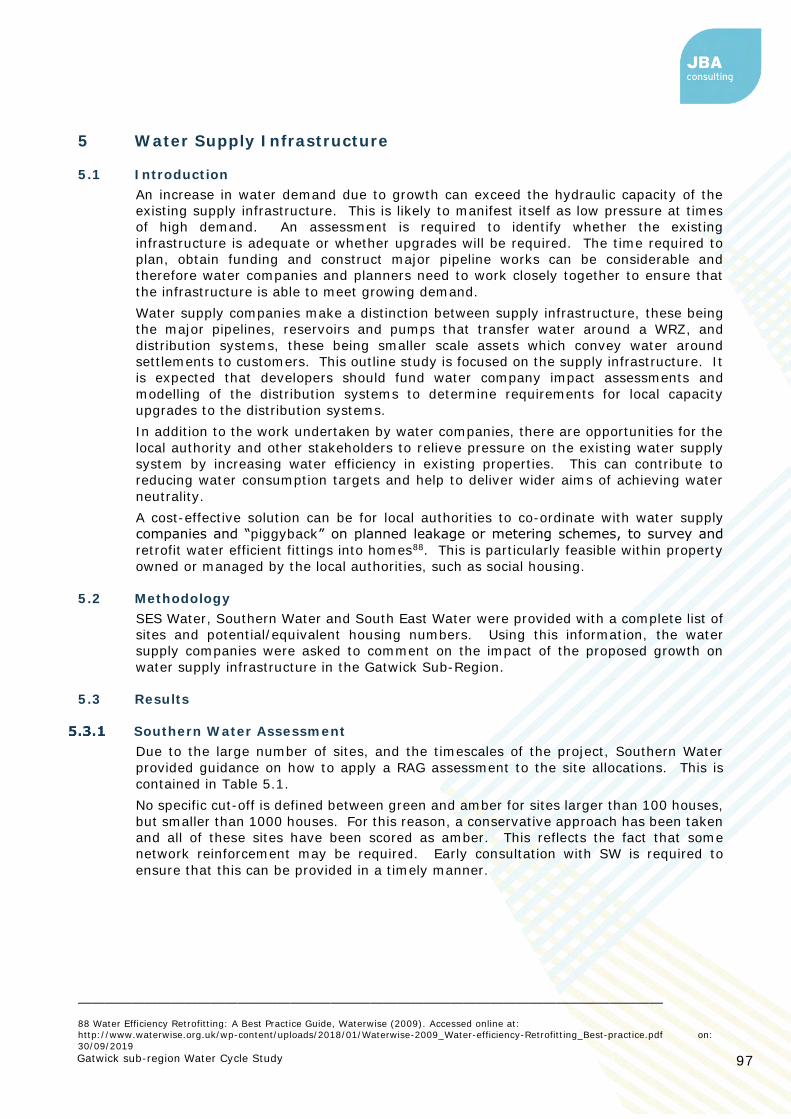
Gatwick sub-region Water Cycle Study 97
5 Water Supply Infrastructure
5.1 Introduction
An increase in water demand due to growth can exceed the hydraulic capacity of the
existing supply infrastructure. This is likely to manifest itself as low pressure at times
of high demand. An assessment is required to identify whether the existing
infrastructure is adequate or whether upgrades will be required. The time required to
plan, obtain funding and construct major pipeline works can be considerable and
therefore water companies and planners need to work closely together to ensure that
the infrastructure is able to meet growing demand.
Water supply companies make a distinction between supply infrastructure, these being
the major pipelines, reservoirs and pumps that transfer water around a WRZ, and
distribution systems, these being smaller scale assets which convey water around
settlements to customers. This outline study is focused on the supply infrastructure. It
is expected that developers should fund water company impact assessments and
modelling of the distribution systems to determine requirements for local capacity
upgrades to the distribution systems.
In addition to the work undertaken by water companies, there are opportunities for the
local authority and other stakeholders to relieve pressure on the existing water supply
system by increasing water efficiency in existing properties. This can contribute to
reducing water consumption targets and help to deliver wider aims of achieving water
neutrality.
A cost-effective solution can be for local authorities to co-ordinate with water supply
companies and “piggyback” on planned leakage or metering schemes, to survey and
retrofit water efficient fittings into homes88. This is particularly feasible within property
owned or managed by the local authorities, such as social housing.
5.2 Methodology
SES Water, Southern Water and South East Water were provided with a complete list of
sites and potential/equivalent housing numbers. Using this information, the water
supply companies were asked to comment on the impact of the proposed growth on
water supply infrastructure in the Gatwick Sub-Region.
5.3 Results
Southern Water Assessment
Due to the large number of sites, and the timescales of the project, Southern Water
provided guidance on how to apply a RAG assessment to the site allocations. This is
contained in Table 5.1.
No specific cut-off is defined between green and amber for sites larger than 100 houses,
but smaller than 1000 houses. For this reason, a conservative approach has been taken
and all of these sites have been scored as amber. This reflects the fact that some
network reinforcement may be required. Early consultation with SW is required to
ensure that this can be provided in a timely manner.
———————————————————————————————————————————— 88 Water Efficiency Retrofitting: A Best Practice Guide, Waterwise (2009). Accessed online at: http://www.waterwise.org.uk/wp-content/uploads/2018/01/Waterwise-2009_Water-efficiency-Retrofitting_Best-practice.pdf on:
30/09/2019

Gatwick sub-region Water Cycle Study 98
Table 5.1: SW Guidance for Water Supply Assessment
Size of Site SW Assessment
All sites < 100 houses
“Should largely be Green. If a large number of smaller sites come forward in close proximity to each other in
close succession, this may impact on water pressure for existing and new customers. Provided developers contact Southern Water with their proposals early in the process, this issue can be avoided before it arises by giving Southern Water time to reinforce the network ahead of development occupation.”
Sites > 100 houses
“Many at the lower end of the scale should still be Green however the higher the number of new homes proposed, the increase in likelihood that there will be an impact on the existing network, in terms of water pressure and/or
the need to provide new or improved water supply infrastructure to service new development. These larger numbers would be classified as Amber in the RAG.” SW have not “provided a specific cut off point between green and amber since this will vary dependent upon location. As above, developers should contact Southern Water
with their proposals early in the process, giving Southern Water time to reinforce the network where required.”
Sites > 1000 houses
“Will be passed to our Asset Planners for consideration
of infrastructure requirements through the Business Plan.”
SES Water Assessment
SES Water did not provide an assessment of allocated sites instead advising “this would
be addressed on a case-by-case basis as/if-and-when local plan developments take
shape. Specific mains reinforcement work may be undertaken in specific cases and
dependent on the type of developments taking place, and the standards they are
designed to.”
For the purpose of this water cycle study, and to allow a comparison to sites served by
SEW and SW, the same RAG assessment criteria used in SW’s assessment was applied
to sites served by SESW.
South East Water Assessment
SEW reviewed the sites within their supply area and their network modelling team
highlighted a number of sites where local reinforcement may be required in order to
deliver those sites. For example, if all the sites in Hassocks and in East Grinstead are
developed reinforcement will be required. In addition, due to the scale of the combined
development at Burgess Hill, SEW will be looking to lay a strategic main to the area.
They also provided the following general comment:
“We plan future water resources at a water resources zone level – this means that all
customers within a zone have the same level of water supply service and accompanying
risk level. This means that we can accommodate new properties wherever in a zone
they are developed – and will plan network improvements as required once the location
of planned developments is confirmed.”
The sites identified by the SEW modelling team as requiring reinforcement have
therefore been given an amber assessment, and all other sites have been given a green
assessment.
No sites were given a red assessment.
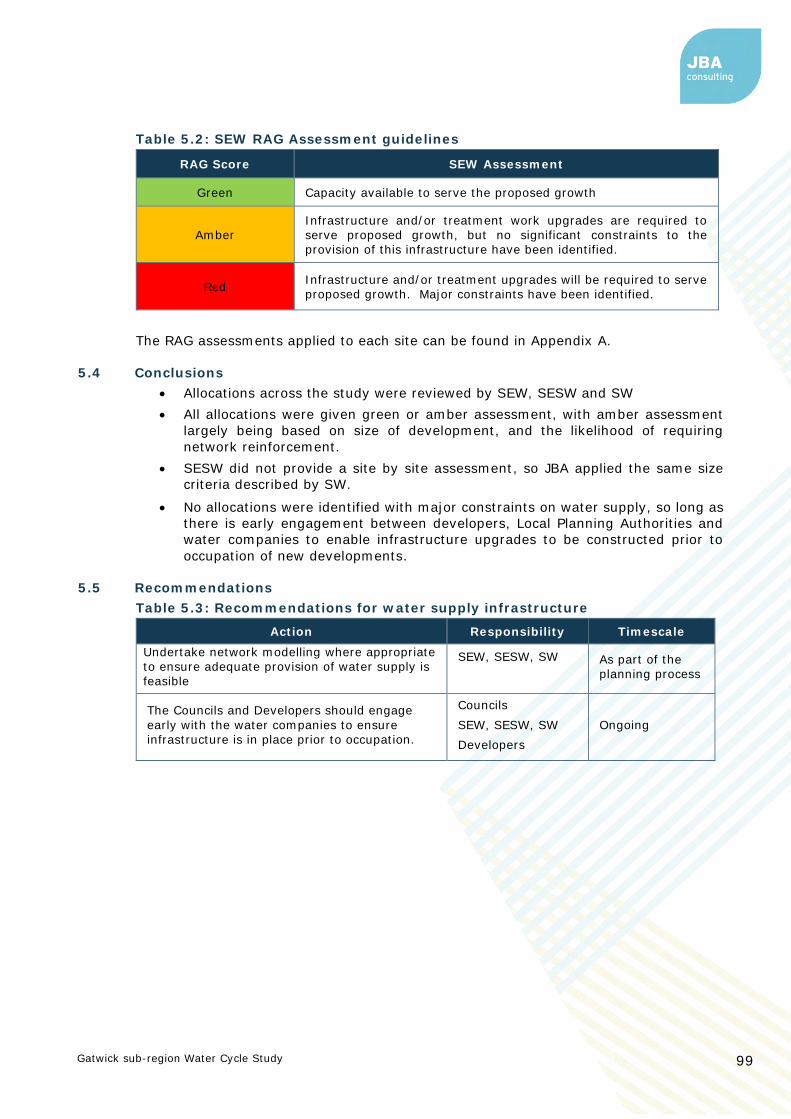
Gatwick sub-region Water Cycle Study 99
Table 5.2: SEW RAG Assessment guidelines
RAG Score SEW Assessment
Green Capacity available to serve the proposed growth
Amber Infrastructure and/or treatment work upgrades are required to serve proposed growth, but no significant constraints to the provision of this infrastructure have been identified.
Red Infrastructure and/or treatment upgrades will be required to serve proposed growth. Major constraints have been identified.
The RAG assessments applied to each site can be found in Appendix A.
5.4 Conclusions
• Allocations across the study were reviewed by SEW, SESW and SW
• All allocations were given green or amber assessment, with amber assessment
largely being based on size of development, and the likelihood of requiring
network reinforcement.
• SESW did not provide a site by site assessment, so JBA applied the same size
criteria described by SW.
• No allocations were identified with major constraints on water supply, so long as
there is early engagement between developers, Local Planning Authorities and
water companies to enable infrastructure upgrades to be constructed prior to
occupation of new developments.
5.5 Recommendations
Table 5.3: Recommendations for water supply infrastructure
Action Responsibility Timescale
Undertake network modelling where appropriate to ensure adequate provision of water supply is feasible
SEW, SESW, SW
As part of the planning process
The Councils and Developers should engage
early with the water companies to ensure infrastructure is in place prior to occupation.
Councils
SEW, SESW, SW
Developers
Ongoing

Gatwick sub-region Water Cycle Study 100
6 Wastewater Collection
6.1 Sewerage Undertakers
Southern Water and Thames Water are the Sewerage Undertakers (SU) for the majority
of the study area, with Southern Water serving Horsham, and Mid Sussex., and Thames
Water serving Crawley, Gatwick Airport and Reigate and Banstead Borough.
The role of the sewerage undertaker includes the collection and treatment of wastewater
from domestic and commercial premises, and in some areas, it also includes the drainage
of surface water from building curtilages to combined or surface water sewers. It
excludes, unless adopted by the SU, systems that do not connect directly to the
wastewater network, e.g. Sustainable Drainage Systems (SuDS) or highway drainage.
Increased wastewater flows into collection systems due to growth in populations or per-
capita consumption can lead to an overloading of the infrastructure, increasing the risk
of sewer flooding and, where present, increasing the frequency of discharges from
Combined Sewer Overflows (CSOs). Within the study area CSOs are present in most of
the major towns.
In combined sewerage systems, or foul systems with surface water misconnections
through which wastewater incorrectly end up in the surface drainage system rather than
sewers, there is potential to create headroom in the system, thus enabling additional
growth, by the removal of surface water connections. This can most readily be achieved
during the redevelopment of brownfield sites which have combined sewerage systems,
where there is potential to discharge surface waters via sustainable drainage systems
(SuDS) to groundwater, watercourses or surface water sewers. In some areas of the
Gatwick Sub-Region, there are known issues of surface water causing localised flooding.
Strategic schemes to provide improved local surface water drainage may be required in
such areas, rather than solely relying upon on-site soakaways on brownfield or infill
plots.
The Drainage Hierarchy should be used to direct surface water to natural outfall routes
such as infiltration to the ground or into watercourses, before utilising sewers, as
supported by paragraph 80 of the NPPG. Surface water should also not be permitted to
connect to a foul sewer.
6.2 Sewerage System Capacity Assessment
New residential developments and new employment land add pressure to the existing
sewerage systems. An assessment is required to identify the available capacity within
the existing systems, and the potential to upgrade overloaded systems to accommodate
future growth. The scale and cost of upgrading works may vary significantly depending
upon the location of the development in relation to the network itself and the receiving
WwTW.
It may be the case that an existing sewerage system is already working at its full capacity
and further investigations have to be carried out to define which solution is necessary to
implement an increase in its capacity. New infrastructure may be required if, for
example, a site is not served by an existing system. Such new infrastructure will
normally be secured through private third-party agreements between the developer and
utility provider.

Gatwick sub-region Water Cycle Study 101
Sewerage Undertakers must consider the growth in demand for wastewater services
when preparing their five-yearly Strategic Business Plans (SBPs) which set out
investment for the next Asset Management Plan (AMP) period. Typically, investment is
committed to provide new or upgraded sewerage capacity to support allocated growth
with a high certainty of being delivered. Additional sewerage capacity to service windfall
sites, smaller infill development or to connect a site to the sewerage network across
third party land is normally funded via developer contributions, as third-party
arrangements between the developer and utility provider.
6.3 Methodology
Southern Water and Thames Water were provided with the list of proposed allocations,
along with the anticipated capacity and trajectory of each of these sites. Using this
information, they were asked to assess each site using the range of datasets they hold.
Where appropriate the water companies also provided site specific comments.
A red RAG score given by the water companies reflects the presence of sewer flooding,
CSO spills or pollution events in the vicinity of the site, on the assumption that an
increase in wastewater flows from development would make those occurrences more
likely in the future. It also takes into account the size of the site, with larger sites more
likely to exacerbate existing issues in the network.
A red assessment does not reflect a “showstopper” and the water companies have a
statutory duty to serve new development under the Water Industry Act 1991 – but they
show where the most amount of new infrastructure or network reinforcement will be
required.
An amber assessment indicates where further modelling may be required to understand
local capacity in the network, and a green assessment indicates that no constraints have
been identified.
It should be noted that this assessment does not replace appropriate assessments or
modelling as part of developer engagement with the sewerage undertaker, evidence of
which should be demonstrated to the LPA as an application progresses through the
planning process.
6.4 Data Collection
The following datasets were used to assess the sewerage system capacity:
• Locations of preferred and strategic sites in GIS format (provided by the councils)
• Site tracker spreadsheet (see Appendix A)
• Wastewater catchments (provided by SW and TW)

Gatwick sub-region Water Cycle Study 102
6.5 Results
Foul Sewer Network Assessment
The complete list of sites with their corresponding RAG assessments can be found in
Appendix A.
Southern Water
Southern Water reviewed the sites within the area they serve. A detailed site by site
assessment was not completed, but they did provide general comments based on the
size of the site, and specific comments where known issues exist. The general comments
and assessment applied to sites is summarised in Table 6.1 below.
Table 6.1: SW RAG assessment guidance
Size of site SW Assessment
All sites < 20 houses
“Sites of 19 units or less are deemed to have negligible impact on the sewer network. No network reinforcement would be required, and the site could connect to the network. However, multiple small sites connecting to the same point in the network may necessitate network reinforcement, and this will be monitored by Southern Water.”
Sites > 20 houses <100 houses
“Will be a mix of Green and Amber and would require individual assessment. Where a site’s impact on the network is modelled and the results demonstrate a lack of capacity, Southern Water would require around 24 months to plan and implement the
requisite network reinforcements. It is therefore important that Southern Water is consulted on planning applications for major development, and developers engage early in the process.”
Sites > 100
“Will likely be mostly Amber, however again these would require individual assessment. Reinforcement of the network may take longer than 24 months in some cases and on larger sites,
therefore early engagement is encouraged.”
Sites > 1000 houses “Will be passed to our Asset Planners for consideration of infrastructure requirements through the Business Plan.”
Southern Water also provided comments specific to large sites outside of existing sewer
catchment boundaries:
“Large sites outside existing wastewater catchment boundaries (such as Mayfields and
Buck Barn) may require significant planning and investment in new sewer networks
(dependent on wastewater treatment options), and should be classified as Red. This is
not a ‘showstopper’ to the development of these sites, but a new sewer network and
associated pumping stations should be included as part of the master planning process
for these new settlements.”
Thames Water
Thames Water reviewed the development sites in their area, and as above, provided
comments on the sewer network capacity based on the size of the proposed site and its
position in the network. They also provided comments on the sewer capacity at the
catchment level, based on the scale and timing of required upgrades. It should be noted
that this assessment refers to capacity in the sewer network and not capacity at the
receiving WwTW.

Gatwick sub-region Water Cycle Study 103
Table 6.2: Thames Water Wastewater Network Assessment
Sewer catchment
JBA site reference TW site specific comments TW sewer catchment assessment
21020110 -
CRAWLEY STW
(20)
CRAW15, CRAW16,
CRAW24, CRAW27,
CRAW29, CRAW30,
CRAW32, CRAW34,
CRAW36, CRAW37,
CRAW38, CRAW40,
CRAW41, CRAW44,
CRAW46,
CRAW47,CRAW48,
CRAW49, CRAW50,
CRAW51, CRAW52,
CRAW54, CRAW56,
CRAW57, CRAW58,
CRAW59, CRAW60,
CRAW63, CRAW64,
CRAW65, CRAW66
On the information available to date we do
not envisage infrastructure concerns
regarding wastewater networks in relation
to this development/s.
Scale of growth can be
accommodated significant
upgrades will be required these
may take between 3 and 5 years to
design and deliver
21020411 -
COPTHORNE
SPS (20)
MSUS242
On the information available to date we do
not envisage infrastructure concerns
regarding wastewater networks in relation
to this development/s.
Scale of growth can be
accommodated significant
upgrades will be required these
may take between 3 and 5 years to
design and deliver
21020610 -
PEASE
POTTAGE SPS
(20)
MSUS237
On the information available to date we do
not envisage infrastructure concerns
regarding wastewater networks in relation
to this development/s. Scale of growth can be
accommodated significant
upgrades will be required these
may take between 3 and 5 years to
design and deliver MSUS240
The scale of development/s is likely to
require upgrades to both the wastewater
network and sewage treatment
infrastructure. It is recommended that the
Developer and the Local Planning Authority
liaise with Thames Water at the earliest

Gatwick sub-region Water Cycle Study 104
Sewer catchment
JBA site reference TW site specific comments TW sewer catchment assessment
opportunity to agree a housing and
infrastructure phasing plan. The plan
should determine the magnitude of spare
capacity currently available within the
network and what phasing may be required
to ensure development does not outpace
delivery of essential network upgrades to
accommodate future development/s.
Failure to liaise with Thames Water will
increase the risk of planning conditions
being sought at the application stage to
control the phasing of development in order
to ensure that any necessary infrastructure
upgrades are delivered ahead of the
occupation of development.
21020710 -
COUNTY OAK
SPS (20)
CRAW33, CRAW43,
CRAW45, CRAW56
On the information available to date we do
not envisage infrastructure concerns
regarding wastewater networks in relation
to this development/s.
Scale of growth can be
accommodated significant
upgrades will be required these
may take between 3 and 5 years to
design and deliver
21020810 -
POOLE LANE
SPS (20)
CRAW26, CRAW28,
HDC74, HDC85
On the information available to date we do
not envisage infrastructure concerns
regarding wastewater networks in relation
to this development/s.
Scale of growth can be
accommodated significant
upgrades will be required these
may take between 3 and 5 years to
design and deliver
21020910 -
RUSPER ROAD
SPS (20)
HDC75
The scale of development/s is likely to
require upgrades to both the wastewater
network and sewage treatment
infrastructure. It is recommended that the
Developer and the Local Planning Authority
liaise with Thames Water at the earliest
opportunity to agree a housing and
infrastructure phasing plan. The plan
Scale of growth can be
accommodated significant
upgrades will be required these
may take between 3 and 5 years to
design and deliver

Gatwick sub-region Water Cycle Study 105
Sewer catchment
JBA site reference TW site specific comments TW sewer catchment assessment
should determine the magnitude of spare
capacity currently available within the
network and what phasing may be required
to ensure development does not outpace
delivery of essential network upgrades to
accommodate future development/s.
Failure to liaise with Thames Water will
increase the risk of planning conditions
being sought at the application stage to
control the phasing of development in order
to ensure that any necessary infrastructure
upgrades are delivered ahead of the
occupation of development.
21021712 -
CRAWLEY
DOWN
(GRAVITY)
(SW) (20)
CRAW31
On the information available to date we do
not envisage infrastructure concerns
regarding wastewater networks in relation
to this development/s.
Scale of growth can be
accommodated significant
upgrades will be required these
may take between 3 and 5 years to
design and deliver
21022212 -
WITHY PITTS
SPS (SW) (20)
On the information available to date we do
not envisage infrastructure concerns
regarding wastewater networks in relation
to this development/s.
Scale of growth can be
accommodated significant
upgrades will be required these
may take between 3 and 5 years to
design and deliver
21190110 -
EARLSWOOD
STW (50)
RBBC155, RBBC156,
RBBC157, RBBC162,
RBBC163, RBBC164,
RBBC234, RBBC235
On the information available to date we do
not envisage infrastructure concerns
regarding wastewater networks in relation
to this development/s.
Scale of growth can be
accommodated significant
upgrades will be required these
may take between 3 and 5 years to
design and deliver
21190810 -
CASTLE DRIVE
SPS (50)
RBBC236, RBBC237,
RBBC238, RBBC239
On the information available to date we do
not envisage infrastructure concerns
regarding wastewater networks in relation
to this development/s.
Scale of growth can be
accommodated significant
upgrades will be required these

Gatwick sub-region Water Cycle Study 106
Sewer catchment
JBA site reference TW site specific comments TW sewer catchment assessment
may take between 3 and 5 years to
design and deliver
21190910 -
BANCROFT
ROAD SPS (50)
RBBC233
On the information available to date we do
not envisage infrastructure concerns
regarding wastewater networks in relation
to this development/s.
Scale of growth can be
accommodated significant
upgrades will be required these
may take between 3 and 5 years to
design and deliver
21191610 -
SUBROSA
DRIVE SPS
(50)
RBBC159
On the information available to date we do
not envisage infrastructure concerns
regarding wastewater networks in relation
to this development/s.
Scale of growth can be
accommodated significant
upgrades will be required these
may take between 3 and 5 years to
design and deliver
21740110 -
HORLEY TOWN
(40)
RBBC303,
RBBC304,RBBC305,
RBBC306, RBBC308
On the information available to date we do
not envisage infrastructure concerns
regarding wastewater networks in relation
to this development/s.
Scale of growth can be
accommodated significant
upgrades will be required these
may take between 3 and 5 years to
design and deliver RBBC375
The scale of development/s is likely to
require upgrades to both the wastewater
network and sewage treatment
infrastructure. It is recommended that the
Developer and the Local Planning Authority
liaise with Thames Water at the earliest
opportunity to agree a housing and
infrastructure phasing plan. The plan
should determine the magnitude of spare
capacity currently available within the
network and what phasing may be required
to ensure development does not outpace
delivery of essential network upgrades to
accommodate future development/s.
Failure to liaise with Thames Water will
increase the risk of planning conditions

Gatwick sub-region Water Cycle Study 107
Sewer catchment
JBA site reference TW site specific comments TW sewer catchment assessment
being sought at the application stage to
control the phasing of development in order
to ensure that any necessary infrastructure
upgrades are delivered ahead of the
occupation of development.
21740210 -
POYNES ROAD
SPS (40)
RBBC307
On the information available to date we do
not envisage infrastructure concerns
regarding wastewater networks in relation
to this development/s.
Scale of growth can be
accommodated significant
upgrades will be required these
may take between 3 and 5 years to
design and deliver
22120110 –
MERSTHAM
(10)
RBBC159, RBBC160,
RBBC161, RBBC165,
RBBC166, RBBC167
On the information available to date we do
not envisage infrastructure concerns
regarding wastewater networks in relation
to this development/s.
Scale of growth can be
accommodated upgrades will be
required these may take 18
months – 3 years to design and
deliver
25020610 -
BANSTEAD
SOUTH
(GRAVITY) (2)
RBBC87
On the information available to date we do
not envisage infrastructure concerns
regarding wastewater networks in relation
to this development/s.
Scale of growth can be
accommodated; minor upgrades
may be required these may take
up to 18 months to design and
deliver
25043710 -
BANSTEAD
(GRAVITY)
(100)
RBBC85, RBBC86
On the information available to date we do
not envisage infrastructure concerns
regarding wastewater networks in relation
to this development/s.
Scale of growth can be
accommodated; minor upgrades
may be required these may take
up to 18 months to design and
deliver

Gatwick sub-region Water Cycle Study 108
6.6 Summary
It should be remembered that both Southern Water and Thames Water as Sewerage
Undertakers have a duty under Section 94 of the Water Industry Act 1991 to provide
sewerage and treat wastewater arising from new domestic development. Except where
strategic upgrades are required to serve very large or multiple developments,
infrastructure upgrades are usually only implemented following an application for a
connection, adoption, or requisition from a developer. Early developer engagement with
water companies is therefore essential to ensure that sewerage capacity can be provided
without delaying development.
6.7 Conclusions
Development in areas where there is limited wastewater network capacity will increase
pressure on the network, increasing the risk of a detrimental impact on existing
customers, and increasing the likelihood of CSO operation. Early engagement with
developers, Southern Water and Thames Water is required, and further modelling of the
network may be required at the planning application stage. Furthermore, for SW and
TW, there are areas where the current network is a combined sewer system, and further
separation of foul and surface water may be required, as well as suitably design SuDS.
The results in section 6.5.1 show that in order to serve the proposed growth in a number
of settlements in the Gatwick Sub-Region, wastewater infrastructure and/or treatment
upgrades would be required. Early engagement between developers, the Councils, SW
and TW is recommended to allow time for the strategic infrastructure required to serve
these developments to be planned.
6.8 Recommendations
Table 6.3: Recommendations from Wastewater Network Assessment
Action Responsibility Timescale
Early engagement between the councils, SW and TW is
required to ensure that where strategic infrastructure is required, it can be planned in by SW/TW.
Councils
SW
TW
Ongoing
Take into account wastewater infrastructure constraints in phasing development in partnership with the sewerage undertaker
Councils
SW
TW
Ongoing
Developers will be expected to work with the sewerage undertaker closely and early in the planning promotion
process to develop an outline Drainage Strategy for sites. The Outline Drainage strategy should set out the following: What – What is required to serve the site? Where – Where are the assets / upgrades to be located? When – When are the assets to be delivered (phasing)?
Which – Which delivery route is the developer going to use s104 s98 s106 etc. The Outline Drainage Strategy should be submitted as part of the planning application submission, and where required, used as a basis for a drainage planning condition to be set.
SW, TW and Developers
Ongoing
Developers will be expected to demonstrate to the Lead Local Flood Authority (LLFA) that surface water from a site will be disposed using a sustainable drainage
system (SuDS) with connection to surface water sewers seen as the last option. New connections for surface water to foul sewers will be resisted by the LLFA.
Developers
LLFA Ongoing

Gatwick sub-region Water Cycle Study 109
7 Wastewater Treatment
7.1 Wastewater Treatment Works in the Gatwick Sub-Region
Headroom at Wastewater Treatment Works (WwTW) can be eroded by growth in
population or per-capita consumption, requiring investment in additional treatment
capacity. As the volumes of treated effluent rises, even if the effluent quality is
maintained, the pollutant load discharged to the receiving watercourse will increase. In
such circumstances the Environment Agency as the environmental regulator, may
tighten consented effluent consents to achieve a “load standstill”, i.e. ensuring that as
effluent volume increases, the pollutant discharged does not increase. Again, this would
require investment by the water company to improve the quality of the treated effluent.
Southern Water and Thames Water operate all the WwTWs serving growth within the
Gatwick Sub-Region. The location of these WwTWs is shown in Figure 7.1 below.
Each development site identified by the councils, alongside windfall and neighbouring
authority growth was assigned to a WwTW using the sewerage drainage area boundaries
provided by SW and TW. Where a development site was not within a boundary, the
nearest sewer catchment was chosen.
Actual connection of a development site to a particular WwTW may be different and will
depend on the capacity of the receiving works, and the local sewer network.
Very small developments in rural areas may be suitable for on-site treatment and
discharge, however the Environment Agency will not usually permit this where there is
a public sewerage system within a distance calculated as 30m per dwelling.

Gatwick sub-region Water Cycle Study 110
Figure 7.1 Location of WwTW serving growth in the study area
7.2 Wastewater Treatment Works Flow Permit Assessment
Introduction
The Environment Agency is responsible for regulating sewage discharge releases via a
system of Environmental Permits (EPs). Monitoring for compliance with these permits
is the responsibility of both the EA and the plant operators. Figure 7.2 summarises the
different types of wastewater releases that might take place, although precise details
vary from works to works depending on the design.
During dry weather, the final effluent from the Wastewater Treatment Works (WwTW)
should be the only discharge (1). With rainfall, the storm tanks fill and eventually start
discharging to the watercourse (2) and Combined Sewer Overflows (CSOs) upstream of
the storm tanks start to operate (3). The discharge of storm sewage from treatment
works is allowed only under conditions of heavy rain or snow melt, and therefore the

Gatwick sub-region Water Cycle Study 111
flow capacity of treatment systems is required to be sufficient to treat all flows arising
in dry weather and the increased flow from smaller rainfall events. After rainfall, storm
tanks should be emptied back to full treatment, freeing their capacity for the next rainfall
event.
Figure 7.2: Overview of typical combined sewerage system and WwTW
discharges
Environmental permits are used alongside water quality limits as a means of controlling
the pollutant load discharged from a WwTW to a receiving watercourse. Sewage flow
rates must be monitored for all WwTWs where the permitted discharge rate is greater
than 50 m3/day in dry weather.
Permitted discharges are based on a statistic known as the Dry Weather Flow (DWF).
As well as being used in the setting and enforcement of effluent discharge permits, the
DWF is used for WwTW design, as a means of estimating the ‘base flow’ in sewerage
modelling and for determining the flow at which discharges to storm tanks will be
permitted by the permit (Flow to Full Treatment, FFT).
WwTW Environmental Permits also consent for maximum concentrations of pollutants,
in most cases Suspended Solids (SS), Biochemical Oxygen Demand (BOD) and Ammonia
(NH4). Some works (usually the larger works) also have permits for Phosphorous (P).
These are determined by the Environment Agency with the objective of ensuring that
the receiving watercourse is not prevented from meeting its environmental objectives,
with specific regard to the Chemical Status element of the Water Framework Directive
(WFD) classification.
Increased domestic population and/or employment activity can lead to increased
wastewater flows arriving at a WwTW. Where there is insufficient headroom at the works
to treat these flows, this could lead to failures in flow consents.
7.3 Methodology
Southern Water and Thames Water were provided with the proposed sites and the
potential housing numbers and employment space for each site (see Appendix A). SW
and TW were then invited to provide an assessment of the receiving WwTW and provide
any additional comments about the impacts of development.
The assessment consists of two factors, the hydraulic capacity of the WwTW (consented
flow vs current flow) and the capacity of the WwTW to treat a given load. The
assessment may also reflect upgrades already planned at WwTW.

Gatwick sub-region Water Cycle Study 112
A parallel assessment of WwTW capacity was carried out by JBA using measured flow
data supplied by the water companies. The process was as follows:
• SW and TW provided their Dry Weather Flow (DWF) statistics, and from this the
20th percentile (80% exceedance flow) for 2016-2019 was calculated. The flow
data was cleaned to remove zero values and low outlier values which would bring
the measured DWF down.
• Growth was assigned to a WwTW using the sewerage drainage area boundaries
as described above.
• For each site, the future DWF was calculated using the occupancy rates and per-
capita consumption values obtained from the Water Resource Management Plans
(Table 7.1), and the assumption that 95% of water used is returned to sewer.
Permitted headroom was used as a substitute for actual designed hydraulic
capacity for each WwTW being assessed.
• For the purposes of this assessment, every site identified in a wastewater
catchment was assumed to be developed, Gatwick Airport scenario 2 was
adopted (standby runway utilised), and the Crawley Area Action Plan resulted in
a large additional demand from employment growth. This represents a worst
case scenario for wastewater treatment demand – particularly at Crawley
WwTW.
Table 7.1: Per Capita Consumption Values Used in Water Demand Calculations
Water Company Water Resource
Zone
Occupancy rate
(persons per dwelling)
Per capita consumption
(m3/person/day)
South East Water Haywards Heath 2.5 0.152
Southern Water Sussex North 2.5 0.134
SES Water Sutton and East
Surrey 2.4 0.145
Thames Water London 2.3 0.119

Gatwick sub-region Water Cycle Study 113
7.4 Results
Southern Water
Southern Water reviewed the sites within the area they serve. A detailed site by site
assessment was not completed, but they did provide general comments based on the
size of the site. These are summarised in Table 7.2.
Table 7.2: SW RAG assessment guidance for wastewater treatment
Size of Site SW Assessment
All sites < 100 houses
“Should largely be Green, unless the development is > 5% of the total number of households currently served by the WwTW
(which is likely to apply only to the smallest WwTWs in the
region). In these cases (where Southern Water has been notified of proposals, either through consultation on a planning application or a developer enquiry) a wastewater treatment capacity assessment is triggered. This will determine whether capacity exists, and if it does not, when it is anticipated that this will be provided.
Sites > 100 houses
“Many at the lower end of the scale should still be Green however the higher the number of new homes proposed, the increase in likelihood that there will be an impact on wastewater
treatment capacity. As above, where development is > 5% of the total number of households currently served by the WwTW, provided Southern Water has been notified of proposals, a wastewater treatment capacity assessment will be triggered. This will determine whether capacity exists, and if it does not,
when it is anticipated that this will be provided”
“Larger sites would be classified as Amber in the RAG.”
SW “haven’t provided a specific cut off point between green and amber since this will vary dependent upon location and the relative impact on the WwTW – the smaller the wastewater catchment and the larger the proposed development, the more
likely a site is to be Amber status.”
Sites > 1000 houses
“Will be passed to our Asset Planners for consideration of infrastructure requirements through the Business Plan, and would be classified as amber”
SW also provided additional comments:
“It should be noted that planning for investment in additional wastewater treatment
capacity is carried out through the water industry’s 5 yearly investment planning process
(the Business Plan). Details of the Business Plan for 2020-2025 can be found online;
https://www.southernwater.co.uk/our-story/our-plans-2020-25/our-business-plan-
2020-25 Predictions of future growth within wastewater catchments are made on the
basis of population forecasts (commissioned every 5 years to inform the business plan),
and ongoing monitoring of local authority published data such as 5 Year Housing Land
Supply, Authority Monitoring Reports and adopted Local and Neighbourhood Plans. This
enables Southern Water to assess when additional capacity will be required at its WTWs
and ensure the necessary funding is secured for it through the next Business Plan.”

Gatwick sub-region Water Cycle Study 114
Thames Water
TW provided a RAG score on six of their WwTW (Table 7.3). Rusper WwTW is included
in the headroom assessment in 7.4.3, and was expected to serve an additional 20 houses
during the plan period. However, TW have advised that this WwTW will be closed and
wastewater pumped to Crawley WwTW. This was deemed to be a more cost-effective
solution than upgrading Rusper WwTW.
Both Crawley and Horley WwTW were given a “red” assessment, reflecting the scale of
upgrades needed.
Table 7.3 Thames Water assessment of WwTW capacity
WwTW TW Assessment
Beddington
Hogsmill
Scale of growth can be accommodated; minor upgrades may be required these may take up to 18 months to design and deliver
Reigate (Earlswood)
Merstham
Scale of growth can be accommodated; upgrades will be required these may take 18 months – 3 years to design and deliver
Crawley
Horley
Scale of growth can be accommodated, but significant upgrades will be required, and these may take between 3 and 5 years to design and deliver. If the scale of growth triggers a consent change then time to upgrade could be significantly different especially if the consent goes beyond best available technology
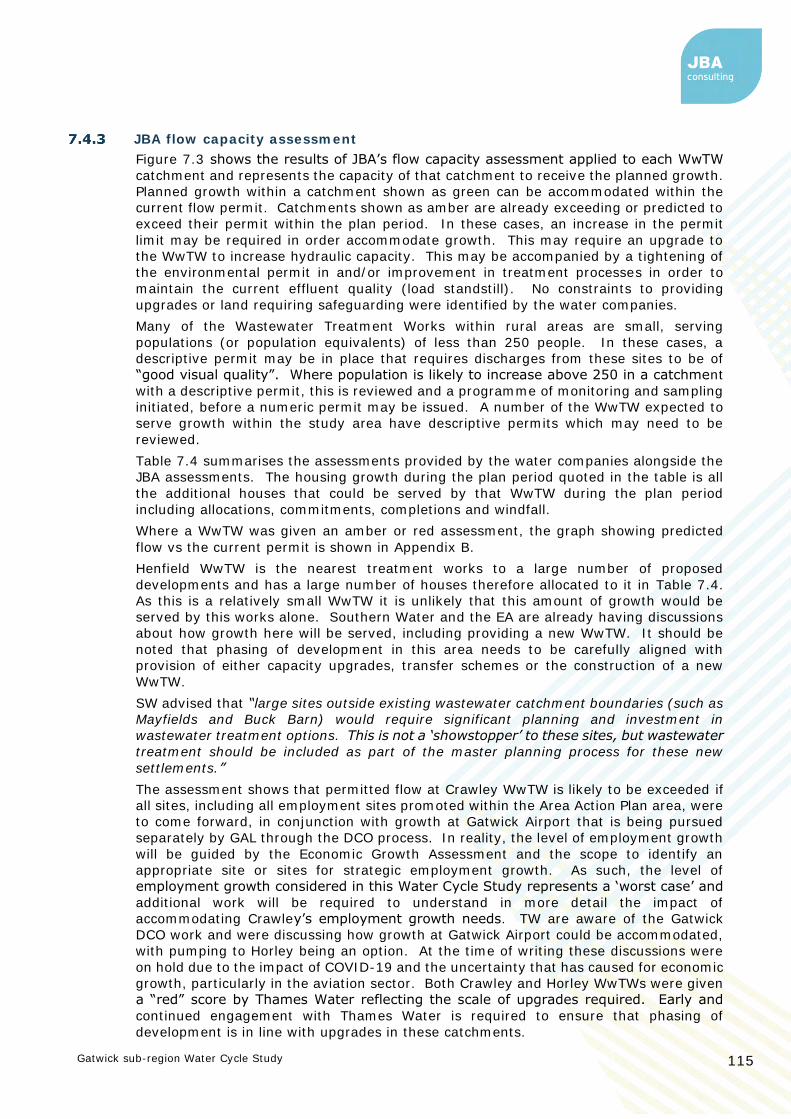
Gatwick sub-region Water Cycle Study 115
JBA flow capacity assessment
Figure 7.3 shows the results of JBA’s flow capacity assessment applied to each WwTW
catchment and represents the capacity of that catchment to receive the planned growth.
Planned growth within a catchment shown as green can be accommodated within the
current flow permit. Catchments shown as amber are already exceeding or predicted to
exceed their permit within the plan period. In these cases, an increase in the permit
limit may be required in order accommodate growth. This may require an upgrade to
the WwTW to increase hydraulic capacity. This may be accompanied by a tightening of
the environmental permit in and/or improvement in treatment processes in order to
maintain the current effluent quality (load standstill). No constraints to providing
upgrades or land requiring safeguarding were identified by the water companies.
Many of the Wastewater Treatment Works within rural areas are small, serving
populations (or population equivalents) of less than 250 people. In these cases, a
descriptive permit may be in place that requires discharges from these sites to be of
“good visual quality”. Where population is likely to increase above 250 in a catchment
with a descriptive permit, this is reviewed and a programme of monitoring and sampling
initiated, before a numeric permit may be issued. A number of the WwTW expected to
serve growth within the study area have descriptive permits which may need to be
reviewed.
Table 7.4 summarises the assessments provided by the water companies alongside the
JBA assessments. The housing growth during the plan period quoted in the table is all
the additional houses that could be served by that WwTW during the plan period
including allocations, commitments, completions and windfall.
Where a WwTW was given an amber or red assessment, the graph showing predicted
flow vs the current permit is shown in Appendix B.
Henfield WwTW is the nearest treatment works to a large number of proposed
developments and has a large number of houses therefore allocated to it in Table 7.4.
As this is a relatively small WwTW it is unlikely that this amount of growth would be
served by this works alone. Southern Water and the EA are already having discussions
about how growth here will be served, including providing a new WwTW. It should be
noted that phasing of development in this area needs to be carefully aligned with
provision of either capacity upgrades, transfer schemes or the construction of a new
WwTW.
SW advised that “large sites outside existing wastewater catchment boundaries (such as
Mayfields and Buck Barn) would require significant planning and investment in
wastewater treatment options. This is not a ‘showstopper’ to these sites, but wastewater
treatment should be included as part of the master planning process for these new
settlements.”
The assessment shows that permitted flow at Crawley WwTW is likely to be exceeded if
all sites, including all employment sites promoted within the Area Action Plan area, were
to come forward, in conjunction with growth at Gatwick Airport that is being pursued
separately by GAL through the DCO process. In reality, the level of employment growth
will be guided by the Economic Growth Assessment and the scope to identify an
appropriate site or sites for strategic employment growth. As such, the level of
employment growth considered in this Water Cycle Study represents a ‘worst case’ and
additional work will be required to understand in more detail the impact of
accommodating Crawley’s employment growth needs. TW are aware of the Gatwick
DCO work and were discussing how growth at Gatwick Airport could be accommodated,
with pumping to Horley being an option. At the time of writing these discussions were
on hold due to the impact of COVID-19 and the uncertainty that has caused for economic
growth, particularly in the aviation sector. Both Crawley and Horley WwTWs were given
a “red” score by Thames Water reflecting the scale of upgrades required. Early and
continued engagement with Thames Water is required to ensure that phasing of
development is in line with upgrades in these catchments.

Gatwick sub-region Water Cycle Study 116

Gatwick sub-region Water Cycle Study 117
Figure 7.3 JBA flow capacity assessment

Gatwick sub-region Water Cycle Study 118
Table 7.4: Summary of WwTW Flow Assessment
WwTW
Housing growth over plan period (dwellings)
Indicative number of employees
Does DWF flow exceed permitted flow before 2045? (JBA assessment)
Comments
Ansty 35 No
Ardingly 114 No
Ashington 636 No
Balcombe 51 No
Barns Green 57 No
Beddington 38,706 329 No
TW – “Scale of growth can be accommodated; minor upgrades may be required, and these may take up to 18 months to design and deliver”
Billingshurst 7,930 338 Yes, between now and 2020
Burgess Hill (Goddards Green) 7,391 5,723 Yes – date uncertain
SW have commented that Goddards Green has sufficient headroom till 2025. The JBA assessment showed the WwTW already exceeding its permit. SW advised that this is due to a flow measurement error (caused by a downstream blockage) that has been identified and rectified. Tightening of the phosphorus consent
in AMP7 diminishes head room for future growth.
Burstow 391 14 No
Colgate 3 No
Coolham 1 Descriptive permit
Cowfold 115 No
Crawley
22,717 44,536 Yes – between 2025 and 2030
JBA assessment shows the flow permit would be exceeded due to growth if no action was taken. TW gave this a “red” assessment due to the scale of infrastructure upgrades required. This represents a ‘worst case’ impact on Crawley WwTW, and further work will be required once the identified level of employment
growth has been refined. It should be noted that Crawley WwTW serves growth in neighbouring authority areas.
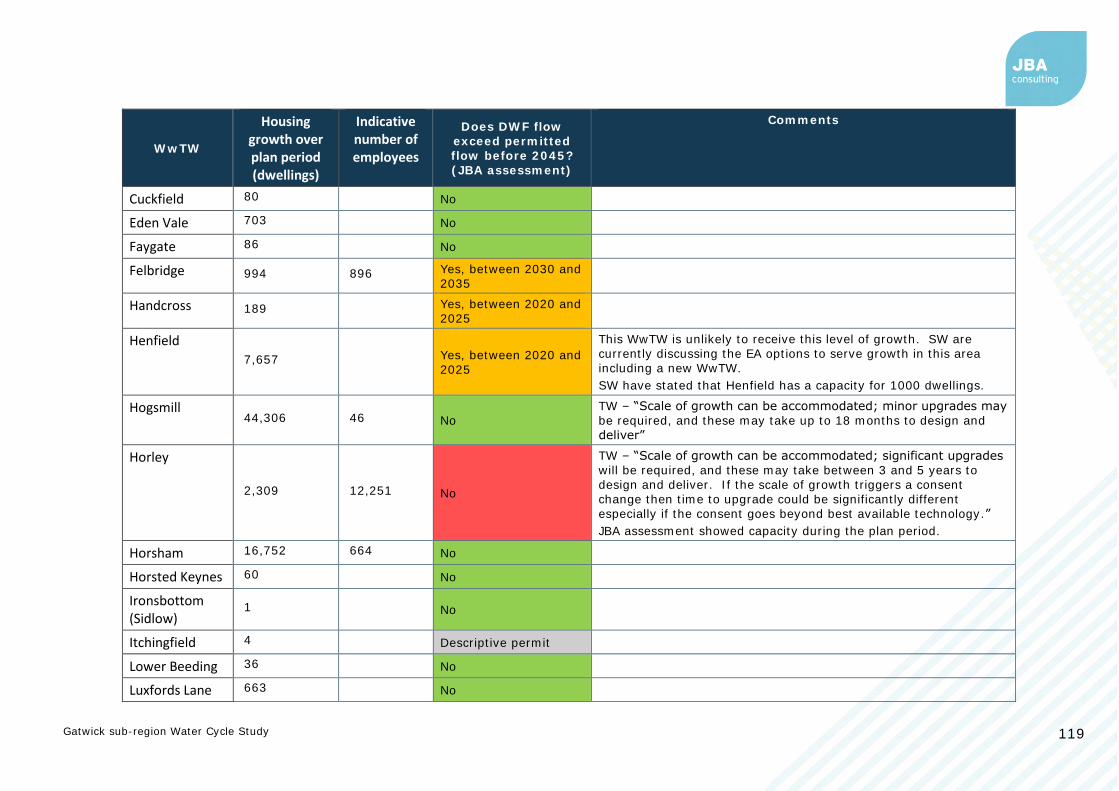
Gatwick sub-region Water Cycle Study 119
WwTW
Housing growth over plan period (dwellings)
Indicative number of employees
Does DWF flow exceed permitted flow before 2045? (JBA assessment)
Comments
Cuckfield 80 No
Eden Vale 703 No
Faygate 86 No
Felbridge 994 896 Yes, between 2030 and 2035
Handcross 189 Yes, between 2020 and 2025
Henfield
7,657 Yes, between 2020 and 2025
This WwTW is unlikely to receive this level of growth. SW are currently discussing the EA options to serve growth in this area including a new WwTW.
SW have stated that Henfield has a capacity for 1000 dwellings.
Hogsmill 44,306 46 No
TW – “Scale of growth can be accommodated; minor upgrades may
be required, and these may take up to 18 months to design and deliver”
Horley
2,309 12,251 No
TW – “Scale of growth can be accommodated; significant upgrades will be required, and these may take between 3 and 5 years to design and deliver. If the scale of growth triggers a consent change then time to upgrade could be significantly different especially if the consent goes beyond best available technology.”
JBA assessment showed capacity during the plan period.
Horsham 16,752 664 No
Horsted Keynes 60 No
Ironsbottom (Sidlow)
1 No
Itchingfield 4 Descriptive permit
Lower Beeding 36 No
Luxfords Lane 663 No
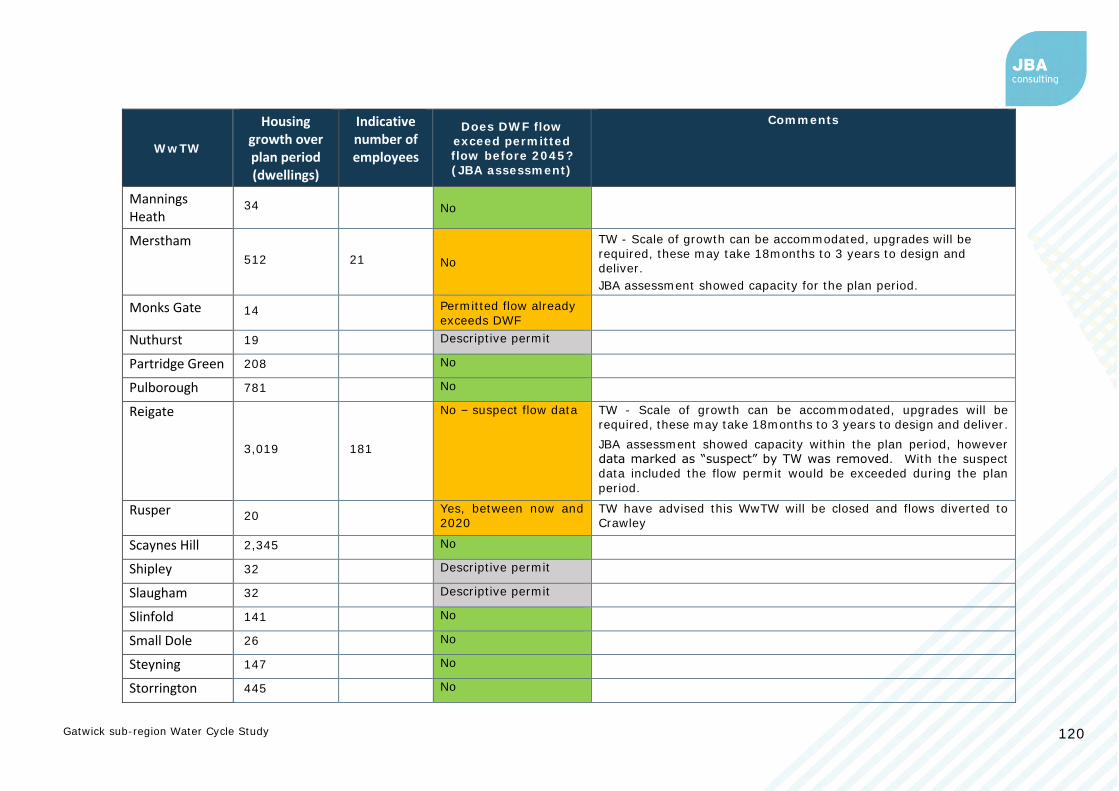
Gatwick sub-region Water Cycle Study 120
WwTW
Housing growth over plan period (dwellings)
Indicative number of employees
Does DWF flow exceed permitted flow before 2045? (JBA assessment)
Comments
Mannings Heath
34 No
Merstham
512 21 No
TW - Scale of growth can be accommodated, upgrades will be
required, these may take 18months to 3 years to design and deliver.
JBA assessment showed capacity for the plan period.
Monks Gate 14 Permitted flow already exceeds DWF
Nuthurst 19 Descriptive permit
Partridge Green 208 No
Pulborough 781 No
Reigate
3,019 181
No – suspect flow data TW - Scale of growth can be accommodated, upgrades will be
required, these may take 18months to 3 years to design and deliver.
JBA assessment showed capacity within the plan period, however data marked as “suspect” by TW was removed. With the suspect data included the flow permit would be exceeded during the plan
period.
Rusper 20 Yes, between now and 2020
TW have advised this WwTW will be closed and flows diverted to Crawley
Scaynes Hill 2,345 No
Shipley 32 Descriptive permit
Slaugham 32 Descriptive permit
Slinfold 141 No
Small Dole 26 No
Steyning 147 No
Storrington 445 No

Gatwick sub-region Water Cycle Study 121
WwTW
Housing growth over plan period (dwellings)
Indicative number of employees
Does DWF flow exceed permitted flow before 2045? (JBA assessment)
Comments
Warnham 83 No
Warninglid 1 Descriptive permit
Wineham 2 Descriptive permit
Wiston 2 No
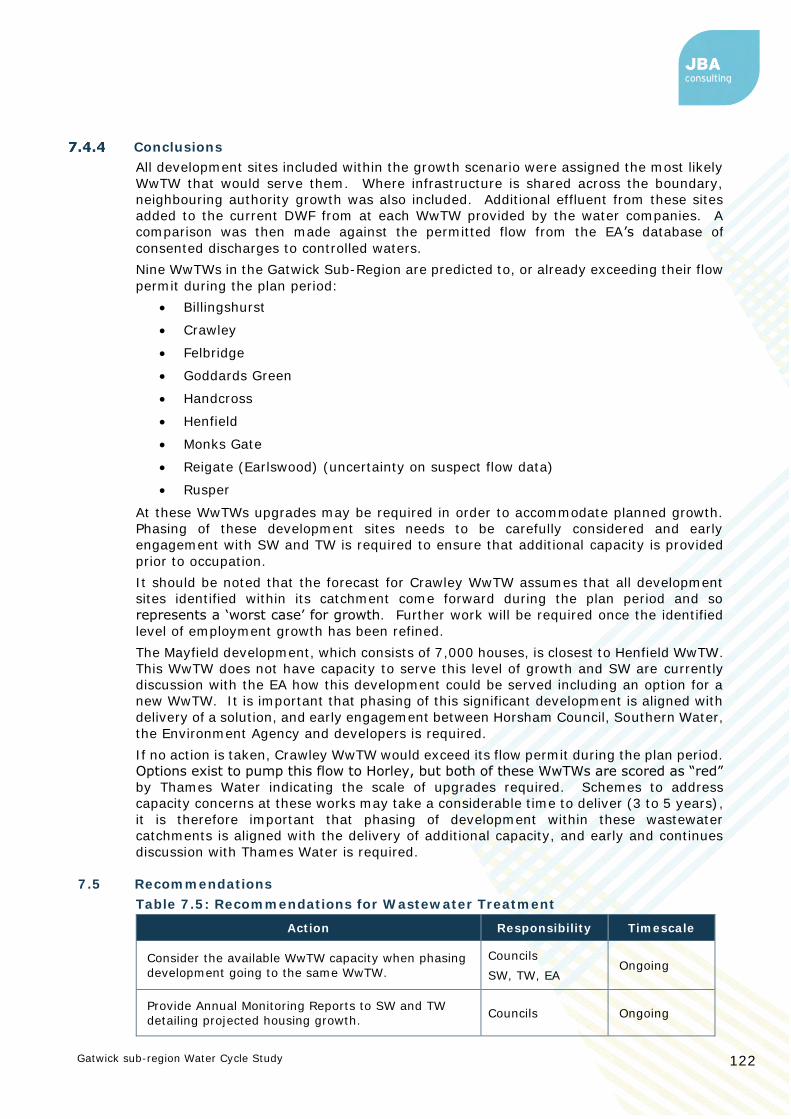
Gatwick sub-region Water Cycle Study 122
Conclusions
All development sites included within the growth scenario were assigned the most likely
WwTW that would serve them. Where infrastructure is shared across the boundary,
neighbouring authority growth was also included. Additional effluent from these sites
added to the current DWF from at each WwTW provided by the water companies. A
comparison was then made against the permitted flow from the EA’s database of
consented discharges to controlled waters.
Nine WwTWs in the Gatwick Sub-Region are predicted to, or already exceeding their flow
permit during the plan period:
• Billingshurst
• Crawley
• Felbridge
• Goddards Green
• Handcross
• Henfield
• Monks Gate
• Reigate (Earlswood) (uncertainty on suspect flow data)
• Rusper
At these WwTWs upgrades may be required in order to accommodate planned growth.
Phasing of these development sites needs to be carefully considered and early
engagement with SW and TW is required to ensure that additional capacity is provided
prior to occupation.
It should be noted that the forecast for Crawley WwTW assumes that all development
sites identified within its catchment come forward during the plan period and so
represents a ‘worst case’ for growth. Further work will be required once the identified
level of employment growth has been refined.
The Mayfield development, which consists of 7,000 houses, is closest to Henfield WwTW.
This WwTW does not have capacity to serve this level of growth and SW are currently
discussion with the EA how this development could be served including an option for a
new WwTW. It is important that phasing of this significant development is aligned with
delivery of a solution, and early engagement between Horsham Council, Southern Water,
the Environment Agency and developers is required.
If no action is taken, Crawley WwTW would exceed its flow permit during the plan period.
Options exist to pump this flow to Horley, but both of these WwTWs are scored as “red”
by Thames Water indicating the scale of upgrades required. Schemes to address
capacity concerns at these works may take a considerable time to deliver (3 to 5 years),
it is therefore important that phasing of development within these wastewater
catchments is aligned with the delivery of additional capacity, and early and continues
discussion with Thames Water is required.
7.5 Recommendations
Table 7.5: Recommendations for Wastewater Treatment
Action Responsibility Timescale
Consider the available WwTW capacity when phasing
development going to the same WwTW.
Councils
SW, TW, EA Ongoing
Provide Annual Monitoring Reports to SW and TW
detailing projected housing growth. Councils Ongoing
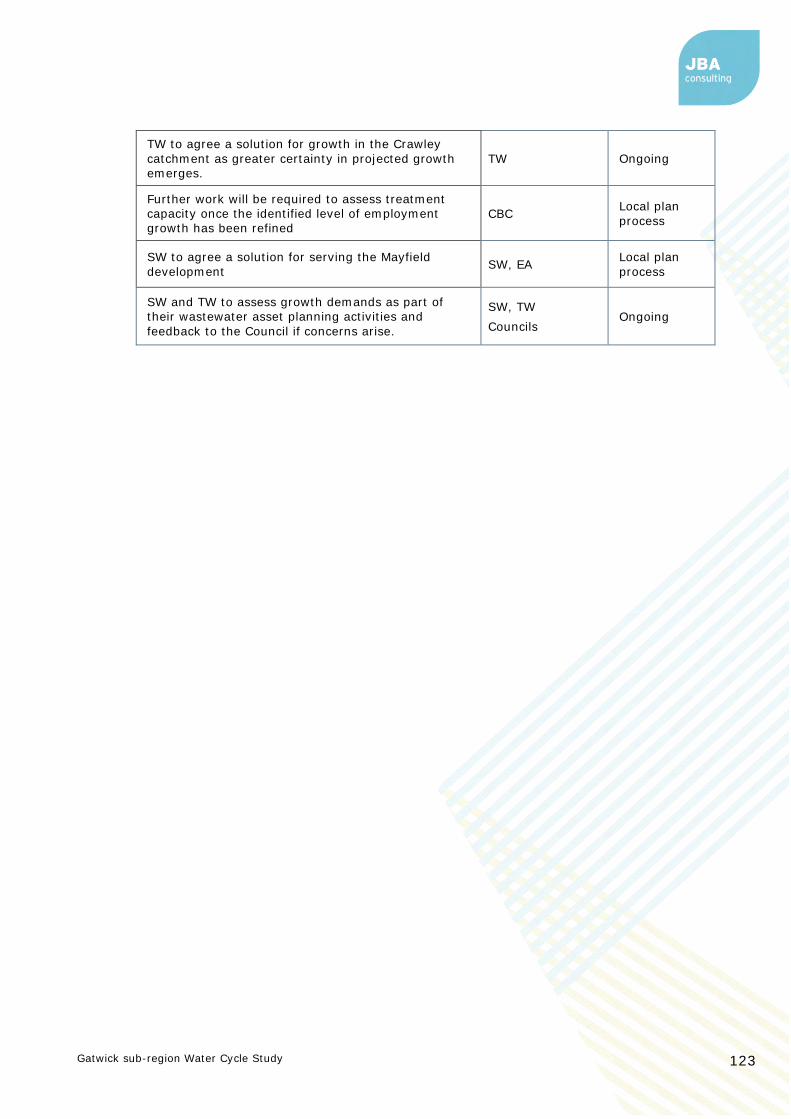
Gatwick sub-region Water Cycle Study 123
TW to agree a solution for growth in the Crawley
catchment as greater certainty in projected growth emerges.
TW Ongoing
Further work will be required to assess treatment capacity once the identified level of employment growth has been refined
CBC Local plan
process
SW to agree a solution for serving the Mayfield
development SW, EA
Local plan
process
SW and TW to assess growth demands as part of their wastewater asset planning activities and
feedback to the Council if concerns arise.
SW, TW
Councils Ongoing

Gatwick sub-region Water Cycle Study 124
8 Odour Assessment
8.1 Introduction
Where new developments are in close proximity to an existing Wastewater Treatment
Works (WwTW), odour from that site may become a cause for nuisance and complaints
from residents. Managing odour at WwTWs can add considerable capital and operational
costs, particularly when retro fitted to existing WwTWs. National Planning Policy
Guidance recommends that plan-makers consider whether new development is
appropriate near to sites used (or proposed) for water and wastewater infrastructure,
due to the risk of odour nuisance.
8.2 Methodology
Sewerage Undertakers suggest that an odour assessment may be required if the site of
a proposed development is close to a WwTW or is encroaching closer to the WwTW than
existing urban areas. If there are no existing developments close to a WwTW, it is more
likely that an odour assessment is required to identify any potential issues. The actual
odour experienced is dependent on the size of the works, the type of treatment processes
present, and the age and condition of the site. There is also significant variation due to
current weather conditions. At Gatwick Airport, within the study area, the prevailing
wind is from the west south west (WSW).For each Thames Water and Southern Water
WwTW in the Gatwick Sub-Region, the land within an 800m radius of the asset has been
identified and any sites that fall within this area have been highlighted.
A red/amber/green assessment was applied by JBA:
Site is unlikely to be
impacted by odour from
WwTW
Site location is such that
an odour impact
assessment is
recommended
Site is in an area with
confirmed WwTW odour
issues
8.3 Data Collection
The datasets used to assess the impact of odour from a WwTW were:
• Site location in GIS format (provided by the Gatwick Sub-Region local authorities)
• WwTW locations (from “Consented discharges to controlled waters with
conditions” database)
8.4 Results
Table 8.1 identifies the ten sites within the Gatwick Sub-Region which fall within 800m
of either a Thames Water or Southern Water WwTW. The 800m buffer does not take
into account the size of the works, the treatment processes present or the condition of
the WwTW which can all affect the magnitude of the odour. Where there is already
urban area closer to the treatment works than the proposed site, the nature of odour on
the new site is likely to be known and reported so these sites represent are lower risk.
Four sites are closer to the WwTW than existing urban area.
Sites that are given an amber assessment will not necessarily experience nuisance odour
but should undergo an odour assessment as part of the planning process.

Gatwick sub-region Water Cycle Study 125
Table 8.1: Sites within 800m of WwTWs in the Gatwick Sub-Region
WCS Site Ref.
Site Address WwTW Water
Company Distance
(m)
WwTW Location
in Relation to Site
Closer than
existing urban area?
Reigate and Banstead
RBBC161
Former Oakley Centre,
Merstham
Warwick Wold
WwTW
(East of
RBBC area)
Thames Water
765 East
No
Crawley
N/A Crawley Area Action Plan
Crawley WwTW
Thames Water
N/A N/A Likely on
some sites
Horsham
SA296 Land North of
Horsham Warnham
WwTW Southern
Water 711 West
No
SA744 Land North of
Newbridge Road
Billingshurst WwTW
Southern Water
682 South No
SA414 Mayfield
Proposal
Wineham WwTW
Southern Water
0 North Yes
Henfield
WwTW
Southern
Water 622 South West
No
Blackstone WwTW
Southern Water
562 South East Yes
Mid Sussex
MSUS237
Pease Pottage Nurseries,
Brighton Road, Pease Pottage
Pease Pottage WwTW
Southern Water
50 West
Yes
MSUS240 Cedars,
Brighton Road Pease Pottage
Pease Pottage WwTW
Southern Water
213 North West Yes
MSUS16
Land at St.
Martin Close, Handcross
Park Road
Handcross WwTW
Southern
Water 492 West
No
MSUS22
Ansty Cross Garage,
Cuckfield Road, Ansty
Ansty WwTW
Southern Water
305 North East
No
N/A Science and Technology
Park
Goddards Green WwTW
Southern Water
40 West No
8.5 Conclusions
Ten sites across the Gatwick Sub-Region have been identified as being at risk of nuisance
odour and given a RAG rating of amber due to their proximities to Thames Water and
Southern Water WwTWs. Four of these sites are closer to the WwTW than existing urban
area. An odour assessment is recommended as part of the planning process for the sites
identified, funded by developers. The remaining sites have been given a rating of green.

Gatwick sub-region Water Cycle Study 126
8.6 Recommendations
Table 8.2: Recommendations from the Odour Assessment
Action Responsibility Timescale
Consider odour risk in the sites identified to be
potentially at risk from nuisance odour Councils Ongoing
Carry out an odour assessment for sites identified as amber as part of the planning process and paid for by the developer.
Site Developers Ongoing

Gatwick sub-region Water Cycle Study 127
9 Water Quality
9.1 Introduction
An increase in the discharge of effluent from Wastewater Treatment Works (WwTW) as
a result of development and growth in the area in which they serve can lead to a negative
impact on the quality of the receiving watercourse. Under the Water Framework
Directive (WFD), a watercourse is not allowed to deteriorate from its current WFD
classification (either as an overall watercourse or for individual elements assessed).
It is Environment Agency (EA) policy to model the impact of increasing effluent volumes
on the receiving watercourses. Where the scale of development is such that a
deterioration is predicted, a variation to the Environmental Permit (EP) may be required
for the WwTW to improve the quality of the final effluent, so that the increased pollution
load will not result in a deterioration in the water quality of the watercourse. This is
known as "no deterioration" or "load standstill". The need to meet river quality targets
is also taken into consideration when setting or varying a permit.
The Environment Agency operational instructions on water quality planning and no-
deterioration are currently being reviewed. Previous operational instructions89 (now
withdrawn) set out a hierarchy for how the no-deterioration requirements of the WFD
should be implemented on inland waters. The potential impact of development should
be assessed in relation to the following objectives:
• Could the development cause a greater than 10% deterioration in water
quality? This objective ensures that all the environmental capacity is not taken
up by one stage of development and there is sufficient capacity for future growth.
• Could the development cause a deterioration in WFD class of any element
assessed? This is a requirement of the Water Framework Directive to prevent
a deterioration in class of individual contaminants. The "Weser Ruling"90 by the
European Court of Justice in 2015 specified that individual projects should not be
permitted where they may cause a deterioration of the status of a water body.
If a water body is already at the lowest status ("bad"), any impairment of a quality
element was considered to be a deterioration. Emerging practice is that a 3%
limit of deterioration is applied.
• Could the development alone prevent the receiving watercourse from
reaching Good Ecological Status (GES) or Potential? Is GES possible with
current technology or is GES technically possible after development with any
potential WwTW upgrades.
The overall WFD classification of a water body is based on a wide range of ecological and
chemical classifications. This assessment focuses on three physico-chemical quality
elements; Biochemical Oxygen Demand (BOD), Ammonia, and Phosphate.
BOD – Biochemical Oxygen Demand
BOD is a measure of how much organic material – sewage, sewage effluent or industrial
effluent – is present in a river. It is defined as the amount of oxygen taken up by micro-
organisms (principally bacteria) in decomposing the organic material in a water sample
stored in darkness for 5 days at 20°C. Water with a high BOD has a low level of dissolved
oxygen. A low oxygen content can have an adverse impact on aquatic life.
Ammonia
Nitrogen is an essential nutrient required by all plants and animals for the formation of
amino acids. In its molecular form nitrogen cannot be used by most aquatic plants, and
so it is converted into other forms. One such form is ammonia (NH3). This may then be
———————————————————————————————————————————— 89 Water Quality Planning: no deterioration and the Water Framework Directive, Environment Agency (2012). Accessed online at:
http://www.fwr.org/WQreg/Appendices/No_deterioration_and_the_WFD_50_12.pdf on: 28/09/2019 90 PRESS RELEASE No 74/15, European Court of Justice (2015). Accessed online at:
https://curia.europa.eu/jcms/upload/docs/application/pdf/2015-07/cp150074en.pdf on: 28/09/2019

Gatwick sub-region Water Cycle Study 128
oxidized by bacteria into nitrate (NO3) or nitrite (NO2). Ammonia may be present in
water in either the unionized form NH3 or the ionized form NH4. Taken together these
forms care called Total Ammonia Nitrogen.
Although ammonia is a nutrient, in high concentrations it can be toxic to aquatic life, in
particular fish, affecting hatching and growth rates.
The main sources in rivers include agricultural sources, (fertilizer and livestock waste),
residential sources (ammonia containing cleaning products and septic tank leakages),
industrial processes and Water Recycling Centres.
Phosphate
Phosphorus is a plant nutrient and elevated concentrations in rivers can lead to
accelerated plant growth of algae and other plants. Its impact on the composition and
abundance of plant species can have adverse implications for other aspects of water
quality, such as oxygen levels. These changes can cause undesirable disturbances to
other aquatic life such as invertebrates and fish.
Phosphorus (P) occurs in rivers mainly as Phosphate (PO4), which are divided into
Orthophosphates (reactive phosphates), and organic Phosphates.
Orthophosphates are the main constituent in fertilizers used in agriculture and domestic
gardens and provide a good estimation of the amount of phosphorus available for algae
and plant growth and is the form of phosphorus that is most readily utilized by plants.
Organic phosphates are formed primarily by biological processes and enter sewage via
human waste and food residues. Organic phosphates can be formed from
orthophosphates in biological treatment processes or by receiving water biota.
Although it is phosphorus in the form of phosphates that is measured as a pollutant, the
term phosphorus is often used in water quality work to represent the total phosphorus
containing pollutants.
9.2 Methodology
General approach
SIMCAT is used by the Environment Agency to model potential deterioration of
waterbodies and to support decision making to guide development to locations where
environmental deterioration will be reduced. SIMCAT is a 1D stochastic, steady state,
deterministic model which represents inputs from point-score effluent discharges and
the behaviour of solutes in the river (Cox, 2003).
SIMCAT can simulate inputs of discharge and water quality data and statistically
distribute them from multiple effluent sources along the river reach. It uses the Monte
Carlo method for distribution that randomly models up to 2,500 boundary conditions.
The simulation calculates the resultant water quality as the calculations cascade further
downstream.
Once the distribution results have been produced, an assessment can be undertaken
on the predicted mean and ninety percentile concentrations or loads.

Gatwick sub-region Water Cycle Study 129
Figure 9.1 Water quality impact assessment following EA West Thames
guidance
Where modelling indicated growth may lead to a deterioration in the watercourse
(either 10% or in class), or where the watercourse is not currently meeting at least a
'Good' class for each determinand (defined as a constituent describing water quality),
the models were used to test whether this could be addressed by applying stricter
discharge concentrations. In such cases, a Technically Achievable Limit (TAL) was
considered.
The EA advised that the following permit values are achievable using treatment at TAL,
and that these values should be used for modelling all WwTW potential capacity
irrespective of the existing treatment technology and size of the works:
• Ammonia (95%-ile): 1mg/l
• BOD (95%-ile): 5mg/l
• Phosphorus (mean): 0.25mg/l
This assessment did not take into consideration if it is feasible to upgrade each existing
WwTW to best available technology due to constraints of costs, timing, space, carbon
costs etc.
Modelling approach
Existing SIMCAT models developed by the Environment Agency were supplied for the
River Thames catchment and the South East River Basin District; one modelling
Ammonia and BOD, the other modelling Phosphorous. The models were understood to
have been largely based on observed flow and quality data for the period 2010 to 2012.
A widespread update of the model, and the resultant recalibration were not within scope
of this project. It was therefore decided to update just the effluent flow and quality
statistics at WwTWs receiving growth in the study area.
The two models were run as received from the Environment Agency to set a baseline
and ensure the models worked appropriately. A complete update of the two SIMCAT
models and subsequent recalibration were not within scope of the project, and so a
limited update was carried out. This means that the modelling work presented should
be used to identify areas at risk of water quality deterioration, but not for permit setting.
Flow data from the last three years for each WwTW in the study area was supplied by
SW and TW and used to update the model. The updated models were then run as a
2018 baseline.
No Yes No Yes Yes No
No Yes
NoYes
Yes No
YesNo
Could the development cause deterioration in WFD class?
Could the development cause >10% deterioration in water quality?
Could the development alone prevent the receiving water from reaching Good Ecological Status or Potential?Specifically:a. is GES possible now with current technology?
Sufficient Environmental Capacity. Proposed development has no significant impact on the water body's potential for reaching GES.
Environmental capacity could be a constraint to growth
Good Ecological Status cannot be achieved due to current technology limits. Ensure proposed growth doesn't cause significant deterioration.
Could >10% deterioration be prevented using current technology?
Could WFD class deterioration be prevented
b. Is GES technically possible after development and potential STW upgrades?
Proposed development can be accommodated with a tighter permit and upgrade to treatment. This is achievable with current technology.
Is the water body already meeting Good Ecological Status?

Gatwick sub-region Water Cycle Study 130
Additional effluent flow from potential growth during the local plan period was added to
current flow at WwTWs receiving growth and the model re-run as a future scenario.
In order to assess whether a deterioration in WFD class would be predicted, targets for
BOD, Ammonia and Phosphate were provided by the EA.
Where treatment at TAL and reductions in diffuse sources in the present day could
improve water quality to meet Good class, it is important to understand whether this
could be compromised as a result of future growth within the catchment.
Guidance from the EA suggests breaking this down in to two questions:
a) Is Good Ecological Status possible now with current technology?
b) Is Good Ecological Status technically possible after development and any
potential WwTW upgrades?
If the answer to questions a) and b) are both ‘Yes’ or ‘No’ then the development can be
assessed as having no significant impact on the water bodies potential for reaching GES.
However, if the answer to a) is ‘Yes’ and the answer for b) is ‘No’ then development is
having a significant impact.
In order to answer the question whether growth could prevent good ecological status
being achieved in the future. WFD Targets for each determinand were added to the
model. Due to the size of the study area, and the range of target values that would
need to be applied, it was decided that updating the model with the correct target for
that particular reach / input was not appropriate to the scope of the study. Applying a
maximum or minimum value or calculating a mean would also introduce a source of
error. Two versions of the model were therefore created one with every target set to
the maximum target found in the catchment, and a minimum version where every target
was set to the minimum value found in the model.
Run type 9 within SIMCAT was then used which assumes that upstream flow each
treatment works is at good ecological status. The permit value required to still achieve
GES is then calculated by the model.
If GES can be achieved with the upstream quality set to good in the minimum version of
the model, then this is likely to be achieved for whatever the actual local WFD target is.
If it cannot be achieved, then the maximum version of the model was used. If GES
cannot be achieved in this version of the model, then it is unlikely to be achieved
whatever the local WFD target is. If it can be achieved in one version but not the other,
then with the WwTW treating at TAL, the resulting water downstream water quality is
likely to be close to the target. These WwTWs have been identified as having an
“inconclusive” assessment.
9.3 Results
Overview
Figure 9.2 shows the Cycle 2 Water Framework Directive overall waterbody ecological
classifications for watercourse in the study area. The majority of the waterbodies have
a moderate or poor ecological status, and in all of the waterbodies that contain a WwTW
serving growth, sewage discharge was cited as one of the “reasons for not achieving
good status”.
The exception to this is a stretch of the River Mole upstream of Horley which is currently
achieving a good ecological status and a number of waterbodies which have a bad
ecological status, Lancing Brook in Horsham and Burstow Stream in Crawley, Reigate
and Banstead and Mid Sussex.
Also contributing to the good status not being achieved are diffuse sources of phosphate
from agriculture (livestock and poor nutrient management), and in some cases from
urban and transport sources.

Gatwick sub-region Water Cycle Study 131
Figure 9.2 WFD Cycle 2 – Ecological status of Watercourses in the study

Gatwick sub-region Water Cycle Study 132
Modelling Results
Section 9.1 outlines three questions to be answered in this study by the water quality
modelling:
• Could the development cause a greater than 10% deterioration in water quality?
• Could the development cause a deterioration in WFD class of any element
assessment?
• Could the development alone prevent the receiving watercourse from reaching
Good Ecological Status (GES) or Potential?
The first two questions were answered by adding the additional effluent flow from growth
into the baseline model and comparing the resulting water quality downstream of each
WwTW. The results of this assessment are presented in columns 4 and 5 in the Table
9.1. Where deterioration of 10% or more or a class deterioration was predicted, a further
run was carried out in SIMCAT with each WwTW discharging at the technically achievable
limit (TAL) to assess if deterioration could be prevented (reduced to 0%). This is shown
in column 6.
Additional effluent causes a deterioration of 10% or greater in one or more determinands
at fifteen of the 47 WwTWs assessed. In the majority of these, deterioration can be
prevented by treatment at the technically achievable limit.
At two WwTWs (Hogsmill and Rusper) deterioration could not be prevented, despite
treatment at TAL. TW have since advised that Rusper is due to close and wastewater
pumped to Crawley WwTW. Hogsmill WwTW serves growth in RBBC, Epsom and Ewell,
Kingston Upon Thames and Sutton, and RBBC only makes up 5% of the forecast growth
at this WwTW. The contribution of RBBC to deterioration at Hogsmill is therefore fairly
minor, however the total amount of growth from all Local Planning Authorities should be
considered by Thames Water when future upgrades are investigated.
At nine treatment works additional effluent flow leads to a deterioration in WFD class for
one or more determinands. In every case this can be prevented by treatment at TAL.
The results of this assessment are shown graphically in Figure 9.3. A green assessment
was given where there is a less than 10% deterioration and no deterioration in WFD
class in any determinand. In these cases, it can be said that there is environmental
capacity for growth. A WwTW was given an amber assessment where there was a
greater than 10% deterioration or a deterioration in class in one or determinand, but
this could be prevented by treatment at TAL. This indicates where a tightening of the
permit and/or upgrades to treatment processes may be required.
Where deterioration could not be prevented by treatment at TAL, a red assessment was
given. This indicates where environmental capacity could be a constraint to growth. In
these cases, the level of growth within that catchment may need to be reduced, or
wastewater pumped to an alternative WwTW.
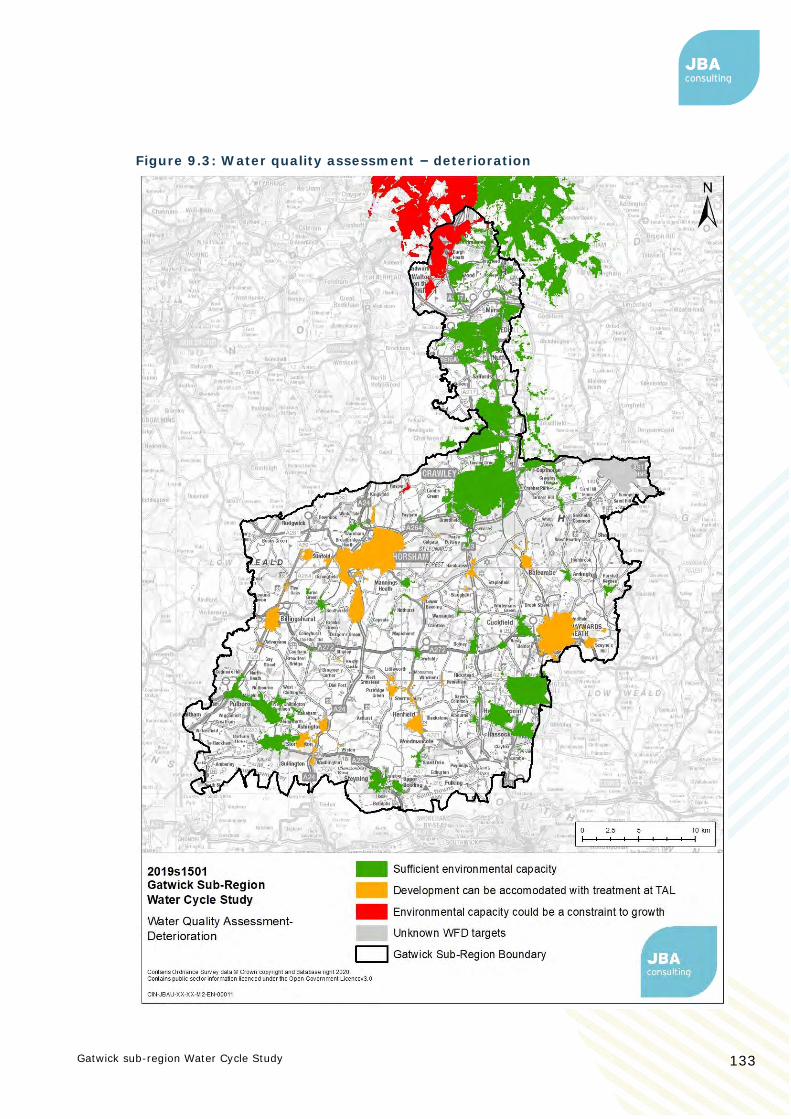
Gatwick sub-region Water Cycle Study 133
Figure 9.3: Water quality assessment – deterioration

Gatwick sub-region Water Cycle Study 134
The next assessment assumes that improvements have been made elsewhere in the
catchment, and upstream flow at each WwTW has achieved good ecological status.
SIMCAT then calculates the permit limit required to maintain Good Ecological Status
downstream of the WwTW. Where the permit limit is lower than TAL, it can be said that
Good Ecological Status cannot currently be achieved due to the limits of current
technology.
Column 7 shows whether growth can prevent good ecological status being achieved in
the future.
Where an “inconclusive” assessment was given this indicates that the maximum WFD
target for Phosphate used in the study area could be achieved, but not the minimum
(refer to the modelling methodology in section 9.2.2).
The results of this assessment are shown graphically in Figure 9.4. A green assessment
was given where GES cannot currently be achieved due to the limits of current
technology, and or it can be achieved current, and growth would not prevent this. An
amber assessment was given where the results were inconclusive (the result achieves
GES at the maximum target in the study area, but not the minimum). A red assessment
was given where growth could lead to GES being prevented in the future, i.e. GES was
achievable now if upstream water quality were improved but would not be in the future
with additional growth.
Henfield WwTW is the only WwTW where growth could prevent GES being achieved in
the future. However, the level of growth modelled is very unlikely to be served by
Henfield and is the subject of ongoing discussions between SW and the EA.
The EA have advised that a number of options have been discussed already including a
new wastewater treatment works that could serve the community. It should be noted
that a significant investment such as a new WwTW would have a lead time up to five
years so as discussed in section 7.4.4 development in this area would need careful
phasing.
The Environment Agency recommend that third party agreements should not be
restricted to infrastructure improvements but should consider including provision for
developers to fund pre- and post-development monitoring, to ensure that their
development does not lead to deterioration of water body status.
This assessment should be read in conjunction with the environmental assessment in
section 11.

Gatwick sub-region Water Cycle Study 135
Figure 9.4: Water quality results – GES assessment
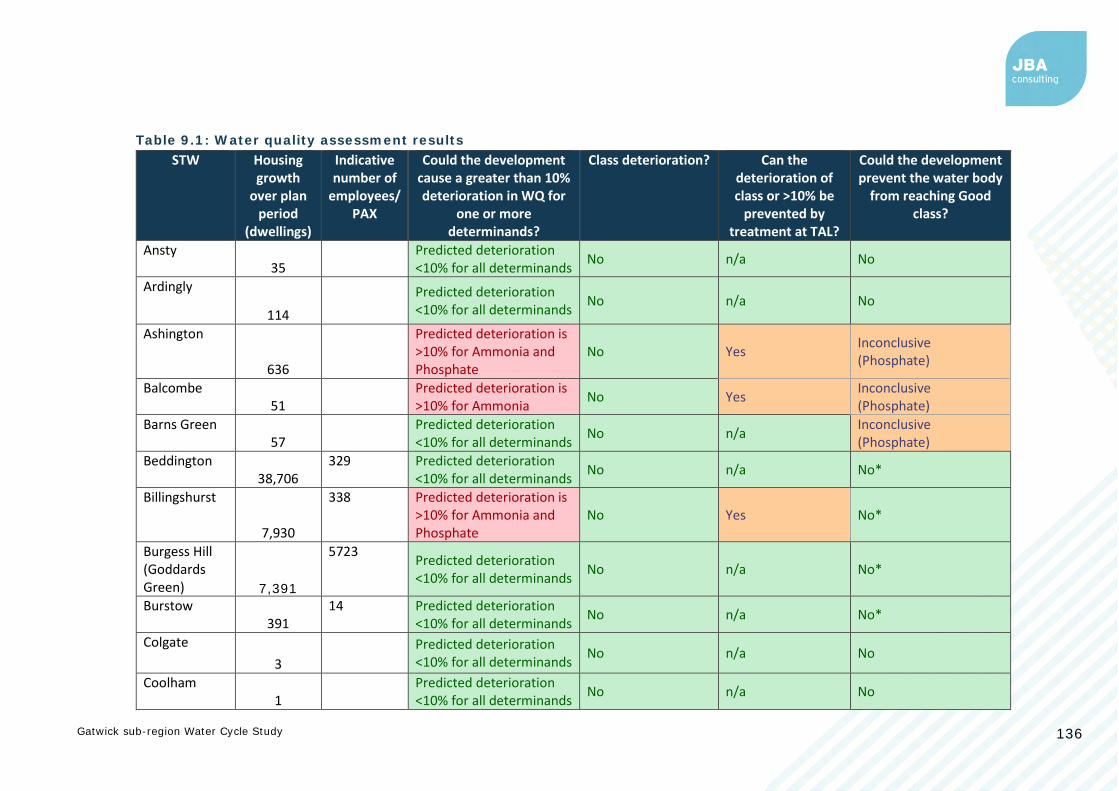
Gatwick sub-region Water Cycle Study 136
Table 9.1: Water quality assessment results
STW Housing growth
over plan period
(dwellings)
Indicative number of
employees/ PAX
Could the development cause a greater than 10% deterioration in WQ for
one or more determinands?
Class deterioration? Can the deterioration of class or >10% be
prevented by treatment at TAL?
Could the development prevent the water body
from reaching Good class?
Ansty 35
Predicted deterioration <10% for all determinands
No n/a No
Ardingly
114
Predicted deterioration <10% for all determinands
No n/a No
Ashington
636
Predicted deterioration is >10% for Ammonia and Phosphate
No Yes Inconclusive (Phosphate)
Balcombe 51
Predicted deterioration is >10% for Ammonia
No Yes Inconclusive (Phosphate)
Barns Green 57
Predicted deterioration <10% for all determinands
No n/a Inconclusive (Phosphate)
Beddington 38,706
329 Predicted deterioration <10% for all determinands
No n/a No*
Billingshurst
7,930
338 Predicted deterioration is >10% for Ammonia and Phosphate
No Yes No*
Burgess Hill (Goddards Green) 7,391
5723 Predicted deterioration <10% for all determinands
No n/a No*
Burstow 391
14 Predicted deterioration <10% for all determinands
No n/a No*
Colgate
3
Predicted deterioration <10% for all determinands
No n/a No
Coolham 1
Predicted deterioration <10% for all determinands
No n/a No

Gatwick sub-region Water Cycle Study 137
STW Housing growth
over plan period
(dwellings)
Indicative number of
employees/ PAX
Could the development cause a greater than 10% deterioration in WQ for
one or more determinands?
Class deterioration? Can the deterioration of class or >10% be
prevented by treatment at TAL?
Could the development prevent the water body
from reaching Good class?
Cowfold 115
Predicted deterioration <10% for all determinands
No n/a Inconclusive (Phosphate)
Crawley
22,717
44,706
Predicted deterioration <10% for all determinands
No n/a No*
Cuckfield 80
Predicted deterioration <10% for all determinands
No n/a Inconclusive (Phosphate)
Eden Vale 703
Predicted deterioration <10% for all determinands
Unknown WFD Standards
n/a Unknown WFD Standards
Faygate 86
Predicted deterioration <10% for all determinands
No n/a No
Felbridge 994
896 Predicted deterioration <10% for all determinands
Unknown WFD Standards
n/a Unknown WFD Standards
Handcross
189
Predicted deterioration is >10% for BOD and Ammonia
BOD class deterioration from Poor to Bad - can be prevented by treatment at TAL
Yes Inconclusive (Phosphate)
Henfield
7,657
Predicted deterioration is >10% for all determinands
All determinands deteriorate in class which can be prevented by treatment at TAL
Yes Yes (Ammonia and inconclusive Phosphate)
Hogsmill
44,306
46 Predicted deterioration is >10% for Ammonia and Phosphate
No No No*
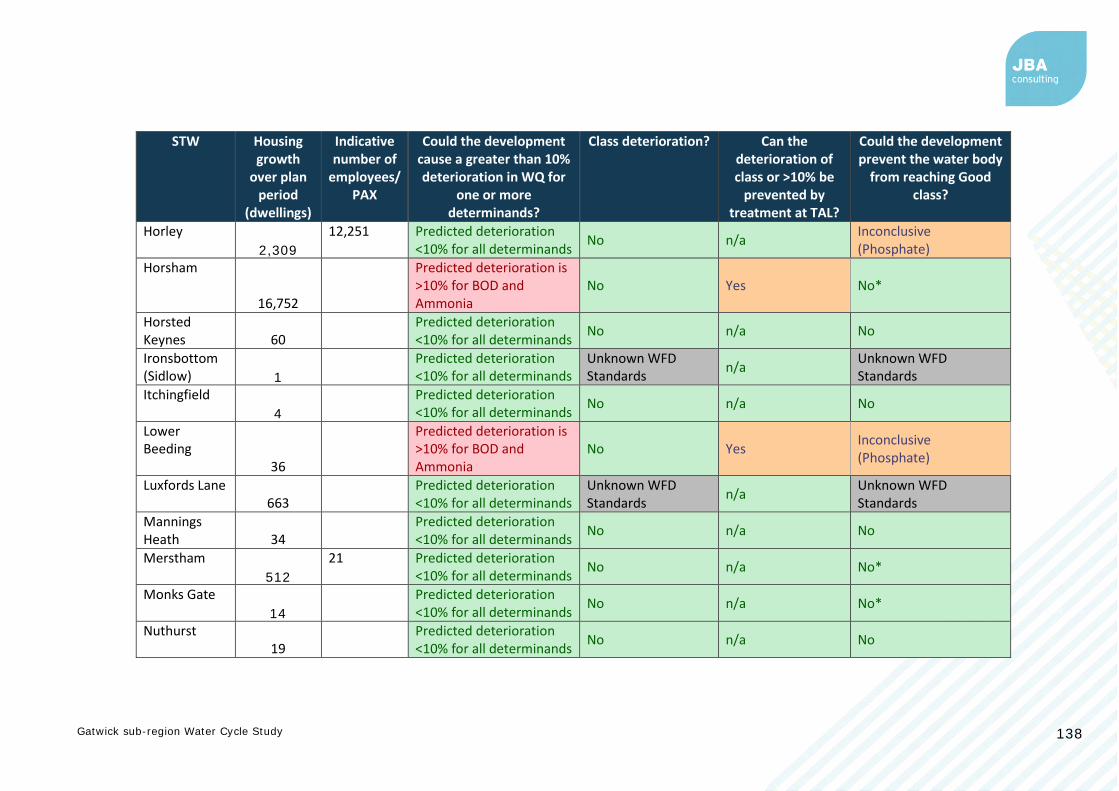
Gatwick sub-region Water Cycle Study 138
STW Housing growth
over plan period
(dwellings)
Indicative number of
employees/ PAX
Could the development cause a greater than 10% deterioration in WQ for
one or more determinands?
Class deterioration? Can the deterioration of class or >10% be
prevented by treatment at TAL?
Could the development prevent the water body
from reaching Good class?
Horley
2,309
12,251 Predicted deterioration <10% for all determinands
No n/a Inconclusive (Phosphate)
Horsham
16,752
Predicted deterioration is >10% for BOD and Ammonia
No Yes No*
Horsted Keynes 60
Predicted deterioration <10% for all determinands
No n/a No
Ironsbottom (Sidlow) 1
Predicted deterioration <10% for all determinands
Unknown WFD Standards
n/a Unknown WFD Standards
Itchingfield
4
Predicted deterioration <10% for all determinands
No n/a No
Lower Beeding
36
Predicted deterioration is >10% for BOD and Ammonia
No Yes Inconclusive (Phosphate)
Luxfords Lane 663
Predicted deterioration <10% for all determinands
Unknown WFD Standards
n/a Unknown WFD Standards
Mannings Heath 34
Predicted deterioration <10% for all determinands
No n/a No
Merstham
512
21 Predicted deterioration <10% for all determinands
No n/a No*
Monks Gate
14
Predicted deterioration <10% for all determinands
No n/a No*
Nuthurst 19
Predicted deterioration <10% for all determinands
No n/a No
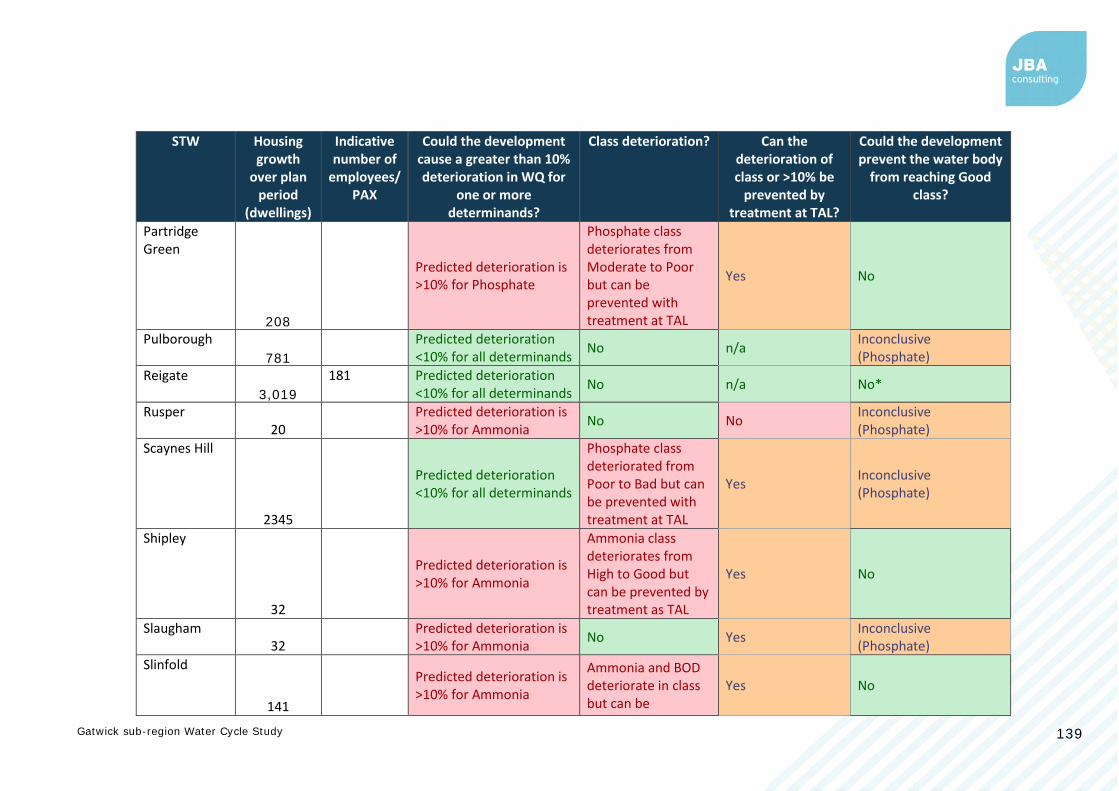
Gatwick sub-region Water Cycle Study 139
STW Housing growth
over plan period
(dwellings)
Indicative number of
employees/ PAX
Could the development cause a greater than 10% deterioration in WQ for
one or more determinands?
Class deterioration? Can the deterioration of class or >10% be
prevented by treatment at TAL?
Could the development prevent the water body
from reaching Good class?
Partridge Green
208
Predicted deterioration is >10% for Phosphate
Phosphate class deteriorates from Moderate to Poor but can be prevented with treatment at TAL
Yes No
Pulborough
781
Predicted deterioration <10% for all determinands
No n/a Inconclusive (Phosphate)
Reigate
3,019
181 Predicted deterioration <10% for all determinands
No n/a No*
Rusper 20
Predicted deterioration is >10% for Ammonia
No No Inconclusive (Phosphate)
Scaynes Hill
2345
Predicted deterioration <10% for all determinands
Phosphate class deteriorated from Poor to Bad but can be prevented with treatment at TAL
Yes Inconclusive (Phosphate)
Shipley
32
Predicted deterioration is >10% for Ammonia
Ammonia class deteriorates from High to Good but can be prevented by treatment as TAL
Yes No
Slaugham 32
Predicted deterioration is >10% for Ammonia
No Yes Inconclusive (Phosphate)
Slinfold
141
Predicted deterioration is >10% for Ammonia
Ammonia and BOD deteriorate in class but can be
Yes No

Gatwick sub-region Water Cycle Study 140
STW Housing growth
over plan period
(dwellings)
Indicative number of
employees/ PAX
Could the development cause a greater than 10% deterioration in WQ for
one or more determinands?
Class deterioration? Can the deterioration of class or >10% be
prevented by treatment at TAL?
Could the development prevent the water body
from reaching Good class?
prevented with treatment at TAL
Small Dole 26
Predicted deterioration <10% for all determinands
No n/a No
Steyning 147
Predicted deterioration <10% for all determinands
No n/a No*
Storrington 445
Predicted deterioration <10% for all determinands
No n/a No*
Warnham
83
Predicted deterioration <10% for all determinands
No n/a No
Warninglid
1
Predicted deterioration <10% for all determinands
No n/a No
Wineham
2
Predicted deterioration is >10% for Phosphate
BOD class deteriorates from High to Good but can be prevented with treatment at TAL
Yes No
Wiston
2
Predicted deterioration is >10% for Ammonia and Phosphate
Ammonia and Phosphate classes deteriorate, but can be prevented with treatment at TAL
Yes No
*the ecological status at these locations cannot reach Good class even without the addition of development, hence it is not what
prevents the waterbody from reaching a Good class.

Gatwick sub-region Water Cycle Study 141
Priority substances
As well as the physico-chemical water quality elements (BOD, Ammonia, Phosphate etc.)
addressed above, a watercourse can fail to achieve Good Ecological Status due to
exceeding permissible concentrations of hazardous substances. Currently 33 substances
are defined as hazardous or priority hazardous substances, with others under review.
Such substances may pose risks both to humans (when contained in drinking water) and
to aquatic life and animals feeding in aquatic life. These substances are managed by a
range of different approaches, including EU and international bans on manufacturing and
use, targeted bans, selection of safer alternatives and end-of-pipe treatment solutions.
There is considerable concern within the UK water industry that regulation of these
substances by setting permit values which require their removal at wastewater
treatment works will place a huge cost burden upon the industry and its customers, and
that this approach would be out of keeping with the "polluter pays" principle.
We also consider how the planning system might be used to manage priority substances:
• Industrial sources – whilst this report covers potential employment sites, it
doesn't consider the type of industry and therefore likely sources of priority
substances are unknown. It is recommended that developers should discuss
potential uses which may be sources of priority substances from planned
industrial facilities at an early stage with the EA and, where they are seeking a
trade effluent consent, with the sewerage undertaker.
• Agricultural sources - There is limited scope for the planning system to change or
regulate agricultural practices. UK water companies are involved in a range of
“Catchment-based Approach” schemes aimed at reducing diffuse sources of
pollutants, including agricultural pesticides.
• Surface water runoff sources - some priority substances e.g. heavy metals, are
present in urban surface water runoff. It is recommended that future
developments would manage these sources by using SuDS that provide water
quality treatment, designed following the CIRIA SuDS Manual. This is covered in
more detail in sections 11.8.1 and 11.8.2.
• Domestic wastewater sources - some priority substances are found in domestic
wastewater as a result of domestic cleaning chemicals, detergents,
pharmaceuticals, pesticides or materials used within the home. Whilst an
increase in the population due to housing growth could increase the total volumes
of such substances being discharged to the environment, it would be more
appropriate to manage these substances through regulation at source, rather
than through restricting housing growth through the planning system.
No further analysis of priority substances will be undertaken as part of this study.
9.4 Conclusions
The impact of increased discharges of treated effluent as a result of growth in Gatwick
Sub-Region has been assessed using the EA’s SIMCAT modelling tool. The following
conclusions were drawn:
• Growth could cause a deterioration in water quality at many sites in the study
area. In most cases this can be prevented by treatment at the technically
achievable limit.
• At Hogsmill and Rusper, deterioration cannot be prevented by treatment at TAL,
although TW advise that Rusper will be closed and flows diverted to Crawley
WwTW. Additional flows from Rusper WwTW into Crawley WwTW would have a
negligible impact on water quality.
• At Henfield WwTW, growth could prevent good ecological status being achieved
in the future.

Gatwick sub-region Water Cycle Study 142
9.5 Recommendations
Table 9.2 Water quality recommendations
Action Responsibility Timescale
Provide annual monitoring reports to SW and TW detailing projected housing growth in the Local Authority
Councils Ongoing
Take into account the full volume of growth (from the Gatwick sub-region and neighbouring authorities) within the
catchment when considering WINEP schemes or upgrades at WwTW
SW, TW Ongoing
Identify options to accommodate growth at Henfield WwTW
SW, EA Aligned with projected growth plan
The impact on downstream protected sites (including SACs, SPAs, SSSIs,
Ramsar, and priority habitats) should be considered
Councils, SW, TW,
NE, EA Ongoing
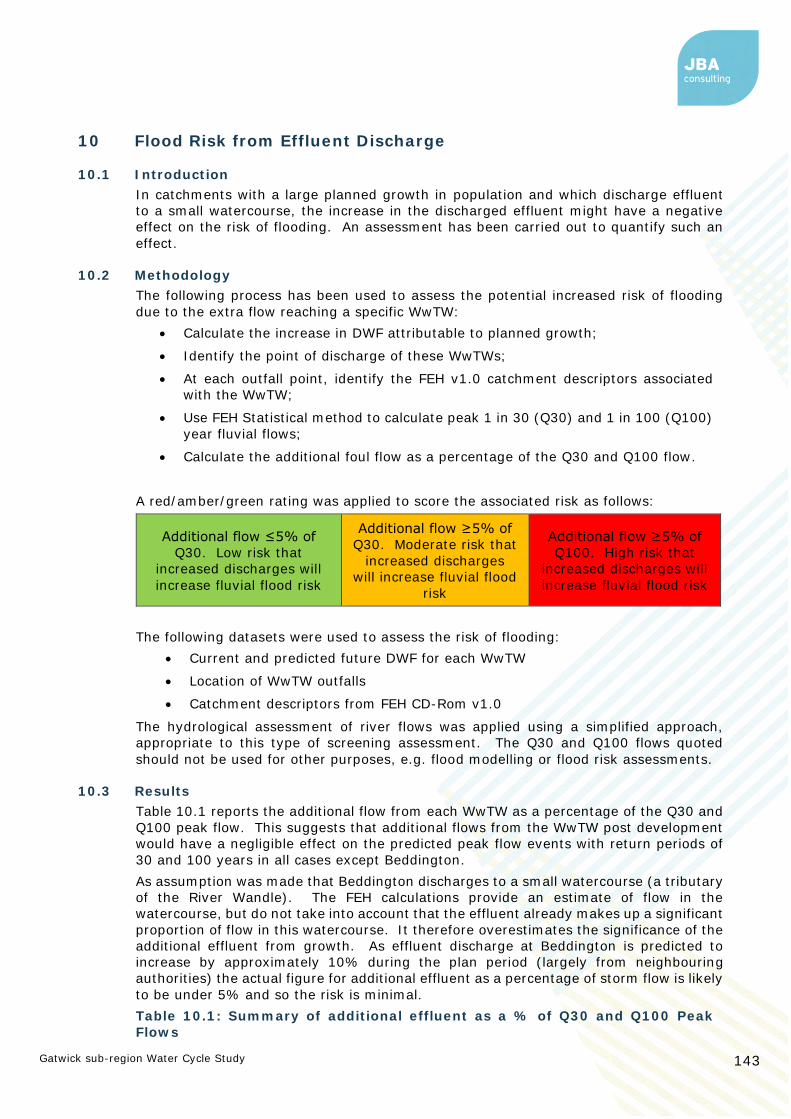
Gatwick sub-region Water Cycle Study 143
10 Flood Risk from Effluent Discharge
10.1 Introduction
In catchments with a large planned growth in population and which discharge effluent
to a small watercourse, the increase in the discharged effluent might have a negative
effect on the risk of flooding. An assessment has been carried out to quantify such an
effect.
10.2 Methodology
The following process has been used to assess the potential increased risk of flooding
due to the extra flow reaching a specific WwTW:
• Calculate the increase in DWF attributable to planned growth;
• Identify the point of discharge of these WwTWs;
• At each outfall point, identify the FEH v1.0 catchment descriptors associated
with the WwTW;
• Use FEH Statistical method to calculate peak 1 in 30 (Q30) and 1 in 100 (Q100)
year fluvial flows;
• Calculate the additional foul flow as a percentage of the Q30 and Q100 flow.
A red/amber/green rating was applied to score the associated risk as follows:
Additional flow ≤5% of
Q30. Low risk that
increased discharges will
increase fluvial flood risk
Additional flow ≥5% of
Q30. Moderate risk that
increased discharges
will increase fluvial flood
risk
Additional flow ≥5% of
Q100. High risk that
increased discharges will
increase fluvial flood risk
The following datasets were used to assess the risk of flooding:
• Current and predicted future DWF for each WwTW
• Location of WwTW outfalls
• Catchment descriptors from FEH CD-Rom v1.0
The hydrological assessment of river flows was applied using a simplified approach,
appropriate to this type of screening assessment. The Q30 and Q100 flows quoted
should not be used for other purposes, e.g. flood modelling or flood risk assessments.
10.3 Results
Table 10.1 reports the additional flow from each WwTW as a percentage of the Q30 and
Q100 peak flow. This suggests that additional flows from the WwTW post development
would have a negligible effect on the predicted peak flow events with return periods of
30 and 100 years in all cases except Beddington.
As assumption was made that Beddington discharges to a small watercourse (a tributary
of the River Wandle). The FEH calculations provide an estimate of flow in the
watercourse, but do not take into account that the effluent already makes up a significant
proportion of flow in this watercourse. It therefore overestimates the significance of the
additional effluent from growth. As effluent discharge at Beddington is predicted to
increase by approximately 10% during the plan period (largely from neighbouring
authorities) the actual figure for additional effluent as a percentage of storm flow is likely
to be under 5% and so the risk is minimal.
Table 10.1: Summary of additional effluent as a % of Q30 and Q100 Peak
Flows

Gatwick sub-region Water Cycle Study 144
WwTW FEH
stat
Q30
(m3/s)
FEH stat
Q100
(m3/s)
Additional
effluent
(m3/s)
Flow
increase
as % of
Q30
Flow
increase
as % of
Q100
Ansty 33.81 43.99 0.015 0.05 0.03
Ardingly 46.26 65.41 0.050 0.11 0.08
Ashington 4.06 5.58 0.0024 0.06 0.04
Balcombe 16.73 22.45 0.0003 0.00 0.00
Barns Green 7.19 9.89 0.018 0.25 0.18
Beddington 0.44 0.60 0.1505 34.18 25.03
Billingshurst 3.72 5.04 0.0296 0.80 0.59
Burgess Hill
(Goddards
Green)
33.15 43.14 0.0440 0.13 0.10
Burstow 20.13 26.45 0.0015 0.01 0.01
Colgate 6.86 9.55 0.013 0.19 0.13
Coolham 10.72 14.70 0.000 0.00 0.00
Cowfold 7.16 9.86 0.037 0.51 0.37
Crawley 14.78 19.46 0.1517 1.03 0.78
Cuckfield 8.43 11.55 0.0004 0.00 0.00
Eden Vale 1.26 1.70 0.0036 0.28 0.21
Faygate 4.24 5.81 0.027 0.65 0.47
Felbridge 7.06 9.72 0.0060 0.08 0.06
Handcross 2.80 3.85 0.083 2.97 2.16
Henfield 18.09 24.27 0.0281 0.16 0.12
Hogsmill 23.98 32.75 0.1577 0.66 0.48
Horley 0.78 1.07 0.0224 2.88 2.09
Horsham 32.78 46.10 0.0626 0.19 0.14
Horsted Keynes 9.20 12.65 0.027 0.29 0.21
Ironsbottom
(Sidlow)
113.36 158.19 0.000 0.00 0.00
Itchingfield 5.41 7.43 0.001 0.02 0.01
Lower Beeding 5.52 7.57 0.011 0.21 0.15
Luxfords Lane 8.31 11.47 0.0034 0.04 0.03
Mannings
Heath
4.29 5.70 0.011 0.25 0.19
Merstham 1.93 2.65 0.0020 0.10 0.08
Monks Gate 2.26 3.05 0.004 0.20 0.15
Nuthurst 3.16 4.34 0.006 0.19 0.14
Partridge Green 19.46 26.20 0.0008 0.00 0.00
Pulborough 7.05 9.27 0.0029 0.04 0.03
Reigate 2.94 4.06 0.0119 0.41 0.29
Rusper 4.57 6.17 0.009 0.19 0.14
Scaynes Hill 62.54 79.58 0.0120 0.02 0.02
Shipley 38.35 50.60 0.010 0.03 0.02
Slaugham 2.28 3.13 0.014 0.63 0.46

Gatwick sub-region Water Cycle Study 145
WwTW FEH
stat
Q30
(m3/s)
FEH stat
Q100
(m3/s)
Additional
effluent
(m3/s)
Flow
increase
as % of
Q30
Flow
increase
as % of
Q100
Slinfold 82.37 112.05 0.045 0.05 0.04
Small Dole 8.01 11.02 0.008 0.10 0.07
Steyning 5.01 6.94 0.0005 0.01 0.01
Storrington 1.05 1.41 0.0016 0.16 0.12
Warnham 18.95 26.32 0.0003 0.00 0.00
Warninglid 2.13 2.93 0.000 0.00 0.00
Wineham 68.02 88.68 0.001 0.00 0.00
Wiston 5.85 8.09 0.000 0.00 0.00
10.4 Conclusions
The impact of increased effluent flows is not predicted to have a significant impact upon
flood risk in any of the receiving watercourses.
Increases in discharges of treated wastewater effluent as a result of growth
are not expected to significantly increase flood risk.
10.5 Recommendations
Table 10.2: Recommendations from the Flood Risk Assessment
Action Responsibility Timescale
Proposals to increase discharges to a watercourse may also require a flood risk activities environmental permit from the EA (in the case of discharges to Main River), or a land drainage consent from the Lead Local Flood Authority (in the case of discharges to an Ordinary
Watercourse).
SW, TW During design of WwTW upgrades

Gatwick sub-region Water Cycle Study 146
11 Environmental Opportunities and Constraints
11.1 Introduction
Development has the potential to cause an adverse impact on the environment through
a number of routes, such as worsening of air quality, pollution to the aquatic environment
or disturbance to wildlife. In the context of a Water Cycle Study, the impact of
development on the aquatic environment is under assessment.
A source-pathway-receptor approach can be taken to investigate the risk and identify
where further assessment or action is required.
11.2 Sources of pollution
Water pollution is usually categorised as either diffuse or point source. Point source
sources come from a single well-defined point, an example being the discharge from a
WwTW. Section 9 models the WwTW serving growth within the Gatwick sub-region as
point sources of pollution and predicts the likely concentration of pollutants downstream.
Diffuse pollution is defined as “unplanned and unlicensed pollution from farming, old
mine workings, homes and roads. It includes urban and rural activity and arises from
industry, commerce, agriculture and civil functions and the way we live our lives.”
Examples of diffuse sources of water pollution include:
• Contaminated runoff from roads – this can include metals and chemicals
• Drainage from housing estates
• Misconnected sewers (foul drains to surface water drains)
• Accidental chemical/oil spills from commercial sites
• Surplus nutrients, pesticides and eroded soils from farmland
• Septic tanks and non-mains sewer systems
The most likely sources of diffuse pollution from new developments include drainage
from housing estates, runoff from roads and discharges from commercial and industrial
premises. The pollution risk posed by a site will depend on the sensitivity of the receiving
environment, the pathway between the source of the runoff and the receiving waters,
and the level of dilution available. After or during heavy rainfall, the first flush of water
carrying accumulated dust and dirt is often highly polluting.
Whilst the threat posed by an individual site may be low, a number of sites together may
pose a cumulative impact within the catchment.
Runoff from development sites should be managed by a suitably designed SuDS scheme,
more information on SuDS can be found in section 11.8.Potential impacts on receiving
surface waters include the blanketing of riverbeds with sediment, a reduction in light
penetration from suspended solids, and a reduction in natural oxygen levels, all of which
can lead to a loss in biodiversity.
11.3 Pathways
Pollutants can take a number of different pathways from their source to a “receptor” – a
habitat or species that can be impacted. This could be overland via surface water flow
paths, via the river system, or via groundwater or a combination of all three.
11.4 Receptors
A receptor in this case is a habitat or species that is adversely impacted by a pollutant.
Both the rivers and groundwater as well as being pathways, can also be considered to
be receptors, and the impact on the ecological status of rivers as defined within the
Water Framework Directive is the subject of Section 9. Groundwater bodies are also
given a status under the WFD which is reported in Section 4.1.3 for the groundwater
bodies within the Gatwick sub-region.

Gatwick sub-region Water Cycle Study 147
Within the study area and downstream are many sites with environmental designations
such as:
• Special Areas of Conservation (SAC)
• Special Protection Areas (SPA)
• Sites of Special Scientific Interest (SSSI)
• Ramsar sites (Wetlands of International Importance)
• Priority Habitats and Priority Headwaters
A description of these, and the relevant legislation that defines and protects them, can
be found in section 3.5 to 3.7.
11.5 Assessment of impact risk
Methodology
Due to the large number of sources (49 WwTWs) and receptors the study area was
divided into river catchments for further analysis. In the case of the River Adur, River
Arun and River Ouse, the catchments was extended down to the coast. For the River
Mole it was taken to its confluence with the River Thames, and for the River Eden and
River Medway catchments the assessment considers up until their confluence.
Section 9 presents an analysis of water quality downstream of each WwTW serving
growth in the study area. Equating a deterioration in water quality to a significant impact
at a protected site such as a SAC is difficult, but the data can be used to highlight areas
of risk for further analysis in the Habitats Regulations Assessment.
In order to identify protected sites that may be at risk, Flood Zone 2 from the Risk of
Flood from Rivers and the Sea mapping was used to define an area that was either by a
river, or could be reasonably expected to receive surface water from a river. Where a
WwTW was present in the catchment upstream of the protected site, the predicted
phosphate concentration in the adjacent waterbody was taken from the SIMCAT water
quality model. Where there were no WwTW serving growth upstream, these sites were
discounted as no deterioration would be predicted by the model, and the impact would
be minimal.
However, in these cases the overall catchment water quality should be considered where
for example they are designated for migratory fish species that may spend part of their
lifecycle elsewhere in the catchment.
Protected sites close to the coast are in transitional waters that are outside the SIMCAT
model. The nearest upstream modelled watercourse is therefore used as a proxy for
downstream water quality.
River Adur
Table 11.1 contains the protected sites that are within the Adur catchment, and adjacent
to a watercourse. Priority habitats are not included in this assessment, but their location
can be seen in Figure 11.1.
The Adur Estuary is a significant area of saltmarsh and intertidal mudflats important for
wading birds including the Ringed Plover for which the estuary is of national importance
for this species.
The Arun Valley is a transitional waterbody and outside the SIMCAT model for the South
East river basin. The downstream boundary of the waterbodies upstream of this location
(Adur East (Sakeham) and Adur (Lockbridge)) have therefore been used as a proxy for
the water quality further downstream.
The analysis in Table 11.2 suggests a significant deterioration in Phosphate concentration
of between 6 and 16% is possible in this location. However, treatment at the technically
achievable limit at WwTWs upstream could prevent this deterioration.

Gatwick sub-region Water Cycle Study 148
Table 11.1 Protected sites in the Adur catchment adjacent to watercourses
WwTW in
catchment
(Sources)
Adjacent
watercourse
(pathway)
Protected
site(s)
(Receptor)
Likely impact
WISTON
ITCHINGFIELD
BARNS GREEN
COOLHAM
SHIPLEY
NUTHURST
WINEHAM
GODDARDS GREEN
CUCKFIELD
PARTRIDGE GREEN
ANSTY
COWFOLD
HIGH CROSS
HENFIELD
SMALL DOLE
LOWER BEEDING
STEYNING
Woodsmill
Stream
Beeding Hill to
Newtimber Hill
(SSSI)
Low – no upstream
WwTW
Adur (Burgess
Hill)
Ditchling Common
(SSSI)
Low – no upstream
WwTW
Adur Estuary –
transitional
waterbody
Adur Estuary
(SSSI)
Impact possible
Table 11.2 Adur Estuary WQ Impact assessment
Protected
site
Adjacent
Waterbody
Protected site(s) (Receptor) Likely
impact
Adur Estuary SSSI
Adur Estuary
– transitional
waterbody –
Adur East
(Sakeham)
used as proxy
Baseline Phosphate Conc. (mg/l) 0.81
Future Phosphate Conc. (mg/l) 0.94
% Deterioration 16%
Phosphate Conc. After treatment at
TAL (mg/l)
0.27
Can deterioration be prevented? YES
Adur Estuary
– transitional
waterbody –
Adur
(Lockbridge)
used as proxy
Baseline Phosphate Conc. (mg/l) 0.52
Future Phosphate Conc. (mg/l) 0.55
% Deterioration 6%
Phosphate Conc. After treatment at
TAL (mg/l)
0.34
Can deterioration be prevented? YES

Gatwick sub-region Water Cycle Study 149
Figure 11.1 Protected sites within the Adur catchment

Gatwick sub-region Water Cycle Study 150
River Arun catchment
Table 11.3 contains the protected sites that are within the Adur catchment, and adjacent
to a watercourse. Priority habitats are not included in this assessment, but their location
can be seen in Figure 11.2.
The Arun Valley SAC is an area consisting predominantly of humid grassland, but also
containing, bogs, marshes, inland water bodies and deciduous woodland. The site is one
of the three main population centres of the Ramshorn Snail (Anisus vorticulus) in the UK
which is the qualifying feature for this site. The main threats this aquatic snail species
are land drainage, inappropriate habitat management and eutrophication. It can
therefore be said to be sensitive to an increase in nutrient load within the catchment.
It overlaps in extent with the Arun Valley SPA (designated for Bewick’s swan) and is
underpinned by three SSSIs (Amberley Wild Brooks, Pulborough Brooks, and Waltham
Brooks.
The Arun Valley is a transitional waterbody and outside the SIMCAT model for the South
East river basin. The downstream boundary of the waterbodies upstream of this location
(Western Rother and Stor) have therefore been used as a proxy for the water quality
downstream. The analysis predicts a deterioration in phosphate concentration in these
locations of between 5% and 7%. Treatment at the technically achievable limit at
WwTWs upstream could prevent this deterioration.
Natural England are currently reviewing the condition of the Arun Valley international
sites over the next twelve months and anticipate they will be in unfavourable condition.
The species the Special Area of Conservation is designated for is also likely to be found
to be in unfavourable conservation status, and this species is considered to be highly
water sensitive.
As a consequence, NE recommend a “nutrient neutrality” approach at all sites
discharging into this catchment. The aim of this type of approach is to ensure that the
pollutant load in the watercourse is the same after development as it was before. This
can be achieved through improvements in treatment processes at the WwTW, or through
catchment management schemes that would produce reductions in nutrient load to offset
the additional load from the development sites. Some options for nutrient reduction are
presented in 11.9, but further study is required in order to investigate how this approach
could be implemented in the Gatwick sub-region.
Table 11.3 Protected sites in the Arun catchment
WwTW in
catchment
(Sources)
Adjacent
watercourse
(pathway)
Protected
site(s)
(Receptor)
Likely impact
FAYGATE
WARNHAM
BILLINGSHURST
MANNINGS
HEATH
SLINFOLD
RUDGWICK
STORRINGTON
PULBOROUGH
HORSHAM
AMBERLEY
Arun (Transitional) Arun Valley SAC,
SPA and Ramsar
Impact possible
Kird The Mens (SAC) Low – no upstream
WwTW
Western Rother
(Upstream Petersfield)
East Hampshire
Hangers (SAC)
Low – no upstream
WwTW
Kird Ebernoe Common
SAC and SSSI
Low – no upstream
WwTW.
Arun (Transitional) Amberley Wild
Brooks (SSSI)
Impact possible
Western Rother Ambersham
Common (SSSI)
(SSSI)
Low – no upstream
WwTW.
Arun (Transitional) Arun Banks (SSSI) Impact possible

Gatwick sub-region Water Cycle Study 151
WwTW in
catchment
(Sources)
Adjacent
watercourse
(pathway)
Protected
site(s)
(Receptor)
Likely impact
Arun (Transitional) Arundel Park (SSSI) Impact possible
Western Rother Burton Park (SSSI) Low – no upstream
WwTW
Stor Chantry Mill (SSSI) Low – no upstream
WwTW
Loxwood Stream Chiddingfold Forest
(SSSI)
Low – no upstream
WwTW
Arun (Transitional) Climping Beach
(SSSI)
Impact possible
Western Rother Fyning Moor (SSSI) Impact possible
Elsted Stream Harting Downs
(SSSI)
Low – no upstream
WwTW
Stor Hurston Warren
(SSSI)
Impact possible
North River Leith Hill (SSSI) Low – no upstream
WwTW
Loxwood/Chiddingfold
Trib
Netherside Stream
Outcrops (SSSI)
Low – no upstream
WwTW
Western Rother
(Upsteam Petersfield)
Noar Hill (SSSI) Low – no upstream
WwTW
Arun Parham Park (SSSI) Impact possible
Western Rother Pulborough Brooks
(SSSI)
Low – no upstream
WwTW
Kird Shillinglee
Lake(SSSI)
Low – no upstream
WwTW
Arun Horsham Slinfold Stream and
Quarry (SSSI)
Impact possible
Arun Source St. Leonard's Forest
(SSSI)
Low – no upstream
WwTW
Kird The Mens (SSSI) Low – no upstream
WwTW
Arun (U/S Palingham) Upper Arun (SSSI)
Western Rother
(Upsteam Petersfield)
Upper Greensand
Hangers : Empshott
to Hawkley (SSSI)
Low – no upstream
WwTW
North River Vann Lake and
Ockley Woods
(SSSI)
Low – no upstream
WwTW
Arun Waltham Brooks
(SSSI)
Impact possible
Western Rother
(Upsteam Petersfield)
Wealden Edge
Hangers (SSSI)
Low – no upstream
WwTW
Western Rother
(Upsteam Petersfield)
Woolmer Forest
(SSSI)
Low – no upstream
WwTW
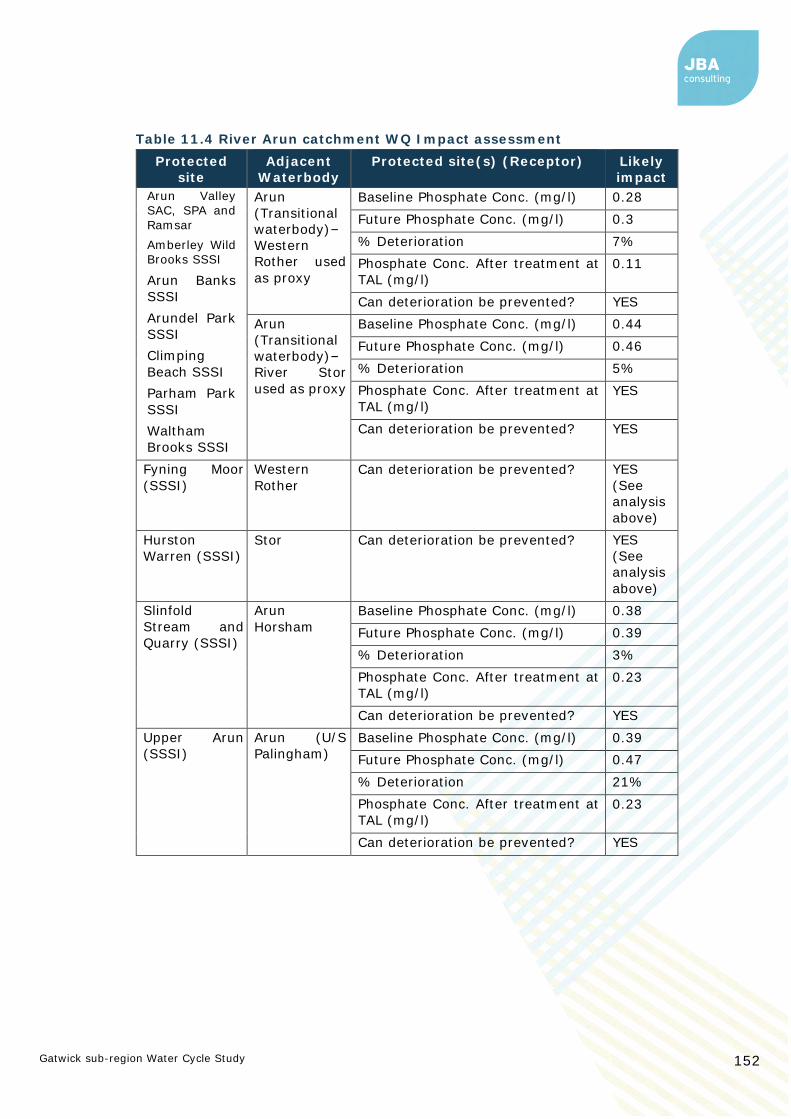
Gatwick sub-region Water Cycle Study 152
Table 11.4 River Arun catchment WQ Impact assessment
Protected
site
Adjacent
Waterbody
Protected site(s) (Receptor) Likely
impact
Arun Valley SAC, SPA and
Ramsar
Amberley Wild Brooks SSSI
Arun Banks
SSSI
Arundel Park
SSSI
Climping
Beach SSSI
Parham Park
SSSI
Waltham
Brooks SSSI
Arun
(Transitional
waterbody)–
Western
Rother used
as proxy
Baseline Phosphate Conc. (mg/l) 0.28
Future Phosphate Conc. (mg/l) 0.3
% Deterioration 7%
Phosphate Conc. After treatment at
TAL (mg/l)
0.11
Can deterioration be prevented? YES
Arun
(Transitional
waterbody)–
River Stor
used as proxy
Baseline Phosphate Conc. (mg/l) 0.44
Future Phosphate Conc. (mg/l) 0.46
% Deterioration 5%
Phosphate Conc. After treatment at
TAL (mg/l)
YES
Can deterioration be prevented? YES
Fyning Moor
(SSSI)
Western
Rother
Can deterioration be prevented? YES
(See
analysis
above)
Hurston
Warren (SSSI)
Stor Can deterioration be prevented? YES
(See
analysis
above)
Slinfold
Stream and
Quarry (SSSI)
Arun
Horsham
Baseline Phosphate Conc. (mg/l) 0.38
Future Phosphate Conc. (mg/l) 0.39
% Deterioration 3%
Phosphate Conc. After treatment at
TAL (mg/l)
0.23
Can deterioration be prevented? YES
Upper Arun
(SSSI)
Arun (U/S
Palingham)
Baseline Phosphate Conc. (mg/l) 0.39
Future Phosphate Conc. (mg/l) 0.47
% Deterioration 21%
Phosphate Conc. After treatment at
TAL (mg/l)
0.23
Can deterioration be prevented? YES
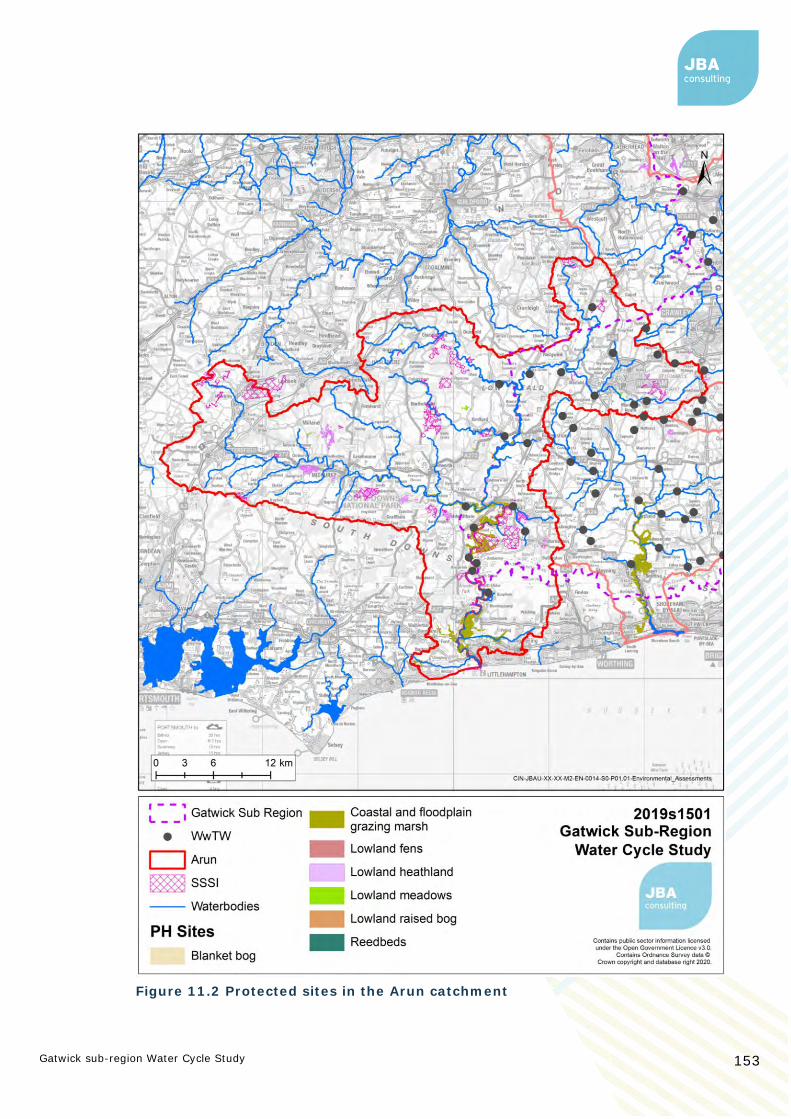
Gatwick sub-region Water Cycle Study 153
Figure 11.2 Protected sites in the Arun catchment

Gatwick sub-region Water Cycle Study 154
River Eden catchment
There are five SSSIs within this catchment that are on or close to a watercourse listed
in Table 11.5. The location of these is shown in Figure 11.3. One of these (Hedgecourt
SSSI) has WwTWs upstream and so a water quality impact is possible. Hedgecourt SSSI
is considered by Natural England to be the most important wetland site remaining in
south-east Surrey. It contains a range of habitats including woodland, grassland and
fen-marginated open water. The NE management advice suggests “Management should
ensure that appropriate water quality is maintained according to the requirements of the
wetland communities present. Where swamp is in continuity with a waterbody, the water
quality in the waterbody will affect the swamp. While some communities, such as reed
swamp are unlikely to be very sensitive to nutritional enrichment, others, such as tussock
sedge and narrow leaved reedmace, will be outcompeted by other species (e.g. reed or
reed sweet grass) where any increase in the amount of nutrients present occurs.”
Hedgecourt SSSI can, therefore, be considered to be at risk of deterioration as a result
of increased nutrients within the waterbody.
The change in phosphate concentration in Eden Brook adjacent to the SSSI is presented
in Table 11.6. The modelling predicts a 10% increase in phosphate concentration from
development during the plan period. However, the modelling also shows that this could
be prevented by improvements in treatment processes upstream.
Table 11.5 Protected sites in the River Eden catchment
WwTW in
catchment
(Sources)
Adjacent
watercourse
(pathway)
Protected
site(s)
(Receptor)
Likely impact
EDEN VALE
FELBRIDGE
Ray Brook Blindley Heath
(SSSI)
Low – no upstream
WwTW
Gibbs Brook Godstone Ponds
(SSSI)
Low – no upstream
WwTW
Eden Brook Hedgecourt (SSSI) Impact possible
Eden Brook Lingfield (SSSI) Low – no upstream
WwTW
Lower Eden Polebrook Farm
(SSSI)
Impact possible
Table 11.6 River Eden catchment WQ impact assessment
Protected
site
Adjacent
Waterbody
Protected site(s) (Receptor) Likely
impact
Hedgecourt SSSI
Eden Brook Baseline Phosphate Conc. (mg/l) 1.09
Future Phosphate Conc. (mg/l) 1.2
% Deterioration 10%
Phosphate Conc. After treatment
at TAL (mg/l)
0.23
Can deterioration be prevented? YES
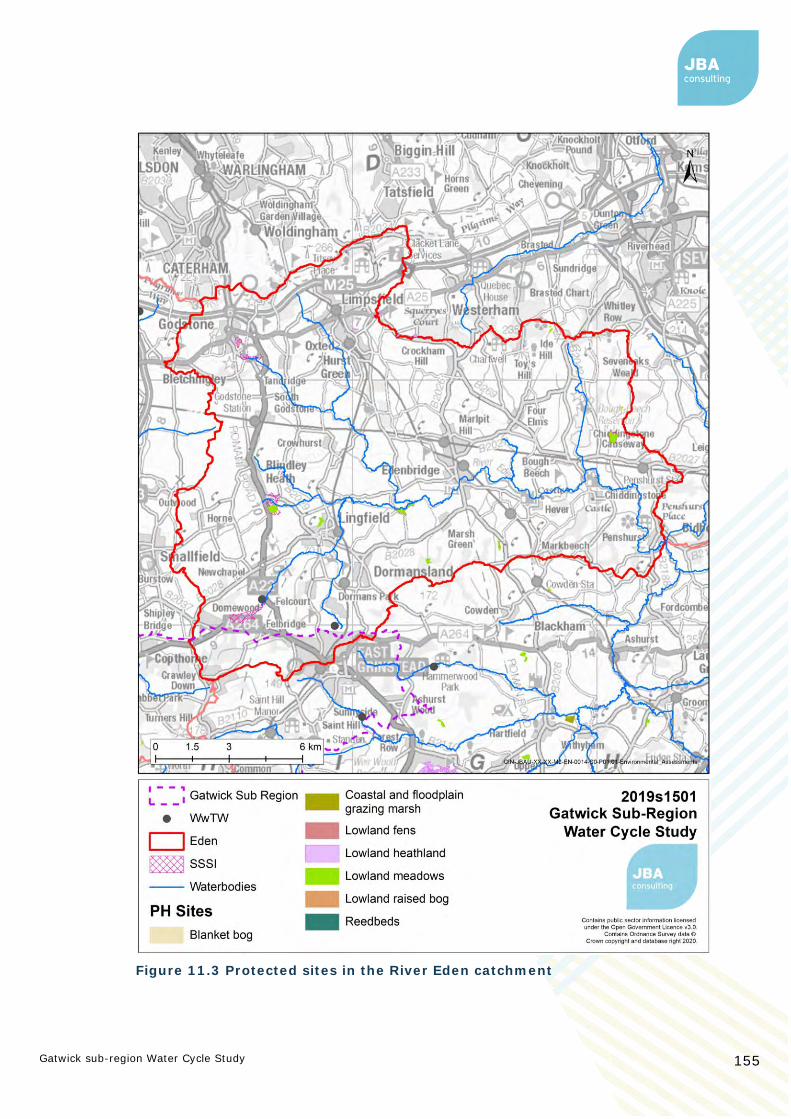
Gatwick sub-region Water Cycle Study 155
Figure 11.3 Protected sites in the River Eden catchment

Gatwick sub-region Water Cycle Study 156
River Mole catchment
There are four protected sites within this catchment that are on or adjacent to a
watercourse, these are listed in Table 11.7 and the location is shown in Figure 11.4. One
of these – Mole Gap to Reigate Escarpment is designated as both an SAC and a SSSI.
Of these five, Bookham Common SSSI is unlikely to be impacted by growth in the
Gatwick sub-region as no WwTWs serving growth were upstream. The phosphate
concentration in the River Mole at the downstream extent of the Horley to Hersham
reach was used to estimate the deterioration in water quality at the other four sites. The
model predicts there would be no deterioration in the Mole in this reach from growth
within the Gatwick Sub-region. Improvements in treatment processes at WwTWs
upstream would allow an improvement in water quality should it be required to offset
growth.
Table 11.7 Protected sites in the River Mole catchment
WwTW in
catchment
(Sources)
Adjacent
watercourse
(pathway)
Protected
site(s)
(Receptor)
Likely impact
COLGATE
IRONSBOTTOM
CRAWLEY
HORLEY
BURSTOW
RUSPER
REIGATE
(EARLSWOOD)
MERSTHAM
PEASE POTTAGE
Mole (Horley to
Hersham)
Mole Gap to
Reigate
Escarpment (SAC
and SSSI)
Impact possible
Downside Ditches
and Bookham
Brook
Bookham
Commons (SSSI)
Low – no upstream
WwTW
Mole (Horley to
Hersham)
Esher Commons
(SSSI)
Impact possible
Mole (Horley to
Hersham)
Reigate Heath
(SSSI)
Impact possible
Table 11.8 River Mole catchment WQ impact assessment
Protected
site
Adjacent
Waterbody
Protected site(s)
(Receptor)
Likely
impact
Mole Gap to Reigate Escarpment SAC and SSSI
Esher
Commons
Reigate
Heath
River Mole
(Horley to
Hersham)
Baseline Phosphate Conc.
(mg/l)
0.35
Future Phosphate Conc. (mg/l) 0.35
% Deterioration 0%
Phosphate Conc. After
treatment at TAL (mg/l)
0.14
Can deterioration be prevented? YES

Gatwick sub-region Water Cycle Study 157
Figure 11.4 Protected sites in the River Mole catchment

Gatwick sub-region Water Cycle Study 158
River Medway catchment
Within the River Medway catchment there are four sites, one of which, the Ashdown
Forest, is designated as a SAC, SPA and SSS and covers a large area at the south of this
catchment. These sites are listed in Table 11.9 and the location shown in Figure 11.5.
One designated site (Weir Wood Reservoir SSSI) has WwTWs upstream that are serving
in growth in Mid Sussex. Natural England advise that “conservation value is largely
determined by structural diversity and water quality. Increases in the amount of
nutrients within the waterbody can lead to a loss of aquatic plants in favour of excessive
growths of algae. This may result in a fundamental shift in the way a waterbody
functions, reducing plant and invertebrate abundance and diversity, both of which are
important food sources for a range of wetland birds.”
Table 11.10 presents an analysis of phosphate concentration in the River Medway at
Weir Wood, and the modelling does not predict an increase in phosphate concentration
from growth in the Gatwick sub-region. Further analysis shows that a reduction in
phosphate concentration could be achieved with improvements in treatment technology
upstream should it be required to offset growth.
Table 11.9 Protected sites in the River Medway catchment
WwTW in
catchment
(Sources)
Adjacent
watercourse
(pathway)
Protected
site(s)
(Receptor)
Likely impact
ASHURSTWOOD
LUXFORD LANE
WEST HOATHLEY
Pippingford Brook Ashdown Forest
SAC SPA and SSSI
Low – no upstream
WwTW
Eridge Stream Eridge Park (SSSI) Low – no upstream
WwTW
Grom High Rocks (SSSI) Low – no upstream
WwTW
Medway at Weir
Wood
Weir Wood
Reservoir (SSSI)
Impact possible
Table 11.10 River Medway catchment WQ impact assessment
Protected
site
Adjacent
Waterbody
Protected site(s) (Receptor) Likely
impact
Weir Wood Reservoir (SSSI)
Medway at
Weir Wood
Baseline Phosphate Conc. (mg/l) 0.29
Future Phosphate Conc. (mg/l) 0.29
% Deterioration 0%
Phosphate Conc. After treatment
at TAL (mg/l)
0.19
Can deterioration be prevented? YES

Gatwick sub-region Water Cycle Study 159
Figure 11.5 Protected sites in the River Medway catchment
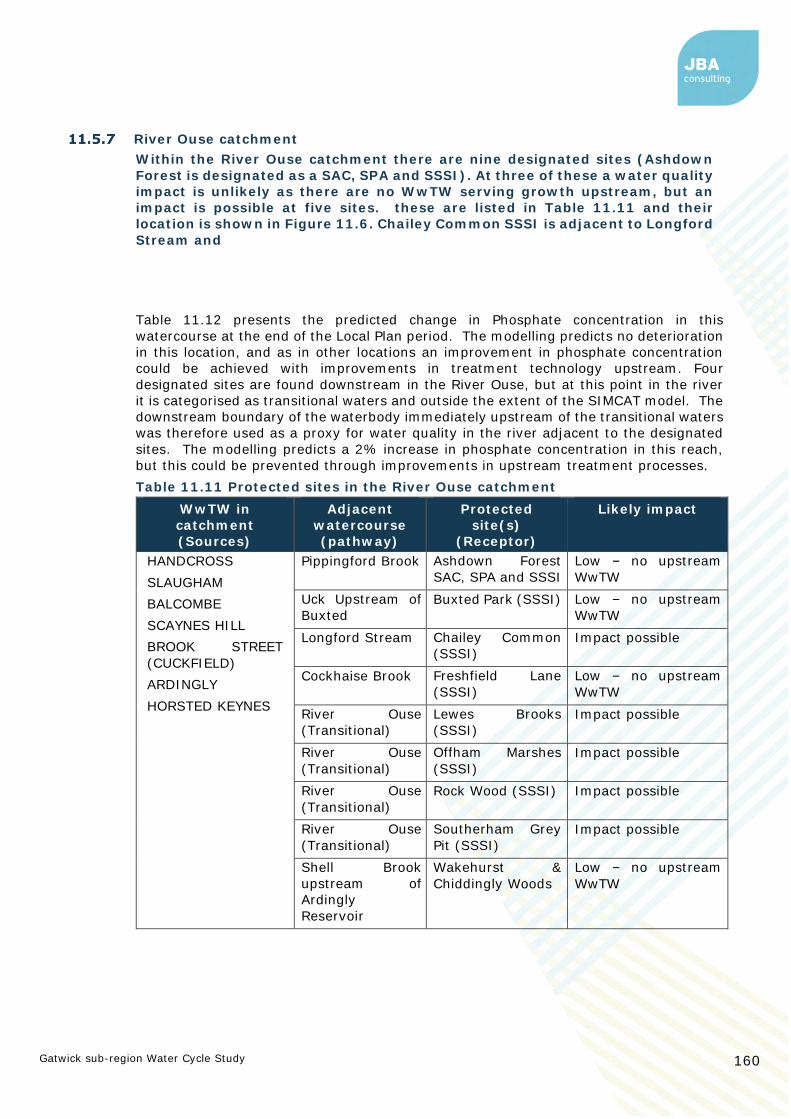
Gatwick sub-region Water Cycle Study 160
River Ouse catchment
Within the River Ouse catchment there are nine designated sites (Ashdown
Forest is designated as a SAC, SPA and SSSI). At three of these a water quality
impact is unlikely as there are no WwTW serving growth upstream, but an
impact is possible at five sites. these are listed in Table 11.11 and their
location is shown in Figure 11.6. Chailey Common SSSI is adjacent to Longford
Stream and
Table 11.12 presents the predicted change in Phosphate concentration in this
watercourse at the end of the Local Plan period. The modelling predicts no deterioration
in this location, and as in other locations an improvement in phosphate concentration
could be achieved with improvements in treatment technology upstream. Four
designated sites are found downstream in the River Ouse, but at this point in the river
it is categorised as transitional waters and outside the extent of the SIMCAT model. The
downstream boundary of the waterbody immediately upstream of the transitional waters
was therefore used as a proxy for water quality in the river adjacent to the designated
sites. The modelling predicts a 2% increase in phosphate concentration in this reach,
but this could be prevented through improvements in upstream treatment processes.
Table 11.11 Protected sites in the River Ouse catchment
WwTW in
catchment
(Sources)
Adjacent
watercourse
(pathway)
Protected
site(s)
(Receptor)
Likely impact
HANDCROSS
SLAUGHAM
BALCOMBE
SCAYNES HILL
BROOK STREET
(CUCKFIELD)
ARDINGLY
HORSTED KEYNES
Pippingford Brook Ashdown Forest
SAC, SPA and SSSI
Low – no upstream
WwTW
Uck Upstream of
Buxted
Buxted Park (SSSI) Low – no upstream
WwTW
Longford Stream Chailey Common
(SSSI)
Impact possible
Cockhaise Brook Freshfield Lane
(SSSI)
Low – no upstream
WwTW
River Ouse
(Transitional)
Lewes Brooks
(SSSI)
Impact possible
River Ouse
(Transitional)
Offham Marshes
(SSSI)
Impact possible
River Ouse
(Transitional)
Rock Wood (SSSI) Impact possible
River Ouse
(Transitional)
Southerham Grey
Pit (SSSI)
Impact possible
Shell Brook
upstream of
Ardingly
Reservoir
Wakehurst &
Chiddingly Woods
Low – no upstream
WwTW

Gatwick sub-region Water Cycle Study 161
Table 11.12 River Ouse catchment WQ impact assessment
Protected
site
Adjacent
Waterbody
Protected site(s)
(Receptor)
Likely
impact
Chailey Common SSSI
Longford
Stream
Baseline Phosphate Conc.
(mg/l)
0.76
Future Phosphate Conc. (mg/l) 0.76
% Deterioration 0%
Phosphate Conc. After
treatment at TAL (mg/l)
0.75
Can deterioration be
prevented?
YES
Lewes Brook
(SSSI)
Offham
Marshes
(SSSI)
Rock Wood
(SSSI)
Southerham
Grey Pit (SSSI)
River Ouse
transitional
waterbody –
Ouse
between
Isfield and
Coast used as
a proxy
Baseline Phosphate Conc.
(mg/l)
0.58
Future Phosphate Conc. (mg/l) 0.59
% Deterioration 2%
Phosphate Conc. After
treatment at TAL (mg/l)
0.23
Can deterioration be
prevented?
YES

Gatwick sub-region Water Cycle Study 162
Figure 11.6 Protected sites in the River Ouse catchment

Gatwick sub-region Water Cycle Study 163
11.6 Summary of water quality impact on protected sites
Section 11.5 presents the predicted water quality impact on protected sites within or
downstream of the Gatwick sub-region. In a number of cases, a deterioration in water
quality – presented here as where a deterioration in Phosphate concentration is predicted
in the watercourses adjacent to protected sites (SAC, SPAs, Ramsar sites, and SSSIs).
This deterioration could have a significant impact on designated species or habitats, but
this would need to be assessed further in the Habitats Regulations Assessment. In each
case it was found that improvements in wastewater treatment works upstream could
prevent this deterioration.
Other options for improvement in water quality are outlined below.

Gatwick sub-region Water Cycle Study 164
11.7 Protection and mitigation
Groundwater Protection
Groundwater is an important source of water in England and Wales.
The Environment Agency is responsible for the protection of “controlled waters” from
pollution under the Water Resources Act 1991. These controlled waters include all
watercourses and groundwater contained in underground strata.
The zones are based on an estimate of the time it would take for a pollutant which enters
the saturated zone of an aquifer to reach the source of abstraction or discharge point
(Zone 1 = 50 days, Zone 2 = 400 days, Zone 3 is the total catchment area). The
Environment Agency will use SPZs (alongside other datasets such as the Drinking Water
Protected Areas (DrWPAs) and aquifer designations as a screening tool to show:
• Areas where is would object in principle to certain potentially polluting activities,
or other activities that could damage groundwater,
• Areas where additional controls or restrictions on activities may be needed to
protect water intended for human consumption,
• How it prioritises responses to incidents.
The EA have published a position paper91 outlining its approach to groundwater
protection which includes direct discharges to groundwater, discharges of effluents to
ground and surface water runoff. This is of relevance to this water cycle study where a
development may manage surface water through SuDS.
Sewage and Trade Effluent
Discharge of treated sewage of 2m3 per day or less to ground are called small sewage
discharges (SSDs). The majority of SSDs do not require an environmental permit if they
comply with certain qualifying conditions. A permit will be required for all SSDs in source
protection zone 1 (SPZ1).
For treated sewage effluent discharges, the EA encourages the use of shallow infiltration
systems, which maximise the attenuation within the drainage blanket and the underlying
unsaturated zone. Whilst some sewage effluent discharges may not pose a risk to
groundwater quality individually, the cumulative risk of pollution from aggregations of
discharges can be significant. Improvement or pre-operational conditions may be
imposed before granting an environmental permit. The EA will only agree to
developments where the addition of new sewage effluent discharges to ground in an
area of existing discharges is unlikely to lead to an unacceptable cumulative impact.
Generally, the Environment Agency will only agree to developments involving release of
sewage effluent, trade effluent or other contaminated discharges to ground if it is
satisfied that it is not reasonable to make a connection to the public foul sewer. The EA
would normally expect to only permit new private discharges where the distance (in
metres) to connect to the nearest public sewer exceeds the number of dwellings
multiplied by 30. So, for example, a development of 100 dwellings would need to be
more than 3km from a public sewer. The developer would have to provide evidence of
why the proposed development cannot connect to the foul sewer in the planning
application. This position will not normally apply to surface water run-off via sustainable
drainage systems and discharges from sewage treatment works operated by sewerage
undertakers with appropriate treatment and discharge controls.
Deep infiltration systems (such as boreholes and shafts) are not generally accepted by
the EA for discharge of sewage effluent as they bypass soil layers and reduce the
opportunity for attenuation of pollutants.
———————————————————————————————————————————— 91 The Environment Agency’s approach to groundwater protection, Environment Agency (2018). Accessed online at: https://assets.publishing.service.gov.uk/government/uploads/system/uploads/attachment_data/file/692989/Envirnment-Agency-
approach-to-groundwater-protection.pdf on: 04/10/2019

Gatwick sub-region Water Cycle Study 165
Discharges of surface water run-off to ground at sites affected by land contamination,
or from sites for the storage of potential pollutants are likely to require an environmental
permit. This could include sites such as garage forecourts and coach and lorry parks.
These sites would be subject to a risk assessment with acceptable effluent treatment
provided.
Discharge of Clean Water
“Clean water” discharges such as runoff from roofs or from roads, may not require a
permit. However, they are still a potential source of groundwater pollution if they are
not appropriately designed and maintained.
Where infiltration SuDS schemes are proposed to manage surface runoff they should:
• Be suitably designed;
• Meet Government non-statutory technical standards92 for sustainable drainage
systems – these should be used in conjunction with the NPPF and PPG; and
• Use a SuDS management treatment train
A hydrogeological risk assessment is required where infiltration SuDS is proposed for
anything other than clean roof drainage in a SPZ1.
Source Protection Zones in the Gatwick Sub-Region
Source protection zones (SPZs) form a key part of the Environment Agency’s approach
to controlling the risk to groundwater supplies from potentially polluting activities and
accidental releases of pollutants.
The Source Protection Zones (SPZs) that are present in the Gatwick Sub-Region are
shown in Figure 11.7 and show that:
• Within Reigate and Banstead, there is a large SPZ system covering the northern
portion of the Local Authority.
• In Horsham, the southern boundary and south-western corner of the area is
covered by SPZs.
• In Mid Sussex, only the southern boundary is affected by SPZs.
• In Crawley there are no SPZs present.
The Environment Agency’s Manual for the Production of Groundwater Source Protection
Zones93, details position statements which provide information about the Environment
Agency's approach to managing and protecting groundwater.
In each Local Authority area, proposed developments location within or close to Source
Protection Zones, should be assessed in relation to the relevant Environment Agency
position statements.
———————————————————————————————————————————— 92 Sustainable Drainage Systems: non-statutory technical standards, Department for Environment, Food & Rural Affairs (2015).
Accessed online at:
https://www.gov.uk/government/publications/sustainable-drainage-systems-non-statutory-technical-standards on: 04/10/2019
93 Environment Agency. March 2019. Manual for the Production of Groundwater Source Protection Zones

Gatwick sub-region Water Cycle Study 166
Figure 11.7: Source Protection Zones in the Study Area

Gatwick sub-region Water Cycle Study 167
11.8 Surface Water Drainage and SuDS
Since April 201594, management of the rate and volume of surface water has been a
requirement for all major development sites, through the use of Sustainable Drainage
Systems (SuDS).
Lead Local Flood Authorities (LLFAs) are the statutory consultees to the planning system
for surface water management within major development, which covers the following
development scenarios:
• 10 or more dwellings
• a site larger than 0.5 hectares, where the number of dwellings is unknown
• a building greater than 1,000 square metres
• a site larger than 1 hectare
SuDS are drainage features which attempt to replicate natural drainage patterns,
through capturing rainwater at source, and releasing it slowly into the ground or a water
body. They can help to manage flooding through controlling the quantity of surface
water generated by a development and improve water quality by treating urban runoff.
SuDS can also deliver multiple benefits, through creating habitats for wildlife and green
spaces for the community. SuDS also have the advantage of providing effective Blue
and Green infrastructure and ecological and public amenity benefits when designed and
maintained properly.
National standards on the management of surface water are outlined within the Defra
Non-statutory Standards for Sustainable Drainage Systems95. The CIRIA C753 SuDS
Manual96 and Guidance for the Construction of SuDS97 provide the industry best practice
guidance for design and management of SuDS
Local guidance, provided by the Lead Local Flood Authorities covering the study area, is
detailed below:
Surrey County Council (SCC) is the Lead Local Flood Authority covering RBBC.
The SCC Suds Design Guidance98 document contains advice from the LLFA
relating to surface water drainage and sets out the minimum operating
requirements as required in the National Planning Policy Framework (NPPF). SCC
provides pre-application advice on submitting appropriate surface water drainage
strategies. SCC has also contributed to Water. People. Places – A Guide for
Masterplanning Sustainable Drainage into Developments. This document was
produced by the LLFAs in the South East of England.
• West Sussex County Council (WSCC) is the Lead Local Flood Authority covering
CBC, HDC and MSDC. WSCC’s Policy for the Management of Surface Water99 sets
out the requirements that the LLFA has for sustainable drainage and surface
water management provisions associated with new development. WSCC expect
that the principles of this policy and drainage strategy are considered for all
developments.
———————————————————————————————————————————— 94 Department for Communities and Local Government (2014) House of Commons: Written Statement (HCWS161) Written Statement
made by: The Secretary of State for Communities and Local Government (Mr Eric Pickles) on 18 Dec 2014. Available at: https://www.parliament.uk/documents/commons-vote-office/December%202014/18%20December/6.%20DCLG-sustainable-
drainage-systems.pdf on: 12/09/2019
95 Sustainable Drainage Systems, Non-statutory technical standards for sustainable drainage systems, DEFRA (2015) Accessed online
at:
https://assets.publishing.service.gov.uk/government/uploads/system/uploads/attachment_data/file/415773/sustainable-drainage-
technical-standards.pdf on: 12/09/2019
96 CIRIA Report C753 The SuDS Manual, CIRIA (2015). Accessed online at:
https://www.ciria.org/Memberships/The_SuDs_Manual_C753_Chapters.aspx on: 12/09/2019
97 Guidance on the Construction of SuDS (C768), CIRIA (2017), Accessed online at:
https://www.ciria.org/ItemDetail?iProductcode=C768&Category=BOOK on: 12/09/2019 98 Surrey County Council. July 2019. Surrey County Council – SuDS Design Guidance.
99 West Sussex County Council. November 2018. West Sussex LLFA – Policy for the Management of Surface Water.

Gatwick sub-region Water Cycle Study 168
Use of SuDS in Water Quality Management
SuDS allow the management of diffuse pollution generated by urban areas through the
sequential treatment of surface water reducing the pollutants entering lakes and rivers,
resulting in lower levels of water supply and wastewater treatment being required. This
treatment of diffuse pollution at source can contribute to meeting WFD water quality
targets, as well as national objectives for sustainable development.
This is usually facilitated via a SuDS Management Train of a number of components in
series that provide a range of treatment processes delivering gradual improvement in
water quality and providing an environmental buffer for accidental spills or unexpected
high pollutant loadings from the site. Considerations for SuDS design for water quality
are summarised in Figure 11.8 below.

Gatwick sub-region Water Cycle Study 169
Figure 11.8 Considerations for Suds Design for Water Quality
Manage surface water close to
source
•Where practicable, treatment systems should be designed to to be close to source of runoff
•It is easier to design effective treatment when the flow rate and pollutant loadings are relatively low
•Treatment provided can be proportionate to pollutant loadings
•Accidental spills or other pollution events can be isolated more easily without affecting the downstream drainage system
•Encourages ownership of pollution
•Poor treatment performance or component damage/failure can be dealt with more effectively without impacting on the whole site
Treat surface water runoff on
the surface
•Where practicable, treatment systems should be designed to be on the surface
•Where sediments are exposed to UV light, photolysis and volatilisation processes can act to break down contaminants
•If sediment is trapped in accessible parts of the SuDS, it can be removed more easily as part of maintenance
•It enables use of evapotranspiration and some infiltration to the ground to reduce runoff volumes and associated total contamination loads (provided risk to groundwater is managed appropriately)
•It allows treatment to be delivered by vegetation
•Sources of pollution can be easily identified
•Accidental spills or misconnections are visible immediately and can be dealt with rapidly
•Poor treatment performance can be easily identified during routine inspections, and remedial works can be planned efficiently
Treat surface water runoff to
remove a range of contaminants
•SuDS design should consider the likely presence and significant of any contaminant that may pose a risk to the receiving environment
•The SuDS component or combination of components selected should include treatment processes that, in combination, are likely to reduce this risk to acceptably low levels
Minimise risk of sediment
remobilisation
•The SuDS design should consider and mitigate the risks of sediments (and other contaminants) being remobilised and washed into receiving surface waters during events greater than those which the component has been specifically designed for
Minimise impacts from accidental
spills
•By using a number of components in series, SuDS can help insure that accidental spills are trapped in/on upstream component surfaces, facilitating contamination management and removal.
•The selected SuDS components should deliver a robust treatment design that manages risks appropriately - taking into account the uncertainty and variability of pollution loadings and treatment processes

Gatwick sub-region Water Cycle Study 170
Managing pollution close to its source can help keep pollutant levels and accumulation
rates low, allowing natural processes to be more effective. Treatment can often be
delivered within the same components that are delivering water quantity design criteria,
requiring no additional cost or land-take.
SuDS designs should control the ‘first flush’ of pollutants (usually mobilised by the first
5mm of rainfall) at source, to ensure contaminants are not released from the site. Best
practise is that no runoff should be discharged from the site to receiving watercourses
or sewers for the majority of small (e.g. less than 5mm) rainfall events.
Infiltration techniques will need to consider Groundwater Source Protection Zones and
are likely to require consultation with the Environment Agency. Early consideration of
SuDS within master planning will typically allow a more effective scheme to be designed.
Additional Benefits
Flood Risk
The Strategic Flood Risk Assessment contains recommendations for SuDS to manage
surface water on development sites, with the primary aim of reducing flood risk.
SuDS are most effective at reducing flood risk for relatively high intensity, short and
medium duration events, and are particularly important in mitigating potential increases
in surface water flooding, sewer flooding and flooding from small and medium sized
watercourses resulting from development.
Water Resources
A central principle of SuDS is the use of surface water as a resource. Traditionally,
surface water drainage involved the rapid disposal of rainwater, by conveying it directly
into a sewer or wastewater treatment works.
SuDS techniques such as rainwater harvesting, allow rainwater to be collected and re-
used as non-potable water supply within homes and gardens, reducing the demand on
water resources and supply infrastructure.
Climate Resilience
Climate projections for the UK suggest that winters may become milder and wetter and
summers may become warmer, but with more frequent higher intensity rainfall events,
particularly in the south east. This would be expected to increase the volume of runoff,
and therefore the risk of flooding from surface water, and diffuse pollution, and reduce
water availability.
SuDS offer a more adaptable way of draining surfaces, controlling the rate and volume
of runoff leaving urban areas during high intensity rainfall, and reducing flood risk to
downstream communities through storage and controlled release of rainwater from
development sites.
Through allowing rainwater to soak into the ground, SuDS are effective at retaining soil
moisture and groundwater levels, which allows the recharge of the watercourses and
underlying aquifers. This is particularly important where water resource availability is
limited, and likely to become increasingly scare under future drier climates.
Biodiversity
The water within a SuDS component is an essential resource for the growth and
development of plants and animals, and biodiversity benefits can be delivered even by
very small, isolated schemes. The greatest value can be achieved where SuDS are
planned as part of a wider green landscape, providing important habitat, and wildlife
connectivity. With careful design, SuDS can provide shelter, food, foraging and breeding
opportunities for a variety of species including plants, amphibians, invertebrates, birds,
bats and other animals.
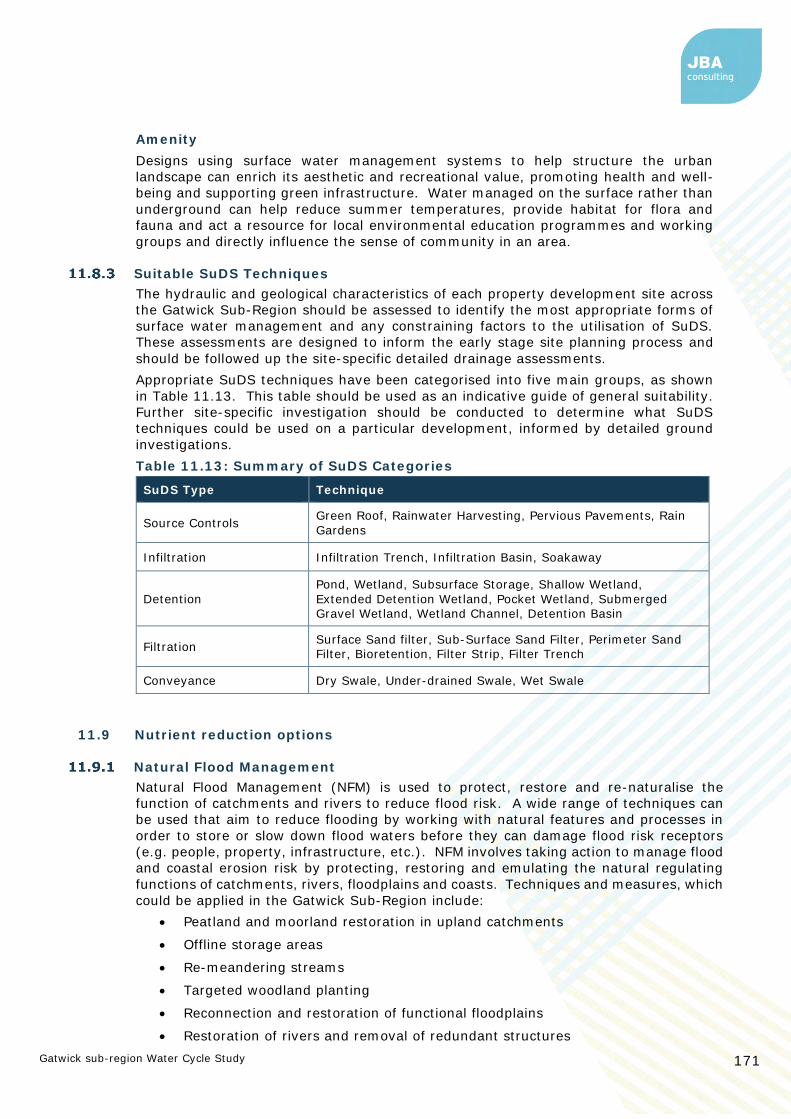
Gatwick sub-region Water Cycle Study 171
Amenity
Designs using surface water management systems to help structure the urban
landscape can enrich its aesthetic and recreational value, promoting health and well-
being and supporting green infrastructure. Water managed on the surface rather than
underground can help reduce summer temperatures, provide habitat for flora and
fauna and act a resource for local environmental education programmes and working
groups and directly influence the sense of community in an area.
Suitable SuDS Techniques
The hydraulic and geological characteristics of each property development site across
the Gatwick Sub-Region should be assessed to identify the most appropriate forms of
surface water management and any constraining factors to the utilisation of SuDS.
These assessments are designed to inform the early stage site planning process and
should be followed up the site-specific detailed drainage assessments.
Appropriate SuDS techniques have been categorised into five main groups, as shown
in Table 11.13. This table should be used as an indicative guide of general suitability.
Further site-specific investigation should be conducted to determine what SuDS
techniques could be used on a particular development, informed by detailed ground
investigations.
Table 11.13: Summary of SuDS Categories
SuDS Type Technique
Source Controls Green Roof, Rainwater Harvesting, Pervious Pavements, Rain
Gardens
Infiltration Infiltration Trench, Infiltration Basin, Soakaway
Detention
Pond, Wetland, Subsurface Storage, Shallow Wetland,
Extended Detention Wetland, Pocket Wetland, Submerged Gravel Wetland, Wetland Channel, Detention Basin
Filtration Surface Sand filter, Sub-Surface Sand Filter, Perimeter Sand Filter, Bioretention, Filter Strip, Filter Trench
Conveyance Dry Swale, Under-drained Swale, Wet Swale
11.9 Nutrient reduction options
Natural Flood Management
Natural Flood Management (NFM) is used to protect, restore and re-naturalise the
function of catchments and rivers to reduce flood risk. A wide range of techniques can
be used that aim to reduce flooding by working with natural features and processes in
order to store or slow down flood waters before they can damage flood risk receptors
(e.g. people, property, infrastructure, etc.). NFM involves taking action to manage flood
and coastal erosion risk by protecting, restoring and emulating the natural regulating
functions of catchments, rivers, floodplains and coasts. Techniques and measures, which
could be applied in the Gatwick Sub-Region include:
• Peatland and moorland restoration in upland catchments
• Offline storage areas
• Re-meandering streams
• Targeted woodland planting
• Reconnection and restoration of functional floodplains
• Restoration of rivers and removal of redundant structures

Gatwick sub-region Water Cycle Study 172
• Installation or retainment of large woody material in river channels
• Improvements in management of soil and land use
• Creation of rural and urban SuDS
In 2017, the Environment Agency published online evidence base100 to support the
implementation of NFM and with JBA produced maps showing locations with the potential
for NFM measures101. These maps are intended to be used alongside the evidence
directory to help practitioners think about the types of measure that may work in a
catchment and the best places in which to locate them. There are limitations with the
maps; however, it is a useful tool to help start dialogue with key partners.
Multiple Benefits of NFM
In addition to flood risk benefits, there are also significant benefits in other areas such
as habitat provision, air quality, climate regulation and water quality.
Many NFM measures have the ability to reduce nutrient and sediment sources by
reducing surface runoff flows from higher ground, reducing soil erosion, trapping
sediment at the edge of agricultural land, or encouraging deposition of sediments behind
natural dams upstream in watercourses.
Suitable techniques may include:
• Leaky dams
• Woodland planting
• Buffer strips
• Runoff retention ponds
• Land management techniques (soil aeration, cover crops etc.)
———————————————————————————————————————————— 100 Working with natural processes to reduce flood risk, Environment Agency (2018). Accessed online at:
https://www.gov.uk/government/publications/working-with-natural-processes-to-reduce-flood-risk on: 03/10/2019
101 Mapping the potential for working with natural process, Environment Agency and JBA. Accessed online at:
http://wwnp.jbahosting.com/ on: 03/10/2019

Gatwick sub-region Water Cycle Study 173
Integrated Constructed Wetlands
An integrated constructed wetland (ICW) is an artificial wetland created for the purpose
of treating polluted water, whether this is municipal wastewater, grey water from
residential properties, or agricultural runoff.
They are usually unlined, free surface flow wetlands, designed to contain and treat
influents within emergent vegetated areas.
Defra carried out a systematic review of the effectiveness of various wetland types,
including ICWs for mitigating agricultural pollution such as phosphate and nitrate. The
overall conclusion was that all wetland types are very effective at reducing major
nutrients and suspended sediments, with the exception of nitrite in ICWs. Nitrate is only
reduced when passing through overland buffer strips and through constructed wetlands
with vegetation, where the systematic review showed a mean reduction of 29% across
the evidence included in the study.
The mean reduction in Total Phosphorus across the evidence base was 78%.
Case Study – Black Brook Slow the Flow
Four engineered log dams were installed on Black Brook at an estimated cost
of £2,000, funded by Natural England and the Environment Agency to restore
Stanley Bank SSSI. The scheme aimed to improve habitat and reduce the risk
of flooding. However, the scheme also resulted in reduced levels of phosphate
and nitrate in Black Brook, with phosphate concentrations falling by 3.6mg/l.
By 2035, it is predicted that 792m3 of sediment will be stored in three ponds
retained by the jams.
Reproduced from Case Study 17. Black Brook Slow the Flow, St Helens,
Norbury, Rogers and Brown, EA WwNP Evidence Base 2017. Photograph taken on 8 May 2015; courtesy of Matthew Catherall

Gatwick sub-region Water Cycle Study 174
Agricultural Management
There is a big potential to improve water quality by interventions aimed at agricultural
sources, especially considering the measures already taken by the water companies to
reduce their contribution to phosphate load.
Potential schemes could include:
• Buffer strips
• Cross slope tree planting
• Runoff retention basins
• Contour ploughing
• Cover crops
There is considerable overlap with NFM measures, and the challenges are also very
similar. Exact impacts are difficult to measure, although modelling tools such as
Case Study – Frogshall ICW
The Upper River Mun in Norfolk was experiencing chronic pollution, and
a loss in biodiversity in the river. Investigation found that nutrients
from a Sewage Treatment Works upstream were contributing to this
issue.
A pilot ICW was created consisting of three shallow ponds, filled with
18,000 emergent aquatic plants, and the outfall from the treatment
works was diverted to pass through the wetland.
Early monitoring has shown that 90% of the phosphate is being
removed by the wetland, and a large increase in biodiversity
downstream observed.
Reproduced from “Stripping the Phosphate” a presentation by the
Norfolk Rivers Trust (2018).
https://www.theriverstrust.org/media/2018/08/2.-Stripping-the-
phosphate-David-Diggens-Norfolk-Rivers-Trust.pdf

Gatwick sub-region Water Cycle Study 175
Farmscoper102 exist to help with this. Once a scheme is implemented it relies on the
landowner to continue to maintain it in order to maintain the mitigation benefit.
Funding for agricultural interventions could come from Catchment Sensitive Farming or
a Payment for Ecosystem Services approach.
Wessex Water and United Utilities have both recently used a reverse auction approach103,
which enables farmers to bid for funding to plant cover crops in winter to manage runoff
from agricultural land.
Conclusions
• The potential impacts of development on a number of protected sites such as
SAC, SPAs, Ramsar sites and SSSIs within, or downstream of the study area
should be carefully considered in future plan making. There are also a larger
number of Priority Habitats and Priority Rivers.
• An assessment of water quality in the watercourses adjacent to protected sites
identified a risk of deterioration in phosphate concentration. In all cases,
improvement in treatment processes at WwTW to treat at the technically
achievable limit could prevent this deterioration.
———————————————————————————————————————————— 102 Farmscoper webpage, ADAS (2020). https://www.adas.uk/Service/farmscoper Accessed on 22/01/2020
103 EnTrade webpage, Entrade (2020). https://www.entrade.co.uk/ Accessed on 22/01/2020
Case Study – Wessex Water - EnTrade
Wessex Water catchment team used EnTrade to invite farmers to bid to
grow cover crops over winter to reduce the nitrogen leaching into the
watercourse.
This avoided the need to upgrade Dorchester WwTW to provide the
same nitrogen removal capacity.
A trial auction was held in 2015, and two further auctions have since
taken place attracting 557 bids from 63 farmers to save 153 tonnes of
nitrogen.
“Using EnTrade to create a market in measures to deliver reductions
in nitrogen has delivered a 30% saving for Wessex Water compared to
traditional catchment approaches.”
Ruth Barden, Director of Environmental Strategy, Wessex Water

Gatwick sub-region Water Cycle Study 176
• There are a number of Groundwater Source Protection Zones, primarily in the
north and south of the study area. The impact of future development on
groundwater should be investigated fully.
• SuDS are required on all development sites. Their design must consider both
water quantity and water quality and site level investigations should be
undertaken to define the most appropriate SuDS types for each specific
development.
• Runoff from these sites should be managed through implementation of a SuDS
scheme with a focus on treating water quality of surface runoff from roads and
development sites.
• Opportunities exist for these SuDS schemes to offer multiple benefits of flood risk
reduction, amenity value and biodiversity.
• Surrey County Council and West Sussex County Council should be consulted at
an early stage of development to ensure that SuDS are implemented and
designed in response to site characteristics and policy factors.
• In the wider area, opportunities exist to implement natural flood management
techniques to achieve multiple benefits of flood risk, water quality and habitat
creation.
11.10 Recommendations
Table 11.14: Recommendations from Environmental Constraints and
Opportunities Section
Action Responsibility Timescale
Consider the environmental impact of development on protected sites downstream of receiving wastewater treatment works in the Habitats Regulations Assessment
Councils Local Plan
Development
The local plan should include policies that require all
development proposals with the potential to impact on areas with environmental designations to be considered in consultation with Natural England (for national designations).
Councils Ongoing
The Local Plan should include policies that require development sites to adopt SuDS to manage water quality of surface runoff.
Councils Ongoing
In partnership, identify opportunities for incorporating SuDS into open spaces and green infrastructure, to deliver strategic flood risk management and meet WFD water quality targets.
Councils
TW and SW EA
Ongoing
Developers should include the design of SuDS at an early stage to maximise the benefits of the scheme
Developers Ongoing
Work with developers to discourage connection of new
developments into existing surface water and combined sewer networks. Prevent connections into the foul network, as this is a significant cause of sewer flooding.
Councils
Developers Ongoing

Gatwick sub-region Water Cycle Study 177
Action Responsibility Timescale
Opportunities for Natural Flood Management that include schemes aimed at reducing / managing runoff should be considered to reduce nutrient and sediment pollution within the Gatwick Sub-Region
Councils EA and NE
Ongoing

Gatwick sub-region Water Cycle Study 178
12 Climate Change Impact Assessment
12.1 Approach
A qualitative assessment was undertaken to assess the potential impacts of climate
change on the assessments made in this water cycle study. This was done using a matrix
which considered both the potential impact of climate change on the assessment in
question, and also the degree to which climate change has been considered in the
information used to make the assessment.
The impacts have been assessed on an area wide basis; the available climate models
are generally insufficiently refined to draw different conclusions for different parts of the
study area or doing so would require a degree of detail beyond the scope of this study.
Table 12.1: Climate Change Pressures Scoring Matrix
Impact of Pressure
Low Medium High
Have climate change
pressures been considered in
the
assessment?
Yes - quantitative consideration
Some consideration but qualitative
only
Not considered
12.2 Summary of UK Climate Projections
The UK Climate projections 2018 (UKCP18), released November 2018, provide updated
projections of how the climate might change in the UK over the 21st Century. This section
provides an overview of the main differences between UKCP18 and UKCP09, and the key
issues raised. A detailed analysis can be found in the Final Phase 1 Scoping Study Report.
The projections benefit from a new set of emissions scenarios (known as RCPs) that
consider mitigation efforts, updated methodology using the newest climate models and
climate data and an updated baseline period of 1981-2000.
General climate change trends projected over UK land for the 21st century are broadly
consistent with UKCP09 projections, showing an increased chance of milder, wetter
winters and hotter, drier summers along with an increase in the frequency and intensity
of extremes. Cold, drier winters and cooler, wet summers will still occur due to natural
climate variability, but these are likely to become less frequent over the 21st Century.
However, there are some differences between UKCP09 and UKCP18 (e.g. temperature
and rainfall) that may be important for climate risk assessments. These differences
depend on season, location and greenhouse gas emission scenario and there is a large
overlap of projected ranges for the majority of climate metrics. The biggest differences
are within the highest (95th) and lowest percentiles (5th) (so in the lower probability,
extreme range)104.
The UKCP18 probabilistic projections for the South East of England, for RCP 8.5 (high
emissions scenario, to represent a worst-case scenario) by 2080 are as follows:
———————————————————————————————————————————— 104 Lowe et al., 2018. UKCP18 Science Overview Report. Available at:
https://www.metoffice.gov.uk/pub/data/weather/uk/ukcp18/science-reports/UKCP18-Overview-report.pdf

Gatwick sub-region Water Cycle Study 179
• Drier summers with a change in average summer precipitation of between -2%
and -76%. Trends over the 21st century indicate dry summers are going to
become much more frequent by 2100.
• Hotter summers will become much more common with a change in average
summer temperatures of between 2.9°C and 8.6°C.
• Wetter winters with a change in average winter precipitation of between -2% and
57% (central estimate: 24%). Trends over the 21st century indicate that in
general wet winters will become more frequent by 2100.
• Milder winters will become more common with a change in average winter
temperatures of between 1.5°C and 5.7°C.
The key differences between UKCP09 and UKCP18 for this region vary dependent on
climate metric, season and percentile ranges. For seasonal and annual trends in
precipitation, there are some relatively big differences between the two sets of
projections in the low and high percentiles. UKCP18 shows slightly larger reductions in
precipitation than UKCP09. UKCP18 also shows slightly smaller increases in precipitation
(90th percentile) in comparison to UKCP09. For seasonal and annual temperature, the
differences between the two sets of projections appear to be dependent on season. The
biggest differences are in winter with UKCP18 showing slightly less warming than
UKCP09.
Water resources
Drawing from the UKCP18 projections, the Gatwick sub-region is likely to experience
drier summers than was originally estimated in the UKCP09 by 2080. It can be assumed
that hot, dry summers are likely to become more frequent over the 21st Century, which
may have an impact on water demand and on the availability of water for abstraction
from rivers during summer months. An overall increase in wet winters over the 21st
century as consistent with UKCP09, which should be beneficial for aquifer recharge and
the availability of groundwater resources. However, dry winters will still occur due to
natural climate variability and it is not possible to estimate the relative probability of
multiple dry seasons occurring consecutively (both summer and winter) from the data
presented and the impact this will have on water availability. A detailed study of UKCP18
data would be required to fully understand the impact that the UKCP18 projections will
have on water resources in the study area.
The National Infrastructure Commission has analysed the UK’s long-term infrastructure
needs in response to predicted drought. In order to maintain the current standard of
resilience (the worst historic drought), the system would require 2,700- 3,000 million
additional litres of water per day (Ml/day) to account for a rising population and the
environmental and climate pressures expected by 2050. Figure 12.1 displays the spatial
variation of the need for additional water capacity. Depending on the drought scenario
(0.5% to 0.2% annual probability) an additional shortage as large as 1,000 Ml/day may
be encountered. The ‘Preparing for a Drier Future’ report suggests that a ‘twin-track’
approach of reducing demand and increasing supply is the most cost efficient and
sustainable way to deliver resilience. It is suggested that a minimum of 1,300 Ml/day of
additional supply infrastructure will be required, which might be achieved using
transfers, reservoirs, re-use and desalination. Comparatively, demand can be reduced
by introducing additional metering and reducing leakages.

Gatwick sub-region Water Cycle Study 180
Figure 12.1 NIC Assessment of additional water resources capacity
Source: 'Preparing for a drier future', National Infrastructure Commission105
Wastewater infrastructure
The UKCP18 2.2km local projections provide projections for short duration heavy rainfall
(i.e. convective storms) which affect urban drainage systems, but additional analysis will
be needed before these projections can be translated into any guidance. Again, it is not
possible to comment on how this may change wastewater management in the future.
At the time of writing, the most up-to-date projections for future short duration high
intensity rainfall are those from the UKWIR (UK Water Industry Water Research) 2017
project ‘Rainfall intensity for sewer design - Stage 2’, which should be used for
wastewater management projects. Thames Water was a member of the project steering
group for this research and owns a copy of the report.
12.3 Water company assessments
Southern Water and Thames Water have published a risk assessment106 for both water
resources, wastewater treatment and wastewater sewerage networks that identifies the
level of threat from climate change in key service areas. In the case of WwTW, the
highest perceived risks are in asset performance and pollution incidents, both of which
can be attributed to an increased risk of flooding. In the case of the wastewater network,
sewer flooding, resulting from increased rainfall intensity overwhelming the sewer
network is added to the risks of impacts on asset performance and pollution incidents.
Consideration of the impact of climate change on water resources is included in SEW,
SESW and SW’s WRMPs, with the main risk being the increased likelihood of severe
drought events. Allowance is made within the baseline supply forecast by adjusting the
“Water Available for Use”.
———————————————————————————————————————————— 105 National Infrastructure Commission (2018) Preparing for a drier future. Accessed Online at: https://www.nic.org.uk/wp-
content/uploads/NIC-Preparing-for-a-Drier-Future-26-April-2018.pdf on 17/07/2020
106 Thames Water’s progress in planning for climate change, Thame Water (2016). Accessed online at: https://corporate.thameswater.co.uk/-/media/Site-Content/Thames-Water/Corporate/AboutUs/Protecting-our-
environment/adaptionreport.pdf on: 21/02/2020

Gatwick sub-region Water Cycle Study 181
Table 12.2: Climate Change Consequences Scoring for The Water Cycle Study
Assessment
Impact of Pressure
(source of information)
Have climate change pressures been considered in the Water
Cycle Study? RAG
Water resources
High
Yes – quantitative assessment within the WRMP.
Climate change impacts on consumption have been calculated in accordance with UKWIR report
“Impact of Climate Change on Water Demand” (2013).
Water supply infrastructure
Medium - some increased
demand in hot weather
Yes - quantitative assessment within the WRMP.
Wastewater Collection
High - Intense summer rainfall
and higher winter rainfall increases flood
risk
Yes – qualitative assessment in climate change adaptation reports by Thames Water and Southern Water.
This has not been considered in site by site assessments.
Wastewater treatment
Medium - Increased
winter flows and more
extreme weather events
reduces flow headroom
Yes – qualitative assessment in the
Thames Water climate change
adaptation reports.
This has not been considered in site
by site assessments.
WwTW odour
Medium – higher
temperatures will exacerbate existing odour control issues.
Thames Water have considered odour in WwTW upgrades as part of their climate adaptation plan.
Water quality
Nutrients: High
Sanitary
determinands: Medium to High
Qualitative assessments have been included in the climate change
adaptation policy papers from Thames Water.
Flooding from increased
WwTW discharge
Low No - not considered
(1) River Basin Management Plan
(2) SESW, SEW, SW WRMPs
12.4 Conclusions and Recommendations
The impact of Climate Change on water resources and water infrastructure are receiving
increasing levels of attention by water companies and sewerage undertakers at a
strategic level. This has not been included in assessments at a site level as detailed
modelling has not been carried out by the water companies. Consideration of changes
in water and wastewater demand should be considered when carrying out detailed site
assessments in the future.

Gatwick sub-region Water Cycle Study 182
Table 12.3: Conclusions and Recommendations from Climate Change
Assessment
Action Responsibility Timescale
When undertaking detailed assessments of environmental or asset capacity, consider how the latest climate change guidance can be included.
EA, SEW, SESW,
SW, TW As required
Take “no regrets”* decisions in the design of
developments which will contribute to mitigation and adaptation to climate change impacts. For example, consider surface water exceedance
pathways when designing the layout of developments.
Councils and Developers
As required
* “No-Regrets” Approach: “No-regrets” actions are actions by households, communities, and local/national/international institutions that can be justified from economic, and social, and environmental perspectives whether natural hazard events or climate change (or other hazards) take place or not. “No-regrets” actions increase resilience, which is the ability of a “system” to deal with different types of hazards in a timely, efficient, and equitable manner. Increasing resilience is the basis for sustainable growth in a world of multiple hazards (Heltberg, Siegel, Jorgensen, 2009; UNDP, 2010).

Gatwick sub-region Water Cycle Study 183
13 Summary and Overall Conclusions
13.1 Summary
A summary of the conclusions for each section of the study are shown in Table 13.1.
Table 13.1: Summary of Conclusions from the Study
Assessment Conclusion
Water
resources
• All three WRZs in the study area are classed as being under
serious water stress – justifying the more stringent target of
110 l/p/d under building regulations.
• There is a clear need to go further than 110l/p/d in the Gatwick
sub-region and a policy requiring 100lp/d in new developments
and 80l/p/d in strategic development should be adopted.
• This approach is supported by all three water supply companies,
the Environment Agency and Natural England.
• Growth plans defined in WRMPs are broadly in line with MHCLG
household growth projections.
• Growth in Horsham, Mid Sussex and Reigate and Banstead is
higher than that accounted for in WRMPs. Supply-led growth in
Crawley is in line with the WRMP.
• SESW, SEW and SW have confirmed that they have sufficient
water resources to serve the proposed level of growth.
• issues have been highlighted by the Environment Agency and
Natural England on the sustainability of abstractions at Hardham
and further discussions are required in order to assess the
impact on Local Plan allocations within this water resource zone.
Water supply
infrastructure
• All sites were given a “green” or “amber” assessment by SEW
and SW based on the size of the development, and the
likelihood of requiring network reinforcement.
• SESW did not provide a site by site assessment so the same
methodology as SEW and SW was applied.
• No allocations were identified with major constraints on water
supply, so long as there is early engagement between
developers, Local Planning Authorities and water companies to
enable infrastructure upgrades to be constructed prior to
occupation of new developments
Wastewater
collection
• Development in areas where there is limited wastewater
network capacity will increase pressure on the network,
increasing the risk of a detrimental impact on existing
customers, and increasing the likelihood of CSO operation.
• Wastewater infrastructure upgrades would be required in order
to serve the level of proposed growth. No constraints to
providing these upgrades were identified by SW or TW.
• Early engagement with Southern Water and Thames Water is
required, and further modelling of the network may be required
at the planning application stage.
• Opportunities to separate surface water from foul on brownfield
sites should be considered
Wastewater
Treatment
Works Flow
• Nine WwTWs in the Gatwick Sub-Region are predicted to, or
already exceeding their flow permit during the plan period:
o Billingshurst
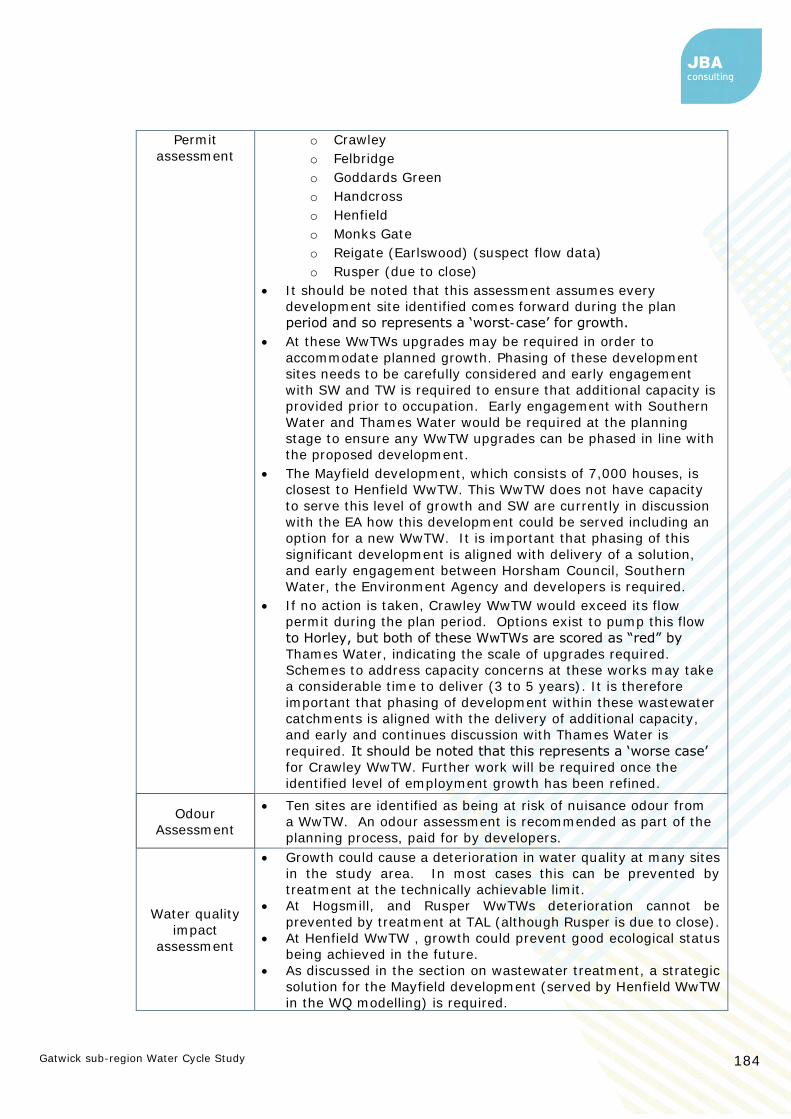
Gatwick sub-region Water Cycle Study 184
Permit
assessment
o Crawley
o Felbridge
o Goddards Green
o Handcross
o Henfield
o Monks Gate
o Reigate (Earlswood) (suspect flow data)
o Rusper (due to close)
• It should be noted that this assessment assumes every
development site identified comes forward during the plan
period and so represents a ‘worst-case’ for growth.
• At these WwTWs upgrades may be required in order to
accommodate planned growth. Phasing of these development
sites needs to be carefully considered and early engagement
with SW and TW is required to ensure that additional capacity is
provided prior to occupation. Early engagement with Southern
Water and Thames Water would be required at the planning
stage to ensure any WwTW upgrades can be phased in line with
the proposed development.
• The Mayfield development, which consists of 7,000 houses, is
closest to Henfield WwTW. This WwTW does not have capacity
to serve this level of growth and SW are currently in discussion
with the EA how this development could be served including an
option for a new WwTW. It is important that phasing of this
significant development is aligned with delivery of a solution,
and early engagement between Horsham Council, Southern
Water, the Environment Agency and developers is required.
• If no action is taken, Crawley WwTW would exceed its flow
permit during the plan period. Options exist to pump this flow
to Horley, but both of these WwTWs are scored as “red” by
Thames Water, indicating the scale of upgrades required.
Schemes to address capacity concerns at these works may take
a considerable time to deliver (3 to 5 years). It is therefore
important that phasing of development within these wastewater
catchments is aligned with the delivery of additional capacity,
and early and continues discussion with Thames Water is
required. It should be noted that this represents a ‘worse case’
for Crawley WwTW. Further work will be required once the
identified level of employment growth has been refined.
Odour
Assessment
• Ten sites are identified as being at risk of nuisance odour from
a WwTW. An odour assessment is recommended as part of the
planning process, paid for by developers.
Water quality
impact
assessment
• Growth could cause a deterioration in water quality at many sites
in the study area. In most cases this can be prevented by
treatment at the technically achievable limit.
• At Hogsmill, and Rusper WwTWs deterioration cannot be
prevented by treatment at TAL (although Rusper is due to close).
• At Henfield WwTW , growth could prevent good ecological status
being achieved in the future.
• As discussed in the section on wastewater treatment, a strategic
solution for the Mayfield development (served by Henfield WwTW
in the WQ modelling) is required.

Gatwick sub-region Water Cycle Study 185
Flood risk
from
additional
WwTW flow
• The impact of increased effluent flows at WwTW from any of the
proposed development is not predicted to have a significant
impact upon flood risk in any of the receiving watercourses.
Environmental
Constraints
and
Opportunities
• A number of SAC, SPA, SSSI and Ramsar sites exist within the
Gatwick Sub-Region, distributed between the four Local
Authorities. There are also a large number of priority habitats and
priority rivers.
• An assessment of water quality in the watercourses adjacent to
protected sites identified a risk of deterioration in phosphate
concentration. In all cases, improvement in treatment processes
at WwTW to treat at the technically achievable limit could prevent
this deterioration.
• There are a number of Groundwater Source Protection Zones,
primarily in the north and south of the study area. The impact of
future development on groundwater should be investigated fully.
• Development sites within the study area could be sources of
diffuse pollution from surface runoff.
• Runoff from these sites should be managed through
implementation of a SuDS scheme with a focus on treating
water quality of surface runoff from roads and development
sites.
• Opportunities exist for these SuDS schemes to offer multiple
benefits of flood risk reduction, amenity value and biodiversity.
• SuDS for a single site could be demonstrated to have limited
impact, but it is the cumulative impact of all development across
the catchment (combined with the potential effects of climate
change) that should be taken into account. For this reason,
SuDS should be considered on sites that do not have a direct
pathway to a SSSI.
• In the wider area, opportunities exist to implement natural flood
management techniques to achieve multiple benefits of flood
risk, water quality and habitat creation.

Gatwick sub-region Water Cycle Study 186
13.2 Recommendations
Table 13.2 below summarises the recommendations from each section of the report.
Table 13.2: Summary of Recommendations
Aspect Action Responsibility Timescale
Water
Resources
Continue to regularly review
forecast and actual household
growth across the supply region
through WRMP Annual Update
reports, and where significant
change is predicted, engage with
Local Planning Authorities.
SEW, SESW, SW Ongoing
Provide yearly profiles of projected
housing growth to water companies
to inform the WRMP.
Councils Annually
Use planning policy to require all
new development to achieve a
water efficiency of 100l/person/day
in the Gatwick sub-region and
80l/p/d in strategic developments.
Councils In Local Plan
Review
The concept of water neutrality has
potentially a lot of benefit in terms
of resilience to climate change and
enabling all waterbodies to be
brought up to Good status. Explore
further with the water companies
and the Environment Agency how
the Council’s planning and climate
change policies can encourage this
approach.
Councils, EA,
SEW, SESW, SW
In Local Plan
Review and
Climate
Change
Action Plan
Strategic residential developments,
and commercial developments
should consider incorporating
greywater recycling and/or
rainwater harvesting into
development at the master planning
stage in order to reduce water
demand.
Councils, SW,
SESW, SEW
In Local Plan
Review
Water companies should advise the
Councils of any strategic water
resource infrastructure
developments within the area,
where these may require
safeguarding of land to prevent
other type of development
occurring.
SEW, SESW, SW In Local Plan
Review
Southern Water should engage with
the Councils on any requirement to
phase development in the Sussex
North Water Resource Zone in order
to align development with
infrastructure investment in
SW, Councils,
EA, NE
In Local Plan
Review

Gatwick sub-region Water Cycle Study 187
Aspect Action Responsibility Timescale
response to sustainability concerns
relating to the Hardham abstraction
Water Supply
Undertake network modelling where
appropriate to ensure adequate
provision of water supply is feasible
SEW, SESW, SW
As part of the
planning
process
The Councils and Developers should
engage early with the water
companies to ensure infrastructure
is in place prior to occupation.
Councils
SEW, SESW, SW
Developers
Ongoing
Wastewater
Collection
Early engagement between the
councils, SW and TW is required to
ensure that where strategic
infrastructure is required, it can be
planned in by SW/TW.
Councils
SW
TW
Ongoing
Take into account wastewater
infrastructure constraints in phasing
development in partnership with the
sewerage undertaker
Councils
SW
TW
Ongoing
Developers will be expected to work
with the sewerage undertaker
closely and early in the planning
promotion process to develop an
outline Drainage Strategy for sites.
The Outline Drainage strategy
should set out the following:
What – What is required to serve
the site
Where – Where are the assets /
upgrades to be located
When – When are the assets to be
delivered (phasing)
Which – Which delivery route is the
developer going to use s104 s98
s106 etc. The Outline Drainage
Strategy should be submitted as
part of the planning application
submission, and where required,
used as a basis for a drainage
planning condition to be set.
SW, TW and
Developers Ongoing
Developers will be expected to
demonstrate to the Lead Local
Flood Authority (LLFA) that surface
water from a site will be disposed
using a sustainable drainage
system (SuDS) with connection to
surface water sewers seen as the
last option. New connections for
surface water to foul sewers will be
resisted by the LLFA.
Developers
LLFA Ongoing
Wastewater
Treatment Consider the available WwTW
capacity when phasing
Councils
SW, TW Ongoing
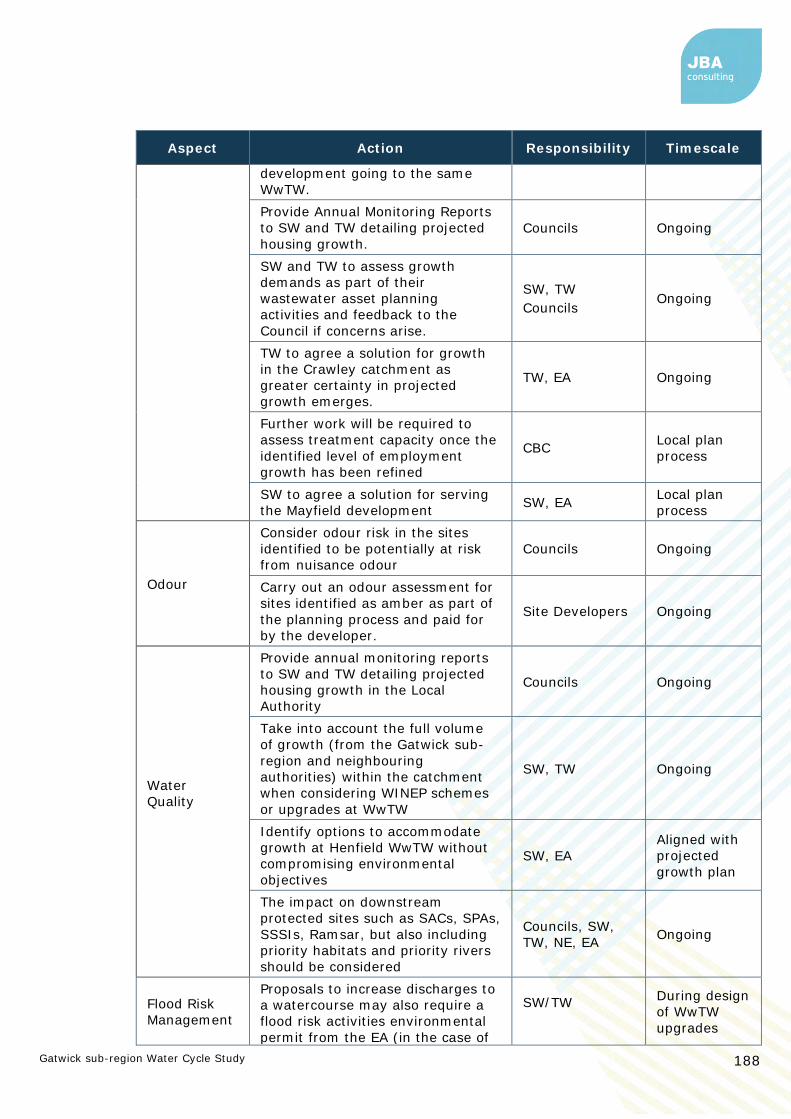
Gatwick sub-region Water Cycle Study 188
Aspect Action Responsibility Timescale
development going to the same
WwTW.
Provide Annual Monitoring Reports
to SW and TW detailing projected
housing growth.
Councils Ongoing
SW and TW to assess growth
demands as part of their
wastewater asset planning
activities and feedback to the
Council if concerns arise.
SW, TW
Councils Ongoing
TW to agree a solution for growth
in the Crawley catchment as
greater certainty in projected
growth emerges.
TW, EA Ongoing
Further work will be required to
assess treatment capacity once the
identified level of employment
growth has been refined
CBC Local plan
process
SW to agree a solution for serving
the Mayfield development SW, EA
Local plan
process
Odour
Consider odour risk in the sites
identified to be potentially at risk
from nuisance odour
Councils Ongoing
Carry out an odour assessment for
sites identified as amber as part of
the planning process and paid for
by the developer.
Site Developers Ongoing
Water
Quality
Provide annual monitoring reports
to SW and TW detailing projected
housing growth in the Local
Authority
Councils Ongoing
Take into account the full volume
of growth (from the Gatwick sub-
region and neighbouring
authorities) within the catchment
when considering WINEP schemes
or upgrades at WwTW
SW, TW Ongoing
Identify options to accommodate
growth at Henfield WwTW without
compromising environmental
objectives
SW, EA
Aligned with
projected
growth plan
The impact on downstream
protected sites such as SACs, SPAs,
SSSIs, Ramsar, but also including
priority habitats and priority rivers
should be considered
Councils, SW,
TW, NE, EA Ongoing
Flood Risk
Management
Proposals to increase discharges to
a watercourse may also require a
flood risk activities environmental
permit from the EA (in the case of
SW/TW
During design
of WwTW
upgrades

Gatwick sub-region Water Cycle Study 189
Aspect Action Responsibility Timescale
discharges to Main River), or a land
drainage consent from the Lead
Local Flood Authority (in the case
of discharges to an Ordinary
Watercourse).
Environment
Consider the environmental impact
of development on protected sites
downstream of receiving
wastewater treatment works in the
Habitats Regulations Assessment
Councils Local Plan
Review
The local plan should must include
policies that require all
development proposals with the
potential to impact on areas with
environmental designations to be
considered in line with the relevant
legislation and where stated in
consultation with Natural England
(for national and international
designations and priority habitats).
Councils Ongoing
The Local Plan should include
policies that require development
sites to adopt SuDS to manage
water quality of surface runoff.
Councils Ongoing
In partnership, identify
opportunities for incorporating
SuDS into open spaces and green
infrastructure, to deliver strategic
flood risk management and meet
WFD water quality targets.
Councils
TW and SW
EA
Ongoing
Developers should include the
design of SuDS at an early stage to
maximise the benefits of the
scheme
Developers Ongoing
Work with developers to discourage
connection of new developments
into existing surface water and
combined sewer networks. Prevent
connections into the foul network,
as this is a significant cause of
sewer flooding.
Councils
Developers Ongoing
Opportunities for Natural Flood
Management that include schemes
aimed at reducing / managing
runoff should be considered to
reduce nutrient and sediment
pollution within the Gatwick Sub-
Region
Councils, EA, NE Ongoing

Gatwick sub-region Water Cycle Study 190
Appendices
A Site tracker spreadsheet

Gatwick sub-region Water Cycle Study 191
B WwTW JBA flow permit assessments
Figure 13.1 Flow Capacity Assessment for Billingshurst
Figure 13.2 Flow Capacity Assessment for Crawley WwTW

Gatwick sub-region Water Cycle Study 192
Figure 13.3 Flow Capacity Assessment for Felbridge WwTW
Figure 13.4 Flow Capacity Assessment for Goddards Green WwTW

Gatwick sub-region Water Cycle Study 193
Figure 13.5 Flow Capacity Assessment for Handcross WwTW
Figure 13.6 Flow Capacity Assessment for Henfield WwTW

Gatwick sub-region Water Cycle Study 194
Figure 13.7 Flow Capacity Assessment for Monks Gate
Figure 13.8 Flow Capacity Assessment for Reigate (Earlswood) WwTW
Suspect flow data for 2016 has been removed. With this data included the permit would
be exceeded.

Gatwick sub-region Water Cycle Study 195
Figure 13.9 Flow Capacity Assessment for Rusper WwTW

Offices at
Coleshill
Doncaster Dublin Edinburgh Exeter Glasgow Haywards Heath Isle of Man Limerick Newcastle upon Tyne Newport Peterborough Saltaire Skipton Tadcaster Thirsk Wallingford Warrington Registered Office 1 Broughton Park Old Lane North Broughton SKIPTON BD23 3FD United Kingdom +44(0)1756 799919 [email protected] www.jbaconsulting.com Follow us: Jeremy Benn Associates Limited Registered in England 3246693 JBA Group Ltd is certified to: ISO 9001:2015 ISO 14001:2015
OHSAS 18001:2007


![OGC WCS: A Short Guide - Europa€¦ · Web Coverage Service (WCS) = - modular, testable, scalable ... EO-WCS WCS Application Profile for Earth Observation [OGC 10-140] - 2D imagery](https://static.fdocuments.in/doc/165x107/5fb8102767ab5c5b7f2483a0/ogc-wcs-a-short-guide-europa-web-coverage-service-wcs-modular-testable.jpg)