Gateway Upgrade Project 12. Surface Water Quality 12eisdocs.dsdip.qld.gov.au/Gateway...
30
Gateway Upgrade Project 12 12. Surface Water Quality
Transcript of Gateway Upgrade Project 12. Surface Water Quality 12eisdocs.dsdip.qld.gov.au/Gateway...

Gateway Upgrade Project
1212. Surface Water Quality
Gateway Upgrade Project Surface Water QualityEnvironmental Impact Statement
16 AUGUST 2004 REVISION 7 12.1
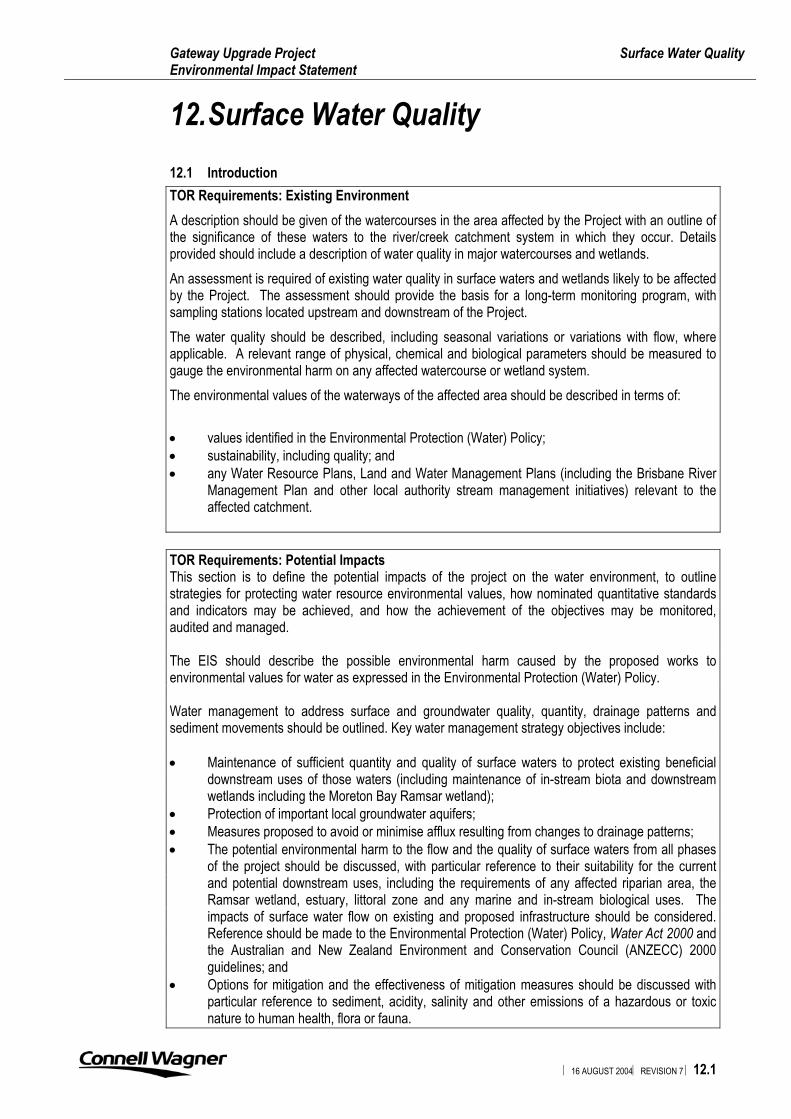
12.1 IntroductionTOR Requirements: Existing EnvironmentA description should be given of the watercourses in the area affected by the Project with an outline ofthe significance of these waters to the river/creek catchment system in which they occur. Detailsprovided should include a description of water quality in major watercourses and wetlands.An assessment is required of existing water quality in surface waters and wetlands likely to be affectedby the Project. The assessment should provide the basis for a long-term monitoring program, withsampling stations located upstream and downstream of the Project.The water quality should be described, including seasonal variations or variations with flow, whereapplicable. A relevant range of physical, chemical and biological parameters should be measured togauge the environmental harm on any affected watercourse or wetland system.The environmental values of the waterways of the affected area should be described in terms of:
• values identified in the Environmental Protection (Water) Policy;• sustainability, including quality; and• any Water Resource Plans, Land and Water Management Plans (including the Brisbane River
Management Plan and other local authority stream management initiatives) relevant to theaffected catchment.
TOR Requirements: Potential ImpactsThis section is to define the potential impacts of the project on the water environment, to outlinestrategies for protecting water resource environmental values, how nominated quantitative standardsand indicators may be achieved, and how the achievement of the objectives may be monitored,audited and managed.
The EIS should describe the possible environmental harm caused by the proposed works toenvironmental values for water as expressed in the Environmental Protection (Water) Policy.
Water management to address surface and groundwater quality, quantity, drainage patterns andsediment movements should be outlined. Key water management strategy objectives include:
• Maintenance of sufficient quantity and quality of surface waters to protect existing beneficialdownstream uses of those waters (including maintenance of in-stream biota and downstreamwetlands including the Moreton Bay Ramsar wetland);
• Protection of important local groundwater aquifers;• Measures proposed to avoid or minimise afflux resulting from changes to drainage patterns;• The potential environmental harm to the flow and the quality of surface waters from all phases
of the project should be discussed, with particular reference to their suitability for the currentand potential downstream uses, including the requirements of any affected riparian area, theRamsar wetland, estuary, littoral zone and any marine and in-stream biological uses. Theimpacts of surface water flow on existing and proposed infrastructure should be considered.Reference should be made to the Environmental Protection (Water) Policy, Water Act 2000 andthe Australian and New Zealand Environment and Conservation Council (ANZECC) 2000guidelines; and
• Options for mitigation and the effectiveness of mitigation measures should be discussed withparticular reference to sediment, acidity, salinity and other emissions of a hazardous or toxicnature to human health, flora or fauna.
12. Surface Water Quality

Gateway Upgrade Project Surface Water QualityEnvironmental Impact Statement
16 AUGUST 2004 REVISION 7 12.2
A water quality impact assessment has been undertaken to provide information on the existingbaseline environment and an assessment of the potential impacts on water quality associated with thedevelopment during construction and operation of the proposed GUP. Mitigation and managementmeasures have been recommended were appropriate to minimise the identified potential impacts.
12.2 Methodology
12.2.1 General MethodologyTo assess the potential surface water quality impacts of the GUP the following approach wasadopted:
• Identification of the existing water quality environment utilising:– existing data from EPA, BAC and other sources;– additional sampling at selected locations within Bulimba Creek, Kedron Brook
Floodway and Cannery Creek;– downstream values of the Brisbane River, Moreton Bay and Ramsar Wetlands;
• Assess impacts of GUP on the water quality of the potentially affected watercourses thatare located nearby or in the direct route of the GUP;
• Mitigation measures were recommended to ensure that any potential impacts to waterquality from the GUP are minimised.
12.2.2 Water Quality SamplingWater quality sampling was undertaken in Bulimba Creek (three sites) by Connell Wagner on26 March and 20 May 2004 and in Kedron Brook Floodway (two sites) and in Cannery Creek(one site) on 16 April and 20 May 2004 (refer Figures 12.1a to 12.1d).
Samples BC1 and BC2 were taken in Bulimba Creek where it intersects with Wecker andMeadowlands Roads upstream of GUP. BC3 is located downstream of the Motorway close tothe railway line and Hemmant Recreation Reserve.
KB1 and KB2 are located downstream of the GUP alignment. Both sites were accessed fromBAC land. CC1 is located upstream of GUP in Cannery Creek near Nudgee Road. All threesites are estuarine sites.
These sites were chosen to provide a general indication of the water quality of Bulimba CreekKedron Brook Floodway and Cannery Creek and were subject to access and safetyconsiderations. BC1 is a freshwater site, while BC2 and BC3 are estuarine sites.
Due to the highly variable water quality within the Brisbane River, water quality sampling wasnot undertaken for the EIS.
In situ sampling was undertaken on the day for pH, temperature and conductivity using a 90FLfield lab analyser. Water quality samples were collected in bottles approved and supplied byALS Environmental. Samples were sent to ALS Environmental laboratory for analysis. Sampleswere tested for total suspended solids (TSS), total phosphorus (TP), total nitrogen (TN), lead,nickel, zinc, copper, and Total Petroleum Hydrocarbons (TPH).
Table 12.1 illustrates that rainfall 24 hours prior to surface water quality sampling was low.

BC1
Gateway Upgrade Project
N
KEY
EPA Sampling Locations (one site not shown, west of Mansfield)
Connell Wagner EIS Sampling Locations
GUP Corridor
FIGURE 12.1aSurface Water Quality Sampling Locations
Queensland Government
Department of
Main Roads

Gateway Upgrade Project
BC2
BC3
N
KEY
EPA Sampling Locations
Connell Wagner EIS Sampling Locations
GUP Corridor
FIGURE 12.1bSurface Water Quality Sampling Locations
Queensland Government
Department of
Main Roads

PORT OF
MOTORWAY
BRISBANE
Gateway Upgrade Project
N
KEY
EPA Sampling Locations
GUP Corridor
FIGURE 12.1cSurface Water Quality Sampling Locations
Queensland Government
Department of
Main Roads

Gateway Upgrade Project
CC1
I4
D6
KB1
KB2
N
GUP Corridor
Connell Wagner EIS Sampling Locations
KEY
BAC Sampling Locations
FIGURE 12.1dSurface Water Quality Sampling Locations
Queensland Government
Department of
Main Roads

Gateway Upgrade Project Surface Water QualityEnvironmental Impact Statement
16 AUGUST 2004 REVISION 7 12.3
Table 12.1 Summary of Rainfall Prior to Surface Water Quality Sampling
Date Rainfall26 March 2.4mm
16 April 0.8mm20 May 0mm
Table NoteData provided by Bureau of Meteorology Brisbane Aero measuring station.
Aquatic flora and fauna is assessed in Section 17.
12.3 BackgroundStormwater runoff from urban roads has the potential to impact upon downstream water quality andassociated flora and fauna. To determine changes in water quality from the construction and operationof a project, background information needs to be obtained. Monitoring can also assist in the day to daymanagement of a work site and can assist in compliance with legislation or licensing conditions.
Changes in water quality near roads can occur from a variety of sources. An increase in nitrogen andphosphorous may be caused from an increase in garden fertilisers and sediment into waterways. Theincrease in nutrients can promote algal growth and therefore affecting oxygen levels in the watercolumn affecting aquatic flora and fauna.
Erosion and sedimentation increase suspended solids and therefore could potentially reduce lightpenetration and affect the growth of flora and fauna. Smothering of organisms also could potentiallyoccur. Hydrocarbons are generally washed from road surfaces and paved areas. Hydrocarbons canbe noxious to aquatic flora and fauna and can potentially impact upon the aesthetics of an area.Heavy metals such as copper, lead, zinc, chromium and nickel can be washed from roads andhardstand areas as they are associated with motor vehicles, tyres and rubber. These metals in highdoses can be lethal to aquatic flora and fauna.
Vehicles utilising roads and highways have the potential to drop fuel, oil, antifreeze and otherchemicals onto the pavement. Metals are released onto the road from the wear of brake linings, clutchplates and tyres. During a rain event these substances are washed into the drains and eventuallywash into the creeks and rivers if they are not managed and/or treated along the way. It is important tominimise the amount of contaminants entering waterways and a suitable design of the stormwatersystem and implementation of mitigation measures during construction and operation, will assist in theremoval of contaminants to protect ecological values of the waterways.
12.4 Regulatory Framework
12.4.1 Environmental Protection (Water) Policy 1997In Queensland, the EPP(Water) is the governing piece of legislation in relation to water. TheEPP(Water) is subordinate legislation to the Environmental Protection Act 1994 (EP Act). Theobjective of the EPP(Water) is to uphold the EP Act objective of protecting “Queensland’senvironment while allowing for development that improves the total quality of life, both now andin the future, in a way that maintains the ecological processes on which life depends (ESD)”.The EPP(Water) achieves this by:

Gateway Upgrade Project Surface Water QualityEnvironmental Impact Statement
16 AUGUST 2004 REVISION 7 12.4
• Identifying environmental values for Queensland waters;• Setting water quality guidelines and objectives to enhance or protect environmental
values;• Making consistent and equitable decisions about Queensland waters that promote
efficient use of resources and best practice environmental management; and• Involving the community through consultation and education, and promoting community
responsibility.
The policy and legislative framework mentioned above sets the broad goals for design criteriafor water quality controls.
12.4.2 Airports (Environment Protection) Regulations 1997The Airports (Environment Protection) Regulations 1997 defines water pollution as when watercontains a substance or organism that causes, or is reasonably likely to cause, the physical,chemical or biological condition of the water to be adversely affected or has an adverse effecton the beneficial use of the water. Waters contain a polluting substance if:
• The substance is dissolved in waters; or• Whether or not the substance is capable of uniformly mixing with water. It is:
– suspended or otherwise dispersed in the waters; or– floating on the surface of waters; or– deposited on the bed of the waters.
Under the regulations all operators at airport have a general duty to take all reasonable andpracticable measures to prevent or minimise pollution. Operators are considered to comply withthe regulations if levels of contamination fall within acceptable limits. Accepted limits for waterpollution are detailed in Appendix I.
Water quality controls for the GUP will need to be implemented during construction andoperation so that water pollution of the nearby waterways is minimised.
12.4.3 Water Quality Guidelines
Waterways Management PlanThe 1998 Waterways Management Plan – A Framework for the Management of the Waterwaysof the Brisbane River and Moreton Bay Catchment was developed as a framework of theintegrated management of Moreton Bay. It is a guide for planning projects and processeslinked to waterways. Undertaking water quality sampling, developing stormwater managementplans and incorporating water sensitive urban design into new projects are key items outlined inthis document in relation to water quality which will be undertaken and incorporated into theGUP where possible.
ANZECC Water Quality GuidelinesThe Australian and New Zealand Environment and Conservation Council (ANZECC) developedGuidelines for Fresh and Marine Water Quality 2000 to:
• Protect and manage environmental values supported by water resources;• Outline the management framework recommended for applying the water quality
guidelines to the natural and semi-natural marine and freshwater resources in Australiaand New Zealand; and

Gateway Upgrade Project Surface Water QualityEnvironmental Impact Statement
16 AUGUST 2004 REVISION 7 12.5
• Provide advice on designing and implementing water quality monitoring and assessmentprograms.
The document provides water quality guidelines for a variety of uses such as primary industries,recreational uses, drinking water and industrial water, but for the purposes of the EIS theguidelines for protecting aquatic ecosystems was used. The aquatic ecosystem chapterspecifies biological, sediment and water quality guidelines for protecting a range of aquaticecosystems, both freshwater and marine.
Brisbane City Council Water Quality Management GuidelinesBCC has developed Water Quality Management Guidelines to provide an understanding of keyissues and required measures to effectively manage water quality impacts associated withdevelopment activities. They provide guidance as to what key issues must be addressed duringthe planning, design, construction and operational phases of a development.
12.5 Downstream Waterway ValuesEnvironmental and ecological values downstream of the GUP have been identified in other EISsections (Sections 16, 17 and 18) and are summarised as:
• Diverse saline and freshwater complex comprising mangrove with saltmarsh fringe in goodcondition at Bulimba Creek;
• Mangrove lined canal and saltmarsh fringe within Kedron Brook area and on BAC land;• Downstream values of Moreton Bay and Ramsar site;• Intrinsic value of the ecosystem;• Water associated wildlife;• Human consumption of fish and crustaceans;• Primary contact recreation in various parts of the water;• Secondary contact and visual recreation; and• Cultural heritage.
12.6 Mt Gravatt-Capalaba Road to Cleveland Branch Rail Line
12.6.1 BackgroundThis section of the GUP is within the Bulimba Creek catchment which covers a total of 122km2,one of Brisbane’s largest catchments. The land uses abutting the creek include residential,rural residential, commercial, industrial, recreational and open space purposes, as well aswetland and remnant bushland areas.
Bulimba Creek is tidal within the lower reaches and flows into the Brisbane River. The BulimbaCreek Catchment Management Plan prepared by BCC outlines the management strategy forthe creek and catchment areas.
Construction of the GUP in the vicinity of Bulimba Creek will require works within the BulimbaCreek floodplain in the form of an additional bridge and piers, and road widening works to theexisting embankments which traverse the floodplain in this area (refer Section 3 for details).

Gateway Upgrade Project Surface Water QualityEnvironmental Impact Statement
16 AUGUST 2004 REVISION 7 12.6
12.6.2 Existing EnvironmentWater quality information provided by the EPA indicates that the water quality of Bulimba Creekis generally poor. The data shows that nitrogen and phosphorous levels are generally abovethe recommended guideline levels. Dissolved oxygen at most monitoring sites was below therecommended guideline level. Mean pH and turbidity levels were consistently within theguidelines. Mean chlorophyll-a levels were above guideline levels at some monitoring sites.Raw data is located in Appendix I.
Elevated lead, nickel, zinc and copper were not detected in any of the samples collected byConnell Wagner in March 2004. Lead and zinc were detected in BC2 in April 2004, exceedingrecommended levels, while copper exceeded recommended levels in BC2 and BC3. Totalnitrogen was elevated in all of the samples exceeding twice the levels recommended in theANZECC guidelines and BCC water quality objectives on BC1 and BC2. Total phosphorouswas elevated in BC2 and BC3 and exceeded the recommended levels by two and four times,respectively (refer Figures 12.2a to 12.2f). TPH was not detected in any of the samples. pHwas within the recommended limits, as was suspended solids. ANZECC Guidelines for aquaticecosystems levels are indicated in the figures by a red line for freshwaters, green line formarine waters, while the BCC water quality objective is shown as a blue line. Sampling resultsare included in Appendix I.
00.20.40.60.8
11.21.41.6
BC1 BC2 BC3Sampling site
TN (m
g/L)
Mar-04
May-04
Figure 12.2a Nitrogen levels within Bulimba Creek (Green line indicates estuarine limits)
00.050.1
0.150.2
0.250.3
BC1 BC2 BC3Sampling Site
TP (m
g/L)
Mar-04
May-04
Figure 12.2b Phosphorous levels within Bulimba Creek (Green line indicates estuarinelimits)

Gateway Upgrade Project Surface Water QualityEnvironmental Impact Statement
16 AUGUST 2004 REVISION 7 12.7
0
0.001
0.002
0.003
0.004
0.005
0.006
BC1 BC2 BC3Sampling Site
Cop
per (
mg/
L)
Mar-04
May-04
Figure 12.2c Copper levels within Bulimba Creek
0
0.002
0.004
0.006
0.008
BC1 BC2 BC3Sampling Site
Lead
(mg/
L)
Mar-04
May-04
Figure 12.2d Lead levels within Bulimba Creek
0
0.01
0.02
0.03
0.04
0.05
BC1 BC2 BC3Sampling Site
Zinc
(mg/
L)
Mar-04
May-04
Figure 12.2e Zinc levels within Bulimba Creek

Gateway Upgrade Project Surface Water QualityEnvironmental Impact Statement
16 AUGUST 2004 REVISION 7 12.8
0
0.005
0.01
0.015
0.02
BC1 BC2 BC3
Sampling site
Nic
kel (
mg/
L)
Mar-04
May-04
Figure 12.2f Nickel levels within Bulimba Creek
Elevated nutrient levels can be attributed to:
• Fertilisers from sports fields, parks adjacent to or upstream from the creek;• Fertilisers from households and urban stormwater drains;• Household cleaning products being washed into the creek; and• Tidal exchange with Brisbane River.
High metal concentrations can be attributed to the increase in development along the creek andassociated runoff and erosion. Industry located adjacent to or nearby the creek may contributeto levels found in the samples. Copper and zinc are commonly found in brake linings and tyresand the elevated levels of these could also be attributed to runoff from the Motorway and otherroads.
12.6.3 Potential ImpactsPotential impacts on Bulimba Creek for the GUP include both direct and indirect impacts. Directimpacts include excavation and vegetation removal associated with widening existing bridgesand constructing new bridges over Bulimba Creek.
The key activities associated with direct potential impacts near Bulimba Creek are:
• Culvert extensions or replacements near drainage areas or near the creek (CH6150,7200, 9400, 13100 and 14250);
• Large areas of earthworks near drainage lines (CH7100, 11400-12100, 13500 and14400-14900);
• Widening of existing bridge and construction of new bridge over Bulimba Creek(CH14700-14800); and
• Removal of illegal fill from Bulimba Creek floodplain.
Indirect impacts include sedimentation and erosion, changes to water quality duringconstruction and operation from road runoff and potential pollutants from vehicles. The qualityof water leaving the construction site will differ to that experienced during the operational phaseof the project, and as such different management measures will be required. There are anumber of new culverts being constructed and upgrades to existing culverts that will beoccurring within this section of the GUP.

Gateway Upgrade Project Surface Water QualityEnvironmental Impact Statement
16 AUGUST 2004 REVISION 7 12.9
The potential impacts on the natural and created environments caused by contamination ofwaters include the following:
• Degradation of the quality of runoff discharging to Bulimba Creek, Brisbane River andMoreton Bay;
• Contamination of underlying soils and eventually groundwater;• Vegetation and fauna utilising surface water environments, including freshwater runoff
and estuarine and marine waters; and• Increased sedimentation and flooding.
Potential Construction ImpactsThe potential sources of groundwater and/or surface water contamination during GUPconstruction, which will require appropriate measures to avoid or minimise potential waterquality impacts, are as follows:
• Disturbance of acid sulphate soils;• Sediment from disturbed areas;• Disturbance of instream sediments in Bulimba Creek;• Hydrocarbon or chemical leaks and small scale spill from vehicles;• Hydrocarbons of chemical spills from storage areas;• Discharges from temporary sewerage and site facilities; and• Storage and disposal of waste material.
The potential for soil erosion and sedimentation is the main construction related impact. Thisgenerally occurs after vegetation removal and/or during excavation and earthworks. Sedimentis transported offsite by runoff into the drainage network (often blocking infrastructure), intoreceiving waters and onto adjacent properties. This can impact upon waterways by increasingturbidity, reducing aesthetics and amenity of an area, changes to water quality due to increasednutrients or pollutants associated with sediment and impacts to flora and fauna due to changesin composition of water quality.
Increased sedimentation from earthworks, hazardous/chemical substances (such ashydrocarbons from oil spills, asphalt prime, solvents, cement slurry and wash waters) and litterare potential pollutants if not managed properly. Eutrophication (the process of excessivenutrient enrichment) of receiving waters often stems from nitrogen, phosphorus and silica boundto the surface of deposited soil particles. This over enrichment of a water body with nutrientscan result in excessive growth of organisms and depletion of oxygen within the water column.Consequently, waterbodies with freshly deposited sediments may often undergo a rapidtransformation from aquatic plant dominated communities to algal dominated communitiesresulting in corresponding changes in the aquatic fauna, dependant upon pre existing aquaticflora for food and shelter. Acid drainage (from acid sulphate soils) is a potential impact that canimpact upon groundwater and surface water quality.
The following potential impacts are discussed in other sections of the EIS:
• Acid sulphate soils and contaminated soils (refer Section 10);• Groundwater quality (refer Section 13); and• Downstream aquatic values (refer Section 17 and Appendix M5).

Gateway Upgrade Project Surface Water QualityEnvironmental Impact Statement
16 AUGUST 2004 REVISION 7 12.10
Potential Operational ImpactsThe key locations where potential impacts may occur from operation are areas where runofffrom the Motorway can enter waterways and drainage lines (including but not limited toCH11900, 13100, 14300, and 14800).
The operational impacts of road runoff tend to be less well documented, though recent studiesindicate that road runoff contains elevated levels of sediment, heavy metals, petroleumhydrocarbons, polynuclear aromatic hydrocarbons (PAH) and nutrients (Drapper 2001). Motorvehicles are the predominant source of road runoff pollutants. Secondary contributors includegross pollutants from motor vehicle users and other users within the road catchment, pavementwear, fertilisers, pesticides and atmospheric sources. These potential contaminants result froma combination of the breakdown, spillage and normal operational emission of automotivecomponents such as tyres, clutch and brake linings, hydraulic fluids, automotive fuels orlubricants, particulates from exhaust emissions and materials (eg soils, mud and litter) tracked,carried, washed, blown or thrown from the under body or payload of vehicles. Also present arewindblown soils and vegetative matter from roadside plantings and vegetation.
Many of the potential chemical contaminants in road runoff (in particular, metals, somelubricants) become bound or strongly adsorbed to the soil particles. Therefore whilst thequantities of sediment and soil particles lost from developed road surfaces are much smallerthan comparable roads undergoing construction, the pollutants exported from the roadwaycatchment in runoff may be of much higher toxicity to aquatic fauna.
When constructed the Motorway will carry a higher volume of traffic than it does currently andthere will be an increased potential for a chemical/fuel spill to occur. A chemical/fuel spill hasthe potential to cause significant damage to the terrestrial and downstream waterways, andpublic health. The potential environmental damage from a spill may be long term and, in thecase of groundwater, the effects may persist for many years.
The GUP during the operational phase has the potential to effect water quality within theBulimba Creek and downstream waterways. The identified potential impacts are:
• Decrease in downstream water quality from road runoff resulting in a decrease indownstream waterway values (refer Section 12.5, Section 17 and Appendix M5);
• Localised water temperature changes in Bulimba Creek due to increase shading;• Contamination of soil, groundwater and surface water from a chemical spill on the
Motorway; and• Poor design of waterway crossing structures can also change flows, which in turn leads
to erosion of watercourse bed and banks, delivering sediment downstream, including toMoreton Bay.
To ensure that operational impacts are minimised a ”water quality treatment train” approachshould be adopted to reduce the level of contaminants entering waterways (refer Section12.10.1).
Provided mitigation strategies are developed and following, the potential environmental impactsidentified above are likely to be minimal.
Gateway Upgrade Project Surface Water QualityEnvironmental Impact Statement
16 AUGUST 2004 REVISION 7 12.11
12.7 Cleveland Branch Rail Line to Pinkenba Rail Line
12.7.1 BackgroundThis section of the GUP crosses the Brisbane River. The Brisbane River catchment covers atotal area of 13,500km2 in size and extends from Moreton Bay to the Great Dividing Range.Land use along the river is varied and includes significant areas of urban, cropping, grazing andforested land. The lower reaches of the river near the GUP are mainly urban. This catchmentsupports a population of over one million which is continuing to rise.
The Brisbane River is the largest and most significant river flowing into Moreton Bay.Previously, the tidal limit was only 16km due to upstream bars and shallows, however, due tocontinual dredging within the River the tidal limit now extends 85km upstream. Major tributariesof the Brisbane River include Breakfast, Bulimba, Norman and Oxley Creeks. The nutrients andsediment loads within the Brisbane River are higher than other rivers that flow into MoretonBay. This is likely due to the large volumes of stormwater and sewage that enters the system.The Brisbane River catchment deposits 450,000 tonnes of suspended sediment into MoretonBay every year (Holland et al 2001).
12.7.2 Existing EnvironmentWater quality information from EPA indicates that the water quality of the Brisbane River isgenerally of average to poor quality. Total Phosphorous is above recommended levels at allEPA monitoring sites. Total Nitrogen is above recommended levels in upstream locations but iswithin recommended limits closer to the mouth of the River. Suspended solids were well abovethe recommended levels upstream of the GUP, however, suspended solids near or downstreamof the GUP are below recommended levels. Turbidity and chlorophyll a are withinrecommended guidelines as is dissolved oxygen levels. Raw data can be located inAppendix I. The tidal flushing at the mouth of Brisbane River is the likely contributor to theimproved water quality downstream of GUP.
The Healthy Waterways report for 2002 states that the condition of the Brisbane River is poor.Majority of EPA sampling sites had elevated levels of Total Nitrogen and Total Phosphorous,over twice the recommended objective. Sediment loads were also above the recommendedobjective. The lower Brisbane catchment is considered in poor condition for water quality andecosystem health. The freshwater tributaries received an F in the last annual report while theestuarine and marine areas received a D-.
Within the Brisbane River catchment there are a number of sources where nutrients andpollutants can enter the river. These include:
• Fertilisers, chemicals and other contaminants in runoff from households;• Sewage discharges;• Industry located on the river;• Construction located on or adjacent to the river promotes erosion and sedimentation;• Tidal exchanges with tributaries of the Brisbane River;• Discharges from wastewater treatment plants;• Boats and other vessels utilising the River; and• General pollutants from roads and other anthropogenic sources washed into river via
stormwater drains.

Gateway Upgrade Project Surface Water QualityEnvironmental Impact Statement
16 AUGUST 2004 REVISION 7 12.12
The section of the Brisbane River that lies within the GUP has been highly modified from itsoriginal condition due to past wharf and port development, heavy industry, light industry,warehousing and wharves, and residential development along the river. There areapproximately 11 sewage treatment plants that currently discharge treated effluent into the tidalarea of the Brisbane River. There are oil refineries and a fertiliser plant that also discharge intothe river and approximately 200,000 tonnes of sediment per year is deposited into the river fromuncontrolled residential building sites (Holland et al 2001).
Other causes for poor water quality within the Brisbane River include:
• Extensive riparian vegetation clearance;• Altered flows;• Introduced plants and animals;• High nutrient and sediment levels;• Bacteria levels;• Heavy metal and toxicant accumulation in sediments from urban creeks; and• Channelisation of waterways.
12.7.3 Potential ImpactsDirect impacts to the Brisbane River include excavation, vegetation removal and associatedimpacts from the construction of the new bridge and pilings.
The key location where potential impacts could occur is between CH16500-17900, with pilingwithin the Brisbane River the largest potential risk.
Indirect impacts include sedimentation and erosion, changes to water quality duringconstruction and operation from runoff, and potential pollutants from vehicles. The quality ofwater leaving the site during the construction phase will differ to that experienced during theoperation phase of the GUP, and as such different management measures will be required.
Potential Construction Related ImpactsThe potential sources of groundwater and/or surface water contamination during GUPconstruction, which will require appropriate measures to avoid or minimise potential waterquality impacts, are as follows:
• Disturbance of acid sulphate soils;• Sediment from disturbed areas;• Disturbance of instream sediments in Brisbane River;• Hydrocarbon or chemical leaks and small scale spill from vehicles;• Hydrocarbons of chemical spills from storage areas;• Discharges from temporary sewerage and site facilities; and• Storage and disposal of waste material.
The main construction related impacts to potentially affect the Brisbane River are erosion andsedimentation and disturbance of river bed sediments during pier construction within the river.These impacts can potentially affect the Brisbane River and associated flora and fauna byincreasing turbidity and changing water quality due to increased nutrients or pollutantsassociated with sediment.
Gateway Upgrade Project Surface Water QualityEnvironmental Impact Statement
16 AUGUST 2004 REVISION 7 12.13
Potential pollutants, including sedimentation from earthworks, hazardous/chemical substances(such as hydrocarbons from oil spills, asphalt prime, solvents, cement slurry and washwaters)and litter, will need to be appropriately managed. The highest risk is associated with theconstruction of the bridge. The pilings and the bridge construction could directly impact uponthe water quality of the river. During the construction phase stringent management andmitigation measures will need to be implemented to ensure minimal impact occurs.
The following potential impacts are discussed in other sections of the EIS:
• Acid sulphate soils and contaminated soils (refer Section 10);• Decrease in groundwater quality (refer Section 13); and• Decrease in downstream aquatic values (refer Section 17 and Appendix M5).
Potential Operation Related ImpactsThe key locations where potential impacts may occur from operation are areas where runofffrom the Motorway can enter Brisbane River and tributaries (including but not limited toCH16500-17900).
Potential operational impacts include:
• An increased potential for a chemical/fuel spill to occur;• An increase in traffic volumes and therefore increased pollutants entering stormwater
system;• Increased nutrients and pollutants entering the Brisbane River impacting on aquatic flora
and fauna; and• Increased erosion and sedimentation due to unsuitable design of waterway crossing
structures.
The potential operational impacts from road runoff are provided in Section 12.6.3 and AppendixM4.
The hydraulic connection between the bridge site along the Brisbane River and Moreton Bay, isthe primary pathway by which potential water quality impacts might be propagated. Thenearest designated Ramsar wetland, with proximity to potential road runoff from the GUP on thesouth side of the Brisbane River, is along the eastern shore of Fisherman Islands. Because ofthe comparative distance (approximately 10km from the GUP river crossing), dilutions andprevailing currents involved between the potential sources of generation of road runoff and thisdesignated Ramsar wetland area; it is unlikely that the GUP will have any significant impact tothis wetland area.
To ensure that operational impacts are minimised a “water quality treatment train” approachshould be adopted to reduce the level of contaminants entering waterways.
The introduction of structures, within the Brisbane River floodplain and channel have thepotential to restrict flows, particularly flood flows that can deliver significant amounts of nutrientsto shallow, inshore marine ecosystems. Any interruption to these inputs could lead to ecologicalchanges in nearby marine ecosystems, including both intertidal and sub tidal ecosystems in thenearby Ramsar site. Design measures will be adopted with the main bridge crossing theBrisbane River to minimise localised erosion around piers. In this way, changed water flows willnot lead to changes in the water regime of affected areas, or in the delivery of flood flows toMoreton Bay and the associated Ramsar wetlands.
Gateway Upgrade Project Surface Water QualityEnvironmental Impact Statement
16 AUGUST 2004 REVISION 7 12.14
12.8 Pinkenba Rail Line to Nudgee Road
12.8.1 BackgroundThis section of the GUP crosses Kedron Brook Floodway and is located near Schultz Canal,Cannery Creek and other small unnamed tributaries and canals. The proposed alignment alsotraverses BAC land which contains a number of small man made canals and drains. Thesecanals drain into Schulz Canal, Landers Pocket Drain and Kedron Brook Floodway prior toentering into Moreton Bay.
Kedron Brook is a natural waterway that extends from the D’Aguilar Ranges. The uppermostsections of Kedron Brook are ephemeral gullies. Cedar Creek joins Kedron Brook at FernyGrove. The Brook meanders almost permanently through Arana Hills, Mitchelton, Everton Parkand Grange urban areas. Kedron Brook Floodway has been made into channels throughLutwyche, Wooloowin and Toombul areas. Downstream from Toombul it is tidal and it has beenre-routed to the north so it can drain the Airport site. Kedron Brook enters Bramble Bay withinMoreton Bay, to the south of the Boondall wetlands. Bramble Bay extends from the mouth ofBrisbane River to north of the Redcliffe Peninsula. Bramble Bay is considered to have poorwater quality due to poor flushing within the Bay and has the poorest water quality of allMoreton Bay zones (Healthy Waterways 2004).
Cannery Creek is located north of Northgate. Cannery Creek, formally a chain of waterholes,was constructed as a waterway for drainage purposes. It flows into the Kedron Brook Floodwayand is tidally inundated. Mangroves line the channel.
Battery Drain is a constructed drainage channel that transects the GUP south east of theGateway Motorway Airport Drive interchange. It is approximately 20m wide and “v” shaped andflows from the outlet structure under the Gateway Motorway to the north east. The catchmentfor this drain extends as far west as the suburb of Ascot, and flows generally through EagleFarm and Doomben Racecourse prior to discharge in the vicinity of the GUP. This drainappears to have been excavated to divert the flow of Serpentine Creek. Battery Drain is tidallyinfluenced to within approximately 100m of the existing Gateway Motorway.
Most other tributaries in this area are man made channels that have been rock armoured ormodified to better conduct flows and to control erosion. Majority of these waterways are tidal,and some are mangrove lined, while a small number are essentially freshwater they are linedwith salt tolerant sedges to cope with the tidal inundation when required.
12.8.2 Existing Environment
BAC MonitoringBAC undertake water quality monitoring on a regular basis at two locations near the GUP onairport land. Both of the sampling sites are located within Schultz Canal near where it intersectsKedron Brook Floodway (refer Figure 12.1d). Both of these monitoring sites have beenmonitored on incoming and outgoing tides. Data was collected from 13 sampling rounds overfour years. The averages of these results from this monitoring are shown in the table below.

Gateway Upgrade Project Surface Water QualityEnvironmental Impact Statement
16 AUGUST 2004 REVISION 7 12.15
Table 12.2 Brisbane Airport Corporation Water Quality Data
Site Temp(°C)
pH(units)
Conductivity(ms/cm)
DO (%) TN(mg/L)
TP(mg/L)
D6 incoming 26.32 7.29 35.11 101.39 0.15 0.05
D6 outgoing 23.03 7.52 40.66 91.75 0.11 0.10
I4 incoming 24.47 7.19 31.63 89.28 0.156333 0.031833
I4 outgoing 22.42 7.71 46.84 94.95 0.10 0.09
EPA MonitoringEPA undertake water quality sampling within the Kedron Brook Floodway, however this isupstream of the GUP and has not been assessed in the EIS.
EIS MonitoringLead was not detected in any of the samples collected by Connell Wagner in April 2004 andalthough it was detected in May 2004 it was within the guideline levels. There were low levelsof nickel in the samples which were within recommended levels in the ANZECC guidelines.Copper exceeded ANZECC recommended levels in all three samples during both samplingrounds. Zinc exceeded recommended levels in April 2004 only. Total Nitrogen exceededrecommended levels Cannery Creek and Total Phosphorous exceeded recommended limits inall samples (refer Figures 12.3a to 12.3f). pH was within recommended limits. ANZECCGuidelines for aquatic ecosystems levels are indicated by a red line for freshwater, green linefor marine waters, while the BCC water quality objective is shown as a blue line. Samplingresults are located in Appendix I.
Elevated nutrients can be attributed to fertilisers from households, sports fields, golf coursesand parks, sewage overflow and runoff from urban properties. Heavy metal concentrationscould be attributed to a variety of sources, including historic and existing industry locatedadjacent to the waterway or other upstream catchment land uses.
00.2
0.40.60.8
11.2
KB1 KB2 CC2Sampling Site
TN (m
g/L)
Apr-04
May-04
Figure 12.3a Nitrogen levels within Kedron Brook Floodway and Cannery Creek (Greenline indicates estuarine limits)

Gateway Upgrade Project Surface Water QualityEnvironmental Impact Statement
16 AUGUST 2004 REVISION 7 12.16
0
0.1
0.2
0.3
0.4
0.5
0.6
KB1 KB2 CC2Sampling Site
TP (m
g/L)
Apr-04
May-04
Figure 12.3b Phosphorous levels within Kedron Brook Floodway and Cannery Creek(Green line indicates estuarine limits)
0
0.002
0.004
0.006
0.008
0.01
KB1 KB2 CC2Sampling Site
Cop
per (
mg/
L)
Apr-04
May-04
Figure 12.3c Copper levels within Kedron Brook Floodway and Cannery Creek
0
0.001
0.002
0.003
0.004
0.005
KB1 KB2 CC2Sampling Site
Lead
(mg/
L)
Apr-04
May-04
Figure 12.3d Lead levels within Kedron Brook Floodway and Cannery Creek

Gateway Upgrade Project Surface Water QualityEnvironmental Impact Statement
16 AUGUST 2004 REVISION 7 12.17
0
0.02
0.04
0.06
0.08
0.1
KB1 KB2 CC2Sampling Site
Zinc
(mg/
L)
Apr-04
May-04
Figure 12.3e Zinc levels within Kedron Brook Floodway and Cannery Creek
0
0.005
0.01
0.015
0.02
KB1 KB2 CC2Sampling Site
Nic
kel (
mg/
L)
Apr-04
May-04
Figure 12.3f Nickel levels within Kedron Brook Floodway and Cannery Creek
Summary of Water QualityBased on existing data and data collected for the EIS, the water quality of Kedron BrookFloodway and Cannery Creek is poor. Bramble Bay has poor water quality and tidal flushingwould contribute to the high nutrient levels as well as the input from urban sources. The highheavy metal concentrations could be attributed to historic and existing industry located adjacentto the waterways or other upstream catchment land uses. High levels of nutrients and copperlevels are the main consistent concerns within Kedron Brook Floodway and Cannery Creek.
12.8.3 Potential ImpactsDirect impacts to Kedron Brook Floodway include vegetation and erosion and sedimentationassociated with new bridges, widening bridges and culvert extensions.
The key locations for potential construction and operation related impacts include areas close tocreeks and drainage lines:
• Between CH19100-20199 large amounts of earthworks will occur near drainage lines;• Between CH21800-22400 earthworks and mangrove removal will occur;• The construction of bridges over Kedron Brook Floodway (CH22900-23200) has the
potential to impact upon water quality during earthworks and piling works; and• The flood mitigation works on the Kedron Brook floodplain.

Gateway Upgrade Project Surface Water QualityEnvironmental Impact Statement
16 AUGUST 2004 REVISION 7 12.18
Indirect impacts include sedimentation and erosion, changes to water quality duringconstruction and operation from road runoff, and potential pollutants from vehicles. The qualityof water leaving the site during the construction phase will differ to that experienced during theoperation phase of the GUP, and as such different management measures will be required.
The hydraulic connection between Kedron Brook Floodway and Moreton Bay, is the mainpathway, after the Brisbane River, by which impacts might be generated.
The potential impacts associated with this section of the GUP are the same as the ClevelandBranch Rail Line to Pinkenba Rail Line section (refer Section 12.7.3).
Within the Kedron Brook Floodway, the road will be raised above the full width of the floodplainon piles, thereby reducing any possible restriction to flood flows in this area.
Potential Construction Related ImpactsThe potential sources of groundwater and/or surface water contamination during GUPconstruction, which will require appropriate measures to avoid or minimise potential waterquality impacts, are as follows:
• Disturbance of acid sulphate soils;• Sediment from disturbed areas;• Disturbance of instream sediments in Kedron Brook Floodway and tributaries;• Hydrocarbon or chemical leaks and small scale spill from vehicles;• Hydrocarbons of chemical spills from storage areas;• Discharges from temporary sewerage and site facilities; and• Storage and disposal of waste material.
Details of the potential impacts are provided in the Section 12.7.3. Also the following potentialimpacts are discussed in other sections of the EIS:
• Acid sulphate soils and contaminated soils (refer Section 10);• Decrease in groundwater quality (refer Section 13); and• Decrease in downstream aquatic values (refer Section 17 and Appendix M5).
Potential Operation Related ImpactsThe potential operational impacts from road runoff are provided in Section 12.7.3 and AppendixM4.
The management of stormwater from the pavement in this section is an important issue due tothe area being on a floodplain and the potential for runoff and associated contaminants to easilyenter waterways.
12.9 Summary of ImpactsOverall water quality within the watercourses that could potentially be affected by GUP is poor. Thereare high levels of nutrients and in some locations high levels of heavy metals. The reasons for thiscould be attributed to a number of factors, however the potential impact from GUP could contribute toworsen the poor water quality within these systems.

Gateway Upgrade Project Surface Water QualityEnvironmental Impact Statement
16 AUGUST 2004 REVISION 7 12.19
The large quantities of earthworks during construction near drainage lines, creeks and rivers have thepotential to increase turbidity and vegetation removal on riverbanks has the potential to promotesedimentation. These activities could potentially supply waterways with nutrients and pollutantsattached to sediment, further degrade water quality and impact upon aquatic flora and fauna.
To ensure that potential impacts are minimised, mitigation measures need to be implemented for allphases of GUP as discussed below.
12.10 Mitigation Measures
12.10.1 DesignA number of management options exist for the management of road runoff during theoperational phase of the GUP. It is important to note that the existing Motorway has minimalformal treatment of road runoff prior to discharge into receiving waters. The potential physical,chemical and biological impacts of this practise is somewhat offset by the natural dilution effectsexperienced when road runoff enters a receiving environment. The effectiveness of thisdepends heavily upon the volume of the receiving waters and the volume of contaminants inrunoff. While the large water volumes in Brisbane River and Moreton Bay are likely to besufficient to dilute direct runoff such that no adverse effects are observable, this practice wouldstill contribute to the total pollutant load entering the waterway. More effective treatmentmeasures for road runoff include source reduction (eg emissions from cars) and other roadsidemanagement practices (which is outside the scope of this EIS) and stormwater design controlswhich remove pollutants from runoff prior to discharge into a waterway.
A high level of water quality treatment control is required at areas which represent the highestrisk of decreasing water quality and waterway values. These areas are identified by proximity tosensitive receiving environment and the likelihood of contaminants entering waterways. For theGUP, areas requiring a high level treatment control include:
• The new Gateway Bridge (runoff enters Brisbane River and eventually Moreton Bay);• Pavement runoff discharged into Bulimba Creek and associated mangroves;• Pavement runoff discharged into Kedron Brook Floodway and associated mangroves;• Culvert extensions located along route;• Wynnum Road interchange;• Port of Brisbane Motorway interchange;• Lytton Road interchange;• Old Brisbane Airport site (TCC); and• Northern airport access interchange; and• All proposed construction sites.
In principle, it is generally relatively easy to collect and treat runoff from major road projectssince they typically have well defined drainage channels and above ground stormwater outlets.As such, runoff can be relatively easily collected and treated prior to final discharge. Thereforeroad runoff generated should be targeted for treatment prior to discharge to the environment.
The best management practice for treating stormwater is using two or more treatment options ina series. By using a number of stormwater management measures in a sequence, or“treatment train” approach, the overall performance of a water quality treatment system isimproved. The optimum treatment train approach utilises primary, secondary and tertiarytreatment devices in succession. A primary device removes gross pollutants and coarsesediments, a secondary device removes finer sediments and pollutants while a tertiary device

Gateway Upgrade Project Surface Water QualityEnvironmental Impact Statement
16 AUGUST 2004 REVISION 7 12.20
removes extremely fine or soluble material. A variety of stormwater management measurescan be incorporated into the design to create a treatment train.
The following design criteria should be applied:
• The quality of runoff from GUP should approach the guidelines shown in the table belowwhere possible.
Table 12.3 Water Quality Guidelines
Water Quality Indicator Design Guideline Level
Total Suspended Solids <80mg/L
Lead 1-5µg/L (depending on water hardness)
Zinc 5-50µg/L (depending on water hardness)
Copper 2-5µg/L (depending on water hardness)
Hydrocarbons <10mg/L
Total Phosphorous 10-100µg/L
Total Nitrogen 100-750µg/L
Cadmium 0.2-2µg/L (depending on water hardness)
Chromium (total) <10µg/L
Nickel 15-150µg/L (depending on water hardness
pH 6.5-9.0
• All permanent water quality treatment control devices must be designed for the adequatecontrol of pollution and sediment and other coarse materials in the 1 year AverageRecurrence Interval (ARI) peak flow (minimum), and also designed for the stability ofthese devices in at least the 20 year ARI peak storm event;
The following stormwater management measures should be incorporated and further developedas part of the detail design of the GUP:
• Grassed/vegetated swales located alongside Motorway and ramps;• Batter slopes to be grassed/vegetated and rock check dams be installed where
appropriate;• Permanent settlement ponds and detention basins to be constructed if required at key
locations along the route;• Gross pollutant traps to be installed at key locations along the route;• Planning and development of specific fuelling sites, concrete or bitumen waste
containment areas and installation of temporary sediment basins; and• First flush surface runoff from new bridge decks will not be directly discharged into any
roadway below or into any stream or watercourse, but will be diverted to the end of thestructure, collected and treated to conform with the requirements of the design waterquality objectives in Table 12.3.

Gateway Upgrade Project Surface Water QualityEnvironmental Impact Statement
16 AUGUST 2004 REVISION 7 12.21
12.10.2 ConstructionDuring construction, the management of drainage is the most critical aspect of erosion control.A range of erosion and sediment control devices, including sedimentation basins, should beutilised during the construction phase. During the construction phase of this project, it will beimportant to implement stringent erosion and sediment control devices in higher risk areas.These areas include but are not limited to all creek crossings and areas with steep slopes (referto Section 10).
Piling operations present challenges for sediment erosion and control often due to the limitedspace available for removal and/or containment of excavated materials, particularly where pilingis located within or adjoining an existing drainage line or watercourse. In such instances, thefollowing should be implemented:
• Isolation of the working area by temporary fencing, bunding, or sheetpiling to prevent theloss of erodable soils to surrounding receiving waters or drains; and
• Alternative drainage or flow bypass mechanisms such as pipes, culverts or geofabricliners may be temporarily required to divert drainage flows through the workspace whilstpreventing or minimising their erosive potential on unvegetated soils surrounding pilingoperations.
Other mitigation measures that should be implemented during construction include but are notlimited to:
• Any dewatering of trenches or excavations should be undertaken to stable ground and ina manner which prevents sediment laden water entering stormwater drains orwaterways. The water shall be treated to remove sediment if necessary;
• Liquid discharges from dewatering activities and wick drains should be contained,monitored for pH and selected contaminants and treated if required, prior to discharge.
• The amount of stormwater leaving a site should be minimised through onsite storageand reuse in construction requirements, dust suppression and revegetation;
• Works to be staged to minimise erosion;• Install cut off and diversion drains prior to significant land disturbance to divert runoff
from undisturbed areas into stable drainage lines at non-erosive velocities. Similarly,install cut off or diversions drains to divert runoff around stockpile sites;
• Stockpiles of water pollutants (eg oils, construction materials, fuels etc) should belocated so as to minimise the potential for contaminants entering Bulimba Creek,Brisbane River and Kedron Brook Floodway, or any other stormwater or drainagechannel;
• An area/s should be designated for the containment of waste concrete materials awayfrom watercourses or drainage lines. A bunded containment area, of earthern materialsor similar shall be formed and maintained. Any waste concrete, concrete washings orsimilar construction materials should be disposed of to the designated bunded area forcontainment, drying and treatment where required;
• When dry or solidified, the concrete material should be removed from the site fordisposal at a licenced waste disposal facility. Alternatively, the dry concrete can be re-used on site for temporary access tracks (as for gravel and rock);
• Chemicals storage and use should be managed as per the chemical storage andhandling management plan;
• Notification to the EPA under Section 320 of the Environmental Protection Act 1994(duty to notify environmental harm) may also be required;

Gateway Upgrade Project Surface Water QualityEnvironmental Impact Statement
16 AUGUST 2004 REVISION 7 12.22
• A contingency plan for accidental spills of toxic materials should be prepared and allonsite staff made aware of it. Specific runoff control measures for accidental spills oftoxic materials should be outlined in the contingency plan;
• Spill containment measures to be incorporated into the Construction EMP and proposedlocations of the stockpile and material storage, handling and treatment areas;
• Preparation of spill containment/clean up procedure should incorporate the followingprinciples as a minimum:– recording of spill/incident details, including date, time, location, volume/quantity,
source, material/contaminant identification, sensitive receptor identification, initialcontainment/clean up measures implemented, MSDS requirements for spillmanagement etc;
– communication pathways, requirements and documentation;– clean up and disposal/release documentation, including sampling and analysis
results and waste tracking documentation; and– document control compliance.
• All vehicles and equipment should be checked daily for possible fuel, oil and chemicalleaks and should maintain portable spill kits as complete;
• Any chemical or fuel spills should be cleaned up as per the chemical storage andhandling management plan. Where it is reasonably believed or expected that the spillhas entered a waterway, a water sample shall be collected in the area of the spill anddirectly downstream and analysed for the parameters outlined below and the chemical orfuel spilt. Water sampling containers shall be held at all times by the project manager forthe collection of a sample in the event of a spill;
• Cleaning of equipment and or vehicles used during the road construction should not beundertaken in locations that permit flow of untreated wastewater into any creek orwetland adjacent to the route;
• The use of fertilisers during revegetation works at the site should be the minimumnecessary to promote establishment, and shall be incorporated into soils or seedingmixes to minimise the likelihood of fertiliser being carried off site to watercourses;
• The Superintendent should monitor the bureau of meteorology weather forecasts for thearea, including prior to non-work periods such as Sundays. Where storms or significantrains are predicted, an inspection of the site including erosion and sediment controldevices, should be undertaken and repairs and improvements undertaken asappropriate;
• Where flood rains or floods are predicted to affect the area of the construction site,works will cease and the site should be made safe and as stable as practical. Prior towork closure periods such as Easter, Christmas and other public holidays, works shouldbe stabilised as for preparation for a significant storm event;
• A permit should be obtained from the DNRM&E prior to extraction of water from BulimbaCreek or any other watercourse;
• Should a temporary fill platform be required for pile driving operations, it should aim toachieve the following:– protect the watercourse from sedimentation by the use of geofabric and rock
protection and using fill material which does not contain fines;– protect the opposite bank from diverted water where the platform does not
completely cut the stream;– ensure that the watercourse can still flow by installing and monitoring appropriate
drainage pipes. Temporary drainage shall be designed to ensure erosion of thewatercourse bed does not occur;
– ensure that installation and removal of temporary structure does not causeerosion and sedimentation of the watercourse or chage in channel cross section.

Gateway Upgrade Project Surface Water QualityEnvironmental Impact Statement
16 AUGUST 2004 REVISION 7 12.23
• Revegetation should be done progressively (area by area) so that each area is given aprotective ground cover as soon as work is completed for that area. Revegetation shallin accordance with the Landscape Concept Plan (refer Section 22);
12.10.3 OperationEnvironmental impacts and associated controls to contain discharges resulting from emergencysituations will be detailed in the EMP (Maintenance).
All runoff water from the structures to be constructed could be collected and treated usingcombinations of gross pollutant traps, or proprietary oil/water separators, or sediment basinsand other properly constructed and/or configured treatment devices such as grassed filterstrips, swale drains and bioretention basins. The precise nature of such treatment devices willbe a function of locally specific factors such as access to stormwater infrastructure, availablespace, and maintenance costs.
12.10.4 Water Quality Monitoring
Baseline MonitoringA baseline surface water quality monitoring program will be conducted by MR for rain eventmonitoring prior to the commencement of construction activities (refer Section 23 for details).
ConstructionA water quality monitoring program will need to be implemented during the construction phaseto ensure that water quality objectives are met and that potential impacts to water quality aremonitored and mitigated during construction. Replicate water samples should be collected fromsampling sites upstream and downstream of the construction area. Recommended sites arelisted below, however as long as sampling sites are located a reasonable distance upstreamand downstream from construction area (ie between 100m-200m) they will be satisfactory.
Samples should be taken on two occasions (minimum 2 week interval) at the sampling sitesdetailed below prior to commencement of construction to provide additional background data.One occasion should follow a rainfall event where possible. Monitoring will take place fortnightlyand during or immediately following storm events equal to or greater than 25mm/hour or asdirected by MR.
Recommended monitoring points are as follows:
• Bulimba Creek:– One sample 100-200m upstream and one sample 100-200m downstream of
CH11900;– One sample 100-200m upstream and one sample 100-200m downstream of
CH14700, where it crosses Bulimba Creek;• Kedron Brook Floodway area:
– One sample 100-200m upstream and one sample 100-200m downstream ofCH21000;
– One sample 100-200m upstream and one sample 100-200m downstream ofCH23000, where it crosses Kedron Brook Floodway;

Gateway Upgrade Project Surface Water QualityEnvironmental Impact Statement
16 AUGUST 2004 REVISION 7 12.24
• Brisbane River:– One sample 50-100m upstream and one sample 100-200m downstream of the
Gateway Bridge on the northside of the river;– One sample 50-100m upstream and one sample 100-200m downstream of the
Gateway Bridge on the southside of the river;• Additional monitoring points should be sampled by an appropriately qualified person if
visual evidence of site impacts extends beyond these points; and• If measured levels exceed the recommended water quality guidelines, then the
contractor should identify the source of increase and implement strategies to achieve anacceptable downstream water quality.
The following parameters and compliance requirements in Tables 12.3 and 12.4 are providedas the minimum monitoring requirements and shall be monitored at the sites listed above and atany additional locations specified by the Superintendent. Additional parameters may berequired to be monitored dependent on site activities and chemical spills.
The following parameters should be monitored insitu during a release from the worksite.Monitoring is required for each non stormwater release (eg dewatering). For stormwaterreleases monitoring is not required more frequently than once per 48 hour period.
Table 12.4 Insitu Monitoring Parameters
Parameter Compliance RequirementpH 6.5 – 9.0
Dissolved Oxygen (DO) 80 – 110 % saturation
Turbidity (NTU) 6.50
Oils No visible films or odours.
Litter No visible litter.
Samples should be collected for analysis of the following parameters during a release from thework site. Monitoring is required for each non stormwater release. For stormwater releasesmonitoring is not required more frequently than once per 48 hour period (or twice in a 7 dayperiod where rainfall is of a consistent intensity – eg prolonged light rain).
Table 12.5 Laboratory Analysis Parameters
Parameter Compliance RequirementTotal Suspended Solids(TSS)
<10% change between upstream and downstream samplinglocations< 80mg/L (for non stormwater releases)
Oil and Grease (TPH) Oil etc not visible as a film on surface of waters<10mg/L
Nitrogen Based on background monitoring (stormwater release)500µg/L (freshwater) 300µg/L (marine) (non stormwater

Gateway Upgrade Project Surface Water QualityEnvironmental Impact Statement
16 AUGUST 2004 REVISION 7 12.25
Parameter Compliance Requirementrelease)
Phosphorus Based on background monitoring (stormwater release)50µg/L (freshwater) 30µg/L (marine) (non stormwater release)
Lead 0.0034mg/L (fresh) 0.0044mg/L (marine)*
Nickel 0.011mg/L (fresh) 0.007mg/L (marine)*
Zinc 0.008mg/L (fresh) 0.015mg/L (marine)*
Copper 0.0014mg/L (fresh) 0.0013mg/L (marine)*Table Notes:Based on ANZECC Water Quality Guidelines for Aquatic Ecosystems (2000) 95% protection values.* Toxicity depends on water hardness
12.11 Conclusions and RecommendationsCurrent water quality within the waterways downstream of the GUP is considered to be in poorcondition. Construction and operational impacts from the GUP will be minimal with the effectiveimplementation of sediment and erosion control devices, especially in high risk areas along the projectroute, and the implementation of other stringent mitigation measures. Impact on the aquatic receivingenvironments from stormwater discharges will be minimal due with the implementation of appropriatestormwater treatment devices along the length of the project route.
Direct impact to the water quality during construction will include short term impacts during piling withinand adjacent to watercourses. Impacts during operation will be minimised with the implementation ofstormwater treatment devices which will reduce the amount of nutrients and pollutants enteringwaterways.