GATED COMMUNITIES: USER SATISFACTION IN … · Gated communities which have the potential to...
21
CIB W084 “Building Comfortable and Liveable Environments for All” International Meeting “Universal Design At The Urban Scale” Georgia Tech University, Atlanta, USA 15-16 May 2008 176 GATED COMMUNITIES: USER SATISFACTION IN HOUSING ENVIRONMENT IN ISTANBUL Lale Berköz Istanbul Technical University Faculty of Architecture Department of Urban and Regional Planning Istanbul/Turkey e-mail: [email protected] Keywords: gated residential developments, satisfaction of housing and environmental quality, Istanbul Abstract Since the 1970’s, construction of the Bosphorus Bridge and the new highways, the rise in the use of private cars have increased the accessibility in Istanbul. Besides, Istanbul has gone through a structural transformation, becoming a multi-centred city. Such factors have naturally accelerated the decentralization of housing areas in Istanbul. Since the 1990’s, the preferences of the people from the elite social classes in Istanbul have shifted from the heterogeneous housing areas to homogenous places isolated from the dense central areas of Istanbul. As a result, mass housing areas have spread rapidly in the peripheries of the city. In this new transformation, the elite people living in such mass housing areas have found a chance to obtain their cultural and social expectations. This phenomenon has gained significance due to the demand for the northern and north-eastern districts of the city since the 1999 earthquake in the Marmora Region. Since we know the patterns of housing area development and density change, the potential future developments can be anticipated. The researches carried out until now have demonstrated that quality of the residence and residential environment is influential in the overall resident satisfaction. In terms of environmental quality variables such as basic urban services and amenities, it has been determined that the housing areas within the scope the project have high standards. As a result of this fact, people from high income group tend to choose housing areas in the peripheries of the city. Because of the lack of comprehensive survey of gated communities at a local and metropolitan scale, this paper analyses the sprawl of gated residential communities in Istanbul metropolitan area and aims to study spatial distribution of these communities and locational preferences. The study compares single-family and multi-family gated developments. In this study, in order to assess the factors that improve housing and environmental quality satisfaction, both the concepts of housing and its environment, and the subject of housing and environmental quality satisfaction have been investigated. 1. Giriş Gated communities which have the potential to transform the urban environment in the 21 st century. Gated communities represent an urban phenomenon that is spreading all over the world. The popularity of living in gated communities has been rising last decades. In a global context, gated communities are sprawling not only in the U.S., but also in Latin America,
Transcript of GATED COMMUNITIES: USER SATISFACTION IN … · Gated communities which have the potential to...

CIB W084 “Building Comfortable and Liveable Environments for All” International Meeting
“Universal Design At The Urban Scale” Georgia Tech University, Atlanta, USA
15-16 May 2008
176
GATED COMMUNITIES: USER SATISFACTION IN HOUSING ENVIRONMENT IN ISTANBUL
Lale Berköz
Istanbul Technical University Faculty of Architecture
Department of Urban and Regional Planning Istanbul/Turkey
e-mail: [email protected]
Keywords: gated residential developments, satisfaction of housing and environmental quality, Istanbul Abstract Since the 1970’s, construction of the Bosphorus Bridge and the new highways, the rise in the use of private cars have increased the accessibility in Istanbul. Besides, Istanbul has gone through a structural transformation, becoming a multi-centred city. Such factors have naturally accelerated the decentralization of housing areas in Istanbul.
Since the 1990’s, the preferences of the people from the elite social classes in Istanbul have shifted from the heterogeneous housing areas to homogenous places isolated from the dense central areas of Istanbul. As a result, mass housing areas have spread rapidly in the peripheries of the city. In this new transformation, the elite people living in such mass housing areas have found a chance to obtain their cultural and social expectations.
This phenomenon has gained significance due to the demand for the northern and north-eastern districts of the city since the 1999 earthquake in the Marmora Region. Since we know the patterns of housing area development and density change, the potential future developments can be anticipated.
The researches carried out until now have demonstrated that quality of the residence and residential environment is influential in the overall resident satisfaction. In terms of environmental quality variables such as basic urban services and amenities, it has been determined that the housing areas within the scope the project have high standards. As a result of this fact, people from high income group tend to choose housing areas in the peripheries of the city.
Because of the lack of comprehensive survey of gated communities at a local and metropolitan scale, this paper analyses the sprawl of gated residential communities in Istanbul metropolitan area and aims to study spatial distribution of these communities and locational preferences. The study compares single-family and multi-family gated developments. In this study, in order to assess the factors that improve housing and environmental quality satisfaction, both the concepts of housing and its environment, and the subject of housing and environmental quality satisfaction have been investigated.
1. Giriş Gated communities which have the potential to transform the urban environment in the 21st century. Gated communities represent an urban phenomenon that is spreading all over the world. The popularity of living in gated communities has been rising last decades. In a global context, gated communities are sprawling not only in the U.S., but also in Latin America,

CIB W084 “Building Comfortable and Liveable Environments for All” International Meeting
“Universal Design At The Urban Scale” Georgia Tech University, Atlanta, USA
15-16 May 2008
177
Europe and Asia (Blakely and Snyder, 1997). The subject has been given most attention in the United States, where the highest valuations estimate that nowadays more than 32 million Americans (12 percent) live in a gated community. There is little available information about the growth of GCs in the UK (Atkinson et al. 2003). The physical form of gating exists in the history for a long time and is widely seen in East Asia and Latin America. The gate and walls can at least date back to the walled city when the city was used for military defense (Wu, 2003). During the middle Ages, many towns built extensive walls to protect their citizens. With changing military technology and expanding political alliances, city walls gradually became unnecessary. Gated communities can be defined as residential areas for upper-class families who look for security, comfort, a better life quality and social homogeneity. They consist of neighborhoods closed by walls, barriers, fences and gates (Roitman, 2003). The concept includes residential areas with restricted access and defines a self-sufficient environment with swimming pools, private bars, children’s play areas and a full accompaniment of care-taking staff and security forces (Landman, 2000). The GCs life-style is mainly inspired by the historical golden-ghettos found in industrial-era cities, in New York, London and Paris. Those enclaves are now mainly suburban neighborhoods emphasizing on a “community life-style” and security features (Le Goix, 2003).
Gated neighborhoods have greatly developed since the 1970s, thus becoming one of the symbols of the metropolitan fragmentation and one of the increases of social segregation (Blakely and Snyder, 1997). There are different causes for arrival of gated communities, which can be divided into two groups: structural and subjective ones. Within the first group the most important ones are the raise of insecurity and fear of crime, the failure of the state to provide basic services to citizens, increasing social inequalities, an advancing process of social polarization and international trend encouraged by developers (Roitman, 2003). Urban violence and fear of crime are mentioned as the main reasons for moving to a gated community within the body of literature on the topic (Blakely and Snyder, 1997; Caldeira et al., 2000). But some researchers suggest that gated communities are not safe places (Blakely and Snyder, 1997).
The literature of gated community is divers. Insights have been drawn from a wide range of studies on the conditions upon which gated communities have been created. These have been explained through different perspectives: the critique of fortress city (Davis, 1990), transformation of civil to consumer spaces (Christopherson, 1994), the end of public space (Mitchell, 1995), social polarization and segregation (Caldeira, 1996), the fear of the crime and surveillance (Low, 2001), private governance and homeowners’ association (McKenzie, 1994), and the club realm of service delivery (Webster, 2001). They are criticized as exclusive, reactionary, and socially isolating (Low, 2001; Marcuse, 1997; Wilson-Doenges, 2000). The academic planning literature would seem to suggest that gating contravenes professional planning principles of openness, access, diversity, and equity.
Some early academic works on gated communities also offered harsh critiques, depicting them as symbols of America’s lost sense of community life (McKenzie, 1994).
2. Residential Satisfaction in Housing Areas The research of residential satisfaction and environmental quality has become one of the important objectives of city policy and urban planning. Since the 1970s researchers have increasingly examined the relationship between resident satisfaction and physical and social

CIB W084 “Building Comfortable and Liveable Environments for All” International Meeting
“Universal Design At The Urban Scale” Georgia Tech University, Atlanta, USA
15-16 May 2008
178
aspects of the residential environments. Some of these studies are theoretical, while others are practical. In the theoretical approach, satisfaction studies have been concerned with developing the RS model, which intends to find out the process of RS. User satisfaction has been discussed in various empirical studies which examine personal characteristics (cognitive, affective or behavioural) or physical and social features of residential environment (Amerigo, 2002).
Francescato et. al. (1974) have considered that RS in dwelling is composed of objective-individual and objective-physical features, as well as user expectations from the housing environment. Galster and Hesser (1981) have provided a model of housing user satisfaction by using path analysis. Their model has been defined by summarizing the relationship between objective-independent and subjective-interventional variables. When the conceptual model of Marans and Spreckelmeyer (1981) is examined, the objective features of the physical environment are used to understand the correlation between housing user satisfaction and behaviour. Their model not only shows that housing satisfaction is influenced by perceptions and evaluations of objective environmental features, but also user behaviour is affected by environmental satisfaction.
In the definitions underlining effective component, user satisfaction in housing means reflecting the sentiments of satisfaction and happiness to the housing place which also creates these feelings (Gold, 1980; Weidemann and Anderson, 1985). In the definitions underlining cognitive component, however, user satisfaction in housing is constituted by the correspondence between the current conditions of the users and the standards they expect and demand (Campbell et al, 1976; Marans and Rodgers, 1975; Wiesenfeld, 1992). In the cognitive approach, Bardo and Hughey (1984), Canter and Rees (1982), Morrissy and Handal (1981) have suggested that if the gap between demands and needs decreases, housing area user satisfaction increases. Amerigo and Aragones (1997) presented a theoretical and methodological approach to the study of residential satisfaction, and gave a general view of the relationships between people and their residential environment. Amerigo's model (2002) is based on the subjective user evaluations about the objective housing area environment that is defined in terms of physical and social features. Kamp et al. (2003) constructed a multidisciplinary conceptual framework of environment quality and quality of life for the advancing of urban development, environmental quality and human well-being. Marans (2003) described subjective and objective indicators for measuring the quality of community life.
There is a strong relationship between residential preferences and satisfaction (Ge and Hokao, 2006). Garling and Friman (2002) noted that residential satisfaction is a natural criterion to judge the success of residential selection. In their research, activities leading to the achievement of life values were identified as objectives. Carvalho et al (1990) first measured residential satisfaction in gated communities in Brazil. Their study was based on a conceptual model developed by Weidemann and Anderson, (1985) which combines personal characteristics with objective environmental attributes in predicting and measuring residential satisfaction in gate-guarded neighbourhoods in Brazil.
3. Research Area and Methodology
The data was collected by a questionnaire survey selected through a systematic random sampling in Istanbul. In the scope of this study 802 questionnaires were responded in face to face interviews in single-family and multi-family residential areas in Istanbul.

CIB W084 “Building Comfortable and Liveable Environments for All” International Meeting
“Universal Design At The Urban Scale” Georgia Tech University, Atlanta, USA
15-16 May 2008
179
In the scope of this study 401 questionnaires have been made by personal interviews with the heads of the single-family gated communities’ households. In order to specify the determinants of residents’ satisfaction in single-family gated estates, samples have been chosen in 11 districts of Istanbul (Avcılar, Bakırköy, Beşiktaş, Beykoz, B. Çekmece, Eyüp, Kartal, Pendik, Sarıyer, Tuzla, Üsküdar), which are single-family gated housing areas around the peripheries of Istanbul (Berköz, 2008). These housing estates have been situated in the periphery of Istanbul since the 1999 earthquake in the Marmora Region. This questionnaire survey was carried out in the year 2006.
In order to specify the determinants of user satisfaction in housing and environmental quality, samples have been chosen among the multi-family mass housing areas (constructed by National Housing Authority, Emlakbank and Municipality of Istanbul Metropolitan Area) with a population of over 5000 inhabitants. These mass housing areas are situated in zones 10-15 km, 15-20 km, 20-25 km, and 25+ km far away from Eminönü centre, which are located in non-core areas of Istanbul in the peripheral districts. This questionnaire survey was carried out in the year 2004 (Kellekci and Berkoz, 2006). While selecting these samples, questionnaire quota has been applied proportional to the population of each mass housing (Table 1a).
Distance from Eminönü center (km)
Population of Mass Housing Area
Total area (ha)
Density of housing area (person/ha)
Number of questionnaires
District of Mass housing area
35 59 0,60 99 4 Avcılar 15 181 1,85 89 5 Bakırköy
3 122 1,90 63 2 Beşiktaş
33 10.293 346,10 38 102 Beykoz 45 2.813 57,37 65 141 Büyükçekmece 22 4.323 125 34 15 Eyüp 54 211 8 26 4 Kartal 62 1.201 16,55 64 12 Pendik 30 6.594 126,80 52
101 Sarıyer
9 1.325 14,1 94 15 Üsküdar Table 1a Characteristics of selected Gated Single-Family Gated Communities
Distance from Eminönü center (km)
Population of Mass Housing Area
Total area (ha)
Density of housing area (person/ha)
Number of questionnaires
District of Mass housing area
12 80.000 450 225 64 Kadıköy 15 75.000 377 200 60 Bakırköy 20 234.000 1153 213 187 Küçükçekmece 25 60.000 470 130 48 Avcılar 35 44.000 165,9 273 36 Büyükçekmece 40 9.300 14,3 650 6 Pendik
Table 1b Characteristics of selected Gated Multi-Family Communities

CIB W084 “Building Comfortable and Liveable Environments for All” International Meeting
“Universal Design At The Urban Scale” Georgia Tech University, Atlanta, USA
15-16 May 2008
180
In the first stage of the study the arithmetic mean and the standard deviation values have been analysed based on the answers related to accessibility to function areas and satisfaction in the various facilities in the housing environment, which affect the overall satisfaction in housing and housing environment. In the questionnaire form, the degree of user agreement is indicated on a continuous scale from 1 to 5, which has enabled us to calculate the arithmetic mean and the standard deviation value for each answer. Arithmetic mean value reflects the degree of agreement to a statement/subject matter. This enables the subject matters to be ranged meaningfully. Thus, it is possible to determine which question in the questionnaire form the participants have agreed with a higher level.
In the second stage of the study factor analysis has been used in order to specify the determinants of user satisfaction in housing and environmental quality. As a result of factor analysis, factor groups that increase the level of user satisfaction in housing and environmental quality have been specified. The elements influencing these factor groups include accessibility to various function areas in the residential area, environmental features of the housing, satisfaction in the various facilities in the inhabited environment, environmental security, neighbor relationships, and the appearance of the housing environment.
Figure 1 The locations of the study area
3.1. Descriptive statistics
Respondent profiles and residence quality of gated single-family houses are summarized in Table 2 (a, b). In the survey studies, 14,0% of housing users come from high-income and
CIB W084 “Building Comfortable and Liveable Environments for All” International Meeting
“Universal Design At The Urban Scale” Georgia Tech University, Atlanta, USA
15-16 May 2008
181
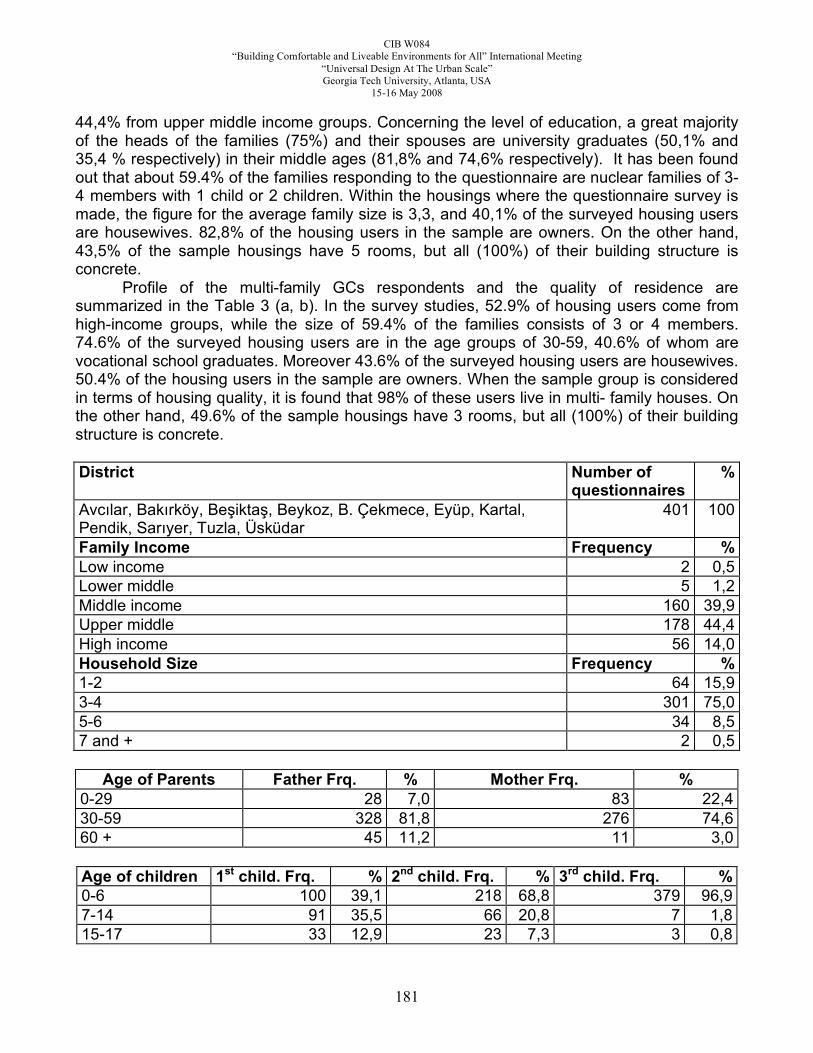
44,4% from upper middle income groups. Concerning the level of education, a great majority of the heads of the families (75%) and their spouses are university graduates (50,1% and 35,4 % respectively) in their middle ages (81,8% and 74,6% respectively). It has been found out that about 59.4% of the families responding to the questionnaire are nuclear families of 3-4 members with 1 child or 2 children. Within the housings where the questionnaire survey is made, the figure for the average family size is 3,3, and 40,1% of the surveyed housing users are housewives. 82,8% of the housing users in the sample are owners. On the other hand, 43,5% of the sample housings have 5 rooms, but all (100%) of their building structure is concrete.
Profile of the multi-family GCs respondents and the quality of residence are summarized in the Table 3 (a, b). In the survey studies, 52.9% of housing users come from high-income groups, while the size of 59.4% of the families consists of 3 or 4 members. 74.6% of the surveyed housing users are in the age groups of 30-59, 40.6% of whom are vocational school graduates. Moreover 43.6% of the surveyed housing users are housewives. 50.4% of the housing users in the sample are owners. When the sample group is considered in terms of housing quality, it is found that 98% of these users live in multi- family houses. On the other hand, 49.6% of the sample housings have 3 rooms, but all (100%) of their building structure is concrete.
District Number of
questionnaires %
Avcılar, Bakırköy, Beşiktaş, Beykoz, B. Çekmece, Eyüp, Kartal, Pendik, Sarıyer, Tuzla, Üsküdar
401 100
Family Income Frequency % Low income 2 0,5 Lower middle 5 1,2 Middle income 160 39,9 Upper middle 178 44,4 High income 56 14,0 Household Size Frequency % 1-2 64 15,9 3-4 301 75,0 5-6 34 8,5 7 and + 2 0,5
Age of Parents Father Frq. % Mother Frq. % 0-29 28 7,0 83 22,4 30-59 328 81,8 276 74,6 60 + 45 11,2 11 3,0
Age of children 1st child. Frq. % 2nd child. Frq. % 3rd child. Frq. % 0-6 100 39,1 218 68,8 379 96,9 7-14 91 35,5 66 20,8 7 1,8 15-17 33 12,9 23 7,3 3 0,8

CIB W084 “Building Comfortable and Liveable Environments for All” International Meeting
“Universal Design At The Urban Scale” Georgia Tech University, Atlanta, USA
15-16 May 2008
182
18+ 32 12,5 10 3,2 2 0,5
Family Education Father Frq. % Mother Frq. % Primary school 16 4.3 30 8.1 Secondary school 6 1.6 29 7.8 High school 132 35.9 150 40.6 Vocational school 30 8.1 30 8.1 University 185 50.1 131 35.4
Occupation Father Frq. % Mother Frq. %
Manager 11 2,9 4 1,0 Civil servant 11 2,9 28 7,2 Tradesman Artist 4 1,1 8 2,1 Artisan - - 4 1,0 Housewife - - 155 40,1 Retired 33 8,7 36 9,3 Tradesman 26 6,9 2 0,5 Academics 14 3,7 5 1,3 Teacher - - 17 4,4 Self-employed 124 32,7 37 9,6
House Ownership Frequency % Renter 46 11,5 Owner 332 82,8 Family House 23 5,7
Table 2a Respondent’s Profile (Gated Single-Family)
Building Type Frequency % Single Family houses 401 100 Number of Rooms Frequency % 1 1 0,2 2 2 0,5 3 90 22,4 4 134 33,4 5+ 174 43,5 Building Structure Frequency % Concrete 401 100 Heating Type Frequency % Central heating 401 100
Table 2b The Quality of Residence

CIB W084 “Building Comfortable and Liveable Environments for All” International Meeting
“Universal Design At The Urban Scale” Georgia Tech University, Atlanta, USA
15-16 May 2008
183
District Number of questionnaires % Ataşehir, Ataköy, Başakşehir, Halkalı, Bahçeşehir, Bizimkent, Mimaroba, Sinanoba, Kiptaş-Pendik
401 100
Family Income Frequency % Low income 16 4 Middle income 173 43.1 High income 212 52.9 Household Size Frequency % 1-2 109 27.2 3-4 238 59.4 5-6 54 13.4
Age of Parents Father Frq. % Mother Frq. % 0-29 73 19.7 83 22.4 30-59 265 71.6 276 74.6 60 + 32 8.6 11 3,00 Age of children 1st child. Frq. % 2nd child. Frq. % 3rd child. Frq. % 0-6 48 16.3 43 21.2 3 5.9 7-14 84 28.6 65 32 3 5.9 15-17 47 16 23 11.3 8 15.7 18+ 115 39.1 72 35.5 37 72.5 Family Education Father Frq. % Mother Frq. % Primary school 16 4.3 30 8.1 Secondary school 6 1.6 29 7.8 High school 132 35.9 150 40.6 Vocational school 30 8.1 30 8.1 University 185 50.1 131 35.4 Occupation Father
Frq. % Mother Frq. %
Worker 17 4.6 9 2.4 Civil servant 42 11.3 55 14.9 Tradesman 12 3.2 3 0.8 Artisan 19 5.1 10 2.7 Housewife 0 0.0 161 43.6 Retired 15 4 19 5.1 Tradesman 56 15 9 2.4 Lecturer 23 6.2 27 7.3 Self-employed 167 44.7 46 12.4

CIB W084 “Building Comfortable and Liveable Environments for All” International Meeting
“Universal Design At The Urban Scale” Georgia Tech University, Atlanta, USA
15-16 May 2008
184
House Ownership Frequency % Renter 131 32.6 Owner 202 50.4 Family House 66 16.5 Lodging 2 0.5
Table 3a Respondent’s Profile (Gated Multi-Family)
Building Type Frequency % Single Family houses 8 2 Multi-Family houses 393 98 Number of Rooms Frequency % 1 27 6.7 2 99 24.7 3 199 49.6 4 66 16.5 5+ 10 2.5 Building Structure Frequency % Concrete 401 100 Heating Type Frequency % Central heating 401 100
Table 3b The Quality of Residence
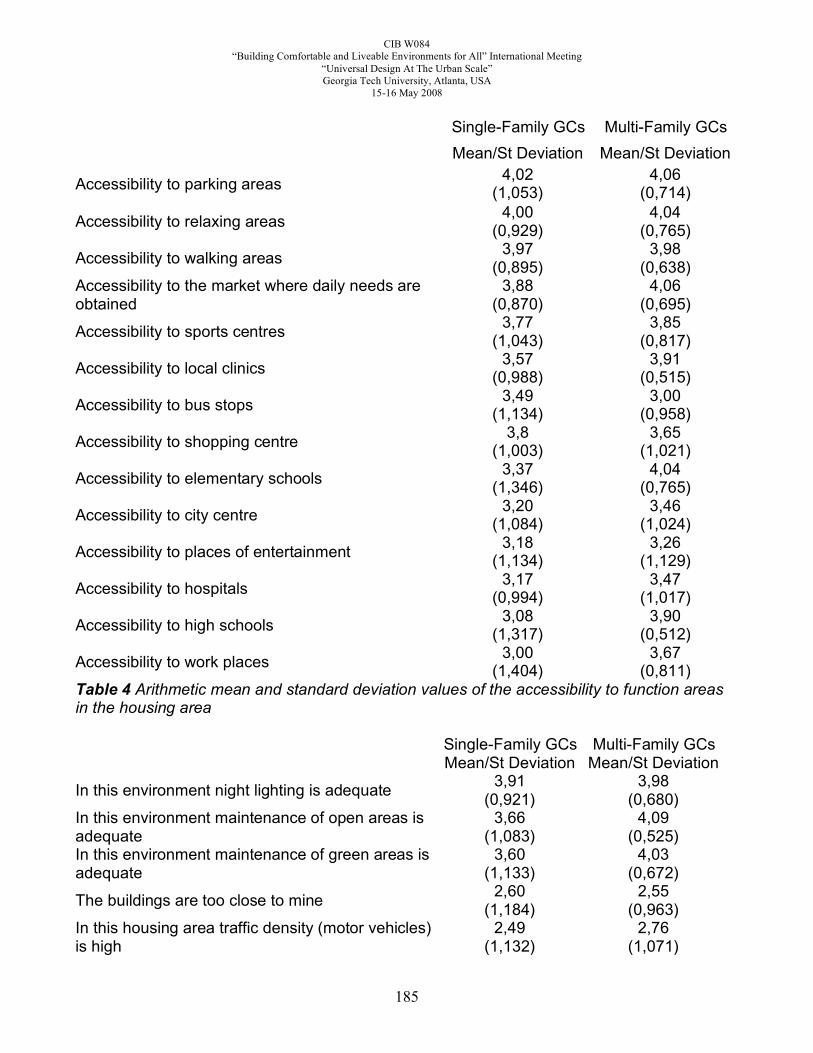
3.2. Perception of Housing and Environmental Quality: Arithmetic Mean and Standard Deviation
“Accessibility to Parking Areas”, “Accessibility to Recreation Areas and “Accessibility to Walking Areas” have yielded the highest arithmetic mean of the variables that affect housing area users’ satisfaction in the housing area they live in. On the other hand, the lowest criterion of accessibility in the table has been determined to be “Accessibility to Work Place” for single-family GCs. This outcome has arisen due to the fact that single-family housing areas are built in the peripheries of Istanbul. An analysis of the issue in terms of standard deviation values reveals that the criteria of “Accessibility to Parking Areas”, “Accessibility to Recreation Areas” and “Accessibility to Walking Areas”, which bear the highest arithmetic means, correspond to the lowest standard deviation values, denoting the high level of reliability.
Regarding the environmental characteristics where housing area users live, the variables with the highest arithmetic means have been determined, with high agreement, to be the criteria relating to maintenance of the environment such as “In this environment night lighting is adequate”, “In this environment maintenance of open areas is adequate”, and “In this environment maintenance of green areas is adequate” (Table 5). Since middle and high-income groups generally live in the gated communities in Istanbul, the field study has ascertained that housing environment is regularly maintained in these housing areas. Users’ positive agreement to the statements above as an expression of their satisfaction also supports that maintenance of the environment is adequate in gated communities. In the Table 5 the statement of lowest agreement has been found to be “This housing area is small with respect to its population”, which reveals that residents are satisfied with the density of the housing area.
CIB W084 “Building Comfortable and Liveable Environments for All” International Meeting
“Universal Design At The Urban Scale” Georgia Tech University, Atlanta, USA
15-16 May 2008
185
Single-Family GCs Multi-Family GCs Mean/St Deviation Mean/St Deviation
Accessibility to parking areas 4,02 (1,053)
4,06 (0,714)
Accessibility to relaxing areas 4,00 (0,929)
4,04 (0,765)
Accessibility to walking areas 3,97 (0,895)
3,98 (0,638)
Accessibility to the market where daily needs are obtained
3,88 (0,870)
4,06 (0,695)
Accessibility to sports centres 3,77 (1,043)
3,85 (0,817)
Accessibility to local clinics 3,57 (0,988)
3,91 (0,515)
Accessibility to bus stops 3,49 (1,134)
3,00 (0,958)
Accessibility to shopping centre 3,8 (1,003)
3,65 (1,021)
Accessibility to elementary schools 3,37 (1,346)
4,04 (0,765)
Accessibility to city centre 3,20 (1,084)
3,46 (1,024)
Accessibility to places of entertainment 3,18 (1,134)
3,26 (1,129)
Accessibility to hospitals 3,17 (0,994)
3,47 (1,017)
Accessibility to high schools 3,08 (1,317)
3,90 (0,512)
Accessibility to work places 3,00 (1,404)
3,67 (0,811)
Table 4 Arithmetic mean and standard deviation values of the accessibility to function areas in the housing area
Single-Family GCs Multi-Family GCs
Mean/St Deviation Mean/St Deviation
In this environment night lighting is adequate 3,91 (0,921)
3,98 (0,680)
In this environment maintenance of open areas is adequate
3,66 (1,083)
4,09 (0,525)
In this environment maintenance of green areas is adequate
3,60 (1,133)
4,03 (0,672)
The buildings are too close to mine 2,60 (1,184)
2,55 (0,963)
In this housing area traffic density (motor vehicles) is high
2,49 (1,132)
2,76 (1,071)
CIB W084 “Building Comfortable and Liveable Environments for All” International Meeting
“Universal Design At The Urban Scale” Georgia Tech University, Atlanta, USA
15-16 May 2008
186
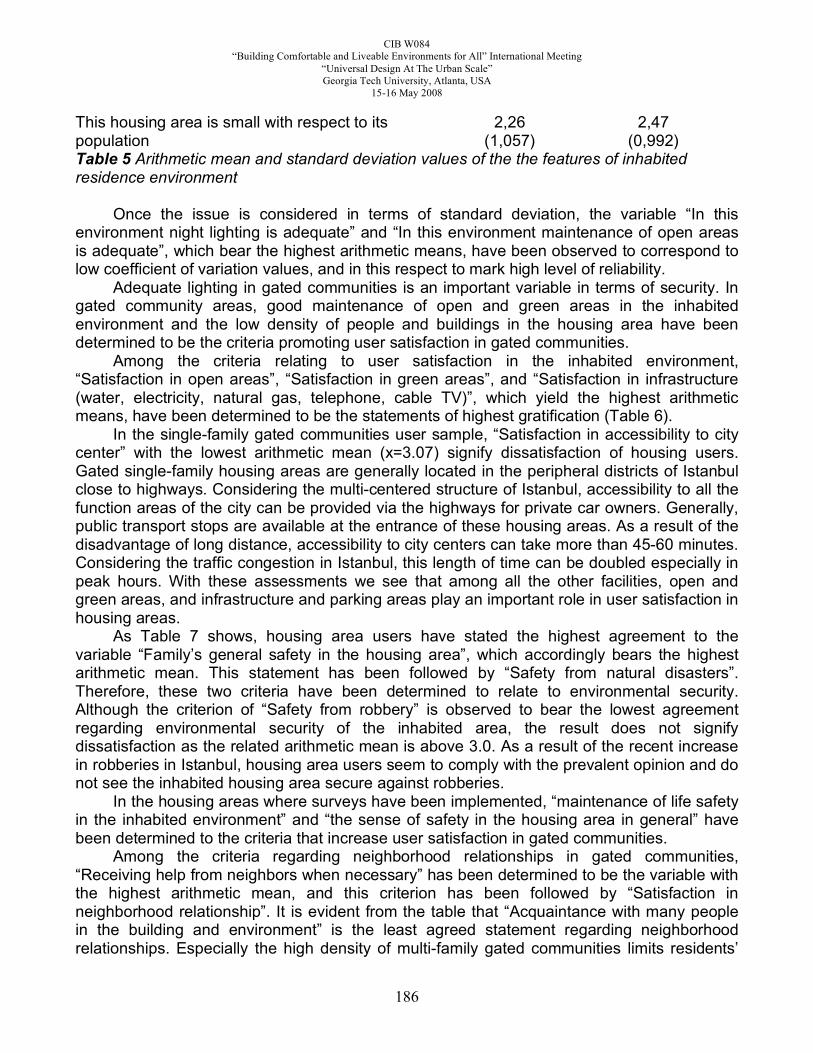
This housing area is small with respect to its population
2,26 (1,057)
2,47 (0,992)
Table 5 Arithmetic mean and standard deviation values of the the features of inhabited residence environment
Once the issue is considered in terms of standard deviation, the variable “In this environment night lighting is adequate” and “In this environment maintenance of open areas is adequate”, which bear the highest arithmetic means, have been observed to correspond to low coefficient of variation values, and in this respect to mark high level of reliability.
Adequate lighting in gated communities is an important variable in terms of security. In gated community areas, good maintenance of open and green areas in the inhabited environment and the low density of people and buildings in the housing area have been determined to be the criteria promoting user satisfaction in gated communities.
Among the criteria relating to user satisfaction in the inhabited environment, “Satisfaction in open areas”, “Satisfaction in green areas”, and “Satisfaction in infrastructure (water, electricity, natural gas, telephone, cable TV)”, which yield the highest arithmetic means, have been determined to be the statements of highest gratification (Table 6).
In the single-family gated communities user sample, “Satisfaction in accessibility to city center” with the lowest arithmetic mean (x=3.07) signify dissatisfaction of housing users. Gated single-family housing areas are generally located in the peripheral districts of Istanbul close to highways. Considering the multi-centered structure of Istanbul, accessibility to all the function areas of the city can be provided via the highways for private car owners. Generally, public transport stops are available at the entrance of these housing areas. As a result of the disadvantage of long distance, accessibility to city centers can take more than 45-60 minutes. Considering the traffic congestion in Istanbul, this length of time can be doubled especially in peak hours. With these assessments we see that among all the other facilities, open and green areas, and infrastructure and parking areas play an important role in user satisfaction in housing areas.
As Table 7 shows, housing area users have stated the highest agreement to the variable “Family’s general safety in the housing area”, which accordingly bears the highest arithmetic mean. This statement has been followed by “Safety from natural disasters”. Therefore, these two criteria have been determined to relate to environmental security. Although the criterion of “Safety from robbery” is observed to bear the lowest agreement regarding environmental security of the inhabited area, the result does not signify dissatisfaction as the related arithmetic mean is above 3.0. As a result of the recent increase in robberies in Istanbul, housing area users seem to comply with the prevalent opinion and do not see the inhabited housing area secure against robberies.
In the housing areas where surveys have been implemented, “maintenance of life safety in the inhabited environment” and “the sense of safety in the housing area in general” have been determined to the criteria that increase user satisfaction in gated communities.
Among the criteria regarding neighborhood relationships in gated communities, “Receiving help from neighbors when necessary” has been determined to be the variable with the highest arithmetic mean, and this criterion has been followed by “Satisfaction in neighborhood relationship”. It is evident from the table that “Acquaintance with many people in the building and environment” is the least agreed statement regarding neighborhood relationships. Especially the high density of multi-family gated communities limits residents’

CIB W084 “Building Comfortable and Liveable Environments for All” International Meeting
“Universal Design At The Urban Scale” Georgia Tech University, Atlanta, USA
15-16 May 2008
187
acquaintance with others in the building and the environment. Moreover, women’s participation in work life reveals that “neighborhood relationships” are below the desired level. “Adequate privacy from the neighbors in the immediate surroundings”, and “general satisfaction with the neighbors in the housing area” have been determined to the criteria promoting housing area user satisfaction.
As Table 9 indicates, “In general my housing is a good future investment in terms of the area it is situated in”, with the highest arithmetic mean, is followed by “This housing estate area looks beautiful”, and together these two statements have been determined the criteria regarding the housing environment appearance and economic value. On the other hand, it can be seen in the table that “In this housing area monotony is prevalent; buildings are all the same” has been assessed to be the statement of lowest agreement.
In housing estate areas, the housing’s future investment value in terms of the area it is situated in, and the beautiful appearance of the housing have been determined to be the criteria promoting user satisfaction. “Assessment of housings as good investment means for the future” by users has brought about a speculative rise in the housing sale values especially in big cities as a result of high inflation rates after the 80’s in Turkey. This, in return, has resulted in the conception of housings not only as a sheltering space but also a means of investment.
Single-Family GCs Multi-Family GCs
Mean/St Deviation Mean/St Deviation
Satisfaction in open areas 3,87 (0,932)
3,89 (0,802)
3,86 (0,961)
4,15 (0,527)
Satisfaction in infrastructure (water, electricity, natural gas, telephone, cable TV)
3,86 (0,930)
3,92 (0,904)
Satisfaction in walking areas 3,83 (0,922)
3,76 (0,774)
Satisfaction in traffic roads 3,82 (0,968)
3,71 (0,755)
Satisfaction in the scenery 3,81 (1,011)
3,70 (0,878)
Satisfaction in parking areas 3,78 (1,084)
3,92 (0,780)
Satisfaction in pedestrian paths 3,78 (1,010)
3,76 (0,774)
Satisfaction in relaxation areas 3,76 (1,039)
3,89 (0,882)
Satisfaction in social and neighborhood relationships
3,65 (0,991)
3,83 (0,927)
Satisfaction in sports centers 3,63 (1,104)
3,70 (0,843)
Satisfaction in children’s playgrounds 3,60 (1,103)
4,03 (0,429)
Satisfaction in social activities 3,27 3,38

CIB W084 “Building Comfortable and Liveable Environments for All” International Meeting
“Universal Design At The Urban Scale” Georgia Tech University, Atlanta, USA
15-16 May 2008
188
(1,066) (1,015)
Satisfaction in educational areas 3,24 (1,130)
3,78 (0,654)
Satisfaction in public transportation facilities 3,20 (1,119)
3,61 (0,974)
Satisfaction places of entertainment 3,15 (1,137)
3,33 (1,101)
Satisfaction in health facilities 3,14 (1,055)
3,73 (0,692)
Satisfaction in accessibility to city center 3,07 (1,068)
3,40 (0,993)
Table 6 Arithmetic mean and standard deviation values of the satisfaction in various facilities in the residence environment
Single-Family GCs Multi-Family GCs
Mean/St Deviation Mean/St Deviation
Family’s general safety in the housing area 4,05 (0,813)
3,81 (0,602)
Safety from natural disaters 4,00 (0,879)
3,71 (0,922)
Housing area’s safety against traffic accidents 3,98 (0,900)
3,71 (0,836)
Safety from criminals 3,94 (0,960)
3,84 (0,518)
Housing area’s protection against fire 3,89 (0,909)
3,77 (0,689)
Safety from robbery 3,89 (0,963)
3,58 (0,848)
Table 7 Arithmetic mean and standard deviation values of environmental safety
Single-Family GCs Multi-Family GCs
Mean/St Deviation Mean/St Deviation
Receiving help from neighbors when necessary 3,92 (0,805)
3,82 (0,819)
Satisfaction in neighborhood relationship 3,90 (0,812)
3,82 (0,799)
Satisfaction in neighbors 3,83 (0,872)
3,78 (0,880)
Sufficient privacy from te neighbours nearby 3,82 (0,869)
3,98 (0,811)
Satisfaction in social relationships 3,79 3,68

CIB W084 “Building Comfortable and Liveable Environments for All” International Meeting
“Universal Design At The Urban Scale” Georgia Tech University, Atlanta, USA
15-16 May 2008
189
(0,851) (0,934) Similarity among inhabitants of the housing area in terms of income level, education and origin
3,77 (0,875)
3,61 (0,870)
Acquaintance with many people in the building and environment
3,72 (0,903)
3,30 (1,048)
Table 8 Arithmetic mean and standard deviation values of neighbourhood relationship
Single-Family GCs Multi-Family GCs
Mean/St Deviation Mean/St Deviation
In general my housing is a good future investment in terms of the area it is situated in
4,03 (0,860)
3,79 (0,941)
This housing estate area looks beautiful 3,85 (0,838)
3,76 (0,737)
This housing estate reflects my income level and career 3,70 (0,950)
3,52 (0,962)
This housing estate area has an interesting appearance 3,11 (1,077)
3,32 (0,984)
In this housing area monotony is prevalent; buildings are all the same
3,00 (1,187)
3,23 (1,211)
Table 9 Arithmetic mean and standard deviation values of residence environment and economic value
Factors
Factor Loading
Eigen Value
Explained variance (%)
1. Factor: Satisfaction in open and green areas 5,939 11,6 Satisfaction in open areas ,861 Satisfaction in green areas ,853 Satisfaction in traffic roads ,781 Satisfaction in pedestrian paths ,779 Satisfaction in walking areas ,748 Satisfaction in relaxation areas ,728 Satisfaction in children’s playgrounds ,654 Satisfaction in the scenery ,595 Satisfaction in the sports centres ,517 Satisfaction in parking facilities ,502 2. Factor: Security of residential environment 4,112 8,0 Security against robbery ,808 Housing area’s protection against fire ,783 Security against natural disasters ,782 Transportation safety ,780 Security against criminals ,762 Family’s general safety in the housing area ,647

CIB W084 “Building Comfortable and Liveable Environments for All” International Meeting
“Universal Design At The Urban Scale” Georgia Tech University, Atlanta, USA
15-16 May 2008
190
3. Factor: Satisfaction in Social and Neighbourhood Relationships 3,145 6,1
Satisfaction in neighbourhood relationships ,921 Satisfaction in social relationships 835 Receiving help from neighbours when necessary ,812 Acquaintance with many people in the building and environment. ,792
4. Factor: Satisfaction in accessibility central facilities 3,112 6,1 Accessibility to various functional areas ,710 Accessibility to city centre ,698 Accessibility to relatives and friends ,665 Accessibility to places of entertainment ,645 Accessibility to shopping centre ,644 5. Factor: Propriety to user status 2,776 5,4 This housing estate reflects my income level and career ,787 Satisfaction in appearance of housing estate ,759 This housing estate area looks beautiful ,750 In general my housing is a good future investment in terms of the area it is situated in ,624
This housing estate area has an interesting appearance ,563 6. Factor: Accessibility to open areas 2,674 5,2 Accessibility to walking areas ,767 Accessibility to relaxing areas ,759 Accessibility to relaxing areas ,708 Accessibility to parking areas ,594 7. Factor: Satisfaction in Social and Public Facilities 2,591 5,0 Satisfaction in social activities ,782 Satisfaction in places of entertainment ,723 Satisfaction in health facilities ,652 Satisfaction in educational institutions ,601 8. Factor: Maintenance of the residential environment 2,344 4,5 Maintenance of open areas is adequate ,851 Maintenance of green areas is adequate ,831 In this environment night lighting is adequate ,690 9. Factor: Accessibility to Educational Institutions ,2,322 4,5 Accessibility to elementary schools ,848 Accessibility to high schools ,780 Accessibility to Universities ,687 10. Factor: Building and Traffic Density 2,160 4,2 This housing area is small with respect to its population ,795 The buildings are too close to mine ,782 In this housing area traffic density is high ,756 11. Factor: Accessibility to health facilities 1,698 3,3 Accessibility to local clinics ,781

CIB W084 “Building Comfortable and Liveable Environments for All” International Meeting
“Universal Design At The Urban Scale” Georgia Tech University, Atlanta, USA
15-16 May 2008
191
Accessibility to hospital ,696 12. Factor: Satisfaction in Public Transport 1,520 2,9 Satisfaction in public transport facilities ,711 Accessibility to bus stops ,711 Table 10 Results of the Factor Analysis (Gated Single Family House) Extraction method: Principal Component Analysis, Rotation Method: Varimax with Kaiser Normalization KMO: 0,85
3.3. Factor analysis results Factor analysis method has been applied to the analysis of data’s by using the SPSS
package program. In the questionnaire form, among factor analysis techniques “Factor Processing Technique” has been applied to the following variables: 51 variables related to user satisfaction of single and multi-family gated communities in housing and its environment.
As a result of factor analysis of single-family sample, factor groups that increase the level of user satisfaction in housing and environmental quality have been specified. The elements influencing these factor groups include satisfaction in open and green areas, security level of the inhabited environment, satisfaction in social and neighbourhood relationships, satisfaction in accessibility to central facilities, propriety to user status, accessibility to open areas, satisfaction in social and public facilities, maintenance of the residential environment, accessibility to educational institutions, building and traffic density, accessibility to health facilities, satisfaction in public areas.
In this research, gated single-family housing users who participated in the questionnaire rated the “satisfaction in open and green areas” the primary factor affecting housing environment satisfaction, which indicates that the standards of green and open areas in gated single-family residences are sufficient in terms of user satisfaction. In Istanbul, the density of housing areas leads to green and open areas’ being below standards, which also results in a decrease in quality of life. The most significant reasons of users for choosing especially these housing areas are low density, the high standards of open and green areas, and the easy accessibility to the nearby green areas such as the woods or forests. The proximity of such residences to forested areas explains this situation.
According to the results of factor analysis, being the point of departure for gated residential areas, “security of residential environment” has appeared to be the aspect to which gated single-family housing users in Istanbul attach the highest importance.
According to the statistical values presented Table 11, (Multi-family gated communities sample) the elements influencing these factor groups include satisfaction in accessibility central facilities, satisfaction in educational institutions, satisfaction in social and neighbourhood relationships, satisfaction in open areas, satisfaction in health facilities, satisfaction in parking facilities, building and traffic density, security of residential environment, satisfaction in public transport, satisfaction in infrastructure, satisfaction in social and neighbourhood relationships, satisfaction in open areas. “Satisfaction in accessibility to central facilities”, and “Satisfaction in educational institutions” as the most important factor groups affecting multi-family GC user satisfaction with the housing environment they live in can only be explained by the fact that these housing areas are closer to all kinds of urban facilities as a result of their proximity to city centers with respect to single-family housing areas. Especially the majority of single-family GCs are located in the peripheral districts in the

CIB W084 “Building Comfortable and Liveable Environments for All” International Meeting
“Universal Design At The Urban Scale” Georgia Tech University, Atlanta, USA
15-16 May 2008
192
north of Istanbul. In this respect, they are not directly connected to sea and railway access. Despite the good connection of large-scale multi-family GCs to the city’s railway and land public transportation systems, the high rate of car ownership leads to the preference of private car use by high-income groups.
Factors
Factor Loading
Eigen Value
Explained variance (%)
1. Factor: Satisfaction in accessibility central facilities 3,494 9,7 Satisfaction in places of entertainment ,767 Satisfaction in accessibility to city centre ,762 Accessibility to places of entertainment ,755 Accessibility to shopping centre ,684 Accessibility to various functional areas ,671 Accessibility to city centre ,594 2. Factor: Satisfaction in Educational Institutions 2,904 8,0 Accessibility to high schools ,931 Accessibility to elementary schools ,924 Satisfaction in educational institutions ,736 Accessibility to Universities ,682 3. Factor: Satisfaction in Social and Neighbourhood Relationships 2,800 7,7
Satisfaction in neighbourhood relationships ,966 Satisfaction in neighbours ,952 Satisfaction in social relationships ,921 4. Factor: Satisfaction in Open Areas 2,446 6,7 Satisfaction in walking areas ,834 Satisfaction in relaxation areas ,808 Satisfaction in the sports centres ,789 5. Factor: Satisfaction in health facilities 2,107 5,8 Satisfaction in health facilities ,974 Accessibility to local clinics ,965 6. Factor: Satisfaction in parking facilities 2,079 5,7 Satisfaction in parking facilities Accessibility to parking areas 7. Factor: Building and Traffic Density 2,057 5,7 This housing area is small with respect to its population ,873 The buildings are too close to mine ,821 In this housing area traffic density is high ,699 8. Factor: Security of residential environment 1,962 5,4 Family’s general safety in the housing area ,825 Security against natural disasters ,779 Transportation safety ,719 9. Factor: Satisfaction in Public Transport 1,843 5,1 Accessibility to bus stops ,828

CIB W084 “Building Comfortable and Liveable Environments for All” International Meeting
“Universal Design At The Urban Scale” Georgia Tech University, Atlanta, USA
15-16 May 2008
193
Satisfaction in public transport facilities ,732 Accessibility to relatives and friends ,672 10. Factor: Satisfaction in infrastructure 1,743 4,8 Satisfaction in infrastructure (water, electricity, natural gas, telephone, cable TV) ,881
Satisfaction in shopping facilities ,861 11. Factor: Satisfaction in Social and Neighbourhood Relationships 1,523 4,2
Satisfaction in social activities ,837 Satisfaction in Social and Neighbourhood Relationships ,779 12. Factor: Satisfaction in Open Areas 1,491 4,1 Accessibility to relaxing areas ,862 Satisfaction in children’s playgrounds ,574 Accessibility to walking areas ,510 Table 11 Results of the Factor Analysis (Gated Multi Family Houses) Extraction method: Principal Component Analysis, Rotation Method: Varimax with Kaiser Normalization KMO: 0,63
4.4. Conclusion
Satisfaction evaluations are frequently required in order to determine the propriety of a residence environment to user expectations, needs and goals. Any evaluation we consider in grand scale is determinant in user satisfaction. In other words, user satisfaction in the residence environment reflects people’s response to the environment they live in. The term environment is related not only to the physical components of residence environment consisting of housing, development of the housing area, and neighborhood, but also to social and economic conditions. The findings of this study have ascertained that accessibility to green and open areas, maintenance and quality of the housing area, and security and the variety of facilities are significant to gated community user satisfaction. This result is parallel with the study results by Roitman (2003) and Landman (2000, 2003). According to the results of factor analysis, although there is a ranking difference between the factor groups that single-family and multi-family gated community users give the highest importance in the housing areas they live in, “accessibility to urban facilities”, “security”, “neighborhood relationships”, “user status”, and “accessibility to green areas” have been determined to be the issues of significance. The factor analysis results obtained in this study support the “definition of gated residence characteristics” that has been determined in the researches on gated residences in different countries of the world. This study has disclosed the necessity that the factors determining housing and environmental quality satisfaction should be taken into account during the planning process in order to increase user satisfaction in housing and environmental quality. Having considered the factors determining housing and environmental quality satisfaction, it will be possible to plan a more livable and more sustainable city life, which will thus provide higher a level of user satisfaction. References
Amérigo, M., Aragonés, J.I. (1990). Residential satisfaction in Council Housing. Journal of Environmental Psychology (10), 313-325.

CIB W084 “Building Comfortable and Liveable Environments for All” International Meeting
“Universal Design At The Urban Scale” Georgia Tech University, Atlanta, USA
15-16 May 2008
194
Amérigo, M. (2002). A Psychological Approach to the Study of Residential Satisfaction, In: Aragonés, J. I., Francescato, G. & Garling, T. (ed.), Residential Environments: Choice, Satisfaction, and Behavior, Westport, Bergin&Garvey, 81-99.
Amérigo, M., Aragonés, J. I. (1997). A theretical and methodological approach to the study of residential satisfaction. J. Environ. Psychol. (17), 47-57
Anderson, J., Weidemann, S., Butterfield, D.I. (1983). Using residents’ satisfaction to obtain priorities for housing rehabilitation. Renewal, rehabilitation and maintenance. (vol 1), Galva, Sweden: The National Swedish Institute for Building Research.
Atkinson, R., Blandy, S., Flint, J. & D. Lister, (2003). Gated communities in England, new Horizons research series, London: ODPM.
Bardo, J. W. & Hughey, J. B. (1984). The structure of community satisfaction in a British and an American community. The Journal of Social Psychology (124), 151-157.
Becker, F. D. (1974). Design for Living: The residents’ view of multifamily housing. Ithaca, New York, Center for Urban Development and Research, Cornell University.
Berköz, L. (2008). “İstanbul’da Korunaklı Tek-Aile Konutlarının Yerseçimi Özellikleri“, İTÜ BAP Destekli Araştırma Projesi (pr. No: 31981)
Berköz, L., Eyüboğlu, E. (2007). Intra Metropolitan Location of Producer-service FDI in Istanbul. European Planning Studies 15 (3), 357-381.
Berköz, L. (2006). Sprawling of Single Family Housing in Istanbul, Paper presented at the XXXIV IAHS World Congress-Sustainable Housing Design, Napoli (CD-Rom, Book of Abstracts, pp.210).
Berköz, L., 1994. İstanbul’da Merkezi İş Alanında Hizmet Sektörü Faaliyetlerinin Yerseçimi Özelliklerinin Saptanması. İstanbul, Report for ITU Research Project (in Turkish).
Blakely, E.J. & Snyder, M. G. (1997). Fortress America: Gated Communities in the United States, Washington, DC: Brookings Institutions Press.
Caldeira, T. (1996). “Fortified enclaves: the new urban segragation”, Public Culture, 8, 303-328.
Calderia, T. & Teresa P.R. (2000). City of Walls: Crime, Segregation, and Citizenship in São Paulo, California: University of California Press.
Campell, A., Converse, P.E. & Rodgers, W.L. (1976). The quality of American life New York, Russell Sage Foundation.
Canter, D. & Rees, K. (1982). A multivariate model of housing satisfaction. International Review of Applied Psychology ( 31) 185-208.
Carvalho, M., George, R. V. and Anthony, K. H. (1990). Residential satisfaction in Condominios Exclusivos (Gate-guarded Neighbourhoods) in Brazil. Environment and Behaviour 29 (6) 734-768.
Christopherson, S. (1994). The fortress city: privatized spaces, consume citizenship. In: Amin, A. (ed.), Post-Fordism: A Reader, Oxford: Blackwell.
Cook, C.C. (1988). Components of Neighborhood Satisfaction: Responses from Urban and Suburban Single-Parent Woman. Environment and Behavior 20 (2), 115-149.
Coy, M. (2006). Gated communities and urban fragmentation in Latin America: the Brazilian experience. GeoJournal (66), 121-132.
Dalkey, N.C. (1972). Studies in the Quality of Life. MA: Delphi and Decision Making Lexington Books.
Deutschman, H. D. (1972). The Residential Location Decision: Study of Residential Mobility. Socio-economic planning Sciences (6), 349-364.

CIB W084 “Building Comfortable and Liveable Environments for All” International Meeting
“Universal Design At The Urban Scale” Georgia Tech University, Atlanta, USA
15-16 May 2008
195
Enosh, N., Leslau, A., Shacham, J. (1984). Residential quality assessment: A conceptual modal and empirical test. Social Indicators Research (14), 453-476.
Francescato, G., Weidemann, S., Anderson, J.R. & Chenoweth, R. (1974). Evaluating residents’ satisfaction in housing for low and moderate income families: A multi-method approach. In: D.H. Carson (ed.), Man-Environment interactions: Evaluation and Applications: Environmental Design Research Association, Washington, D.C. (5), 285-296.
Francescato, G., Weidemann, S., Anderson, J.R., Chenoweth, R. (1979). Residents’ satisfaction in HUD-assisted housing: Design and management factors. Washington D.C., Office of Policy Development of Housing and Urban Development
Galster, G.C.& Hesser, G.W. (1981). Residential satisfaction: Residential and compositional correlates. Environment and Behavior (13), 735-758.
Garling, T., Friman, M. (2002). A psychological approach to the study of residential choice and satisfaction. In: Aragonés, J. I., Francescato, G. & Garling, T. (ed.) Residential Environments: Choice, Satisfaction, and Behavior, Westport: Bergin & Garvey, 55-80.
Ge, J., Hokao, K. (2006). Research on residential lifestyles in Japanese cities from the viewpoints of residential preferences, residential choice and residential satisfaction. Landscape and Urban Planning (78), 165-178.
Gold, J.R. (1980). An Introduction to behavioural geography, Oxford, University Press Oxford.
Gurin, G., Veroff, J., Feld, S. (1960). American View Their Mental Health. New York, Basic Books.
Hourihan, K. (1984). Context-dependent models of residential satisfaction: An analysis of housing groups in Cork, Ireland. Environment and Behavior (16), 369-393.
Jacobs, J. (1961). The Death and Life of Great American Cities. New York, Random House, Inc.
Jirovec, R.L., Jirovec, M.M., Bosse, R. (1985). Residential satisfaction as a function of micro and macro environmental conditions among urban elderly men, Research on Aging 7 (4), 601-616.
Kamp, I.V., Leidelmeijer, K., Marsman, G., Hollander, A. D. (2003). Urban environmental quality and human well-being towards a conceptual framework and demarcation of concepts; a literature study, Landscape Urban Plan. (65), 5-18.
Kellekci, Ö. L., Berköz, L. (2006). Mass Housing: User Satisfaction in Housing and its Environment in İstanbul,Turkey. European Journal of Housing Policy 6 (1), 77-99.
Landman, K. (2000). An international review of gated communities, CSIR Publication, Pretoria.
Lansing, J. B., Marans, R. W., Zehner, R. B. (1970). Planned Residential Environment, Ann Arbor, and Institute for Social Research.
Low, S. M. (2001). The edge and the center: gated communities and the discourse of urban fear. American Anthropologist 103 (1), 45 – 58.
Lawton, M.P., Yaffe, S., (1980). Victimization and fear of crime in elderly public housing tenants. Journal of Gerontology (35), 768-779.
Le Goix, R. (2003). “Gated communities sprawl in Southern California and social segregation?”, paper presented at ‘Gated Communities: Building Social Division or Safer Communities? Conference on 18 & 19 September 2003, Glasgow.

CIB W084 “Building Comfortable and Liveable Environments for All” International Meeting
“Universal Design At The Urban Scale” Georgia Tech University, Atlanta, USA
15-16 May 2008
196
Marans, R.W. & Rodgers, S.W. (1975). Toward an understanding of community satisfaction. In: A. Hawley & V. Rock (ed.) Metropolitan America in contemporary perspective. New York, Halstead Press, 299-352.
Marans, R.W. (1979). The Determinants of Neighborhood Quality: An Analysis of the 1976 Annual Housing Survey, U.S. Department of Housing and Urban Development, Housing Survey Studies, 3, U.S. Government Printing Office, Washington.
Marans, R.W., Spreckelmeyer, K. F. (1981). Evaluating Built Environment: A Behavioral Approach. Ann Arbor, University of Michigan.
Marans, R.W. (2003). Understanding environmental quality through quality of life studies: the 2001 DAS and objective indicators. Landscape Urban Plan. (65) 73-83.
Marcuse, P. (1997). “Walls of fear and walls of support” , in N. Ellin (Ed.), Architecture of fear, New York: Princeton architectural Press.
McKenzie, E. (1994). Privatopia: Homeowner Associations and the Rise of Residential Private Government, New Haven: Yale University Press.
Michelson, W., 1977. Environmental Choice, Human Behavior, and Residential Satisfaction. New York, Oxford University Press.
Mitchell, D. (1995). “The end of public space?”, Annals of the Association of American Geographers, 85:108 – 133.
Morrissy, E., Handal, P.J. (1981). Characteristics of the residential environment scale: Reliability and differential relationship to neighborhood satisfaction in divergent neighbourhoods. Journal of Community Psychology (9), 125-132.
Newman, O. (1972). Defensible Space. New York, Macmillan. Perkins, N., 1987. Residents’ Perception of Vandalism, Safety, and Maintenance at Four
St. Louis Low Income Housing Developments. Master’s Thesis, University of Illinois at Urbana-Champaign.
Rent, G.S., Rent, C.S. (1978). Low Income Housing: Factors Related to Residential Satisfaction. Environment and Behavior , 10(4), 459-487.
Roitman, S. (2003). “Who Segregates Whom?” paper presented to the conference on “Gated Communities: Building Social Division or Safer Communities?” held at the University of Glasgow.
Savasdisara, T. (1988). Residents’ Satisfaction and Neighborhood Characteristics in Japanese Urban Communities. Landscape and Urban Planning (15), 201-210.
Türkoğlu, H.D. (1997). Residents’ satisfaction of housing environments: the case of Istanbul: Turkey. Landscape and Urban Planning (39), 55-67.
Webster, C. (2001). “Gated cities of to-morrow”, Town Planning Review 72(2) 149 – 170. Weidemann, S., Anderson, J. R., (1982). Residents’ perception of satisfaction and safety: A
basis for change in multifamily housing. Environment and Behavior (14), 695-724. Weidemann, S., Anderson, J. (1985). A Conceptual framework for residential satisfaction.
In: Altmann, I., Werner, C., (Ed.) Home Environments. New York, Plenum Press, 153-182. Wiesenfeld, E. (1992). Public housing evaluation in Venezuela: A case study. Journal of
Environmental Psychology (12), 213-223. Wilson-Doenges, G. (2000). “An exploration of sense of community and fear of crime in
gated communities”, Environment and Behavior 32(5): 597 – 611 Wu, F. (2003). Rediscovering the ‘gate’ under market transition: from work unit compounds
to commodity housing enclaves, paper presented at ‘Gated Communities: Building Social Division or Safer Communities? Conference on 18 & 19 September 2003, Glasgow.