GATE W A Y - MDRC to College, a dual-enrollment ... Emily Froimson, Aubrey Perry, ... Bonsu, Melissa...
96
GATE W A Y TO COLLEGE Lessons from Implementing a Rigorous Academic Program for At-Risk Young People Jacklyn Altuna Willard Brian Bayes John Martinez September 2015
Transcript of GATE W A Y - MDRC to College, a dual-enrollment ... Emily Froimson, Aubrey Perry, ... Bonsu, Melissa...

Executive Summary
GATE W A YTO COLLEGE
Lessons from Implementing a Rigorous Academic Program
for At-Risk Young People
Jacklyn Altuna Willard Brian Bayes
John Martinez
September 2015


Gateway to College Lessons from Implementing a Rigorous Academic
Program for At-Risk Young People
Jacklyn Altuna Willard
Brian Bayes John Martinez
September 2015

This report is funded by the Edna McConnell Clark Foundation’s Social Innovation Fund, a
program of the Corporation for National and Community Service (CNCS). The Edna McConnell
Clark Foundation’s Social Innovation Fund includes support from CNCS and 15 private coinves-
tors: The Edna McConnell Clark Foundation, The Annie E. Casey Foundation, The Duke En-
dowment, The William and Flora Hewlett Foundation, The JPB Foundation, George Kaiser
Family Foundation, The Kresge Foundation, Open Society Foundations, Penzance Foundation,
The Samberg Family Foundation, The Charles and Lynn Schusterman Family Foundation, The
Starr Foundation, Tipping Point Community, The Wallace Foundation, and Weingart Foundation.
Dissemination of MDRC publications is supported by the following funders that help finance
MDRC’s public policy outreach and expanding efforts to communicate the results and implica-
tions of our work to policymakers, practitioners, and others: The Annie E. Casey Foundation,
Charles and Lynn Schusterman Family Foundation, The Edna McConnell Clark Foundation, Ford
Foundation, The George Gund Foundation, Daniel and Corinne Goldman, The Harry and Jeanette
Weinberg Foundation, Inc., The JBP Foundation, The Joyce Foundation, The Kresge Foundation,
Laura and John Arnold Foundation, Sandler Foundation, and The Starr Foundation.
In addition, earnings from the MDRC Endowment help sustain our dissemination efforts. Con-
tributors to the MDRC Endowment include Alcoa Foundation, The Ambrose Monell Foundation,
Anheuser-Busch Foundation, Bristol-Myers Squibb Foundation, Charles Stewart Mott Founda-
tion, Ford Foundation, The George Gund Foundation, The Grable Foundation, The Lizabeth and
Frank Newman Charitable Foundation, The New York Times Company Foundation, Jan Nichol-
son, Paul H. O’Neill Charitable Foundation, John S. Reed, Sandler Foundation, and The Stupski
Family Fund, as well as other individual contributors.
The findings and conclusions in this report do not necessarily represent the official positions or
policies of the funders.
For information about MDRC and copies of our publications, see our website: www.mdrc.org.
Copyright © 2015 by MDRC®. All rights reserved.

iii
Overview
Despite efforts to improve the high school graduation rate in the United States, an estimated 7,200 students drop out of high school every day — a staggering 1.3 million every year. Further, a recent report by the Center on Education and the Workforce at Georgetown University projects that by 2020, nearly 65 percent of U.S. jobs will require at least some college education, out of reach for those who are unable to earn a high school diploma. Much more comprehensive alternative educa-tion programs are needed that put dropouts and students at risk of dropping out on a path to earn high school diplomas while also providing them with the academic skills and support necessary to be successful in their postsecondary pursuits.
Gateway to College provides a comprehensive alternative education program in which students work toward earning their high school diplomas while simultaneously earning credits toward an associate’s degree or postsecondary certificate. It is uniquely ambitious in providing struggling students with opportunities often reserved for the highest achievers, in the belief that high expecta-tions and the right support can help more students complete high school and transition to college.
This report describes the implementation of Gateway to College. It has two main goals. The first is to provide an in-depth account of the Gateway to College model and to more precisely define the youth population the program serves. A clearer picture of the service population can provide insight into Gateway to College’s unique value and identify the students who might benefit most from it. The second goal is to describe the implementation of the Gateway to College model at three sites, assess the extent to which it is implemented as designed at those sites, and draw lessons for other Gateway to College sites.
The implementation study is guided by the following research questions:
1. What are the core elements of the Gateway to College model? Whom does the model serve?
2. Were the core elements of the Gateway to College model implemented as planned?
3. What kinds of adaptations were made to meet the demands of the local context and the needs of the local student population?
4. What factors facilitated or impeded successful program implementation?
This study finds that, at a broad level, the three study sites implemented the Gateway to College model as designed. However, Gateway to College struggled with finding the right balance between being flexible and providing concrete guidelines for implementation. The same would be true of any program serving at-risk and dropout young adults that is interested in implementing a flexible model on a large scale, but given the challenges the program sites faced with retaining students, Gateway to College may need to take a close look at which aspects of the model need to be bolstered, consider setting clearer guidelines about what implementation practices are in line with the model’s core principles and values, and strengthen the mechanisms by which the program’s National Network provides ongoing training and support. All of these are natural next steps in the program’s evolution.


v
Contents
Overview iii List of Exhibits vii Preface ix Acknowledgments xi Executive Summary ES-1 Chapter 1 Introduction and Study Overview 1
Background and Policy Context 1 About the Gateway to College Program 2 Past Research on Gateway to College 4 Study Overview 5 The Three Program Sites in the Study 8
2 A Closer Look at the Gateway to College Model and the Student Population Served 11 About the Gateway to College Model 11 Core Program Components and Theory of Change 12 The Gateway to College Staff 16 Eligibility Criteria and the Application Process 17 Description of the Student Study Sample 22 Choosing Gateway to College: Identifying Other Programs Attended by
Potential Participants 27
3 Implementation of the Gateway to College Program 31 Learning Community with Prescribed Core Courses During the
Foundation Term 31 Principles of Teaching and Learning 38 Comprehensive Student Support Services 41 Transition to Mainstream Community College 43 Training and Support 52
4 Summary and Discussion of Implementation Findings 55 For Further Exploration and Consideration: Suggestions for Strengthening
the Gateway to College Model 58

vi
Appendix A Lessons Learned About Student Outreach 61 B Data-Collection Activities 67 References 71

vii
List of Exhibits
Table
1.1 Characteristics of Study Sites 8
2.1 Selected Characteristics of Sample Members at the Time of Application, by Site 23
3.1 Prescribed Courses by Program Site 33
3.2 Program Group Progress Through Prescribed Courses 44
3.3 Reasons for Leaving Gateway to College 51
Figure
2.1 Outcomes for a Typical Set of 100 Inquiries About the Gateway to College Program 20
2.2 Patterns of Enrollment in Education Among Control Group Survey Respondents 29
3.1 Persistence and Transition to Community College Course Work: California Site 46
3.2 Persistence and Transition to Community College Course Work: Colorado Site 47
3.3 Persistence and Transition to Community College Course Work: Washington Site 48
Box
1.1 The Edna McConnell Clark Foundation (EMCF) Social Innovation Fund 3


ix
Preface
Although the nation has made significant progress in addressing its high school dropout crisis, students who slip through the cracks — those who have dropped out of high school or who are so far behind in credits that they are unlikely to graduate — have very few safety nets and even fewer on-ramps to the road that leads to a college education and a middle-class income. Gate-way to College, a dual-enrollment program, is one program that gives young people an on-ramp. In Gateway to College, students who have dropped out of high school or who are at risk of dropping out can simultaneously earn credits toward a high school diploma and a postsec-ondary degree. Such an opportunity has traditionally been reserved for high-achieving students, not those who have struggled in traditional high school settings, which makes Gateway to College unique and particularly ambitious.
This is the first public report on the implementation of the Gateway to College program. It provides an in-depth description of the Gateway to College model, an analysis of those whom the program actually serves, and an assessment of how well the model was implemented at three program sites. While Gateway to College has grown into a national network, there is scant information about how the program as described on paper is implemented in practice, and about what happens when the model is implemented in diverse settings. Past research tells us that there are often discrepancies between design and implementation, and that these discrepancies can make well-designed programs less effective. While this study does not attempt to measure the program’s impact on student achievement, exploring the implementation of the Gateway to College model can begin to reveal the areas of the program model that are promising and the areas that could be strengthened, both in design and in implementation.
In addition, this implementation study explores the challenge Gateway to College faces as a national model that must tread the line between being flexible (as designed) and maintain-ing consistency in implementation. Many programs struggle to find this balance. While this study reveals that broadly speaking the Gateway to College model is being implemented as designed, it also suggests that the Gateway to College National Network should work on striking a better balance between the flexibility it currently provides its program sites and more concrete guidance to ensure consistent implementation. Finding that middle ground would be an important next step in strengthening the program’s implementation and, ultimately, better serving the needs of at-risk young people.
Gordon L. Berlin President, MDRC


xi
Acknowledgments
The Gateway to College Implementation Study would not have been possible without the collaboration of Gateway to College and funding from the Edna McConnell Clark Foundation and the Social Innovation Fund.
We owe special thanks to the Gateway to College project directors, resource specialists, instructors, administrative staff members, and students whose hard work and commitment allowed us to implement this study. A special thank you also goes to Ben Byers, Laurel Duke-hart, Emily Froimson, Aubrey Perry, Devora Shamah, and the rest of the Gateway to College National Network team.
Additionally, we thank Caitlin Anzelone, Jessica Walker Beaumont, Dan Bloom, Janaé Bonsu, Melissa Boynton, Fred Doolittle, Hannah Fresques, Himani Gupta, Rob Ivry, Christine Johnston, Sarah McNeil, Chera Reid, Phoebe Richman, Sue Scrivener, Colleen Sommo, Jed Teres, Johanna Walter, and Michael Weiss for their contributions to the evaluation and to this report. A thank you also goes to Joshua Malbin, who edited the report, and Carolyn Thomas, who prepared the report for publication.
This material is based on work supported by the Corporation for National and Commu-nity Service (CNCS). The mission of CNCS is to improve lives, strengthen communities, and foster civic engagement through service and volunteering. CNCS, a federal agency, engages more than five million Americans in service through AmeriCorps, Senior Corps, the Social Innovation Fund, the Volunteer Generation Fund, and other programs, and leads the president’s national call-to-service initiative, United We Serve.
The Authors

ES-1
Executive Summary
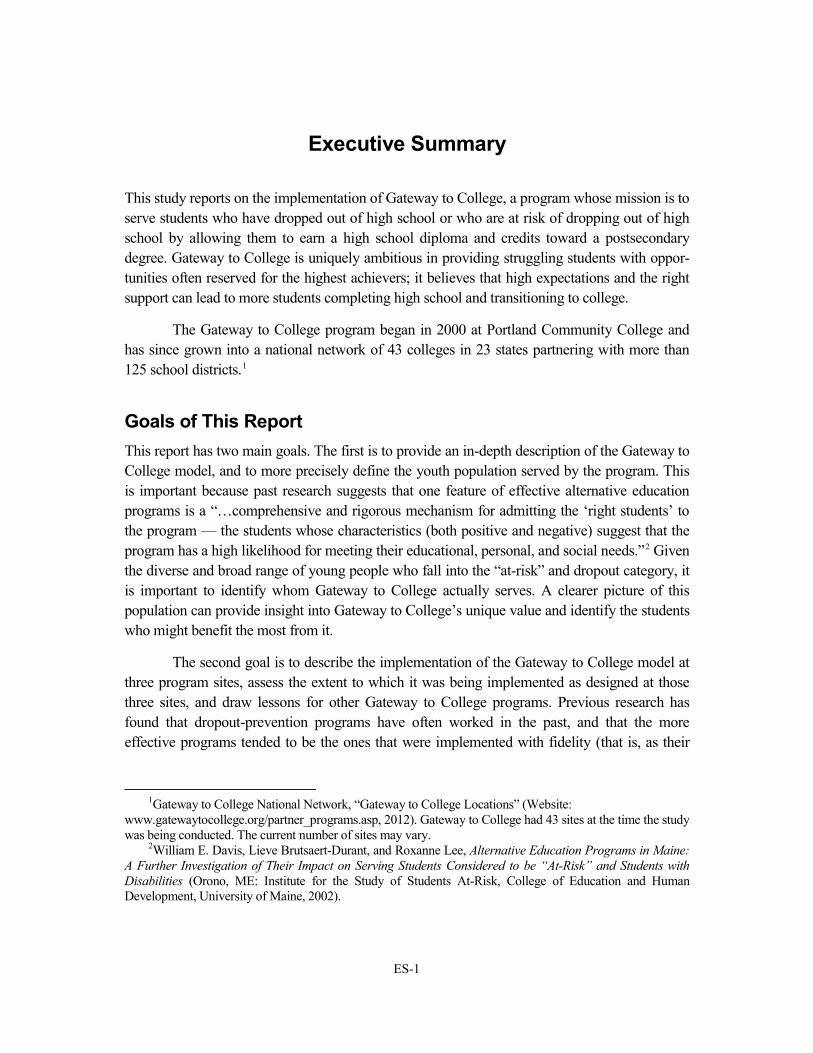
This study reports on the implementation of Gateway to College, a program whose mission is to serve students who have dropped out of high school or who are at risk of dropping out of high school by allowing them to earn a high school diploma and credits toward a postsecondary degree. Gateway to College is uniquely ambitious in providing struggling students with oppor-tunities often reserved for the highest achievers; it believes that high expectations and the right support can lead to more students completing high school and transitioning to college.
The Gateway to College program began in 2000 at Portland Community College and has since grown into a national network of 43 colleges in 23 states partnering with more than 125 school districts.1
Goals of This Report This report has two main goals. The first is to provide an in-depth description of the Gateway to College model, and to more precisely define the youth population served by the program. This is important because past research suggests that one feature of effective alternative education programs is a “…comprehensive and rigorous mechanism for admitting the ‘right students’ to the program — the students whose characteristics (both positive and negative) suggest that the program has a high likelihood for meeting their educational, personal, and social needs.”2 Given the diverse and broad range of young people who fall into the “at-risk” and dropout category, it is important to identify whom Gateway to College actually serves. A clearer picture of this population can provide insight into Gateway to College’s unique value and identify the students who might benefit the most from it.
The second goal is to describe the implementation of the Gateway to College model at three program sites, assess the extent to which it was being implemented as designed at those three sites, and draw lessons for other Gateway to College programs. Previous research has found that dropout-prevention programs have often worked in the past, and that the more effective programs tended to be the ones that were implemented with fidelity (that is, as their
1Gateway to College National Network, “Gateway to College Locations” (Website:
www.gatewaytocollege.org/partner_programs.asp, 2012). Gateway to College had 43 sites at the time the study was being conducted. The current number of sites may vary.
2William E. Davis, Lieve Brutsaert-Durant, and Roxanne Lee, Alternative Education Programs in Maine: A Further Investigation of Their Impact on Serving Students Considered to be “At-Risk” and Students with Disabilities (Orono, ME: Institute for the Study of Students At-Risk, College of Education and Human Development, University of Maine, 2002).

ES-2
designers intended).3 Unfortunately, very few studies of dropout-prevention programs have taken a close look at how programs like Gateway to College are implemented, or have assessed how well they adhere to a core model. As other researchers have described, to understand “what works” for at-risk and dropout young adults in alternative education settings, it is first necessary to understand what programs actually look like when they are implemented. As Berman and McLaughlin write, “The bridge between a promising idea and its impact on students is imple-mentation, but innovations are seldom implemented as intended.”4
Background In March 2011, Gateway to College was awarded a three-year investment of $3.5 million in grants from the Edna McConnell Clark Foundation and the Social Innovation Fund (SIF), matched by $3.5 million from the True North Fund and coinvestors, to further expand its model throughout the country.
This study of the Gateway to College model originally began as a student-level random assignment evaluation of the program’s impacts at nine program locations, with an implementa-tion study included. However, due to program site attrition and challenges with student recruit-ment, the study shifted in design and is now focused on program implementation at three locations.5 The three program sites that participated in this study are located in California, Colorado, and Washington. While a more rigorous evaluation of Gateway to College is still needed to measure the program’s impact on student outcomes, a deeper understanding of how the program model is implemented serves as an important stepping stone.
The implementation study draws on data from a baseline information form, a follow-up student survey administered approximately 12 months after students entered the study, program administrative data drawn from Gateway to College National Network’s management infor-mation system, and qualitative data collected during in-person field visits. The qualitative data include interviews with Gateway to College program staff members (instructors, Resource Specialists, directors, and staff members charged with conducting student outreach); focus groups with Gateway to College students; follow-up phone interviews with a subset of control
3Sandra Jo Wilson, Emily E. Tanner-Smith, Mark W. Lipsey, Katarzyna Steinka-Fry, and Jan Morrison,
Dropout Prevention and Intervention Programs: Effects on School Completion and Dropout Among School- Aged Children and Youth (Campbell Systematic Reviews, 2011, available online at: www.campbellcollaboration.org/lib/project/158).
4Paul Berman and Milbrey Wallin McLaughlin, “Implementation of Educational Innovation,” The Educa-tional Forum 40 (1976): 344-370.
5MDRC’s Institutional Review Board (IRB) reviewed and approved the original study design and proto-cols. All subsequent changes to the design were presented to and approved by the IRB. There were no significant IRB issues identified.

ES-3
group students; interviews with postsecondary and K-12 school district partners; program documents such as organizational charts, lists of alternative educational options nearby, and course syllabi; and observations of instruction.
The Gateway to College Model Gateway to College forges partnerships with K-12 school districts and local community colleges to serve young adults who have dropped out of high school or who are at risk of dropping out. Gateway to College participants are generally enrolled in both the K-12 district and the college at the same time. However, all program activities take place on the college campus.
To be eligible for Gateway to College, a student must be:
● Between 16 and 20 years old
● On the verge of dropping out or already not enrolled in school
● Behind in credits (for age and grade) with a history of absenteeism and a low grade point average
● Living in a partnering school district’s service area
● Reading at the eighth-grade level or higher
● Able to earn a high school diploma by age 21
The Gateway to College model consists of five core components:
1. A learning community with a prescribed set of core courses during the first semester. During their first semester, called the Foundation term, students take a series of linked classes together as a cohort of 20 to 25 students. The classes include developmental reading and writing (sometimes combined into a single English Language Arts class), math, and college preparatory courses taught primarily by Gateway to College instructors.
2. Instruction and support based on the Gateway to College Principles of Teach-ing and Learning, a set of guiding principles that inform instructors’ interactions with students.6
6The principles are: (1) creating an integrated, outcomes-based curriculum; (2) maintaining a rigorous
learning environment; (3) creating collaborative and inclusive learning communities that are respectful and (continued)

ES-4
3. Comprehensive support services, particularly during the Foundation term. These support services are provided primarily by Gateway to College Resource Specialists who serve as counselors/advisers and advocates. Instructors may also provide support services, but this is considered to be the primary role of the Re-source Specialists.
4. A transition to mainstream community college classes in students’ second term. After successfully completing the Foundation term, students take standard community college classes with other community college students. At this time, students are no longer in a learning community, but may maintain contact with Gateway to College staff members and students.
5. Training and support for Gateway to College staff members. Gateway to Col-lege programs’ staff members spend six to nine months in intensive training when programs first join the Gateway to College National Network. Staff members con-tinue to receive technical assistance from the National Network through the first two years of operation. After two years programs transition to “veteran” status: They continue to have access to services from the National Network as needed, but do not typically receive the same level of technical support.
Main Findings Given the small number of program sites that ultimately ended up participating in this study, the findings outlined in this report are not broadly generalizable. However, those findings do point to important lessons related to the program model and its implementation, which can serve as launching points for further exploration and discussion.
● The population served by Gateway to College at these three program sites is both challenged and promising.
While the students served by Gateway to College at these three program sites are be-hind in credits and demonstrate troubling behaviors such as low grades and poor attendance, they should also possess a certain level of maturity, motivation, and readiness to commit to a rigorous academic program like Gateway to College.
Most of the students who enrolled in Gateway to College at the three study sites were typically still enrolled in education or had only very recently dropped out of high school (that is, focused on solutions; (4) pursuing relevant, project-based learning; (5) constructing meaning — that is, helping students solve new problems by drawing on previous experiences; (6) encouraging personal growth; and (7) embedding assessments in the curriculum.
ES-5
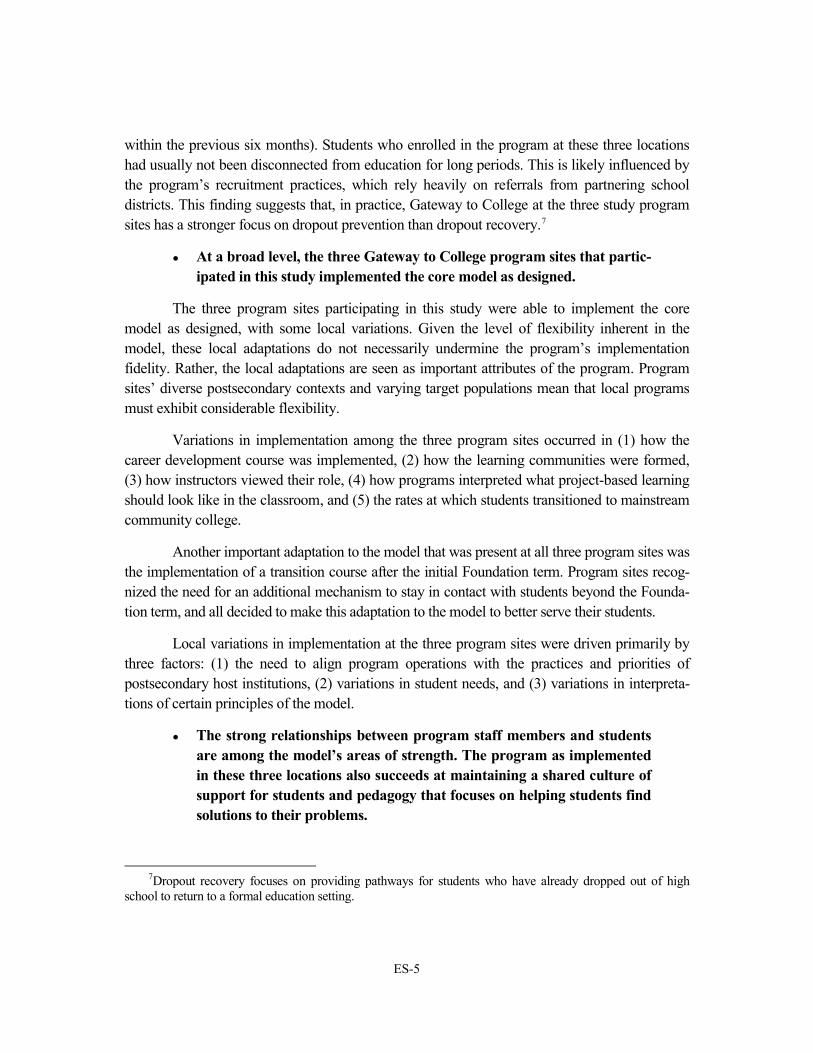
within the previous six months). Students who enrolled in the program at these three locations had usually not been disconnected from education for long periods. This is likely influenced by the program’s recruitment practices, which rely heavily on referrals from partnering school districts. This finding suggests that, in practice, Gateway to College at the three study program sites has a stronger focus on dropout prevention than dropout recovery.7
● At a broad level, the three Gateway to College program sites that partic-ipated in this study implemented the core model as designed.
The three program sites participating in this study were able to implement the core model as designed, with some local variations. Given the level of flexibility inherent in the model, these local adaptations do not necessarily undermine the program’s implementation fidelity. Rather, the local adaptations are seen as important attributes of the program. Program sites’ diverse postsecondary contexts and varying target populations mean that local programs must exhibit considerable flexibility.
Variations in implementation among the three program sites occurred in (1) how the career development course was implemented, (2) how the learning communities were formed, (3) how instructors viewed their role, (4) how programs interpreted what project-based learning should look like in the classroom, and (5) the rates at which students transitioned to mainstream community college.
Another important adaptation to the model that was present at all three program sites was the implementation of a transition course after the initial Foundation term. Program sites recog-nized the need for an additional mechanism to stay in contact with students beyond the Founda-tion term, and all decided to make this adaptation to the model to better serve their students.
Local variations in implementation at the three program sites were driven primarily by three factors: (1) the need to align program operations with the practices and priorities of postsecondary host institutions, (2) variations in student needs, and (3) variations in interpreta-tions of certain principles of the model.
● The strong relationships between program staff members and students are among the model’s areas of strength. The program as implemented in these three locations also succeeds at maintaining a shared culture of support for students and pedagogy that focuses on helping students find solutions to their problems.
7Dropout recovery focuses on providing pathways for students who have already dropped out of high
school to return to a formal education setting.

ES-6
Most students in the program reported strong relationships with Gateway to College in-structors and Resource Specialists. Students at the three study sites especially appreciated being treated with maturity and respect by the program’s staff. If they started to fall behind, program staff members worked with them to identify ways of mitigating challenges rather than chastis-ing them or solving the problem for them. Students at the three study sites also appreciated being in an environment of like-minded students who were motivated to graduate high school and pursue postsecondary degrees.
● The biggest challenges that Gateway to College faced at these three pro-gram sites were retaining students during the initial (Foundation) term and ensuring their transition to the mainstream community college.
At two of the program sites, the proportion of students who left the program after one semester was very high (44 percent at the Washington program and 46 percent at the California program). By the second semester, enrollment rates across the three programs ranged from 47 percent to 79 percent and by the third semester, enrollment rates ranged from 25 percent to 46 percent. Fewer than half of the students at the three program sites were able to pass all of their Foundation courses and successfully transition to mainstream community college. The biggest academic stumbling block for them was English Language Arts. Fewer than half of all Gateway to College students passed their Foundation English course.
According to the student follow-up survey, most students who left the program without receiving a diploma did so because of personal circumstances such as health problems, family issues, or conflicts with work.
● Given the challenges and wide range in retention and transition rates across the three program sites, Gateway to College may want to consid-er additions to strengthen the model. These additions may need to be supported with more explicit guidance about implementation and tech-nical assistance from the National Network.
A few possible ways the model could be strengthened include: (1) capitalizing more on students’ already strong relationships with staff members and fellow students in order to better identify and mitigate potential barriers to retention and transition; (2) bolstering academic support, particularly in the area of English Language Arts; (3) strengthening peer support; (4) extending the learning community experience (as these three program sites have already begun to do); and (5) implementing a systematic approach to listening to student needs to ensure that program practices are in alignment with their diverse circumstances. It is also still an open question whether the model could benefit by better identifying the types of students who are likely to do well in the program.

ES-7
When it comes to guidance, the National Network could provide program principles that are more concretely codified and that are supported by examples of how essential elements of the model should be implemented (along with examples of how they should not be imple-mented). This guidance could also include a more standardized process for providing program-site-specific technical assistance and better mechanisms for ensuring increased participation in the training and professional development provided by the National Network.
The Gateway to College National Network has not traditionally focused on ensuring consistency in implementation. Its role has been primarily to help new program sites launch their iterations of the model, to provide a rigorous training regimen during program sites’ early years, and to provide technical assistance as needed. In the next phase of the program model’s growth and development, Gateway to College may need to take more active steps to ensure a better balance between local flexibility and consistent, high-quality implementation. Doing so would represent a natural next step in the program model’s evolution and one in line with the National Network’s current thinking. According to the Gateway to College Annual Report, the National Network is currently exploring the creation of a certification system that would define, standardize, and track continuous improvement at Gateway to College program sites.8
● From students’ perspectives, Gateway to College fills an important niche: It provides a mature and respectful learning environment for at-risk young people who are ready, willing, and able to commit to a rig-orous academic program and who are interested in pursuing a post-secondary education.
Several other nontraditional educational programs serving at-risk young adults operate within the three Gateway to College program sites’ service areas. Other alternatives include online/blended programs, alternative high schools, and adult basic education. None of these other options offers a comprehensive alternative in the eyes of Gateway to College students in those three service areas.
Conclusion Overall, this study of the Gateway to College model finds that broadly speaking, the program at the three study sites was implemented as designed. However, the challenges and wide range in retention and transition rates across the three study sites suggest two things: First, programs serving at-risk and dropout young adults that are interested in implementing a flexible model may need to strike a better balance between being flexible and providing concrete guidelines for
8Gateway to College National Network, 10 Years of Impact: 2013 Annual Report (Portland, OR: Gateway to College National Network, 2013).

ES-8
implementation. Second, Gateway to College may need to take a closer look at which aspects of the model need to be bolstered, consider setting clearer guidelines about what implementation practices are in line with the model’s core principles and values, and strengthen the mechanisms that allow the National Network to provide ongoing training and support. All of these are natural next steps in the program’s evolution.

1
Chapter 1
Introduction and Study Overview
Background and Policy Context Despite efforts to improve the high school graduation rate in the United States, an estimated 7,200 students drop out of high school every day — a staggering 1.3 million every year.1 Without a high school diploma, students’ chances of pursuing higher education and earning a postsecondary degree that leads to a living wage become greatly diminished. The implications of our country’s dropout crisis are significant: Over the course of a lifetime, a high school dropout earns on average about $260,000 less than a high school graduate.2 Dropouts from the class of 2008 alone are projected to cost the nation more than $319 billion in lost wages over the course of their lifetimes.3
Further, a recent report by the Center on Education and the Workforce at Georgetown University projects that by 2020, nearly 65 percent of U.S. jobs will require at least some college education, out of reach for those unable to earn a high school diploma.4 President Obama has also called for an increase in the number of college graduates in the United States by 2020. To meet this goal the United States not only has to address the high school dropout crisis, but also provide students with the academic preparation needed to be successful in college and career.
It is worth noting that most students who drop out of high school try to reengage in edu-cation.5 For many students, one of the only viable options for doing so is to obtain a General Educational Development (GED) credential. However, concerns persist about whether passing the GED test is an appropriately high benchmark of academic preparedness and whether earning a GED credential opens the same doors to careers and further education as a high school diploma. Students who earn a GED credential often have aspirations of a college degree, and nearly half enroll in postsecondary education. Unfortunately, only 4 percent persist to earn a degree.6 As a result, much more comprehensive alternative education programs are needed, ones that can put students on a path to earn a high school diploma while also providing them with the academic skills and support necessary to be successful in their postsecondary pursuits.
1Wittenstein (2010). 2Rouse (2005). 3Alliance for Excellent Education (2008). 4Carnevale, Smith, and Strohl (2013). 5Nearly two-thirds of dropouts obtain a diploma or a GED credential within eight years of their originally
scheduled high school graduation date. MDRC (2013). 6Garvey (2011).

2
While there is no shortage of dropout-prevention initiatives and comprehensive college-prep programs in the United States, very few programs take on these ambitious, dual goals.
About the Gateway to College Program Gateway to College, however, does take on these dual goals. Gateway to College began in 2000 at Portland Community College with the goal of reconnecting to education those students who had dropped out of high school or who were are at risk of dropping out.7 In 2011, Gateway to College was awarded a three-year investment from the Edna McConnell Clark Foundation Social Innovation Fund (SIF) to further expand its model throughout the country (see Box 1.1). Today, Gateway to College has grown from a single-site program into a national network of 43 colleges in 23 states, partnering with more than 125 school districts.8 The Gateway to College National Network, headquartered in Portland, Oregon, provides training, technical assistance, professional-development opportunities, and program evaluation for each individual program — from the due-diligence and planning process through initial program implementation, and for as long as the program remains in the network.
The Gateway to College program provides a comprehensive alternative education where students work toward earning their high school diplomas while simultaneously earning credits toward an associate’s degree or postsecondary certificate. Gateway to College partici-pants are generally enrolled in both the local K-12 school district and the community college that is serving as the host institution. However, all Gateway to College program activities and classes take place on a college campus.
All students begin with a Foundation term, a learning community experience where they take a set of prescribed courses in cohorts of 20 to 25. After completing the Foundation term, students transition to regular community college classes and receive varying levels of support services (depending on the local program and the needs of particular students) from Gateway to College’s staff. Staff members assess students’ needs, both during the Foundation term and afterward, in the course of interactions that vary by local program and that range from formal one-on-one meetings, to interactions during class time, to informal conversations.
Gateway to College serves students between the ages of 16 and 20 years who are be-hind in credits for their age and grade and who have low grade point averages (1.6 on average, historically). Most students enter the program with approximately half of the credits they need
7“At risk of dropping out of high school” refers to students behind in credits based on when they started
high school. 8Gateway to College National Network (2012). Gateway to College had 43 sites at the time the study was
being conducted. The current number of sites may vary.
3
Box 1.1
The Edna McConnell Clark Foundation (EMCF) Social Innovation Fund
The Social Innovation Fund (SIF) — an initiative enacted under the Edward M. Kennedy Serve America Act — targets millions of dollars in public-private funds to expand effective solutions across three issue areas: economic opportunity, healthy futures, and youth develop-ment and school support. This work seeks to create a catalog of proven approaches that can be replicated in communities across the country. The SIF generates a 3:1 private-public match, sets a high standard for evidence, empowers communities to identify and drive solutions to address social problems, and creates an incentive for grant-making organizations to target funding more effectively to promising programs. Administered by the federal Corporation for National and Community Service (CNCS), the SIF is part of the government’s broader agenda to redefine how evidence, innovation, service, and public-private cooperation can be used to tackle urgent social challenges.
The Edna McConnell Clark Foundation, in collaboration with MDRC and The Bridgespan Group, is leading a SIF project that aims to expand the pool of organizations with proven pro-grams that can help low-income young people make the transition to productive adulthood. The project focuses particularly on young people who are at greatest risk of failing or dropping out of school or of not finding work; who are involved or likely to become involved in the foster care or juvenile justice system; or who are engaging in risky behavior, such as criminal activity or teenage pregnancy.
EMCF, with its partners MDRC and Bridgespan, selected an initial cohort of nine programs and a second cohort of three programs to receive SIF grants: BELL (Building Educated Lead-ers for Life), Center for Employment Opportunities, Children’s Aid Society-Carrera Adoles-cent Pregnancy Prevention Program, Children’s Home Society of North Carolina, Communi-ties In Schools, Gateway to College Network, PACE Center for Girls, Reading Partners, The SEED Foundation, WINGS for Kids, Youth Guidance, and Children’s Institute, Inc. These organizations were selected through a competitive selection process based on prior evidence of impacts on economically disadvantaged young people, a track record of serving young people in communities of need, strong leadership and a potential for growth, and the financial and operational capabilities necessary to expand to a large scale.
The EMCF Social Innovation Fund initiative is called the “True North Fund” and includes support from CNCS and 15 private co-investors: The Edna McConnell Clark Foundation, The Annie E. Casey Foundation, The Duke Endowment, The William and Flora Hewlett Founda-tion, The JPB Foundation, George Kaiser Family Foundation, The Kresge Foundation, Open Society Foundations, Penzance Foundation, The Samberg Family Foundation, The Charles and Lynn Schusterman Family Foundation, The Starr Foundation, Tipping Point Community, The Wallace Foundation, and Weingart Foundation.
4
to finish high school.9 Students graduate from the program when they earn their high school diplomas. A typical Gateway to College graduate will have spent 1.5 to 2 years in the program and will have earned roughly two semesters’ worth of credits toward an associate’s degree or postsecondary certificate.10
Past Research on Gateway to College Few studies have yet described or assessed the academic programs that exist in the alternative education field.11 While some researchers have attempted to identify key attributes of effective programs,12 they have themselves cautioned that these lists of characteristics “represent the best judgments of researchers and advocates” and that “there has been no documentation of how common these features are to existing programs or which particular aspect(s) of the academic program is critical for which population of students served by alternative education.”13
There have, however, been two prior studies of the Gateway to College model, one conducted by Pacific Research and Evaluation and another conducted internally by the Gateway to College National Network. In 2012, the national study conducted by Pacific Research and Evaluation found positive effects on study students’ participation in and completion of postsecondary education, but the response rate was too low to generalize to other Gateway to College students.14
The internal research conducted by the Gateway to College National Network — which uses data from the National Network’s centralized management information system — has also shown some promising, nonexperimental results. Gateway to College’s most recent three-year cohort graduate rate (for students who began the program during the 2011-2012 school year) was 30 percent, with 6 percent still enrolled and progressing through the program. On average, students who graduated from the program completed 28 college credit hours. However, Gate-way to College does not currently have an appropriate comparison group against which to gauge these results. Often, these outcomes are compared with district or state high school graduation rates, which pertain to populations often quite different from the populations Gateway to College programs serve.
9Gateway to College National Network (2013). 10Data come from the Gateway to College National Network management information system and repre-
sent the 2012-2013 academic year. 11Ruzzi and Krameer (2006). 12Lange and Sletten (2002). 13Ruzzi and Krameer (2006). 14Rider, Winters, and Neilson (2012). The response rate was 30.6 percent.

5
This study of the Gateway to College model originally began as a student-level random assignment evaluation at nine program locations, including both an impact study and an implementation study. The goal of the impact study was to measure the program’s effect on key educational outcomes. However, some of the original nine program sites had trouble recruiting enough qualified students to add a random assignment component to the application process, and thus did not continue their participation in the study. The scope of the study was adjusted accordingly. However, due to continued challenges recruiting enough students to meet study sample goals and other reasons for site attrition (that is, lack of district or administrative support), the study shifted in design and is now focused on understanding program implementa-tion at three locations. While a more rigorous evaluation of Gateway to College is still needed to measure the program’s impact on student outcomes, a deeper understanding of how the pro-gram model is implemented serves as an important stepping stone.
While, as previously noted, limited research exists into the essential attributes of effec-tive alternative education programs, a systematic review of dropout-prevention programs found that these programs have often worked in the past, and that the more effective programs tended to be the ones that were implemented with fidelity (that is, as their designers intended).15 Unfortunately, very few studies have taken a close look at how programs like Gateway to College are implemented or have assessed how well they adhere to a core model — particularly when implemented in multiple locations.
This represents an important gap in the literature, and filling that gap could help inform the work of practitioners and policymakers interested in how best to serve young adults in the at-risk and dropout population. As other researchers have described, to understand “what works” for at-risk and dropout young adults in alternative education settings, it is first necessary to understand what programs actually look like when they are implemented. As Berman and McLaughlin write, “The bridge between a promising idea and its impact on students is imple-mentation, but innovations are seldom implemented as intended.”16 To understand a program’s impact, it is important first to understand what it looks like in reality, and whether a partici-pant’s experience is consistent with its conceptual framework. The latter is particularly im-portant should there be a future evaluation of the program’s impact on student outcomes.
Study Overview This is the first implementation study of the Gateway to College model and the first public report that focuses on the program’s implementation. This report has two main goals. The first
15Wilson et al. (2011). 16Berman and McLaughlin (1976).

6
goal, addressed in Chapter 2, is to provide an in-depth description of the Gateway to College model, and to more precisely define the youth population served by the program. Past research suggests that one feature of effective alternative education programs is a rigorous admissions process that ensures the program is reaching those students whose characteristics make them best suited to the services provided.17 Given the diverse and broad range of young people who fall into the “at-risk” and dropout category, it is important to identify whom Gateway to College actually serves. A clearer picture of the service population can provide insight into Gateway to College’s unique value and identify the students who might benefit the most from it.
A second goal of this report is to describe the implementation of the Gateway to Col-lege model at three program sites and, to the extent possible, describe how closely implementa-tion at the three program sites adheres to the intended core model. The three program sites, which are located in California, Colorado, and Washington, provide a sense of the range of settings in which Gateway to College operates and how the local student population, host institution, and neighboring school districts can influence how the model is put into practice. The effort to better understand program sites’ implementation of the Gateway to College model is described in Chapter 3 and is guided by the following research questions:
1. What are the core elements of the Gateway to College model? Whom does the model serve?
2. Were the core elements of the Gateway to College model implemented as planned?
3. What kinds of adaptations were made to meet the demands of the local context and the needs of the local student population?
4. What factors facilitated or impeded successful program implementation?
Chapter 4 discusses the benefits and trade-offs of replicating a program with guiding core principles that are intentionally left open to local interpretation — a strategy used by a wide range of organizations. Additionally, Chapter 4 provides suggestions for how Gateway to College might bolster the model and its implementation, and how it might address the difficult balance between maintaining program principles and allowing local flexibility.
As described earlier in this chapter, the Gateway to College study was originally de-signed to measure impacts on important educational outcomes. As part of this original study design, two groups of students were created using random assignment, a process similar to a lottery, to allow for a fair comparison of their outcomes. One group of students was assigned to Gateway to College, while the other was embargoed from enrolling in the program for one year,
17Davis, Brutsaert-Durant, and Lee (2002).

7
and instead informed or reminded of other educational options available in the community. The group of students that was not admitted into Gateway to College is called the control group. A year after they were randomly assigned, both groups of students were asked to complete a survey about their educational achievement and experiences. Due to the sample reduction from site attrition and low survey response rates,18 there is not sufficient statistical power for a robust comparison of outcomes between those students who were assigned to participate in Gateway to College and those who were not. However, some of the results of the 12-month survey are still used in this report to understand the contexts in which Gateway to College programs operate.
Data Sources and Timeline of Research Activities
To meet the goals outlined in this chapter, the study team conducted several data-collection activities. First, after successfully completing the applicant screening process and agreeing to participate in the study, students completed a baseline information form. The form included questions about students’ demographics, academic histories, and motivations for applying to Gateway to College. These characteristics are presented and discussed in Chapter 2. Once they finished the baseline information form, students were entered into the lottery and given their group assignments (either Gateway to College or the control group). This process took place leading up to the fall 2012 term at the Colorado and Washington program sites and before the spring 2013 term at the California program site.
Second, members of the research team visited the program sites in the spring of 2013 to collect several types of qualitative data:
● Interviews with Gateway to College program staff members (instructors, Resource Specialists, directors, and staff members charged with conducting student outreach)
● Focus groups with Gateway to College students
● Interviews with major postsecondary and K-12 school district partners
● Program documents such as organizational charts, lists of alternative educa-tional options nearby, and course syllabi
● Observations of instruction
Third, approximately 12 months after receiving their group assignments, study partici-pants were asked to complete a follow-up survey about their academic progress and their
18The overall response rate for the student follow-up survey was 57 percent. The program group response
rate was 62 percent, and the control group response rate was 47 percent.

8
experiences in Gateway to College or other educational programs. The survey data are an important source of information about how students experienced the less structured elements of Gateway to College, such as their relationships with their peers and with instructors and Resource Specialists. Fourth, the Gateway to College National Network provided data on course enrollment and grades for all participating students during their time in the program, as recorded in its management information system by staff members in each location.
Finally, in the fall of 2014, follow-up interviews were conducted with a subset of the control group members who responded to the 12-month follow-up survey. While not repre-sentative of the control group as a whole, the experiences these students recounted provide a helpful lens through which the survey results can be viewed.
The Three Program Sites in the Study The implementation study took place at three Gateway to College program sites in three states: California, Colorado, and Washington. These program sites — along with the six others that did not continue their participation in the study — were invited to participate because of their maturity, high level of program stability, strong leadership, and strong potential to meet the study’s sample recruitment goals. However, as described, only three program sites remained in the study, due primarily to other program sites’ difficulties recruiting enough students to meet the demands of random assignment. This section and Table 1.1 describe the characteristics of the three program sites in the study.
Table 1.1
Characteristics of Study Sites
Characteristic California Site Colorado Site Washington Site First year operating Gateway to College 2004 2008 2009 New students, 2012-2013 170 76 119 Total enrollment, 2012-2013 302 136 262 Approximate size of host institution (number of students), fall 2012 17,000 21,000 4,000 Academic calendar type Semester Semester Quarter Is Gateway to College considered a separate high school? Yes No Yes
SOURCE: Information about the Gateway to College study sites comes from the Gateway to College National Network. Information about the host institution and calendar type is from the Integrated Postsecondary Education Data System.
9
California Program Site
The California Gateway to College program site opened in 2004 and now serves over 300 students annually, making it one of the largest and oldest program sites in the National Network. Each term the program site brings in 80 to 90 new students, or three learning commu-nities of approximately 30 students each. The California program site serves large proportions of English learners and first-generation college students. It also has the unique attribute of operating as an independent charter school, which provides it a degree of autonomy and flexibility that other program sites in the National Network do not typically possess.
At the time of the study, students in Gateway to College at the California program site came from around ten K-12 school districts. Almost half of the Gateway to College students at this program site were from a single district, however. The California program site’s postsec-ondary host is a large, local two-year city college that served approximately 17,000 students in the fall 2012 semester. The program site’s relationship with the postsecondary host is quite strong. As the director described, “[The college] has really owned this program from the get-go.” Representatives from the college see the Gateway to College program as an opportunity to serve an important population in the community. As one college administrator said, Gateway to College is “an opportunity to create an extra portal for our students who would not normally feel they could come to college.”
Washington Program Site
The Washington program site launched in 2009. This program serves about 265 stu-dents and accepts about 40 students each quarter, for two learning communities of about 20 students each.
Gateway to College students at the Washington program site came from about a dozen K-12 school districts during the year of the study, with almost a third coming from one district. Its postsecondary host is a technical college that served approximately 4,000 students in the fall 2012 semester. Of the three program sites, it probably has the strongest emphasis on career/ technical education. The local Gateway to College director noted that it takes students longer to complete the program than students at the other Gateway to College sites (about 9 or 10 quarters) because the program is “focused primarily on having students work towards an associate’s degree.” While students are expected to receive their high school diplomas, the program site focuses more on getting them to transition into the college.
It is also worth noting that in the state of Washington, technical colleges were formerly part of K-12 school districts. When technical colleges joined the community college system in 1991, they retained the authority to deliver vocational or technical education to high school
10
students, which allows programs like Gateway to College to receive funding directly from the state rather than from partnering school districts.
This program site also benefits from strong commitment from the college’s leaders. The host institution feels that although it is challenging, serving young adults at different levels of preparedness is an important mission.
Colorado Program Site
The Colorado Gateway to College program site has been a part of the Gateway to Col-lege National Network since 2008. At the time of the study, students came from about five K-12 school districts; the majority (roughly 60 percent) were from one of these districts. The number of students that the Colorado program site served varied with districts’ individual budgets, which determined the number of seats they allotted to Gateway to College. Generally it served between 100 and 150 students. Like the other two program sites in the study, the Colorado Gateway to College program has strong support from its postsecondary host’s leaders.
11
Chapter 2
A Closer Look at the Gateway to College Model and the Student Population Served
About the Gateway to College Model As mentioned in Chapter 1, Gateway to College is a national organization with 43 program sites across 23 states that partners with more than 125 school districts. As a dual-enrollment program that serves young people who have dropped out of high school or who are at risk of dropping out, Gateway to College develops partnerships with staff members from both the local K-12 school district(s) and the local college administration. Gateway to College programs often partner with a number of K-12 school districts, which serve as primary sources referring students to the program. The number of school district partners varies from program site to program site — some have one or two district partners, while others, like the Washington program site, have more than ten. Each program is hosted by a postsecondary institution, typically a community college. The postsecondary host provides classroom space and access to college resources such as tutoring, libraries, and computer labs. Gateway to College participants are generally enrolled in both the K-12 school district and the college. However, all program activities take place on the college campus.
When Gateway to College programs first join the Gateway to College National Net-work, they receive a three-year start-up grant that covers a year of planning and two academic years of serving students. Gateway to College programs are also funded locally on a per-pupil basis by K-12 school districts, often using state-provided funds. Colleges use per-pupil funds to cover the cost of tuition, books, staff time, and ongoing student support; students are not asked to pay for their courses. Gateway to College program sites often also seek additional resources through local grants, in-kind contributions from the college, and additional financial support from the National Network. In most cases, Gateway to College staff members (instructors, Resource Specialists, etc.) are employed by the postsecondary host institution.
The Role of the Gateway to College National Network
As described in Chapter 1, the development and replication of the Gateway to College program model are overseen by a central body called the Gateway to College National Net-work, which is headquartered in Portland, Oregon. The National Network provides training, technical assistance, professional development opportunities, and connections to the broader professional learning community of Gateway to College practitioners.
12
Core Program Components and Theory of Change The Gateway to College model consists of five core components: (1) a learning community with a prescribed set of core courses during the first semester, (2) instruction and support based on the Gateway to College Principles of Teaching and Learning, (3) comprehensive support services, (4) transition to mainstream community college classes in students’ second term, and (5) training and support for Gateway to College staff members.
Learning Community with Prescribed Core Courses During the Foundation Term
Students’ first semester in Gateway to College is called the Foundation term. During that Foundation term, students are placed in a learning community of 20 to 25 students who take a series of linked classes together: developmental reading and writing (sometimes combined into a single English Language Arts class), math, and college preparatory courses taught primarily by Gateway to College instructors. The reading/writing courses focus on developing and strengthening a range of skills such as reading comprehension, grammar (for example, parallel sentence structures), and vocabulary. Students may also learn to write different types of essays and gain basic research and citation skills — part of a curriculum designed to prepare them for college-level courses. Depending on students’ incoming level of academic prepared-ness, math courses during the Foundation term range from basic arithmetic to pre-algebra. In addition, students also take a Student Success course where they learn skills such as time management, organization, timeliness, and regular attendance. They also become familiar with the resources available to them as college students (that is, the writing/tutoring center, computer lab, library, etc.). Finally, the Career Development course provides students with an opportunity to explore various career options. This course is also taught by Gateway to College staff members, but can be taken during the Foundation term or during students’ second term, which is called the “transition term.”
Gateway to College averages about 19 students per class, somewhat more than other alternative education programs, which average 12 to 15 students per class.1 However, the 19-student class size is typical for alternative education programs that are located on community college campuses (for example, community college-based General Educational Development [GED] programs).2
The learning community, a vital feature of the Foundation term, is intended to create a shared experience among students, as well as a network of peer support in which students encourage each other and reinforce good academic habits such as regular attendance. Learning
1Ruzzi and Krameer (2006). 2Ruzzi and Krameer (2006).

13
communities in community college settings have been found to have a small, positive effect on overall academic progress, as measured by total credits earned.3 The creation of a network of peer support in these learning communities is hypothesized to be particularly critical to the Gateway to College model. Past research suggests that during the adolescent years, peer influence is one of the most powerful social forces affecting students’ behavior and educational outcomes. Adolescent friends are arguably even more important than parents, teachers, or counselors in guiding students’ behavior and can have profound impacts on their educational trajectories.4
Principles of Teaching and Learning
The second core component is pedagogy based on Gateway to College’s Principles of Teaching and Learning. Those principles, as outlined by Gateway to College, are:
1. Creating an integrated, outcomes-based curriculum with the collaboration of teach-ers, centered on interdisciplinary themes5
2. Maintaining a rigorous learning environment by holding students to high expecta-tions, but still tailoring the curriculum to meet students’ learning challenges and varying developmental levels
3. Creating collaborative and inclusive learning communities that are respectful and focused on solutions
4. Pursuing relevant, project-based learning
5. Constructing meaning — that is, helping students solve new problems by drawing on previous experiences
6. Encouraging personal growth, which includes helping students overcome self-defeating beliefs and recognizing that academic success is attributable to controlla-ble factors such as hard work, persistence, and resilience
7. Embedding assessments in the curriculum so that expectations and outcomes are clear, and students are given the opportunity and tools to assess their own work, as well as provide their peers with constructive feedback
3Visher et al. (2012). 4Coleman et al. (1966); Sewell, Haller, and Portes (1969); Sewell, Haller, and Ohlendorf (1970). 5An “outcomes-based” curriculum means one created with a goal (outcome) in mind. By the end of the
educational experience (typically either by the end of a course, semester, or academic year) of an outcomes-based curriculum, a student should have reached that goal. In Gateway to College, two examples of learning outcomes are being able to write an essay and learning to come to class on time.
14
Comprehensive Support Services
The third core component of the model is a set of support services provided primarily by Gateway to College Resource Specialists, who serve as counselors/advisers and advocates. Instructors also may provide support services, but doing so is considered to be the primary role of the Resource Specialists. Like the Principles of Teaching and Learning, the Gateway to College National Network envisions a version of holistic student support with certain character-istics that may be put into operation differently by different local programs. Those characteris-tics, as outlined in Gateway to College program documents, are:
1. Dedicated student support professionals, with each student assigned a Resource Spe-cialist who provides intensive support throughout the Gateway to College experience
2. An approach based on students’ strengths and focused on solutions
3. The creation of a community among students to increase their academic and social integration into the college environment
4. The implementation of services and structures that address the needs of the whole student, which may include community resources outside of the program
Positive relationships with adults are at the center of both the Principles of Teaching and Learning and the student support services. These positive relationships, matched with high expectations and significant support, are posited to improve students’ engagement with education. Research done by Bridgeland, Dilulio, and Morison found that 69 percent of high school dropouts claimed adults did not expect them to perform well, and that these low expectations contributed to their decision to drop out.6 In addition, research by Kaufman, Bradbury, and Owings found that teacher expectations affect both grades and students’ likelihood of dropping out.7 As outlined in the Principles of Teaching and Learning and the description of comprehensive student support, Gateway to College aims to maintain high expectations and assist students by focusing on their strengths and on solutions to their prob-lems. This approach is hypothesized to help more students remain enrolled in education, making progress toward their high school diplomas.
It is also worth noting that, compared with traditional high school counselors, Gateway to College Resource Specialists often have relatively low caseloads of approximately 50 students, which allows them to provide dedicated, personalized support. This accords with the recommendations of the Institute of Education Sciences Dropout Prevention Guide, which says it is critical to “choose adults who are committed to investing in the student’s personal and
6Bridgeland, Dilulio, and Morison (2006). 7Kaufman, Bradbury, and Owings (1992).

15
academic success, keep caseloads low, and purposefully match students with adult advocates” so that they are able to “devote time and energy to multiple facets of the student’s life.”8
Transition to Mainstream Community College Courses
After successfully completing the Foundation term, students take standard community college classes with other community college students, most of whom took the more traditional path of earning a high school credential before starting college. These classes allow students to earn credits toward both a high school diploma and a college degree or certificate.
While dual-enrollment programs have been in existence for many years, they were once reserved for high-achieving students, and have only recently become available for moderate- to lower-achieving students such as those targeted by Gateway to College.9 Past research suggests that dual-enrollment programs serving at-risk students may reduce high school dropout rates in part because they challenge students academically and give them more engaging course work.10 That level of challenge and engagement may not be present for them in some traditional K-12 settings, but it is provided by Gateway to College.
Training and Support
The fifth core component is training and support for Gateway to College staff members. Past research on supporting students at risk of dropping out suggests that staff orientation and training is critical to the success of the student-staff member relationship.11 Gateway to College provides training and support in a number of ways — mostly during programs’ start-up phase.
As discussed, when Gateway to College programs first join the National Network, they receive a three-year planning and implementation start-up grant. New program sites spend six to nine months in intensive training with customized technical assistance, assembling the core components of the model and adapting them to the local environment. Staff members continue to receive technical assistance from the National Network’s Education Services team through the first two years of operation. Once a program site has completed its initial grant require-ments, it transitions to “veteran” status within the broader professional learning community of Gateway to College practitioners. All veteran program sites continue to have access to services from the National Network as needed (typically through stakeholder advocacy and specialized data reporting), and access to webinars where promising practices are shared among program
8Dynarski et al. (2008). 9Bailey and Karp (2003). 10Lords (2000). 11Ruzzi and Krameer (2006); Grossman and Garry (1997); Sipe (1996).

16
sites.12 They also participate in Gateway to College’s annual professional development event, the Peer Learning Conference.13 But participation in these training opportunities is optional. Generally, program sites do not receive the same level of technical support once they reach “veteran” status. All three program sites discussed in this report completed the start-up phase before the study began.
The Gateway to College Staff Gateway to College programs typically have a core team led by a Project Director and support-ed by instructors, Resource Specialists, and administrative staff members. Gateway to College staff members are generally employed by the community college, with a few exceptions.14
Project Directors lead the overall operation of their program sites. Responsibilities in-clude building relationships with local school districts and other community-based organiza-tions, maintaining relationships with the postsecondary host, and managing internal program operations (that is, staffing, overseeing instruction and support, and arranging for staff profes-sional development).
Gateway to College instructors teach the Gateway to College courses during the Foun-dation term and provide students with academic support as needed. Some Gateway to College instructors also teach at the community college where the program is hosted.
Resource Specialists serve as counselors and advisers charged with providing student support services. This may include connecting students with other community- or college-based resources as needed. Resource Specialists also typically support students with academic tutoring, provide ongoing encouragement and emotional support, and may also teach student success or career development courses.
Administrative support. All programs are supported by administrative staff members who help to maintain student databases (including the Gateway to College National Network’s management information system) and to manage data that are central to meeting state and local accountability requirements.
While each program staff member has distinct responsibilities, all are charged with maintaining a culture of openness and support for students.
12“Stakeholder advocacy” refers to the guidance and support the National Network provides program sites to help them with state or local policy advocacy. “Specialized data reporting” refers to the research support the National Network provides program sites to help them better understand their student populations.
13The Peer Learning Conference has since moved to a two-year cycle. 14Due to the California program’s unique status as a charter school, for example, some of its staff members
are employed by a partner K-12 school district.

17
Eligibility Criteria and the Application Process
Eligibility Criteria
To be accepted into the Gateway to College program, a student must be:
● Between 16 and 20 years old
● On the verge of dropping out or already not enrolled in school
● Behind in credits (for age and grade) with a history of absenteeism and a low grade point average
● Living in a partnering school district’s service area
● Reading at the eighth-grade level or higher
● Able to earn a high school diploma by age 21
Expectations are high for Gateway to College students. Tardiness and absenteeism are not tolerated, and after just one semester of Gateway to College-specific course work, students begin enrolling in mainstream community college classes. Therefore, applicants must also demonstrate the maturity and commitment necessary to thrive in this environment. This is gauged partly by how a prospective student completes the application tasks — for example, whether the student arrives prepared and on time for each day of assessments. Motivation and maturity are also focal points in the final interview before a determination is made on the student’s application.
The Outreach Process
Typically, Gateway to College programs take a “recruit-to-fill” approach, aiming to identify just enough students to fill their seats. The outreach strategies observed at the three program sites included formal referrals from local school districts and community-based organizations and informal referrals from other students, community members, counselors, and other educators. These outreach strategies tended to be passive — the “recruit-to-fill” approach does not necessarily warrant a more active outreach process. This is not atypical; some of the best known programs for at-risk young adults (such as YouthBuild or ChalleNGe) do not do intensive outreach and also tend to serve highly motivated young people.15
The program sites in this study received technical assistance from MDRC as part of their participation, with the goal of increasing the number of eligible students who applied. The
15Bloom, Levy Thompson, and Ivry (2010).

18
technical assistance process consisted of consultant-facilitated SWOT (Strengths, Weaknesses, Opportunities, and Threats) analyses, and monitoring and support provided by MDRC site liaisons. These discussions covered a range of topics that included broadening or diversifying the pool of students being recruited, identifying additional partnership opportunities, and identifying specific outreach strategies (for example, the use of social media), among others.
The technical assistance provided was intended both to help program sites recruit enough students to meet the study’s sample needs (as part of the original random assignment design) and to help them become more stable in the long term, since previously they had been largely dependent on school-district referrals. As mentioned, the three program sites represented in this report were the ones that were able to successfully increase their number of eligible applicants and that effectively applied the outreach plans they developed during the technical assistance process. Several lessons were learned during this process that can benefit other Gateway to College program sites and other programs serving a similar population. These lessons are summarized in Appendix A.
The Application Process
The young adults served by Gateway to College are a subset of a larger population of students who are not succeeding in mainstream high schools. By analyzing the Gateway to College application process and some district-level data, one can begin to gauge how similar the students in the program are to their peers. Using this approach alongside statistics from the baseline information form provides a richer understanding of the typical participant than the eligibility criteria alone can offer.
In conversations with researchers, school administrators and program staff members expressed a belief that the group of eligible students who could benefit from Gateway to College and who would be a good fit for the program is substantially larger than the group currently being served. Indeed, in the areas where Gateway to College operates, the low graduation rates in local school districts indicate that many students are not being adequately served in the mainstream K-12 system. However, this pool of potential students shrinks once one takes into account other factors that determine whether or not a student is a good fit for the program.
Publicly available district-level graduation rate data can be used to arrive at a rough es-timate of the number of local students who have dropped out of school or who are at risk of dropping out.16 If one considers students who have been held back to be at risk of dropping out,
16California graduation data for the Class of 2013 were obtained from California Department of Education (2013). Colorado data for the Class of 2012 were obtained from Colorado Department of Education (2015). Washington data for the Class of 2013 were obtained from Office of the Superintendent of Public Instruction,
(continued)
19
all local students who fail to graduate in four years are potential Gateway to College students. Totaled across the main partner districts for each program site, the estimated size of the local eligible population ranges from 800 students (Washington program site) to more than 1,600 (Colorado program site).17 According to annual enrollment statistics from the Gateway to College National Network and data on the intake process from the program sites themselves, the three program sites in the study receive 200 to 300 inquiries about the program from students each year.18 However, without better information about the number of local students who meet other eligibility criteria (such as reading at an eighth-grade level or higher), it is unclear how much room to grow the typical Gateway to College program site has.
To show how often an inquiry about Gateway to College resulted in an application or an acceptance, the three program sites provided information on the number of students who advanced to each stage of the application process during the study enrollment period (leading up to the fall 2012 term in the Colorado and Washington program sites, and spring 2013 for the California program site). In some cases, the program sites also provided reasons why certain students were not accepted. These data were supplemented by interviews with program staff members about the application process. A typical progression of a set of 100 inquiries about Gateway to College is represented in Figure 2.1.
Across the three program sites in the study, students are most often referred to the pro-gram by their high school guidance counselors — usually because they have been identified as struggling in the traditional school setting or because they have been identified as being unlikely to graduate on time. The approach a particular guidance counselor takes can influence how many of that counselor’s students follow up with Gateway to College. In fact, focus groups and interviews with students and K-12 partners suggest that some counselors are selective about referrals while others are not. Several students mentioned that many students “probably don’t hear about [Gateway to College]” and that the only reason they heard about it was because someone specifically referred them to it. Other counselors seem to rely on the curiosity and motivation of their students. As one high school counselor said, “Anyone that wants infor-mation is given information. And then it’s up to [the student] to take the next step if they want
State of Washington (2015). Definitions and instructions for calculations using adjusted graduation cohorts can be found in U.S. Department of Education (2008).
17A district was considered a “main” partner district if at least 5 percent of study participants at the local Gateway to College program site lived in that district. Using this criterion, 3 of the 5 California district partners are main partners, 4 out of 4 Colorado district partners are main partners, and 6 out of 13 Washington district partners are main partners.
18Calculated using National Network management information system data for the 2012-2013 academic year.

20
100 students inquire about Gateway to College: calling or visiting the office, providing basic information, signing up for an information session
73 students attend an information session
65 students apply to Gateway to College: taking placement tests, submitting paperwork and essays
52 students are accepted by Gateway to College
Figure 2.1
Outcomes for a Typical Set of 100 Inquiries About the Gateway to College Program
SOURCE: MDRC calculations based on Gateway to College program records on students interested in applying during the study enrollment period.
NOTES: The data were provided by sites in a variety of formats and were reconciled to create an approximation. Ratios represent the typical experience at a Gateway to College study site. Sites are weighted equally, not according to enrollment levels. At the Washington program site, where Gateway to College operates alongside a more typical dual-enrollment program for high-achieving students (known as Academy), there is a combined information session for everyone interested in either program. Due to that shared application process, records from the Washington program site included students who expressed interest in either program. To account for this, the total numbers provided by the site were calibrated based on the ratio of students accepted to Gateway to College over the total number of students accepted to either program.
73
100
65
52
21
to pursue it.” Other students heard about the program from teachers, friends, or family mem-bers. A counselor or family member can inquire on the student’s behalf and schedule a date to attend a more detailed in-person information session or orientation.
Sometimes students learn enough from the initial contact to understand that they would not qualify or to determine that Gateway to College is not an environment where they would thrive. Before the information session, the program often asks basic questions about a student, mostly pertaining to eligibility factors such as age, school district, academic standing, and referral source. Occasionally, if a student is too young or is coming from a district without a funding arrangement with the program, Gateway to College staff members will inform the student about the issue before the information session takes place. If a student inquires about the program but does not attend an information session, it is generally considered an indication that he or she is no longer interested in participating; if the inquiry was made by a parent or counse-lor, the student may not have been very interested in the first place. For every 100 inquiries about Gateway to College, about 73 students attend an information session.
At the information session, students learn about the benefits of the program and what it means to participate. At the time of this study, at some program sites students also took an assessment called the API that determined whether or not they were able to read and write at an eighth-grade level.19 Applicants either fill out an application during the information session or complete it beforehand and turn it in when they arrive. Those who meet the basic eligibility requirements are then invited back for one to two additional days of assessments.
At the Washington program site, where Gateway to College operates alongside a more typical dual-enrollment program for high-achieving students, there is a combined information session for everyone interested in either program. Staff members consider transcripts, grade point averages, credits earned, and age to determine which program is appropriate for a given applicant. Most students who attend an information session or orientation do take further steps in the application process, and return to take additional tests or submit transcripts and required essays. For every 100 that inquire, 65 students at least partially complete an application for Gateway to College.
Gateway to College programs typically administer the placement tests preferred by their host colleges; the program sites in the study used either the Compass or ACCUPLACER test. A student’s test results are considered alongside the number of credits he or she needs to graduate, and program staff members assess whether they think the student stands a chance of graduating Gateway to College in a timely manner. Most students who are turned away by the program are
19The API stands for the Adult Placement Indicator, an assessment that has since been phased out at most
Gateway to College program sites. It provided a quick (10- to 15-minute) test of students’ reading skills.

22
rejected on the basis of their placement test scores and estimated time to graduation. This is a major reason why, of the 65 students who complete applications, only 52 are offered seats in the Gateway to College program (although some students do decide on their own not to attend the program, even at this later stage).
The students deemed academically suitable for the Gateway to College program are in-vited back for an interview with a program staff member. At program sites where data on interviews were available, it was clear that very few students were turned down based on their performance in the final interview. This suggests that students who reached this stage of the process likely possessed the skills and attributes the programs were looking for.
Discussions with program staff members supported this conclusion: Staff members be-lieved that applicants lacking in maturity or “grit” were unlikely to pursue their applications this far.20 However, the interview stage is still useful as a final check in determining whether or not a student is indeed the right fit for the program. As such, the students accepted into Gateway to College are those who have been deemed a good fit for the program by virtue of their academic readiness and their willingness to commit to meeting the demands of the program model.
Description of the Student Study Sample After successfully completing the application process but before entering the lottery, study participants were asked to complete a baseline information form. As described in Chapter 1, this form asked students questions about their personal and family background, academic back-ground, and educational enrollment status. Their responses are discussed in this section and presented in Table 2.1 alongside averages for the full Gateway to College National Network (where available).
Basic Demographic Information
On average, students at the program sites in the study were slightly over 17 years old when they applied to the program. Their ages ranged from 15 to 19, with similar numbers being older and younger than 17. Most (61 percent) were male. The student population in the broader National Network is on average very similar to the three program sites in the study, though closer to 50 percent male. At the California program site, a majority of students were Hispanic, while at the Colorado and Washington program sites, most students were white. Black students are underrepresented in the study sample compared with a typical Gateway to College program,
20“Grit” indicates traits such as resilience, motivation, and perseverance, as described by Duckworth, Pe-
terson, Matthews, and Kelly (2007).
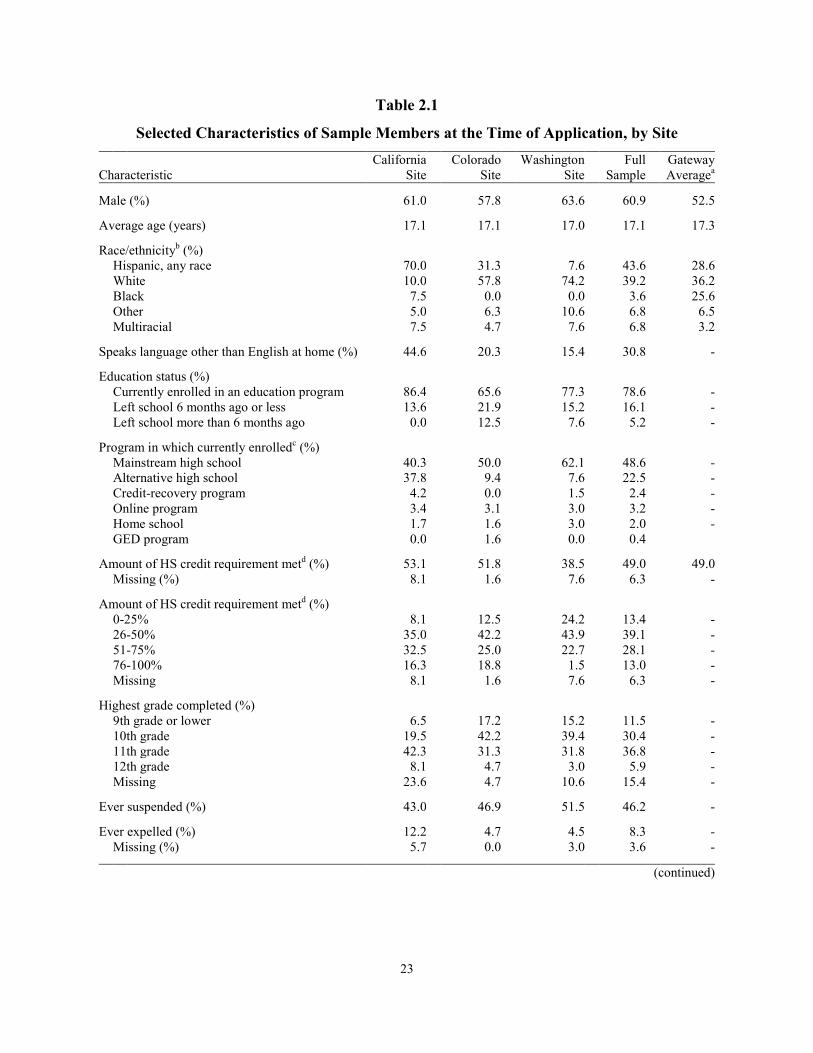
23
Table 2.1 Selected Characteristics of Sample Members at the Time of Application, by Site California Colorado Washington Full Gateway Characteristic Site Site Site Sample Averagea
Male (%) 61.0
57.8
63.6
60.9
52.5
Average age (years) 17.1
17.1
17.0
17.1
17.3
Race/ethnicityb (%)
Hispanic, any race 70.0
31.3
7.6
43.6
28.6
White 10.0
57.8
74.2
39.2
36.2
Black 7.5
0.0
0.0
3.6
25.6
Other 5.0
6.3
10.6
6.8
6.5
Multiracial 7.5
4.7
7.6
6.8
3.2
Speaks language other than English at home (%) 44.6
20.3
15.4
30.8
-
Education status (%)
Currently enrolled in an education program 86.4
65.6
77.3
78.6
-
Left school 6 months ago or less 13.6
21.9
15.2
16.1
-
Left school more than 6 months ago 0.0
12.5
7.6
5.2
-
Program in which currently enrolledc (%)
Mainstream high school 40.3
50.0
62.1
48.6
-
Alternative high school 37.8
9.4
7.6
22.5
-
Credit-recovery program 4.2
0.0
1.5
2.4
-
Online program 3.4
3.1
3.0
3.2
-
Home school 1.7
1.6
3.0
2.0
-
GED program 0.0
1.6
0.0
0.4
Amount of HS credit requirement metd (%) 53.1
51.8
38.5
49.0
49.0
Missing (%) 8.1
1.6
7.6
6.3
-
Amount of HS credit requirement metd (%)
0-25% 8.1
12.5
24.2
13.4
-
26-50% 35.0
42.2
43.9
39.1
-
51-75% 32.5
25.0
22.7
28.1
-
76-100% 16.3
18.8
1.5
13.0
-
Missing 8.1
1.6
7.6
6.3
-
Highest grade completed (%)
9th grade or lower 6.5
17.2
15.2
11.5
-
10th grade 19.5
42.2
39.4
30.4
-
11th grade 42.3
31.3
31.8
36.8
-
12th grade 8.1
4.7
3.0
5.9
-
Missing 23.6
4.7
10.6
15.4
-
Ever suspended (%) 43.0
46.9
51.5
46.2
-
Ever expelled (%) 12.2
4.7
4.5
8.3
-
Missing (%) 5.7
0.0
3.0
3.6
-
(continued)
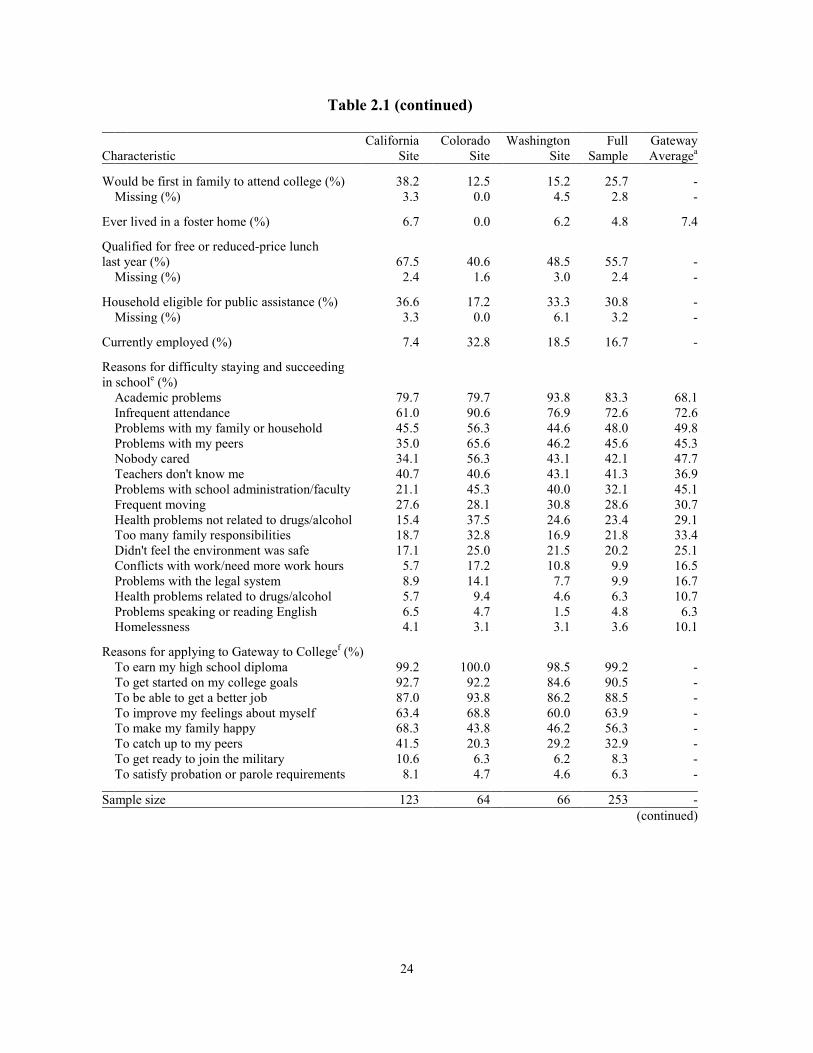
24
Table 2.1 (continued)
California
Colorado
Washington
Full
Gateway
Characteristic Site Site Site Sample Averagea
Would be first in family to attend college (%) 38.2
12.5
15.2
25.7
-
Missing (%) 3.3
0.0
4.5
2.8
-
Ever lived in a foster home (%) 6.7
0.0
6.2
4.8
7.4
Qualified for free or reduced-price lunch last year (%) 67.5
40.6
48.5
55.7
-
Missing (%) 2.4
1.6
3.0
2.4
-
Household eligible for public assistance (%) 36.6
17.2
33.3
30.8
-
Missing (%) 3.3
0.0
6.1
3.2
-
Currently employed (%) 7.4
32.8
18.5
16.7
-
Reasons for difficulty staying and succeeding in schoole (%)
Academic problems 79.7
79.7
93.8
83.3
68.1
Infrequent attendance 61.0
90.6
76.9
72.6
72.6
Problems with my family or household 45.5
56.3
44.6
48.0
49.8
Problems with my peers 35.0
65.6
46.2
45.6
45.3
Nobody cared 34.1
56.3
43.1
42.1
47.7
Teachers don't know me 40.7
40.6
43.1
41.3
36.9
Problems with school administration/faculty 21.1
45.3
40.0
32.1
45.1
Frequent moving 27.6
28.1
30.8
28.6
30.7
Health problems not related to drugs/alcohol 15.4
37.5
24.6
23.4
29.1
Too many family responsibilities 18.7
32.8
16.9
21.8
33.4
Didn't feel the environment was safe 17.1
25.0
21.5
20.2
25.1
Conflicts with work/need more work hours 5.7
17.2
10.8
9.9
16.5
Problems with the legal system 8.9
14.1
7.7
9.9
16.7
Health problems related to drugs/alcohol 5.7
9.4
4.6
6.3
10.7
Problems speaking or reading English 6.5
4.7
1.5
4.8
6.3
Homelessness 4.1
3.1
3.1
3.6
10.1
Reasons for applying to Gateway to Collegef (%)
To earn my high school diploma 99.2
100.0
98.5
99.2
-
To get started on my college goals 92.7
92.2
84.6
90.5
-
To be able to get a better job 87.0
93.8
86.2
88.5
-
To improve my feelings about myself 63.4
68.8
60.0
63.9
-
To make my family happy 68.3
43.8
46.2
56.3
-
To catch up to my peers 41.5
20.3
29.2
32.9
-
To get ready to join the military 10.6
6.3
6.2
8.3
-
To satisfy probation or parole requirements 8.1
4.7
4.6
6.3
-
Sample size 123 64 66 253 - (continued)

25
and also compared with statistics from national studies of students who do not graduate on time.21 Also, more than 30 percent of students in the sample regularly spoke a language other than English at home.
Enrollment and Academic Status
Ninety-five percent of study participants were either still enrolled in an educational pro-gram at the time of their application to Gateway to College or had dropped out in the previous six months. While Gateway to College offers itself as an option for young adults who have
21For the national comparison, see America’s Promise Alliance (2014) and Ingels and Dalton (2013).
Table 2.1 (continued) SOURCES: MDRC calculations using student responses to the baseline information form (BIF) and (where indicated) Gateway to College National Network management information system (MIS) data. NOTES: Missing values are not included in individual variable distributions of data from the BIF when less than 2 percent of the full sample is missing. For variables with higher rates of missing values, a missing category is shown. Where the missing category is not shown, no items had more than five people missing. No imputations were done for missing data. HS = high school.
aAggregate data provided by the Gateway to College National Network. Averages shown are for all new
students enrolled during the 2012-2013 school year across the network. A hyphen indicates that data were not available for a particular measure or group of measures. Data on gender were missing for 13 percent of students. Data on race and ethnicity were missing for 26 percent of students. Missing rates for other measures are not available.
bHispanic sample members are categorized as Hispanic, regardless of race. "Other" includes "Asian or Pacific
Islander" and "American Indian or Alaskan Native" as well as "other." Sample members categorized as "multira-cial" indicated multiple race categories and did not indicate Hispanic heritage.
cPercentages do not sum to 100 because not all sample members were enrolled in an educational program
when they entered the study and not all sample members who indicated enrollment specified the type of program they were enrolled in. Credit-recovery programs allow students to enroll independently in courses to catch up on credits required to graduate from high school. For this summary, students who reported enrolling in a credit-recovery program while also being enrolled in high school or alternative high school are shown as enrolled in high school or alternative high school only.
dCalculated using data from the Gateway to College National Network MIS as credits needed divided by total
credits required to earn a high school diploma in the student's reported district. Strong agreement was found between BIF responses and MIS data for total credits earned where data were available from both sources. Consequently, for students where MIS data were not available, the self-reported BIF responses were used if available. Percentages shown do not include students for whom data are missing.
eRespondents were asked whether the issues listed were "never," "occasionally," "sometimes," "often," or
"always" a problem for them. The percentages shown combine all responses except "never a problem for me."
fRespondents were asked whether the reasons listed were "not important," "somewhat important," or "very
important." The percentages shown reflect those who responded that the reason was "very important" to them.

26
dropped out, it more commonly seems to be used for dropout prevention, made possible by referrals from high school guidance counselors. Whether an applicant was coming from a mainstream high school or an alternative institution varied greatly by site; for example, the California program site has many more alternative high schools in its service area than the other two program sites.
At the time they applied, students in the sample had earned about half of the credits needed to complete their high school diplomas, matching the National Network average, and most had completed at least tenth grade. Of the sample members, students at the Washington program site were furthest from graduating on average, and by far the least likely to have earned at least 75 percent of the credits necessary to graduate.
The students in the study sample were somewhat more likely to have had disciplinary issues than a national sample of high school dropout students. Forty-six percent had been suspended from high school at some point and 8 percent had been expelled. In comparison, a national study reported that 38 percent of students who had dropped out of high school had been suspended or expelled.22
Family and Socioeconomic Background
Many students who apply to Gateway to College come from low-income backgrounds. On average across the three program sites in the study, 56 percent of students qualified for free or reduced-price lunches, and 31 percent lived in households eligible for public assistance. Students at the California program site were the most likely to be in financial need: 68 percent qualified for free or reduced-price lunches, and 37 percent lived in households eligible for public assistance.
Seventeen percent of students were working at the time of application. The wide varia-tion shown in employment rates among program sites in the study may be influenced by the timing of study enrollment: The Colorado and Washington program sites enrolled students over the summer, when they were more likely to be working, while the California program site recruited during the fall and early winter.
In addition, 5 percent of the study sample had spent time in a foster home, which is slightly less than the National Network average (7 percent) and a national survey of high school dropouts (11 percent).23
22America’s Promise Alliance (2014). 23For the national survey, see America’s Promise Alliance (2014).

27
Interestingly, most study participants had at least one parent or sibling who had attend-ed college, which likely influenced the high proportion of students in the sample with post-secondary aspirations. As discussed more below, a large number of students in the sample said that it was very important to them to get started on their college goals.
Student Challenges and Aspirations
Academic problems and infrequent attendance were the issues students cited by far the most often as ones that had affected their ability to stay or succeed in school, both at the program sites in the study and across the National Network. Eighty-three percent of study students indicated that academics were a challenge; 73 percent indicated that attendance was an issue. Personal problems with family, teachers, or peers were also fairly common obstacles. In focus groups, several students mentioned making mistakes in high school, and alluded to the fact that their attendance issues were sometimes caused by their not fitting in the traditional high school environment (for example, they felt the format and environment were not well aligned with their learning styles, or they had trouble with teachers or other students), or by being in a place in their lives where they were not ready to take their education seriously. This is in line with recent research that suggests that “young people who stop going to school are likely to be navigating home, school, or neighborhood environments that they experience as toxic.”24
As expected, more than 99 percent of students in the study said that they applied to Gateway to College because finishing the requirements of a high school diploma was “very important” to them. Roughly 90 percent of students in the study said the same about starting on their college goals and about being able to get better jobs. More than 60 percent of students in the study indicated that applying to Gateway to College was very important for them in order to feel better about themselves. An example of why this might be emerged in a student focus group where one student mentioned fearing being a “super senior” at her high school and being too old for high school. Interestingly, the importance of friends and family varied quite a bit by program site. Students at the California program site were the most likely to be driven by a desire to make their families happy or to measure up to their peers.
Choosing Gateway to College: Identifying Other Programs Attended by Potential Participants Gateway to College operates alongside a variety of alternative education programs available to young adults who have dropped out of high school or who are at risk of dropping out. However,
24America’s Promise Alliance (2014). Young people in “toxic” environments described themselves as survivors of violence, exposed to violence, affected by negative health events in their families, or subject to school climates and policies that were unsafe, unsupportive, or disrespectful.

28
as described above, Gateway to College is more targeted than other alternative education programs. While Gateway to College bears some similarity to other second-chance programs such as YouthBuild and ChalleNGe that also target students highly motivated to connect or reconnect with education,25 only Gateway to College targets students who aspire to complete a postsecondary education despite having fallen behind in a mainstream high school setting, and who also possess the academic skills to be “college-ready” in a relatively short period of time. In addition, students must also demonstrate the will and readiness to break the patterns that resulted in their past poor performance. In the absence of Gateway to College, it appears that these unique students fall back on a familiar set of educational alternatives: programs that do not feature the strong connection to the college environment that Gateway to College provides.
All study participants were surveyed about their educational experiences 12 months af-ter random assignment. The responses of the control group — students who qualified for Gateway to College but were embargoed from enrolling for a year — reveal how Gateway to College’s target population views and utilizes the other educational programs available.26 The enrollment patterns of the control group students are presented in Figure 2.2.
The most notable finding was the increase in the number of students enrolled in online programs or “blended” models that integrate self-paced online learning with in-person instruc-tion. Many control group students stayed in mainstream or alternative high schools, at least for the first semester after entering the study; some students took adult basic education classes instead. The survey data on students’ satisfaction with their education, coupled with some in-depth follow-up interviews with respondents, indicate that while these students saw value in the classes they took, in general they did not consider the alternatives to measure up to Gate-way to College. Furthermore, at the Colorado and Washington program sites a substantial portion of the control group maintained their interest and enrolled in Gateway to College in a subsequent term.27
In a follow-up interview, a control group student who enrolled in Gateway to College after the embargo was asked to compare her experience at her former school with her experi-ence in Gateway to College. Her response was that it was “definitely not even comparable” and that “Gateway was a different experience altogether.” She mentioned that the main reason she
25Bloom, Levy Thompson, and Ivry (2010). 26Among control group members, the response rate for the survey was 47 percent. This low response rate
means respondents are not necessarily representative of all control group members; nevertheless, the experi-ences of respondents provide important insight into which alternative programs are the most relevant for this population.
27This pattern was confirmed in the Gateway to College National Network database. A few students man-aged to enroll before the one-year embargo period had expired.

Figure 2.2
Patterns of Enrollment in Education Among Control Group Survey Respondents
0
5
10
15
20
25
Mainstreamhigh school
Alternativehigh school
Online/blended
Adult basiceducation/GED
Homeschool
Gateway toCollege
Communitycollege
Perc
enta
ge o
f res
pond
ents
enr
olle
d
Semester 1 Semester 2 Semester 3
SOURCE: Calculations from Gateway to College 12-month survey data. NOTES: Sample size = 34.
29
30
found so much value in the program is that all the students had similar situations and levels of motivation: “All the people that were in my class were in the same boat. They all wanted to get their education done and have a career. They were all so motivated. It was just so awesome.” Interviewees in other programs indicated disconnection from their peers for various reasons, including differences in priorities, perceived cultural differences related to socioeconomic status (for example, one student described her classmates as wealthier and living “in a bubble”), and in the case of online programs, physical separation. In one online program, students were instruct-ed not to collaborate on work (although they sometimes did, having met at their former high school); in another, while connecting with other students (for example through activity clubs) was encouraged, the interviewee saw little reason to participate.
Based on the findings from these three program sites and comparisons with the national student body of Gateway to College, the population served by Gateway to College is both challenged and promising: While they are behind in credits and demonstrate behaviors such as low grades and poor attendance, they must also possess a certain level of maturity, motivation, and readiness to commit to a rigorous academic program like Gateway to College. In most respects these young people resemble high school dropouts nationwide, but by design, Gateway to College participants also possess a foundation of basic academic skills (that is, they can read and write at an eighth-grade level or higher) that will need to be further developed in a relatively short time to launch further academic achievement. While other nontraditional educational programs serving at-risk young adults exist alongside Gateway to College, none emerges as a comprehensive alternative in the eyes of the students themselves.
31
Chapter 3
Implementation of the Gateway to College Program
This chapter describes the implementation of the Gateway to College model at the three program sites in the study and is guided by three main research questions:
1. Were the core elements of the Gateway to College model implemented as planned?
2. What kinds of adaptations were made to meet the demands of the local context and the needs of the local student population?
3. What factors facilitated or impeded successful program implementation?
The discussion of implementation in this chapter is organized according to the five core elements of the program model: (1) a learning community with a prescribed set of core courses during the Foundation term, (2) instruction and support based on the Gateway to College Principles of Teaching and Learning, (3) comprehensive support services, (4) transition to mainstream community college classes in students’ second term, and (5) training and support for Gateway to College staff members. All Gateway to College program sites are expected to implement these core elements. However, the model design also provides a great deal of flexibility to program sites in how they implement those elements.
The three program sites that participated in this study are not necessarily representative of all Gateway to College program sites in the National Network. They are merely the three that were able to meet the study’s recruitment targets, as mentioned in Chapter 1. As such, the findings derived from these program sites cannot be generalized to the entire Gateway to College National Network. However, they demonstrate some of the diversity of the target population as well as conditions under which the program hopes to flourish. Understanding the forms that Gateway to College takes in different circumstances is particularly important as the program continues to develop its model and identify new potential program sites. Specific adaptations and articulations of the model are discussed in this chapter, along with the factors pertinent to explaining variations in implementation.
Learning Community with Prescribed Core Courses During the Foundation Term The first component of the Gateway to College model consists of two elements: a set of core courses that students must take in their Foundation term (English Language Arts, math, Student Success, and Career Development), and the learning community of classmates with whom they
32
take all of these courses. The core courses are a vehicle for instilling and strengthening the basic academic and study skills that students will need in their second term when they transition to standard community college classes. As described in Chapter 2, the learning community is intended to create a shared experience among students and to create a network of peer support in which students encourage each other and reinforce good academic habits such as regular attendance. Given students’ previous challenges with traditional educational environments, peer support is thought to be critical to their success.
Core Courses
As shown in Table 3.1, all three program sites provide an English Language Arts (ELA) course, a math course, and at least one Student Success course during the Foundation term, as the model prescribes. However, there was some variation with respect to the Career Develop-ment course. At the Washington program site, the Career Development course was much more central to students’ experiences than at the other two program sites in the study. The course, which was implemented during the Foundation term as prescribed by the model, focused heavily on career exploration, helping students identify a career pathway to pursue, and helping students understand their learning and working styles. As one staff member said, the career exploration course is where “they’re figuring out what they want to do their second term and beyond.”
This centrality of the Career Development course was heavily influenced by the fact that the Washington program site is hosted by a technical institute whose students are required to choose a career pathway. To help Gateway to College students assimilate quickly to the college’s career technical education environment, the program site emphasized the career exploration component of the model more heavily. In fact, the Washington program site supplemented the Career Development course in the Foundation term with a second career-oriented course called “Professional Development Skills” during students’ transition term. This additional course provided students an opportunity to learn about the skills and behaviors employers would expect from them. It also gave the program a way to maintain close contact with students after they transitioned into mainstream community college courses. Implementing a course during the transition term is a strategy implemented by all three program sites in the study in addition to, or in place of, what is typically envisioned by the National Network, as will be further discussed later in this chapter.1
1The National Network envisions that a standard program will “keep tabs” on students after they transition
using periodic check-ins with Resource Specialists and regularly scheduled lab times.

Table 3.1 Prescribed Courses by Program Site Course Type California Sitea Colorado Site Washington Site Pre-Foundation term intersession:
Student Success I Intro to College
Intro to College - - College Strategies:
New Student Welcome
Main Foundation term:
ELAb Foundation ELA Writing Fundamentals Reading Improvement and Beginning English (writing)
Mathc Foundation Math Fundamentals of Math, Pre-Algebra
Introductory Algebra
Elements of Arithmetic, Pre-Algebra,
Introduction to Algebra, Intermediate Algebra
Student Success I - - Intro to College Semester Survival -
Student Success II College Success
Strategies
College Success
Strategies
College Success
Strategies Academic Achievement College Strategies
Career Development Career Exploration - - - Exploring Community and Work
Post-Foundation term intersession:
Career Development - Career Exploration
Career Exploration - -
Transition term: Student Success II - Semester Survival -
Career Development - - Professional Development Skills
(continued)
33
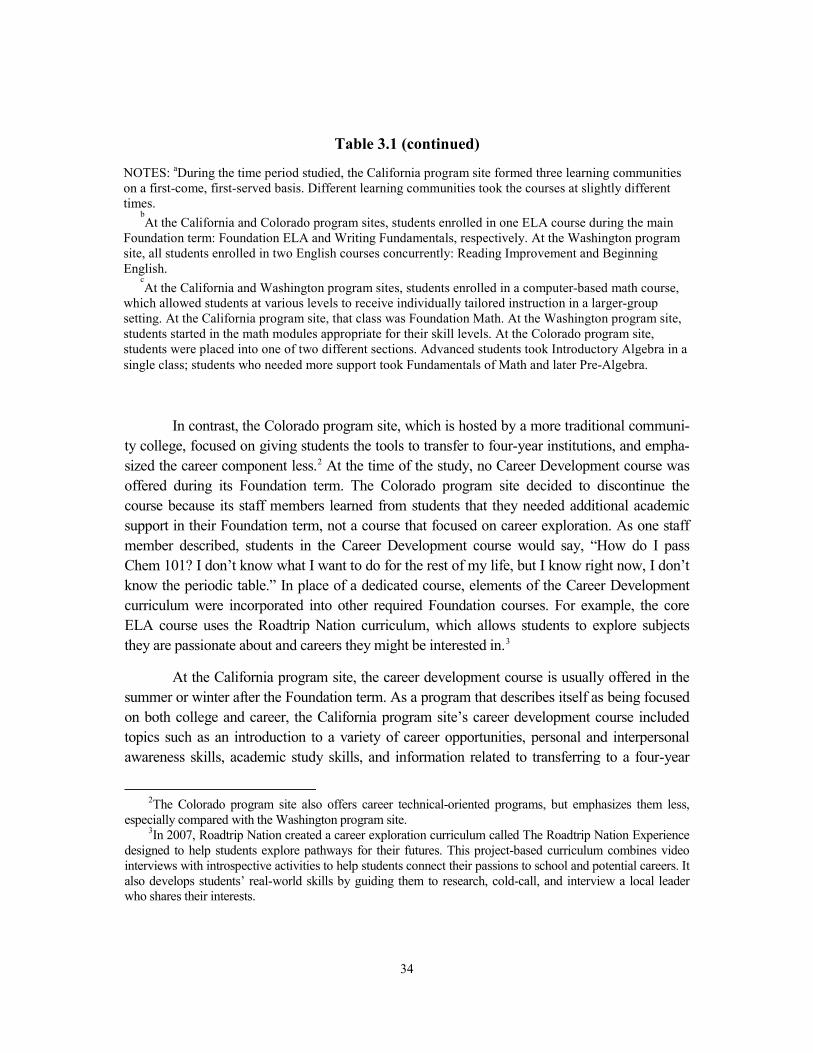
34
In contrast, the Colorado program site, which is hosted by a more traditional communi-ty college, focused on giving students the tools to transfer to four-year institutions, and empha-sized the career component less.2 At the time of the study, no Career Development course was offered during its Foundation term. The Colorado program site decided to discontinue the course because its staff members learned from students that they needed additional academic support in their Foundation term, not a course that focused on career exploration. As one staff member described, students in the Career Development course would say, “How do I pass Chem 101? I don’t know what I want to do for the rest of my life, but I know right now, I don’t know the periodic table.” In place of a dedicated course, elements of the Career Development curriculum were incorporated into other required Foundation courses. For example, the core ELA course uses the Roadtrip Nation curriculum, which allows students to explore subjects they are passionate about and careers they might be interested in.3
At the California program site, the career development course is usually offered in the summer or winter after the Foundation term. As a program that describes itself as being focused on both college and career, the California program site’s career development course included topics such as an introduction to a variety of career opportunities, personal and interpersonal awareness skills, academic study skills, and information related to transferring to a four-year
2The Colorado program site also offers career technical-oriented programs, but emphasizes them less,
especially compared with the Washington program site. 3In 2007, Roadtrip Nation created a career exploration curriculum called The Roadtrip Nation Experience
designed to help students explore pathways for their futures. This project-based curriculum combines video interviews with introspective activities to help students connect their passions to school and potential careers. It also develops students’ real-world skills by guiding them to research, cold-call, and interview a local leader who shares their interests.
Table 3.1 (continued)
NOTES: aDuring the time period studied, the California program site formed three learning communities on a first-come, first-served basis. Different learning communities took the courses at slightly different times.
bAt the California and Colorado program sites, students enrolled in one ELA course during the main
Foundation term: Foundation ELA and Writing Fundamentals, respectively. At the Washington program site, all students enrolled in two English courses concurrently: Reading Improvement and Beginning English.
cAt the California and Washington program sites, students enrolled in a computer-based math course,
which allowed students at various levels to receive individually tailored instruction in a larger-group setting. At the California program site, that class was Foundation Math. At the Washington program site, students started in the math modules appropriate for their skill levels. At the Colorado program site, students were placed into one of two different sections. Advanced students took Introductory Algebra in a single class; students who needed more support took Fundamentals of Math and later Pre-Algebra.

35
institution. Like the Colorado program site, the California program site uses the Roadtrip Nation curriculum, but as part of its post-Foundation-term career-exploration course instead of its ELA course. In addition, students participate in a “Leadership Shaping” course where both college- and career-related topics are covered. At this program site, the emphasis on career development also mirrors the goals of the host institution, a college that describes itself as having a balanced focus on transfer to a four-year institution and career technical education.
The variation in how program sites implement this component of the model is largely driven by two main factors: the host institution’s mission and curriculum, and the needs of the Gateway to College student population as identified by the local Gateway to College staff. Alignment with the host institution is important because of the program’s dual-enrollment design. The three program sites in the study emphasized the Career Development course component to the degree that staff members felt would best position students to transition to the host institution and meet its course requirements.
In summary, all of the program sites in the study implemented three of the four courses prescribed for the Foundation term, but only one of the three (the Washington program site) implemented the Career Development course as prescribed. However, all three program sites managed to maintain the content and intent of the Career Development course — that is, they provided students with an opportunity to explore possible career paths and exposed them to career-related skills. Conversations with Gateway to College National Network and local staff members reveal that this level of adaptation is expected and that the model allows for flexibility so long as program sites are able to deliver the basic intended information.
Data from the student follow-up survey suggest that the curriculum being implemented at the three program sites in the study resonates with students’ needs. Gateway to College students who responded to the survey overwhelmingly agreed that their course work — both the course content and the study skills they had gained — was meaningful preparation for both college and “the real world.” Where additional work may be needed is in more clearly develop-ing the model’s parameters of flexibility: how much is acceptable with respect to both content and mode of delivery, and examples of what acceptable variation might look like.
For example, it may be helpful to have an explicit discussion about how central the Ca-reer Development component should be to the program model, since at one program site the Career Development course was central to the Foundation term experience, while at another the course was discontinued and its elements incorporated into another course. In the next phase of the program model’s evolution, Gateway to College may want to consider providing specific guidance about how the Career Development component should be incorporated into the student experience. This guidance could include a range of examples, and would likely need to
36
be paired with conversations between individual program sites and the National Network to ensure that local needs and contexts are being appropriately considered.
Again, at this stage of the model’s development, its lack of specificity does not neces-sarily interfere with implementation fidelity, in large part because the elements of the model as currently designed are intended to be broad. However, it may become necessary to balance the flexibility of the model with more specific guidance about high-quality implementation as the model continues to expand into new settings.
The Learning Community
It is central to the model that students take the prescribed courses together during their Foundation term as part of a learning community. To examine the extent to which this occurred, researchers examined course enrollment data from the National Network manage-ment information (MIS) system along with program-site-provided data that contained details about student placement into learning communities. All three program sites successfully created and maintained two to three learning communities per semester, each consisting of about 20 to 30 students. However, each program site had a different approach to forming learning communities.
The California program site, which had three learning communities of approximately 30 students each, organized its communities on a first-come, first-served basis. Students were enrolled into the program and placed in a learning community based on when they applied and were admitted; as shown in Table 3.1, two of the learning communities took a Student Success course during the winter intersession before the main Foundation term. Using the winter intersession in this way was important to the California program site as an immediate engage-ment strategy because the postsecondary host’s academic calendar did not always align with local school districts’ academic calendars. Rather than turn away qualified students, the pro-gram site started the curriculum slightly early. At the Washington and Colorado program sites, the course schedule did not have to be modified to align adequately with local district calendars.
At the Colorado program site, differences in students’ math skills led to some blending of the learning communities. Cohorts were divided into two primary learning communities of approximately 20 students each. These groups stayed together for English Language Arts and both Student Success courses (see Table 3.1 for course structures), but were divided for math according to their placement. The more advanced students took Introductory Algebra in a single class that drew from both learning communities; the students that needed an introduction to more basic math concepts took Fundamentals of Math and later Pre-Algebra. In this approach, students shared every class with the students in their learning community who were at the same level in math. This was necessary because the staff realized that students were entering the program at vastly different levels of math skill. As one staff member said, “Instead of just

37
sticking all these kids in [the same levels], we are trying to adapt to meet them where they are.” According to one staff member, the level and type of differentiation needed in instruction can vary from year to year. The program must adjust how the learning communities are formed and the levels of math offered after it sees students’ math placement results.
In contrast, the California and Washington program sites tailored math instruction to students’ skill levels by offering personalized computer-based instruction within a larger-group setting. Sometimes the Gateway to College instructor would lead lessons for the whole group. Other times, instructors would pay attention to individual students or occasionally to small groups of students working on the same topic. The computer-based math courses are similar to what one might see in a community college developmental education course (that is, a remedial course) implementing an accelerated math model. This strategy allowed the programs to keep the learning communities together while still responding to varying student needs, although the peer social dynamic in this kind of class might well be different from one in which students at the same level are working on the same projects.
Again, in this component of the Gateway to College model, each program site demon-strates a need for some flexibility in implementing the model. As was the case with the core courses, the learning communities were formed in different ways based on local Gateway to College staff members’ assessments of student needs. This approach is not atypical of programs that serve at-risk and dropout young people. In fact, it is often considered necessary to allow flexibility in the implementation of programs for young people like these, since they have such diverse needs. As past research has shown, there is no single profile of dropout young adults.4 Gateway to College serves a well-defined population, yet the three program sites in the study showed significant variations in student demographics, backgrounds, and levels of academic readiness. Programs need to consider how to respond to students’ diverse needs.
At the broadest level, the learning community component of the model was implement-ed as intended: All three program sites in the study created cohorts of students that were maintained throughout the Foundation term. The program sites chose different approaches to creating learning communities based on their informal assessments of students’ needs. Given the wide range of student needs and host-institution instructional practices, this level of varia-tion appears to be necessary and appropriate. It may be helpful to articulate to program sites more explicitly that this level of flexibility is acceptable and to have a conversation about which practices (for example, different ways of grouping students) can be implemented without violating the intent of the model, and which cannot.
4America’s Promise Alliance (2014).

38
Principles of Teaching and Learning Instruction in Gateway to College courses is guided by the program’s “Principles of Teaching and Learning.” These principles are not intended to specify course content. Instead, they are intended to guide the design and assessment of all learning in Gateway to College National Network programs, and the help the National Network provides program sites. According to the National Network, program staff members may not necessarily know the Principles of Teaching and Learning by that name. Interview protocols were therefore designed to explore staff members’ understanding of the principles and how they implemented them in their interactions with students. Interviews with program staff members and observations of instruction revealed that while none of the staff members mentioned the principles by name, all generally embodied the principles in their instructional approaches and attitudes. The following section describes how the program sites in the study put the Principles of Teaching and Learning into operation, followed by a discussion of ways that their implementation might be strengthened.
The Gateway to College principles as defined by the National Network can be found in Chapter 2. Yet staff members at the three program sites did not necessarily see clear distinctions between some of the principles described separately in that list. Analysis of the interview data revealed that Gateway to College staff members talked about “creating collaborative and inclusive learning communities” and “encouraging personal growth” in very similar ways. Also, “maintaining a rigorous learning environment” and “embedding assessments” tended to be discussed in tandem. The discussion that follows is therefore organized the way staff members seemed to conceive of the principles: (1) Integrated, Outcomes-Based Curriculum;5 (2) Rela-tionships and Personal Growth; (3) Constructing Meaning; (4) Relevance and Project-Based Learning; and (5) Rigor (Including Assessment).
Integrated, Outcomes-Based Curriculum
Gateway to College instructors across all three program sites reported designing instruc-tion with the question in mind: “What do students need to know and be able to do to be success-ful in college?” Interviews with instructors at the three program sites in the study and a review of course syllabi revealed that courses often aimed for two sets of learning outcomes: ones related to academic content (for example, being able to write a proper essay by the end of the term) and behavioral outcomes (for example, regular attendance and timeliness). Some instruc-tors reported working with others across the program to design an integrated curriculum; others collaborated only within their departments (for example, they worked with other math teachers in the program or at the host college). However, at all three program sites instructors and
5See the footnote in Chapter 2 in the subsection “Principles of Teaching and Learning” for a definition of
an “outcomes-based” curriculum.

39
Resource Specialists met regularly throughout the term to talk about individual student pro-gress, attempting to ensure that instruction and support reinforced one another.
Relationships and Personal Growth
As described in National Network program documents, Gateway to College believes that “a caring, solution-focused approach to working with students is the foundation for all learning” and that “personal connections with students” are very important. All instructors across all three program sites described their relationships with students as positive and healthy, but they varied in how they described an ideal teacher-student relationship. One instructor noted that while she strives to maintain a positive relationship with students, at the same time, “I don’t want to be their best friend. I want to be very clear that I’m their instruc-tor.” In contrast, another instructor described her relationship with students as “walking a fine line between having fun and working hard.” It is possible that this variation is influenced by variations in instructors’ background and training.
When asked about how a “solution-focused” approach translated into instruction or in-teractions with students, Gateway to College instructors described an ongoing process of regular encouragement and building on successes to reinforce positive habits. They described how they and Resource Specialists tried to communicate with students about advocating for themselves and their education, taking responsibility for their decisions, and thinking through the ramifica-tions and consequences of their decisions, academic or otherwise.
Constructing Meaning
To help students understand new concepts, most Gateway to College instructors said they used a combination of visual aids and real-world experiences, by, for example, drawing on everyday experiences to describe math concepts or discussing a news headline in an ELA classroom. Instructors also tried to give students assignments that allowed them to explore topics that were meaningful to them. For example, during one classroom observation, one student talked with her instructor about how she might get more information for her paper on a recently passed bill pertaining to support for teen mothers — a topic for which she showed a clear passion.
Relevance and Project-Based Learning
Currently, staff members at the three program sites in the study do not seem to have a consistent understanding of what constitutes project-based learning, what it should look like in Gateway to College classrooms, or how central it is to the model. In general, project-based learning describes a teaching method in which students learn skills and concepts by working on real-world problems, often through extended, in-depth projects. Project-based learning is most

40
readily seen in the Career Development course and least in the core academic courses (math and ELA). However, part of the idea behind project-based learning is that engaging in it should help students see the relevance to their lives of the topics they learn about, and as mentioned in the previous paragraph, there is some evidence that instructors are finding other ways of accom-plishing this. In the follow-up survey, Gateway to College students did seem to value the projects they were assigned: roughly 90 percent agreed that the projects in their courses were “interesting” and “engaging.”
Rigor (Including Assessment)
High expectations are communicated to students beginning when they first apply and continuing throughout their Gateway to College experience. For example, if a student is not turning in work, instructors will alert the Resource Specialist, who will sit down with the student to remind him or her of what is expected and the consequences of not performing. But the Resource Specialist will also work with that student to understand the barriers causing poor performance and will help the student identify solutions. In these interactions, Resource Specialists make an effort to “put the ball in [students’] court” by asking them to identify potential solutions, rather than identifying solutions for them. Meanwhile, programs cultivate “an ethic of excellence” in part through the use of regular assessments, oral evaluation of students’ performance, and peer edits guided by scoring documents the programs provide.
Ways Implementation Might Be Strengthened
At a broad level, it appears that the three program sites in the study have interpreted the Principles of Teaching and Learning fairly consistently. However, there may be additional nuances in how these principles are interpreted locally that this study is not able to assess. These slight variations are likely the result of differences in interpretation of the principles rather than the influences of postsecondary hosts or variations in student needs, which hold the most sway over the implementation of learning communities and core courses (the first major component of the model). Currently, the National Network provides limited guidance about how well these small variations align with the intent of the model. It is not clear, for example, whether or not the various ways instructors described instituting “a caring, solution-focused approach to working with students” are truly in line with the model’s intent.
The low level of variation in the implementation of this component of the model sug-gests two things. First, the underlying values inherent in the Principles of Teaching and Learn-ing are, broadly speaking, consistently present at all three program sites in the study. This is particularly impressive given that, as described in Chapter 1, these three program sites partici-pated in little ongoing training once they reached “veteran” status. Second, however, the limited degree to which the current assessment was able to detect variation in implementation also
41
points to lack of specificity in how these principles should be put into practice. That lack of specificity made it difficult to assess whether or not this component of the model truly is being implemented as intended — and also makes it difficult for the National Network to provide targeted technical assistance or even to determine if it is needed. At this stage of the program model’s growth the National Network might want to consider developing a range of concrete messages that communicate how the Principles of Teaching and Learning may be interpreted and implemented.
Comprehensive Student Support Services The support provided by Gateway to College instructors and staff members is guided by Gate-way to College’s principles of “holistic student support.” These principles include: (1) caring relationships, (2) safe environments, (3) a mindset centered on students’ strengths, (4) an approach focused on finding solutions to students’ problems, and (5) community connections. Like the “Principles of Teaching and Learning,” “holistic student support” may not be known by name to Gateway to College staff members. Thus, the research team took a similar approach here as was taken with the Principles of Teaching and Learning: the semistructured interview proto-cols were designed to explore program staff members’ understanding and implementation of the holistic support principles without mentioning them by name. Like the Principles of Teaching and Learning, the principles of holistic support are generally embodied in interactions among students, instructors, and Resource Specialists.
Sources of Support During the Foundation Term
Particularly during the Foundation term, students in Gateway to College receive support primarily from three sources: Resource Specialists, instructors, and peers. Of these, students mentioned Resource Specialists most often as a source of support. Resource Specialists act as counselors and provide services that include academic guidance and emotional support. When necessary, Resource Specialists also connect students to resources in the community (for example, to address drug and alcohol issues or homelessness). As one Resource Specialist said, “This role has many hats. It’s part counseling, part case management, and part teaching.” The support provided typically takes the form of one-on-one meetings, follow-up calls (particularly if a student has been absent), or informal interactions on campus or during class in cases where the Resource Specialist also teaches a Gateway to College course.6
Instructors also provide support, usually academic support. Students varied in their views of this support. In some cases, students indicated that they did not “feel a bond” with
6Resource Specialists may teach Gateway to College courses such as the Student Success course or Career Development course.

42
instructors and felt more comfortable talking with Resource Specialists. Other students noted strong connections with instructors. One student noted that he appreciated the support and being treated like an adult: “They communicate with you. If they know you’re behind, they’ll come and talk to you and they’ll let you know and say, ‘Hey, you missed this due date and that’s a zero. But I’ll help you and if you need extra time, let me know beforehand and we can work it out.’” The follow-up survey also suggests Gateway to College students had strong relationships with their teachers and counselors: 79 percent of Gateway students reported talking with an adult at their program site about academic issues at least once in the past year, and doing so in an average of nine meetings over the course of the year; 56 percent of students reported talking to an adult about personal issues at least once in the past year, in an average of four meetings that year.
Finally, all three Gateway to College programs had mechanisms to foster peer-to-peer support. For example, instructors typically asked students to choose an accountability partner. During one classroom observation, an instructor noted that a student was not in class; several students volunteered to call or text the student right away. In focus groups several Gateway to College students mentioned turning to their peers for academic support. However, interviews with instructors indicated that the cohesiveness of cohorts naturally varied — some were simply more “tight-knit” than others. In one interview, an instructor mentioned that “the morning cohort certainly has a sense of family” and that “they’re pretty tight-knit; they look out for each other.” In contrast, this instructor described the afternoon cohort as “a little more separated.” The student follow-up survey found that roughly half of Gateway to College students looked to their peers for academic or personal support at least once per week, but more than one in four said that they had not done so even once in the past year.
Sources of Support During the Transition Term
Once students transition into mainstream community college, by design, Gateway to College staff members provide much less support. The idea is that students should have devel-oped the skills they need to navigate community college and succeed there. However, many Gateway to College staff members have observed that students need additional support after the Foundation term, and expressed concern that it might not be available to them. For example, one instructor worried about how well students would do once they transitioned out of the Foundation term because “they [won’t] have that sense of family anymore.” In response, and as noted earlier in this chapter, all three program sites implemented a Gateway to College course in the transition term in order to maintain a connection to the students. Doing so allows the program sites to “keep tabs” on their students and intervene if, for example, a student has stopped attending classes. It may be helpful to explore the possibility of officially incorporating such support into the model.
43
Gateway to College study students also often mentioned going back to Resource Spe-cialists for support during the transition term, especially if their community college instructors did not seem approachable. In the transition term students no longer take all of their classes with the same group of peers, which means their peer support is not as strong. However, in focus groups several students reported still being in touch with a handful of other Gateway to College students, and having made new connections with community college students.
As was the case with the Principles of Teaching and Learning, at a broad level all three program sites appeared to be consistently implementing the type of student support prescribed by the model. However, this appearance of consistency may mask certain variations, given the model’s lack of specificity regarding which strategies are acceptable or unacceptable. It may be helpful for the program to work with program sites to develop a range of examples of how “holistic student support” should be implemented. Doing so could help the National Network identify which aspects of the model should be bolstered, and where it should provide targeted technical assistance.
Transition to Mainstream Community College As discussed, Gateway to College students are expected to transition fully to mainstream community college courses after the initial Foundation term. Typically, this means that Gate-way to College students take all of their courses at the community college where the program is being hosted and become integrated into the broader college community. However, as described in the previous section, all three of the Gateway to College program sites in this study observed that their students needed additional support after the Foundation term, and that the programs also needed a mechanism for staying connected to their students.
In response, the Colorado and Washington program sites implemented a Gateway to College course in the transition term. This kept staff members connected to students as they adjusted to community college and allowed them to intervene if, for example, a student stopped attending classes. At the California program site, some cohorts took a class during the summer intersession, shortening the time between their Foundation experience and their introduction to mainstream community college life.
Progress Through Prescribed Courses
Gateway to College considers a student to have a made a successful transition to com-munity college if that student completes the required Gateway to College courses, remains enrolled for the subsequent semesters, and takes classes at the college level during those semesters (see Table 3.2). Across the three program sites, 89 percent of accepted students

44
passed at least one of their Foundation courses, but only 42 percent passed all of them. At all three program sites the most challenging course proved to be English Language Arts. Fewer than half of all program group members passed their Foundation English courses, although students at the Colorado program site passed at a higher rate than students at the California and Washington program sites.
To the extent that the transition course helped maintain and reinforce connections among peers from the Foundation term, the Colorado program site was in a better position to
Table 3.2 Program Group Progress Through Prescribed Courses Full Program California Colorado Washington Outcome (%) Group Site Site Site
Enrolled in any Foundation courses 94.4
93.3
95.3
95.8
Passed any Foundation courses 89.4
89.9
95.3
83.3
Enrolled in all Foundation courses 76.7
57.3
95.3
95.8
Courses passed, by subject
English language arts 45.6
36.0
74.4
37.5
Math 71.1
60.7
93.0
70.8
College Success Ia 83.9
89.9
76.7
79.2
College Success II 67.8
53.9
79.1
83.3
Career Developmentb 56.9
56.2
NA
58.3
Passed all Foundation courses 42.2
34.8
67.4
33.3
Enrolled in transition coursec 62.6
NA
79.1
47.9
Passed transition coursec 50.5
NA
69.8
33.3
Sample size 180 89 43 48
SOURCE: MDRC calculations using Gateway to College National Network MIS data. NOTES: In graded courses, students who earned a C or better are counted as passing the class. NA = not applicable.
aAt the Washington program site, the first College Success course is a short orientation course
that occurs at the beginning of the term. The second College Success course is a semester-long course.
bThe Colorado program site does not offer a Career Development course. The full program
group mean for this outcome does not include students enrolled at the Colorado program site.
cThe California program site does not offer a transition course. The full program group mean
for this outcome does not include students enrolled at the California program site.

45
ease students’ transition to mainstream community college. At the Colorado program site, 79 percent of the program group enrolled in the transition course, while only 48 percent of students at the Washington program site did. Figures 3.1 through 3.3 show how students at each program site attempted to make the transition to mainstream community college while pursuing their high school diplomas.
In the first semester, there was considerable variation among the program sites in the share of courses passed that were for college credit. This hinged on whether Gateway to College’s prescribed core courses counted for college credit, which was determined in agree-ments between the local K-12 school districts and postsecondary host institutions. Only at the California program site could students earn college credit for some of the prescribed core courses: They could for their Student Success courses, while they earned only high school credit for their ELA and math classes. At the Colorado program site, all prescribed core classes counted as remedial (noncredit) college courses. At the Washington program site, ELA and math counted as remedial college courses, while the Student Success and Career Development courses were for high school credit only. In Figure 3.3, the courses shown under Semester 1 as counting for college credit at the Washington program site were actually taken during the winter term (a common time to take classes because the Washington program site’s host college uses the quarter system).
After the Foundation term, when students earned college credit it was usually not for passing college-level math or English classes, at least not at first. Despite their remedial needs in core subjects (for example, math and English), students at the Colorado and California program sites completed college courses in science, history/social studies, art, physical education, etc. At the Washington program site, many of the for-credit classes were career classes, such as culinary arts or automotive repair (or related prerequisites).
In later semesters, student exposure to college course work was limited by attrition from the program. At the California and Washington program sites, about half of program group members left Gateway to College before Semester 2, and those who remained struggled with their classes. While students at the other two program sites were typically earning college credit for their efforts, students at the California program site were still taking mostly remedial classes or classes for high school credit. It is also worth highlighting that, as indicated in Table 2.1, students at the Washington program site tended to be further from receiving their high school diplomas when they applied to the program than students at the other two program sites.
By Semester 3, 25 percent of students at the California program site, 35 percent of stu-dents at the Colorado program site, and 46 percent of students at the Washington program site were still enrolled in the program (see Figures 3.1 through 3.3). The retention rates at the
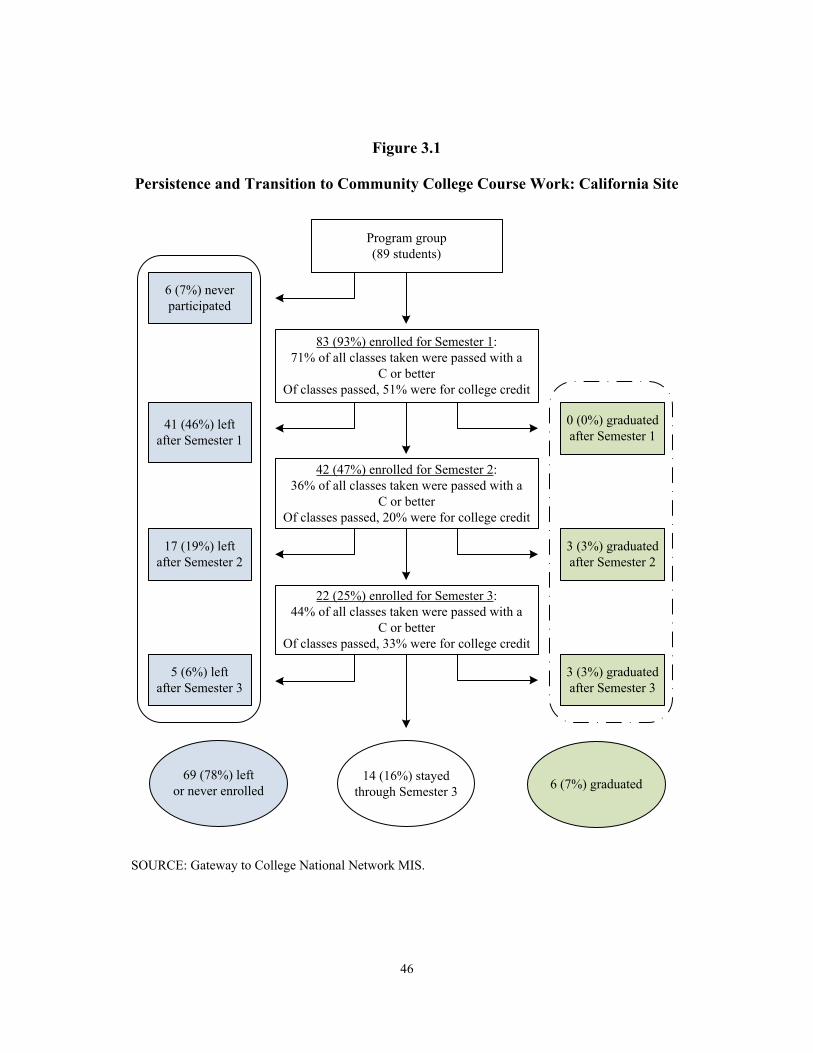
46
Program group(89 students)
83 (93%) enrolled for Semester 1:71% of all classes taken were passed with a
C or betterOf classes passed, 51% were for college credit
42 (47%) enrolled for Semester 2:36% of all classes taken were passed with a
C or betterOf classes passed, 20% were for college credit
22 (25%) enrolled for Semester 3:44% of all classes taken were passed with a
C or betterOf classes passed, 33% were for college credit
6 (7%) never participated
41 (46%) leftafter Semester 1
17 (19%) left after Semester 2
0 (0%) graduated after Semester 1
3 (3%) graduated after Semester 2
3 (3%) graduated after Semester 3
5 (6%) left after Semester 3
69 (78%) left or never enrolled
14 (16%) stayed through Semester 3 6 (7%) graduated
Figure 3.1
Persistence and Transition to Community College Course Work: California Site
SOURCE: Gateway to College National Network MIS.
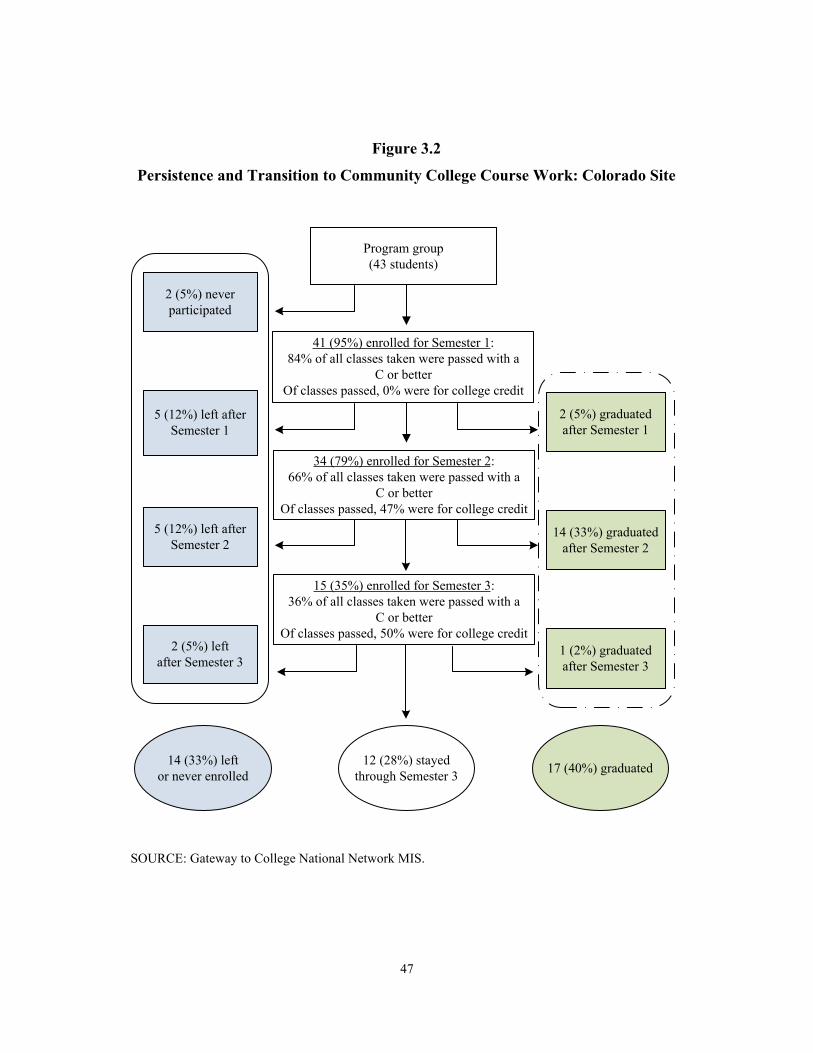
47
Program group(43 students)
41 (95%) enrolled for Semester 1:84% of all classes taken were passed with a
C or betterOf classes passed, 0% were for college credit
34 (79%) enrolled for Semester 2:66% of all classes taken were passed with a
C or betterOf classes passed, 47% were for college credit
15 (35%) enrolled for Semester 3:36% of all classes taken were passed with a
C or betterOf classes passed, 50% were for college credit
2 (5%) never participated
5 (12%) left after Semester 1
5 (12%) left after Semester 2
2 (5%) graduated after Semester 1
14 (33%) graduated after Semester 2
1 (2%) graduated after Semester 3
2 (5%) left after Semester 3
14 (33%) left or never enrolled
12 (28%) stayed through Semester 3 17 (40%) graduated
Figure 3.2
Persistence and Transition to Community College Course Work: Colorado Site
SOURCE: Gateway to College National Network MIS.

48
Program group(48 students)
46 (96%) enrolled for Semester 1:62% of all classes taken were passed with a
C or betterOf classes passed, 16% were for college credit
25 (52%) enrolled for Semester 2:39% of all classes taken were passed with a
C or betterOf classes passed, 77% were for college credit
22 (46%) enrolled for Semester 3:43% of all classes taken were passed with a
C or betterOf classes passed, 87% were for college credit
2 (4%) never participated
21 (44%) left after Semester 1
(3 returned in Semester 3)
6 (13%) left after Semester 2
0 (0%) graduated after Semester 1
0 (0%) graduated after Semester 2
0 (0%) graduated after Semester 3
10 (21%) left after Semester 3
36 (75%) left or never enrolled
12 (25%) stayed through Semester 3 0 (0%) graduated
Figure 3.3
Persistence and Transition to Community College Course Work: Washington Site
SOURCE: Gateway to College National Network MIS.

49
California program site for the previous two semesters had been a little higher, at 39 percent in fall 2012 and 33 percent in spring 2012. At the Colorado program site, the retention rates for the previous two semesters (spring 2012 and fall 2011) were a little lower than those observed in the study, at 28 percent and 31 percent, respectively. Finally, at the Washington program site, retention rates for the previous two semesters were similar to those observed in this study, at 44 percent and 48 percent for spring 2012 and fall 2011, respectively.7 None of these historical retention rates are dramatically different from what was observed in the study samples at the three program sites.
The Colorado program site seems to have been the most successful at producing gradu-ates. (As discussed in Chapter 1, students graduate from Gateway to College when they earn their high school diplomas.) After the first semester, students who remained in the program earned college credit for roughly 50 percent of the classes they passed. Since the prescribed core classes were all noncredit courses at the Colorado program site, the group who graduated from the program after Semester 2 had typically passed two college classes by that point. (They may have remained enrolled at the host community college and made further progress thereafter.) In addition to producing graduates at the highest rate, the Colorado program site was also the most likely to have students persist through Semester 3.
The high school graduation rates through one year for the program sites in the study are in line with their historical two-year cohort graduation rates, as shown in data maintained by the Gateway to College National Network.8 Those historical data show that students starting in the 2011-2012 school year had two-year high school graduation rates of 19 percent in California, 42 percent in Colorado, and 7 percent in Washington. While these rates span a substantial range, they are not outliers: Of the 19 program sites continuously active from 2009 to 2012, 6 had 2011-2012 high school graduation rates above 40 percent and 8 had rates of 15 percent or less. The average graduation rate for all 19 program sites was 30 percent.
Qualitative data from field visits did not suggest that the Washington program site would struggle to help students stay engaged and earn credentials; staff members and students
7In other public reports produced by the Gateway to College National Network, retention rates will gener-
ally appear higher than those reported in this report, in part because of certain important differences in how retention rates are calculated: (1) This implementation study calculates retention from the time of application and assignment into the program, while the National Network calculates retention from the point of meaningful participation in the program, excluding those students who exit the program in the first 30 days. (2) The National Network includes in “retained students” those students who graduated from Gateway to College and those still enrolled in the program, while this study’s calculation of retention rates excludes students who have graduated; graduates are counted and reported separately.
8Graduation rates reported by the National Network exclude students who leave the program in the first 30 days, move to a different school district, transfer to another diploma-completion program, or leave the program for medical reasons or due to death.

50
there seemed quite capable and motivated. However, program staff members in Washington did indicate that they placed greater emphasis on attaining a postsecondary degree than attaining a high school diploma — a strategy influenced by state legislation that allows students to receive a high school diploma automatically once they have earned a postsecondary degree. Further-more, it takes much longer for students to graduate from the Washington program site than the typical student elsewhere: 34 months, more than a year longer than the National Network average (18), almost two years longer than the Colorado program site (12), and perhaps longer than the students would need to graduate from a mainstream high school. With the goal so far in the distance, it is worth considering whether some students might become disillusioned. Students might lose momentum when they are given no short-term milestones (that is, a high school diploma, a certificate, or some other credential) to help them see their progress and encourage them to stick with their education.
Reasons for Leaving Gateway to College
Helping students make the leap from a high school-like environment to a college envi-ronment is a major challenge familiar to all programs that serve students who have dropped out of high school or who are at risk of dropping out. On the 12-month follow-up survey, students who participated in Gateway to College but were no longer enrolled were asked why they had left. Their responses (see Table 3.3) demonstrate the range of challenges Gateway to College participants at these program sites faced.
Gateway to College students at the three program sites in the study who did not enroll in Gateway to College for Semester 3 gave a variety of explanations for leaving. Graduates of the program often said that they had achieved their educational goals. For others, health and family issues sometimes interfered, although these took various forms; for example, several students mentioned conflicts with work or needing to work more hours. As for program-specific obstacles, some Gateway to College participants had trouble meeting the academic demands of the required courses, and were occasionally frustrated with staff or faculty members, or with the program itself. Transportation challenges and infrequent attendance were often given as secondary reasons for leaving the program.
The difficulty in maintaining enrollment across semesters was the biggest challenge to program implementation at the three program sites in the study. Over the past several years, Gateway to College has placed a greater emphasis on improving retention, but solutions continue to be elusive. Improving retention rates for young people at risk of dropping out requires a deep understanding of the challenges they face. A recent report by America’s Promise Alliance found that “disengagement from and re-engagement with school both result from clusters of factors. There is no single reason or factor that drives students to leave school,

51
Table 3.3
Reasons for Leaving Gateway to College
Program Respondents Not Enrolled Outcome (%) in Gateway to College When Surveyed
Primary reason not currently enrolled in Gateway to College Achieved educational goalsa 21.3
Health and family issues 21.3 Conflicts with work or a need to work more hours 17.0 Difficulty meeting academic demands 6.4 Issues with the program, faculty, or learning environment 8.5 Infrequent attendance 4.3 Transportation challenges 8.5 Frequent moving or homelessness 4.3 Problems with peers 2.1 Nobody cared 0.0 Problems with the legal system 0.0 Otherb 6.4
All reasons not currently enrolled in Gateway to Collegec Achieved educational goalsa 23.4
Health and family issues 34.0 Conflicts with work or a need to work more hours 21.3 Difficulty meeting academic demands 17.0 Issues with the program, faculty, or learning environment 21.3 Infrequent attendance 17.0 Transportation challenges 27.7 Frequent moving or homelessness 8.5 Problems with peers 6.4 Nobody cared 0.0 Problems with the legal system 2.1 Otherb 6.4
Sample size 47
SOURCE: MDRC calculations using responses from the Gateway to College 12-month survey. NOTES: Sample does not include those students who never enrolled in Gateway to College. aSome students who stated they "achieved educational goals" earned a high school diploma or General Educational Development (GED) certificate. bMost "other" responses described problems of motivation, lost interest/dissatisfaction, or logistical challenges. cPercentages do not sum to 100 because survey respondents could have selected multiple responses. Similarly, subcategories do not sum to the total.

52
nor is there a uniform profile of students who fail to graduate on time.”9 This does not come as a surprise to those who work closely with at-risk young adults, including Gateway to College staff members, who are keenly aware of the diverse challenges students face and how greatly those needs and challenges can shift from one year to the next.
While the students at the Colorado program site had higher passing rates than students at the California and Washington program sites, this does not necessarily indicate that the program in the Colorado program site is stronger than the programs at the other two program sites. The difference could be the result of differences in the local population or in outreach strategies. Or Gateway to College might be best suited to students who are close to earning their high school diplomas but who have gotten sidetracked or encountered significant obstacles before completion. Students at the Colorado program site tended to be closer to earning their diplomas than students at the California and Washington program sites. While it is difficult to come away with a clear set of program recommendations from the limited data in this study, those data and a review of best practices backed by strong evidence together suggest a few areas Gateway to College might want to explore further, as discussed in the next chapter.
Training and Support All three program sites in the study described participating in a wide range of training activities through the Gateway to College National Network, including seminars, webinars, and the annual Peer Learning Conference. However, there was considerable variation among program sites in the amount and depth of that training. The California program site reported receiving the most robust training and support from the National Network. Its experience included several visits from an instructional coach, collaboration with members of the National Network to analyze the results of a student survey, and several “brown-bag” meetings and conversations that took place during the Peer Learning Conference, which gave staff members an opportunity to share promising practices with colleagues from across the country. Staff members from the California program site also reported participating in supplemental training events tailored to the program site’s needs, including training events related to the Common Core and issues related to college and career readiness.
The Washington program site also reported participating in several multiday training events, brown-bag meetings, and webinars that allowed its staff members to connect with other Gateway to College programs. Staff members also reported that visiting other Gateway to College program sites in their region was a useful training and support opportunity. The Colorado program site reported the least robust training experience. Aside from the Peer
9America’s Promise Alliance (2014).

53
Learning Conference, staff members reported receiving training and support only when they felt it was needed.
This range of reported experiences with training and support suggests that staff mem-bers at the three program sites have varying levels of need for development and training or, perhaps, perceive themselves to have varying levels of need. While the National Network has not historically been in a position to provide a high level of ongoing training and support to program sites that have reached “veteran” status, it may want to consider taking on such a role in the next phase of the program’s evolution.

55
Chapter 4
Summary and Discussion of Implementation Findings
As part of Gateway to College’s continued growth and development, the National Network must place a stronger emphasis on understanding program sites’ ability to implement the core model as intended. While the small number of program sites in this study limits the generalizability of the implementation findings, developing a deeper understanding of Gateway to College’s implementation helps to shed light on whether there is a consistent program model that can be replicated and expanded in different contexts. Any organization interested in expanding a program to a national scale needs to consider that issue. If program sites cannot implement a core model as intended, they could instead end up implementing ad hoc variations out of line with the model’s core values, and those may not necessarily improve student outcomes.
Gateway to College aims to be nimble and responsive to different implementation con-texts and student needs. This is an important strength as the program grows and is implemented in increasingly diverse contexts, with student populations that have varied challenges. However, given the challenges and wide range in retention and transition rates across the three program sites, the program may want to consider balancing this aim with additional guidance and support to ensure high-quality, consistent implementation.
It is not easy to balance flexibility in a program model with concrete guidance to pro-gram sites. It requires a central body like the Gateway to College National Network to work closely with individual programs to understand their varied implementation contexts (that is, their specific relationships with school districts, and the practices and priorities of their postsec-ondary host institutions) and the needs of their students, while at the same time maintaining the integrity of a program model that is unique, that serves the needs of at-risk students, and that can be implemented well on a large scale.
Gateway to College might try to find this balance by engaging in a National Network-wide discussion about the goal and intended outcome of each program component, with the aim of developing a range of examples that articulate which program practices align with the program model’s intentions and which do not. For example, it might be worth asking: Is the absence of a Career Development course acceptable? Is it possible to have too much or too little emphasis on the Career Development component? What pedagogical strategies are considered acceptable in maintaining “a rigorous learning environment” (one of the Principles of Teaching and Learning)? Given the need to preserve local flexibility and responsiveness, the list of program practices across the National Network may encompass a wide range of approaches. Finding the right balance between flexibility and concrete guidance will likely also require ongoing communication between the National Network and individual program sites — an idea

56
that is already in line with Gateway to College’s current thinking regarding future implementa-tion of the model. According to the Gateway to College Annual Report, the National Network is currently exploring a certification system that would define, standardize, and track continuous improvement at Gateway to College program sites.1
The current high-level assessment reveals that most of the model’s five core compo-nents were implemented fairly consistently at the three program sites in this study. However, before any researcher can conduct a more precise analysis of the implementation of these broadly defined components, the National Network will need to develop additional definition and guidance to help program sites make concrete decisions about how they should operate. The implementation findings from the three program sites in this study suggest that the National Network may want to consider creating a regimen of training and support that would give programs across the country a consistent understanding of the model’s components without being too prescriptive. Since local programs already do not take advantage of all the training opportunities currently available to them, it may also be necessary to create better mechanisms for encouraging staff participation.
Doing so — creating a better regimen of training and support while improving the mechanisms that encourage staff participation in that training — could provide two benefits. First, it could provide local program sites, new and old, with concrete guidance for how each component of the model should be implemented. Second, it could provide the National Network and local program sites with a framework that would help identify areas where program sites are out of line with the model and allow the National Network to provide more precise and targeted technical assistance to address those areas.
Regardless, the variations and adaptations that are readily seen at the three program sites in the study reveal a few lessons about the Gateway to College model’s implementation. First, one of the main adaptations that occurred across all three program sites was the addition of a course after the Foundation term. Program sites recognized the need for an additional mechanism to stay in contact with students beyond the Foundation term and all decided that this adaptation to the model would allow them to do so. Gateway to College may want to consider adopting this adaptation more formally at other program sites as well.
The main variations across the three program sites were differences in (1) how the ca-reer development course was implemented, (2) how the learning communities were formed, (3) how instructors viewed their role, (4) what program sites determined project-based learning should look like in the classroom, and (5) at what rates students transitioned to mainstream community college. The first two adaptations were primarily influenced by two factors: the
1Gateway to College National Network (2013).

57
policies and practices of program sites’ postsecondary hosts and program sites’ desire to be responsive to local students’ needs as they saw them (much the same impulse that led them to create post-Foundation term courses). These adaptations do not undermine the program’s theory of change or compromise the fidelity of implementation at the three program sites in the study; rather, they suggest that the Gateway to College model must continue to be nimble to be successfully implemented in varied postsecondary education settings while meeting the needs of diverse student populations. However, Gateway to College may need to consider balancing this flexibility with more concrete parameters for future implementation.
The subsequent two variations related to the Principles of Teaching and Learning (how instructors viewed their role and how project-based learning was interpreted) were primarily influenced by variations in staff attitudes, training shortages, or inconsistent messages regarding how these principles should be implemented. These variations suggest that program sites would benefit from additional or more consistent training and support from the National Network, once the National Network reaches a clear and consistent understanding of how these high-level principles should be put into operation.
The biggest variation in implementation across the three program sites in the study was in retention rates: whether they kept students in the program long enough to transition to mainstream community college. While there are limited clues to the reasons for the program-site-level differences in retention rates, one possibility is that more academic support is needed during the Foundation term in order to get students more consistently to the level they need to be successful. Given that only 42 percent of students passed all of their Foundation term courses, it is possible that Gateway to College is maintaining a level of rigor and high expecta-tions that is important, but that for many students, the curriculum requires a higher level of academic support and intervention than what is currently provided.
Another feature observed in the qualitative data that may be contributing to this varia-tion is that — as previously discussed — at the Washington program site, more emphasis is placed on attaining a postsecondary degree than on earning a high school diploma. Given the long road to a postsecondary degree, it is possible that the decreased emphasis on earning a high school diploma may be depriving students of an opportunity to experience momentum. This may be particularly true for students at the Washington program site, who started the program with far fewer credits than the students at other program sites.
It is important to remember that these observations and possible explanations are based on observations from only three program sites that are not necessarily representative of all the program sites in the National Network. Additional investigation should be conducted to further explore these ideas.
58
For Further Exploration and Consideration: Suggestions for Strengthening the Gateway to College Model Since program sites seem to face challenges with retention and getting students to transition successfully to mainstream community college courses, the Gateway to College National Network may want to consider additional ways of strengthening the model (that is, in addition to providing increased guidance and support for implementation). This section provides a few suggestions, some in response to local adaptations to the model that program sites are already making, others informed by data collected over the course of this study paired with best practic-es from the field. Given the limited number of program sites that participated in this study, these suggestions should be considered areas to explore and launching points for discussion rather than concrete recommendations backed by strong evidence.
1. Consider making more of students’ strong relationships with staff members and peers in the program. Most Gateway to College students reported strong rela-tionships with instructors and Resource Specialists and appreciated being treated with respect and maturity — a clear strength of the three program sites in the study, and one that could be further used to change student trajectories. As noted in a re-cent study of at-risk and dropout young adults, “connectedness to others” is a high priority for young people and “the value placed on these relationships can lead young people away from or toward school, depending on their circumstance.”2 Gateway to College staff members have an opportunity to build on the strong rela-tionships they form with students by continuing to provide them with the individual support, tools, and access to resources that could make the difference between dropping out of the program and continuing on a path to earning their diplomas and postsecondary degrees.
2. Consider bolstering academic support, particularly in the area of English Language Arts. Fewer than half of students pass all of the Foundation courses, suggesting they may need additional academic support or supplemental instruction. At all three program sites, the biggest academic stumbling block for students was the Foundation English Language Arts course.
3. Consider strengthening peer support. The follow-up student survey found that one in four students had not sought out support from peers even once in the previ-ous year. Given that creating a culture of peer support during the Foundation term is an essential part of the program’s theory of change, Gateway to College programs
2America’s Promise Alliance (2014).

59
may want to engage in more activities that promote camaraderie and peer support within the learning communities.
4. Consider extending the learning community experience. One of the biggest ad-aptations seen across all three program sites is the implementation of additional formal support after the Foundation term. The program sites’ across-the-board recognition that this was a need, in combination with the high numbers of students unable to progress from the Foundation term to the transition term, suggests that it may be helpful to extend the learning community experience beyond the first term. This could take the form of adopting into the model the post-Foundation term classes already in place at the three program sites in the study or implementing something more ambitious, such as extending the Foundation experience to a full academic year.
5. Consider implementing a systematic approach to listening to students’ needs. Two of the local adaptations to the model (adaptations in how the career develop-ment curriculum was implemented and how learning communities were formed) were made in direct response to the needs of local student populations. As men-tioned throughout this report, dropout and at-risk young adults, including those served by Gateway to College, have diverse needs and require adult advocates who can help them navigate their particular circumstances. Implementing a systematic approach to listening to students and balancing their self-identified needs with best practices that have a strong evidence base will likely be very important. In a recent study of students in this population, the first and overriding recommendation is to listen to students to better understand the circumstances affecting their lives and ed-ucational experiences.3 As Gateway to College continues to refine its model, it will be helpful to develop systematic practices that allow staff members to keep a close ear to the ground to truly hear students’ real-life circumstances, and to understand what they are struggling with.
3America’s Promise Alliance (2014).

Appendix A
Lessons Learned About Student Outreach

63
MDRC Technical Assistance The program sites that participated in this study received technical assistance from MDRC with the goal of increasing the number of eligible students who applied to the program, in part to help program sites recruit enough students for the study’s sample. The technical assistance consisted of consultant-facilitated SWOT (Strengths, Weaknesses, Opportunities, and Threats) analyses, and monitoring and support provided by MDRC site liaisons. This section shares lessons learned from that work, drawing from technical assistance-related conversations, interviews with members of the Gateway to College National Network, and qualitative data collected during field visits in spring 2013.
The SWOT analysis discussions were led by an MDRC consultant with expertise in or-ganizational management and strategic planning. The discussions ranged from two-hour meetings to half-day retreats. The length of the meetings typically depended on the program staff’s needs and availability. In addition, ongoing monitoring and support were provided primarily by MDRC operations teams. Each program site was assigned a team of one or two MDRC liaisons with whom they had regular phone check-ins.
Lessons Learned from the Student Outreach Process 1. Having a staff member dedicated to student outreach is critical. The status quo
for many programs is that student outreach is the job of several people, yet none of them can dedicate undivided attention to the task. Program staff members are often pulled to attend to day-to-day program operations; student outreach is often lower on the priority list, let alone making planned and thoughtful decisions about out-reach that are part of a larger strategy. As one staff member said, internal manage-ment of the program and developing outreach partnership strategies are “two totally different things. You cannot have a hundred students that you’re responsible for pushing through and making successful, but then also do this other enormous job which involves getting out of the building away from your students to find other ones.” To address this problem, two program sites made staffing changes. One hired a full-time staff person dedicated to outreach; another shifted leadership roles so that one person managed internal operations, freeing the other to focus on exter-nal partnerships and outreach. These staffing changes allowed the outreach-dedicated staff members to focus on identifying allies and partnerships, develop strategies for active outreach, and foster deeper relationships with referring teachers and counselors.

64
2. Building relationships directly with school staff members — especially teach-ers and counselors — is just as important as getting district support. In the Gateway to College model, school districts are program sites’ primary partners. Within districts, school-level staff members — that is, teachers and counselors at local high schools — know their students personally and are in the best position to identify students who don’t just meet the basic eligibility criteria but are also a good fit for the program. Recognizing this, program sites began to use various new strat-egies to foster and maintain relationships with teachers and counselors. Simply reaching out to individual teachers helps. Gateway to College staff members who focus on outreach have also shared that giving teachers and counselors updates on the students they have referred helps to strengthen relationships, as does communi-cating when a student is not a good fit. Teachers and counselors want to know that they are sending their students to the right place; maintaining regular communica-tion facilitates that.
3. Incorporating student voices in outreach can help foster enthusiasm among potential applicants. In interviews, students noted that hearing about previous stu-dents’ experiences helped them see themselves in the program. The California pro-gram site, for example, began incorporating students into information sessions and developing materials that featured student voices.
4. It is important to find the right balance between removing unnecessary barri-ers and “weeding out” students who are not a good fit. Many students meet the basic eligibility requirements of Gateway to College, but not all of them would be a good fit for the program. Programs try to address this by creating a rigorous appli-cation process that “weeds out” students who are not ready to commit to a rigorous program or students who do not have the infrastructure necessary to be successful (for example, those who lack regular transportation or child care). However, in some cases, the application process may be raising unnecessary barriers that keep students from the program who might be a good fit (for example, a requirement to return three days in one week for various assessments). One program site addressed this by reducing the number of days that students had to return from three days to two days. This removed an unnecessary barrier while maintaining a process that could still weed out students who were not yet ready, willing, or able to commit to the program.
5. Timing plays a large role in the outreach process. Each program site is keenly aware of the challenges arising from the yearly ebbs and flows of the student out-reach process. For example, it is more difficult to recruit students in the summer. Students may want to enroll midway through the semester, when enrollment is not
65
open. A program site’s program calendar might not align with the calendar of one or more of its feeder districts. Few of the program sites were able to develop solu-tions that addressed these timing challenges. A few innovations did emerge: Some program sites developed additional entry points to the program (for example, one program site created a course focused on college resources that took place before the regular curriculum began) so that prospective students did not lose interest, and program sites also aligned themselves with partner districts’ school calendars to the extent that they could.
6. It is critical to include the voices of essential stakeholders and staff members when developing long-term plans for outreach and recruitment. Several staff members noted that the consultant-led process was helpful because it was one of the only times they had been able to get together as a team to talk specifically about this issue. Doing so helped to foster enthusiasm, identify potential pitfalls, and define existing best practices that should be maintained. Upon reflection, one program site also noted that it would have been helpful to broaden the conversation beyond Gateway to College staff members — for example, by including a school district partner in the conversation.
These lessons can be applied to many program sites in the Gateway to College National Network, and to other programs that serve a similar population. But each program site must still develop its own, customized plan for outreach. This is particularly the case for programs like Gateway to College where program sites are strongly influenced by their local contexts, the varying needs and challenges of their target student populations, and their relationships with feeder schools and districts.


Appendix B
Data-Collection Activities


69
Quantitative Data Several data sources provided quantitative context to support the implementation research:
• Application data. The three program sites in the study provided information on the number of students who made it through various stages of the applica-tion process during the study enrollment period. One program site provided these data in aggregate; the others provided deidentified student-level data.
• Baseline data. Students completed a baseline information form when they enrolled in the study. That form asked students about their personal and fami-ly backgrounds, as well as their academic history and most recent enrollment status. For context, the Gateway to College National Network also provided aggregate data on some of these demographic characteristics for all students enrolled across the network in the 2012-2013 school year.
• Survey data. Abt SRBI administered a survey to all students 12 months af-ter random assignment. The survey included questions about students’ edu-cational experiences, including the educational programs in which they had enrolled during the 12 months since random assignment and, for students in the program group, their reasons for not being enrolled in Gateway to Col-lege (if they were not). Due to a low response rate and a large difference between the response rates of the program and control groups (62 percent for the program group and 47 percent for the control group), this study drew upon survey results only for information on the educational options available to students outside of Gateway to College and on students’ rea-sons for leaving the program.
• Management information system data. The Gateway to College National Network provided data on program group students’ academic performance while they were enrolled in Gateway to College. These data were analyzed for the three academic semesters following random assignment. The National Network and leaders at the three program sites in the study provided addi-tional context regarding specific courses, which helped in the summary and analysis of these data.
All data were processed and analyzed by MDRC data analysts using statistical pro-gramming software. A senior data analyst reviewed all programs, outputs, and results to ensure their quality.

70
Qualitative Data As noted in the main report, interviews with program staff members and other key stakeholders were the primary data source for the implementation analysis. All interviews were conducted by the lead implementation researcher (the lead author of this report) along with a research assis-tant. In-person site visits took place in late spring/early summer 2013. Site visits included interviews with program staff members, focus groups with program participants, and classroom observations. All interviews and focus groups were recorded and transcribed. Transcripts and classroom observation summaries were analyzed for major themes and commonalities, and the results were synthesized into program-site-specific summaries.1 Quotations were used through-out the report to support qualitative findings.
1Given the small number of participating program sites, it was not necessary to use a qualitative analysis
software package. All analysis was done manually.
71
References
Alliance for Excellent Education. 2008. The High Cost of High School Dropouts: What the Nation Pays for Inadequate High Schools. Washington, DC: Alliance for Excellent Education.
America’s Promise Alliance. 2014. Don’t Call Them Dropouts: Understanding the Experiences of Young People Who Leave High School Before Graduation. Medford, MA: Tufts University.
Bailey, Thomas, and Melinda Mechur Karp. 2003. Promoting College Access and Success: A Review Of Credit-Based Transition Programs. Washington, DC: Office of Vocational and Adult Education, U.S. Department of Education.
Berman, Paul, and Milbrey Wallin McLaughlin. 1976. “Implementation of Educational Innovation.” The Educational Forum 40: 345-370.
Bloom, Dan, Saskia Levy Thompson, and Robert Ivry. 2010. Building A Learning Agenda Around Disconnected Youth. New York: MDRC.
Bridgeland, John M., John J. Dilulio, Jr., and Karen Burke Morison. 2006. The Silent Epidemic: Perspectives of High School Dropouts. Washington, DC: Civic Enterprises, LLC.
California Community Colleges’ Success Network. 2015. “A Statewide Initiative to Increase Student Completion Rates.” Website: http://3csn.org/completion-initiative.
California Department of Education. 2013. “DataQuest.” Website: http://dq.cde.ca.gov/dataquest.
Carnevale, Anthony P., Nicole Smith, and Jeff Strohl. 2013. Recovery: Projections of Jobs and Education Requirements Through 2020. Washington, DC: Georgetown University.
Coleman, James S., Ernest Q. Campbell, Carol J. Hobson, James McPartland, Alexander M. Mood, Frederic D. Weinfeld, and Robert L. York. 1966. Equality of Educational Opportunity. Washington, DC: Government Printing Office.
Colorado Department of Education. 2015. “SchoolView: Data and Accountability.” Website: www.cde.state.co.us/schoolview.
Davis, William E., Lieve Brutsaert-Durant, and Roxanne Lee. 2002. Alternative Education Programs in Maine: A Further Investigation of Their Impact on Serving Students Considered to be “At-Risk” and Students with Disabilities. Orono, ME: Institute for the Study of Students at Risk, College of Education and Human Development, University of Maine.
Duckworth, Angela L., Christopher Peterson, Michael D. Matthews, and Dennis R. Kelly. 2007. “Grit: Perseverance and Passion for Long-Term Goals.” Journal of Personality and Social Psychology 92, 6: 1,087-1,101.
72
Dynarski, Mark, Linda Clarke, Brian Cobb, Jeremy Finn, Russell Rumberger, and Jay Smink. 2008. Dropout Prevention: A Practice Guide (NCEE 2008-4025). Washington, DC: National Center for Education Evaluation and Regional Assistance, Institute of Education Sciences, U.S. Department of Education.
Garvey, John. 2011. From GED to College Degree: Creating Pathways to Postsecondary Success for High School Dropouts. Boston: Jobs for the Future.
Gateway to College National Network. 2012. “Gateway to College Locations.” Website: www.gatewaytocollege.org/partner_programs.asp.
Gateway to College National Network. 2013. 10 Years of Impact: 2013 Annual Report. Portland, OR: Gateway to College.
Grossman, Jean Baldwin, and Eileen M. Garry. 1997. “Mentoring: A Proven Delinquency Prevention Strategy.” Juvenile Justice Bulletin (April). Washington, DC: U.S. Department of Justice, Office of Juvenile Justice and Delinquency Prevention.
Ingels, Steven J., and Ben Dalton. 2013. High School Longitudinal Study of 2009 (HSLS:09) First Follow-Up: A First Look at Fall 2009 Ninth-Graders in 2012 (NCES 2014-360). Washington, DC: National Center for Education Statistics.
Kaufman, Phillip, Denise Bradbury, and Jeffrey Owings. 1992. Characteristics of At-Risk Students in NELS: 88: National Education Longitudinal Study of 1988 (NCES 92-042). Washington, DC: National Center for Education Statistics.
Lange, Cheryl M., and Sandra J. Sletten. 2002. Alternative Education: A Brief History and Research Synthesis. Alexandria, VA: National Association of State Directors of Special Education.
Lords, Erik. 2000. “New Efforts at Community Colleges Focus on Underachieving Teens.” The Chronicle of Higher Education 46, 43: A45-A46.
MDRC. 2013. “Building Better Programs for Disconnected Youth.” New York: MDRC.
Office of the Superintendent of Public Instruction, State of Washington. “K-12 Data and Reports.” Website: http://data.k12.wa.us/PublicDWP/Web/WashingtonWeb/Home.aspx. Accessed on May 29, 2015.
Rider, Steven, Katie Winters, and Terra Neilson. 2012. Gateway to College: Evaluation of Post-Secondary Attainment Graduates. Portland, OR: Pacific Research and Evaluation LLC.
Rouse, Cecilia. 2005. “Labor Market Consequences of an Inadequate Education.” Paper prepared for the Equity Symposium on “The Social Costs of Inadequate Education,” October 24, 2005, New York.
Ruzzi, Betsy, and Jacqueline Krameer. 2006. Academic Programs in Alternative Education: An Overview. Washington, DC: National Center on Education and the Economy.

73
Sewell, William H., Archibald O. Haller, and George W. Ohlendorf. 1970. “The Educational and Early Occupational Attainment Process: Replication and Revision.” American Sociological Review 35: 1,017-1,027.
Sewell, William H., Archibald O. Haller, and Alejandro Portes. 1969. “The Educational and Early Occupational Attainment Process.” American Sociological Review 34: 82-92.
Sipe, Cynthia, L. 1996. Mentoring: A Synthesis of P/PV’s Research: 1988-1995. Philadelphia: Public/Private Ventures.
U.S. Department of Education. 2008. High School Graduation Rate: Non-Regulatory Guidance. Washington, DC: U.S. Department of Education.
Visher, Mary, Michael J. Weiss, Evan Weissman, Timothy Rudd, and Heather Wathington. 2012. The Effects of Learning Communities for Students in Developmental Education. New York: MDRC.
Wilson, Sandra Jo, Emily E. Tanner-Smith, Mark W. Lipsey, Katarzyna Steinka-Fry, and Jan Morrison. 2011. Dropout Prevention and Intervention Programs: Effects on School Completion and Dropout Among School-Aged Children and Youth. Campbell Systematic Reviews, available online at: www.campbellcollaboration.org/lib/project/158.
Wittenstein, Rebecca. 2010. “Progress on Graduation Rate Stalls; 1.3 Million Students Fail to Earn Diplomas.” News release, Editorial Projects in Education Research Center.

About MDRC
MDRC is a nonprofit, nonpartisan social and education policy research organization dedicated to learning what works to improve the well-being of low-income people. Through its research and the active communication of its findings, MDRC seeks to enhance the effectiveness of so-cial and education policies and programs.
Founded in 1974 and located in New York City and Oakland, California, MDRC is best known for mounting rigorous, large-scale, real-world tests of new and existing policies and programs. Its projects are a mix of demonstrations (field tests of promising new program approaches) and evaluations of ongoing government and community initiatives. MDRC’s staff bring an unusual combination of research and organizational experience to their work, providing expertise on the latest in qualitative and quantitative methods and on program design, development, implementa-tion, and management. MDRC seeks to learn not just whether a program is effective but also how and why the program’s effects occur. In addition, it tries to place each project’s findings in the broader context of related research — in order to build knowledge about what works across the social and education policy fields. MDRC’s findings, lessons, and best practices are proac-tively shared with a broad audience in the policy and practitioner community as well as with the general public and the media.
Over the years, MDRC has brought its unique approach to an ever-growing range of policy are-as and target populations. Once known primarily for evaluations of state welfare-to-work pro-grams, today MDRC is also studying public school reforms, employment programs for ex-offenders and people with disabilities, and programs to help low-income students succeed in college. MDRC’s projects are organized into five areas:
• Promoting Family Well-Being and Children’s Development
• Improving Public Education
• Raising Academic Achievement and Persistence in College
• Supporting Low-Wage Workers and Communities
• Overcoming Barriers to Employment
Working in almost every state, all of the nation’s largest cities, and Canada and the United Kingdom, MDRC conducts its projects in partnership with national, state, and local govern-ments, public school systems, community organizations, and numerous private philanthropies.