Gastrointestinal/liver-targeted TLR7 agonist for treatment ...
1
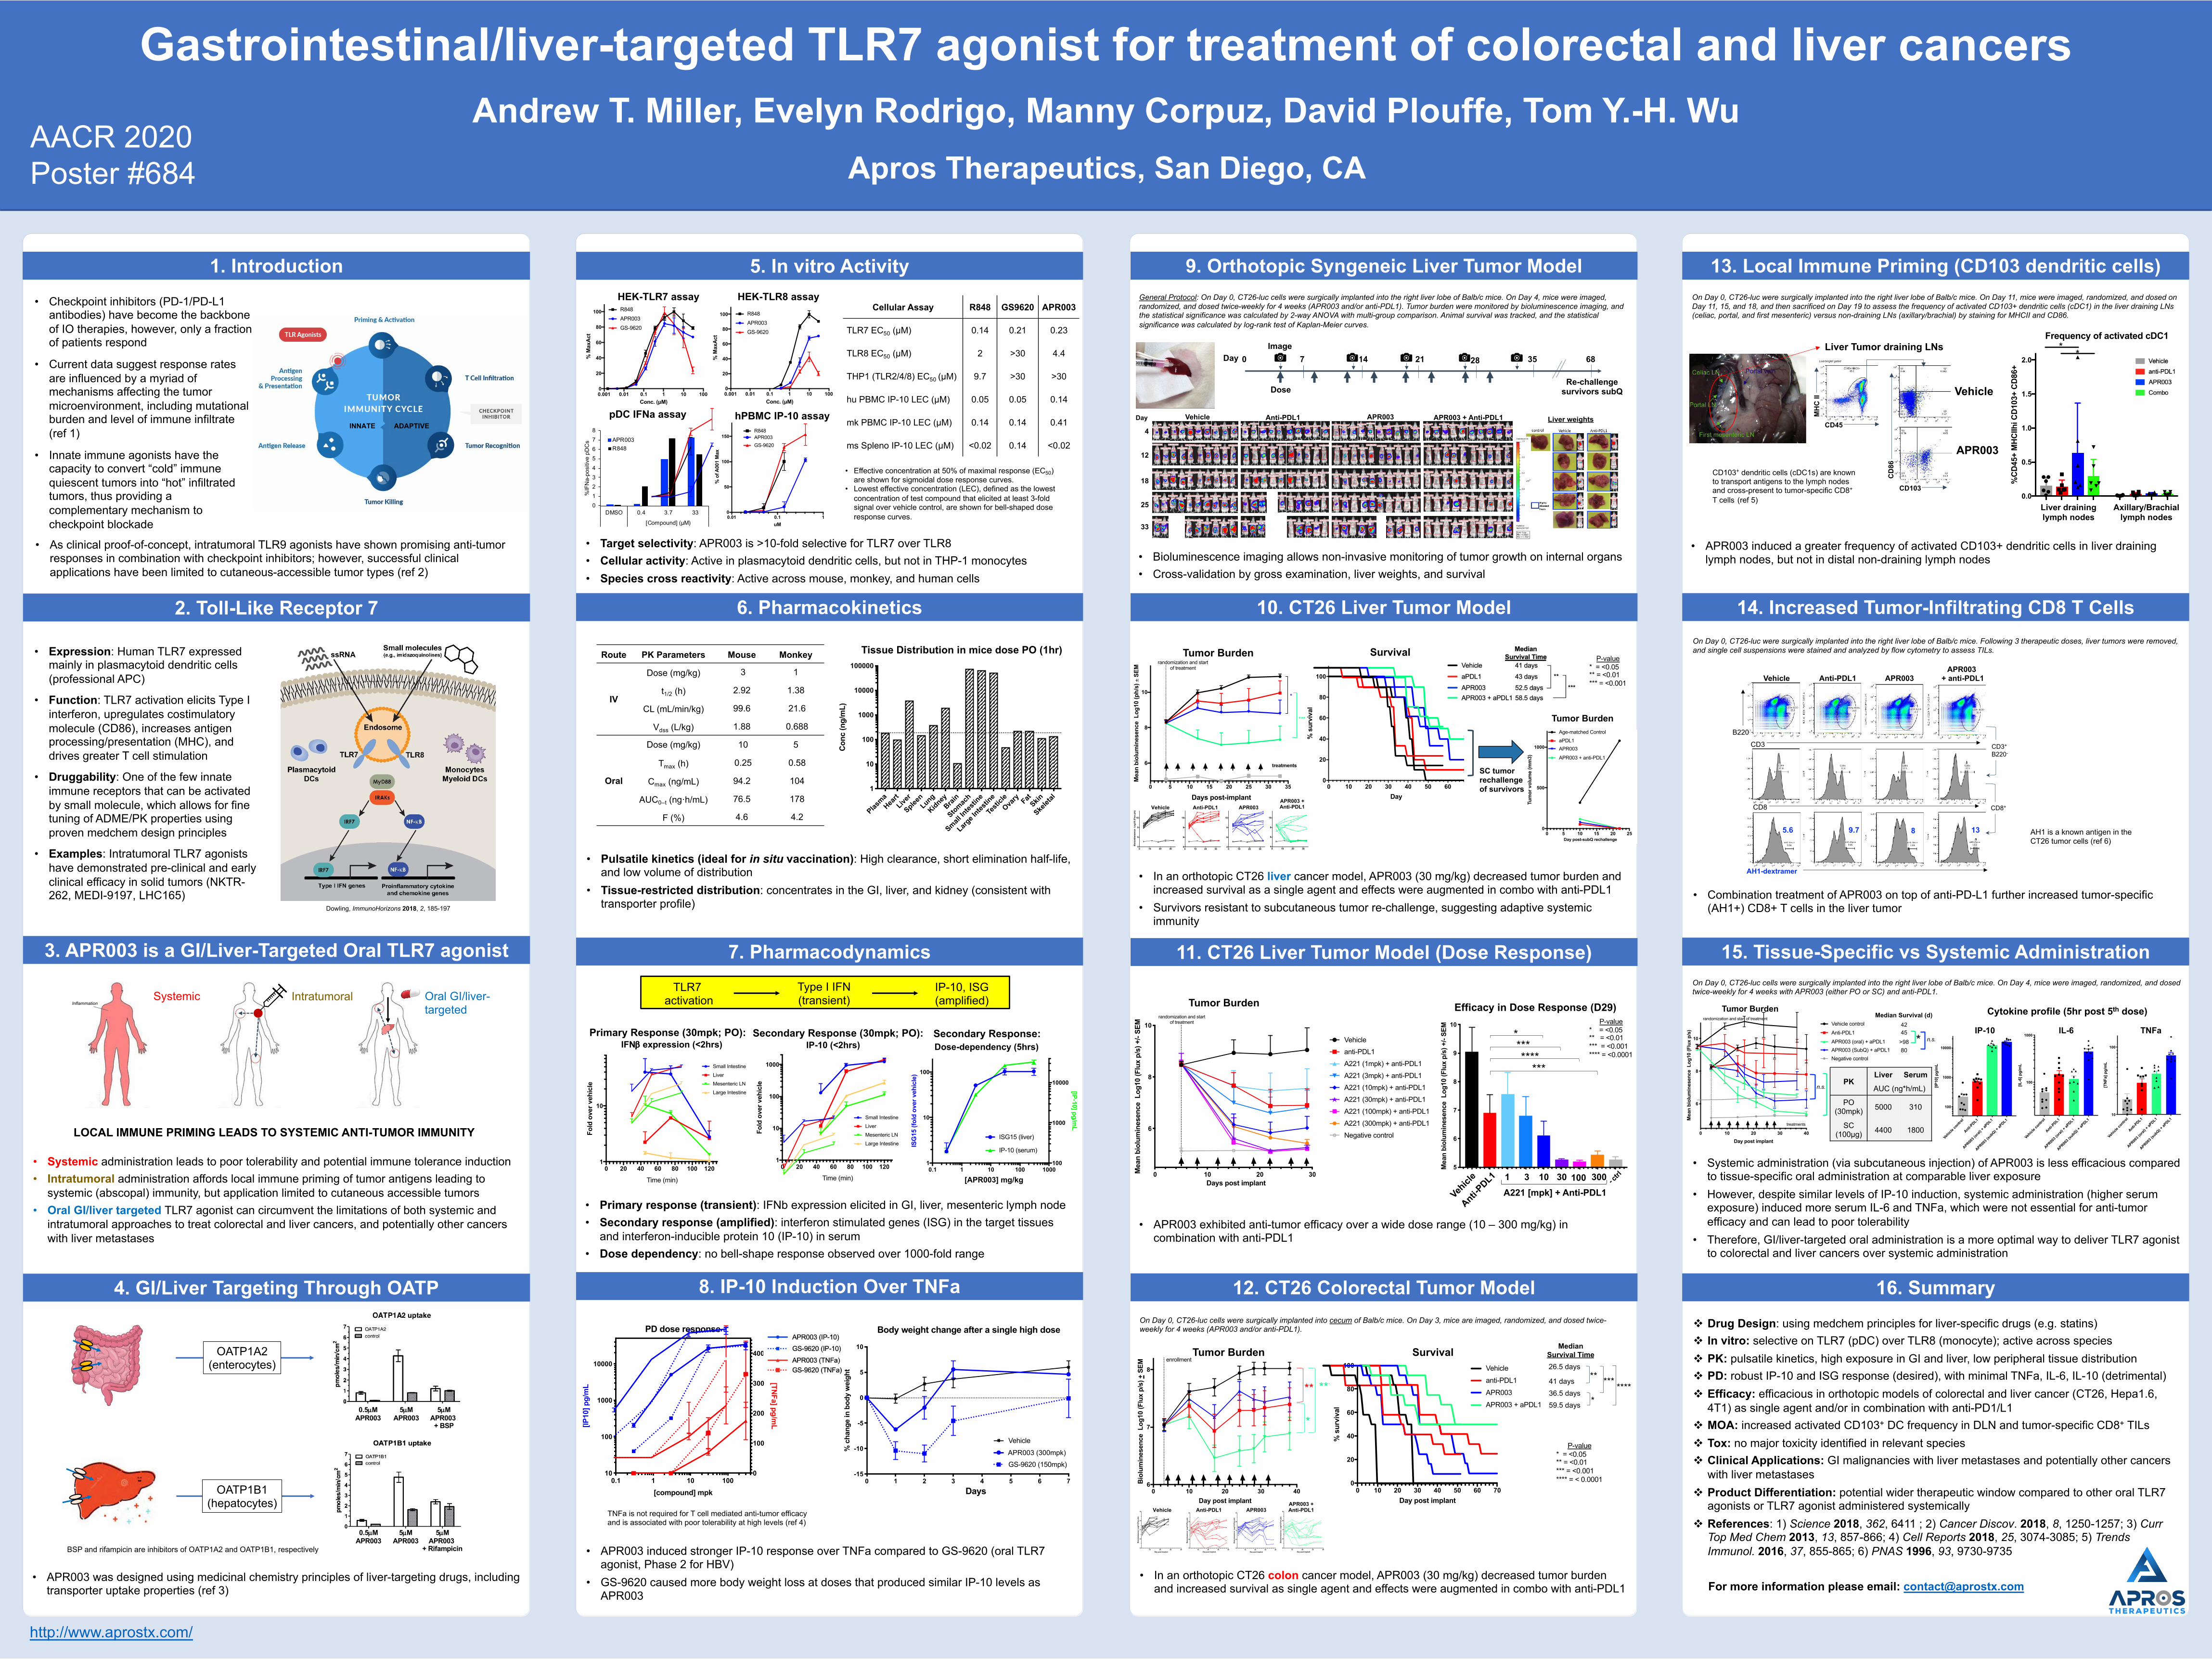
v Drug Design: using medchem principles for liver-specific drugs (e.g. statins) v In vitro: selective on TLR7 (pDC) over TLR8 (monocyte); active across species v PK: pulsatile kinetics, high exposure in GI and liver, low peripheral tissue distribution v PD: robust IP-10 and ISG response (desired), with minimal TNFa, IL-6, IL-10 (detrimental) v Efficacy: efficacious in orthotopic models of colorectal and liver cancer (CT26, Hepa1.6, 4T1) as single agent and/or in combination with anti-PD1/L1 v MOA: increased activated CD103 + DC frequency in DLN and tumor-specific CD8 + TILs v Tox: no major toxicity identified in relevant species v Clinical Applications: GI malignancies with liver metastases and potentially other cancers with liver metastases v Product Differentiation: potential wider therapeutic window compared to other oral TLR7 agonists or TLR7 agonist administered systemically v References: 1) Science 2018, 362, 6411 ; 2) Cancer Discov. 2018, 8, 1250-1257; 3) Curr Top Med Chem 2013, 13, 857-866; 4) Cell Reports 2018, 25, 3074-3085; 5) Trends Immunol. 2016, 37, 855-865; 6) PNAS 1996, 93, 9730-9735 For more information please email: [email protected] 0 1 2 3 4 5 6 7 8 DMSO 0.4 3.7 33 [Compound] (µM) %IFNa-positive pDCs APR003 R848 Apros Therapeutics, San Diego, CA Andrew T. Miller, Evelyn Rodrigo, Manny Corpuz, David Plouffe, Tom Y.-H. Wu Gastrointestinal/liver-targeted TLR7 agonist for treatment of colorectal and liver cancers 1. Introduction • Checkpoint inhibitors (PD-1/PD-L1 antibodies) have become the backbone of IO therapies, however, only a fraction of patients respond • Current data suggest response rates are influenced by a myriad of mechanisms affecting the tumor microenvironment, including mutational burden and level of immune infiltrate (ref 1) • Innate immune agonists have the capacity to convert “cold” immune quiescent tumors into “hot” infiltrated tumors, thus providing a complementary mechanism to checkpoint blockade 2. Toll-Like Receptor 7 • Expression: Human TLR7 expressed mainly in plasmacytoid dendritic cells (professional APC) • Function: TLR7 activation elicits Type I interferon, upregulates costimulatory molecule (CD86), increases antigen processing/presentation (MHC), and drives greater T cell stimulation • Druggability: One of the few innate immune receptors that can be activated by small molecule, which allows for fine tuning of ADME/PK properties using proven medchem design principles • Examples: Intratumoral TLR7 agonists have demonstrated pre-clinical and early clinical efficacy in solid tumors (NKTR- 262, MEDI-9197, LHC165) 3. APR003 is a GI/Liver-Targeted Oral TLR7 agonist • Systemic administration leads to poor tolerability and potential immune tolerance induction • Intratumoral administration affords local immune priming of tumor antigens leading to systemic (abscopal) immunity, but application limited to cutaneous accessible tumors • Oral GI/liver targeted TLR7 agonist can circumvent the limitations of both systemic and intratumoral approaches to treat colorectal and liver cancers, and potentially other cancers with liver metastases Inflammation Systemic Intratumoral Oral GI/liver- targeted Dowling, ImmunoHorizons 2018, 2, 185-197 INNATE ADAPTIVE 4. GI/Liver Targeting Through OATP 0.5μM APR003 5μM APR003 5μM APR003 + BSP 0.5μM APR003 5μM APR003 5μM APR003 + Rifampicin OATP1A2 (enterocytes) OATP1B1 (hepatocytes) 5. In vitro Activity HEK-TLR7 assay 0.001 0.01 0.1 1 10 100 0 20 40 60 80 100 Conc. (μM) % MaxAct R848 APR003 GS-9620 0.001 0.01 0.1 1 10 100 0 20 40 60 80 100 Conc. (μM) % MaxAct APR003 GS-9620 R848 HEK-TLR8 assay pDC IFNa assay hPBMC IP-10 assay 0.01 0.1 1 0 50 100 150 uM % of A001 Max APR003 R848 GS-9620 • Effective concentration at 50% of maximal response (EC 50 ) are shown for sigmoidal dose response curves. • Lowest effective concentration (LEC), defined as the lowest concentration of test compound that elicited at least 3-fold signal over vehicle control, are shown for bell-shaped dose response curves. 6. Pharmacokinetics 7. Pharmacodynamics 0 20 40 60 80 100 120 1 10 Fold over vehicle Time (min) Primary Response (30mpk; PO): IFNb expression (<2hrs) Small Intestine Mesenteric LN Liver Large Intestine Secondary Response (30mpk; PO): 0 20 40 60 80 100 120 1 10 100 1000 Fold over vehicle Time (min) IP-10 (<2hrs) Small Intestine Mesenteric LN Liver Large Intestine 0.1 1 10 100 1000 1 10 100 100 1000 10000 ISG15 (fold over vehicle) ISG15 (liver) IP-10 (serum) [IP-10] pg/mL Dose-dependency (5hrs) Secondary Response: [APR003] mg/kg Tissue Distribution in mice dose PO (1hr) Plasma Heart Liver Spleen Lung Kidney Brain Stomach Small Intestine Large Intestine Testicle Ovary Fat Skin Skeletal 1 10 100 1000 10000 100000 Conc (ng/mL) • Pulsatile kinetics (ideal for in situ vaccination): High clearance, short elimination half-life, and low volume of distribution • Tissue-restricted distribution: concentrates in the GI, liver, and kidney (consistent with transporter profile) • Primary response (transient): IFNb expression elicited in GI, liver, mesenteric lymph node • Secondary response (amplified): interferon stimulated genes (ISG) in the target tissues and interferon-inducible protein 10 (IP-10) in serum • Dose dependency: no bell-shape response observed over 1000-fold range 8. IP-10 Induction Over TNFa 0.1 1 10 100 10 100 1000 10000 0 100 200 300 400 [compound] mpk [IP10] pg/mL [TNFa] pg/mL PD dose response Body weight change after a single high dose 0 1 2 3 4 5 6 7 -15 -10 -5 0 5 10 % change in body weight Vehicle GS-9620 (150mpk) Days APR003 (300mpk) GS-9620 (IP-10) APR003 (TNFa) GS-9620 (TNFa) APR003 (IP-10) • APR003 induced stronger IP-10 response over TNFa compared to GS-9620 (oral TLR7 agonist, Phase 2 for HBV) • GS-9620 caused more body weight loss at doses that produced similar IP-10 levels as APR003 9. Orthotopic Syngeneic Liver Tumor Model 10. CT26 Liver Tumor Model 11. CT26 Liver Tumor Model (Dose Response) 12. CT26 Colorectal Tumor Model 13. Local Immune Priming (CD103 dendritic cells) 14. Increased Tumor-Infiltrating CD8 T Cells 15. Tissue-Specific vs Systemic Administration 16. Summary • Bioluminescence imaging allows non-invasive monitoring of tumor growth on internal organs • Cross-validation by gross examination, liver weights, and survival 0 10 20 30 4 6 8 10 Bioluminesence Log10 (Flux p/s) 0 10 20 30 4 6 8 10 0 10 20 30 4 6 8 10 0 10 20 30 4 6 8 10 Vehicle Anti-PDL1 APR003 0 10 20 30 40 50 60 0 20 40 60 80 100 Day % survival 0 5 10 15 20 25 30 35 6 8 10 Mean bioluminesence Log10 (ph/s) ± SEM * Days post-implant *** randomization and start of treatment treatments Tumor Burden Survival SC tumor rechallenge of survivors APR003 + Anti-PDL1 Vehicle aPDL1 APR003 APR003 + aPDL1 Median Survival Time 41 days 43 days 52.5 days 58.5 days ** *** Tumor Burden 0 5 10 15 20 25 0 500 1000 Tumor volume (mm3) Age-matched Control aPDL1 APR003 APR003 + anti-PDL1 Day post-subQ rechallenge P-value * = <0.05 ** = <0.01 *** = <0.001 • In an orthotopic CT26 liver cancer model, APR003 (30 mg/kg) decreased tumor burden and increased survival as a single agent and effects were augmented in combo with anti-PDL1 • Survivors resistant to subcutaneous tumor re-challenge, suggesting adaptive systemic immunity Re-challenge survivors subQ 0 7 14 21 35 68 Day Dose 12 18 25 33 Vehicle APR003 APR003 + Anti-PDL1 Day Liver weights 28 Anti-PDL1 4 Image • In an orthotopic CT26 colon cancer model, APR003 (30 mg/kg) decreased tumor burden and increased survival as single agent and effects were augmented in combo with anti-PDL1 • APR003 induced a greater frequency of activated CD103+ dendritic cells in liver draining lymph nodes, but not in distal non-draining lymph nodes CD8 B220 CD3 5.6 9.7 8 13 CD8 + CD3 + B220 - AH1-dextramer Vehicle Anti-PDL1 APR003 APR003 + anti-PDL1 • Combination treatment of APR003 on top of anti-PD-L1 further increased tumor-specific (AH1+) CD8+ T cells in the liver tumor * n.s. Tumor Burden 0 10 20 30 40 6 8 10 Day post implant Mean bioluminesence Log10 (Flux p/s) treatments randomization and start of treatment Vehicle control Anti-PDL1 APR003 (SubQ) + aPDL1 APR003 (oral) + aPDL1 Negative control Median Survival (d) 42 45 >98 * n.s. 80 Vehicle control Anti-PDL1 APR003 (oral) + aPDL1 APR003 (subQ) + aPDL1 100 1000 10000 [IP10] pg/mL IP-10 Vehicle control Anti-PDL1 APR003 (oral) + aPDL1 APR003 (subQ) + aPDL1 100 1000 [IL-6] pg/mL IL-6 Vehicle control Anti-PDL1 APR003 (oral) + aPDL1 APR003 (subQ) + aPDL1 10 100 [TNFa] pg/mL TNFa Cytokine profile (5hr post 5 th dose) • Systemic administration (via subcutaneous injection) of APR003 is less efficacious compared to tissue-specific oral administration at comparable liver exposure • However, despite similar levels of IP-10 induction, systemic administration (higher serum exposure) induced more serum IL-6 and TNFa, which were not essential for anti-tumor efficacy and can lead to poor tolerability • Therefore, GI/liver-targeted oral administration is a more optimal way to deliver TLR7 agonist to colorectal and liver cancers over systemic administration 10 20 30 40 5 6 7 8 9 Day post implant Bioluminesence Log10 (Flux p/s) 10 20 30 40 5 6 7 8 9 Day post implant Bioluminesence Log10 (Flux p/s) 10 20 30 40 5 6 7 8 9 Day post implant Bioluminesence Log10 (Flux p/s) 10 20 30 40 5 6 7 8 9 Day post implant Bioluminesence Log10 (Flux p/s) 0 10 20 30 40 6 7 8 Day post implant Bioluminesence Log10 (Flux p/s) + SEM enrollment Tumor Burden APR003 + Anti-PDL1 Vehicle Anti-PDL1 APR003 ** * **** 0 10 20 30 40 50 60 70 0 20 40 60 80 100 Day post implant % survival Survival Vehicle anti-PDL1 APR003 APR003 + aPDL1 Median Survival Time 26.5 days 41 days 36.5 days 59.5 days * **** *** ** P-value * = <0.05 ** = <0.01 *** = <0.001 **** = < 0.0001 * *** **** *** Efficacy in Dose Response (D29) 0 10 20 30 6 8 10 Mean bioluminesence Log10 (Flux p/s) +/- SEM Vehicle anti-PDL1 A221 (1mpk) + anti-PDL1 A221 (3mpk) + anti-PDL1 A221 (10mpk) + anti-PDL1 A221 (30mpk) + anti-PDL1 A221 (100mpk) + anti-PDL1 A221 (300mpk) + anti-PDL1 Negative control randomization and start of treatment Days post implant Tumor Burden Vehicle Anti - PDL1 1 3 10 30 100 300 A221 [mpk] + Anti-PDL1 - ctrl e 1 1 1 1 1 1 1 l 5 6 7 8 9 10 Mean bioluminesence Log10 (Flux p/s) +/- SEM P-value * = <0.05 ** = <0.01 *** = <0.001 **** = <0.0001 • APR003 exhibited anti-tumor efficacy over a wide dose range (10 – 300 mg/kg) in combination with anti-PDL1 BSP and rifampicin are inhibitors of OATP1A2 and OATP1B1, respectively Cellular Assay R848 GS9620 APR003 TLR7 EC 50 (µM) 0.14 0.21 0.23 TLR8 EC 50 (µM) 2 >30 4.4 THP1 (TLR2/4/8) EC 50 (µM) 9.7 >30 >30 hu PBMC IP-10 LEC (µM) 0.05 0.05 0.14 mk PBMC IP-10 LEC (µM) 0.14 0.14 0.41 ms Spleno IP-10 LEC (µM) <0.02 0.14 <0.02 AACR 2020 Poster #684 • Target selectivity: APR003 is >10-fold selective for TLR7 over TLR8 • Cellular activity: Active in plasmacytoid dendritic cells, but not in THP-1 monocytes • Species cross reactivity: Active across mouse, monkey, and human cells TLR7 activation Type I IFN (transient) IP-10, ISG (amplified) General Protocol : On Day 0, CT26-luc cells were surgically implanted into the right liver lobe of Balb/c mice. On Day 4, mice were imaged, randomized, and dosed twice-weekly for 4 weeks (APR003 and/or anti-PDL1). Tumor burden were monitored by bioluminescence imaging, and the statistical significance was calculated by 2-way ANOVA with multi-group comparison. Animal survival was tracked, and the statistical significance was calculated by log-rank test of Kaplan-Meier curves. On Day 0, CT26-luc were surgically implanted into the right liver lobe of Balb/c mice. On Day 11, mice were imaged, randomized, and dosed on Day 11, 15, and 18, and then sacrificed on Day 19 to assess the frequency of activated CD103+ dendritic cells (cDC1) in the liver draining LNs (celiac, portal, and first mesenteric) versus non-draining LNs (axillary/brachial) by staining for MHCII and CD86. Liver draining lymph nodes Axillary/Brachial lymph nodes CD45 MHC II Live/singlet gated CD103 CD86 Liver Tumor draining LNs Vehicle APR003 e 1 1 o e 1 1 o 0.0 0.5 1.0 1.5 2.0 %CD45+ MHCIIhi CD103+ CD86+ Frequency of activated cDC1 * * CD103 + dendritic cells (cDC1s) are known to transport antigens to the lymph nodes and cross-present to tumor-specific CD8 + T cells (ref 5) On Day 0, CT26-luc were surgically implanted into the right liver lobe of Balb/c mice. Following 3 therapeutic doses, liver tumors were removed, and single cell suspensions were stained and analyzed by flow cytometry to assess TILs. On Day 0, CT26-luc cells were surgically implanted into cecum of Balb/c mice. On Day 3, mice are imaged, randomized, and dosed twice- weekly for 4 weeks (APR003 and/or anti-PDL1). On Day 0, CT26-luc cells were surgically implanted into the right liver lobe of Balb/c mice. On Day 4, mice were imaged, randomized, and dosed twice-weekly for 4 weeks with APR003 (either PO or SC) and anti-PDL1. AH1 is a known antigen in the CT26 tumor cells (ref 6) • As clinical proof-of-concept, intratumoral TLR9 agonists have shown promising anti-tumor responses in combination with checkpoint inhibitors; however, successful clinical applications have been limited to cutaneous-accessible tumor types (ref 2) • APR003 was designed using medicinal chemistry principles of liver-targeting drugs, including transporter uptake properties (ref 3) Route PK Parameters Mouse Monkey IV Dose (mg/kg) 3 1 t 1/2 (h) 2.92 1.38 CL (mL/min/kg) 99.6 21.6 V dss (L/kg) 1.88 0.688 Oral Dose (mg/kg) 10 5 T max (h) 0.25 0.58 C max (ng/mL) 94.2 104 AUC 0–t (ng·h/mL) 76.5 178 F (%) 4.6 4.2 PK Liver Serum AUC (ng*h/mL) PO (30mpk) 5000 310 SC (100μg) 4400 1800 TNFa is not required for T cell mediated anti-tumor efficacy and is associated with poor tolerability at high levels (ref 4) LOCAL IMMUNE PRIMING LEADS TO SYSTEMIC ANTI-TUMOR IMMUNITY http://www.aprostx.com/
Transcript of Gastrointestinal/liver-targeted TLR7 agonist for treatment ...
RESEARCH POSTER PRESENTATION TEMPLATE © 2019
www.PosterPresentations.com
v Drug Design: using medchem principles for liver-specific drugs (e.g. statins)v In vitro: selective on TLR7 (pDC) over TLR8 (monocyte); active across speciesv PK: pulsatile kinetics, high exposure in GI and liver, low peripheral tissue distributionv PD: robust IP-10 and ISG response (desired), with minimal TNFa, IL-6, IL-10 (detrimental)v Efficacy: efficacious in orthotopic models of colorectal and liver cancer (CT26, Hepa1.6,
4T1) as single agent and/or in combination with anti-PD1/L1v MOA: increased activated CD103+ DC frequency in DLN and tumor-specific CD8+ TILsv Tox: no major toxicity identified in relevant speciesv Clinical Applications: GI malignancies with liver metastases and potentially other cancers
with liver metastasesv Product Differentiation: potential wider therapeutic window compared to other oral TLR7
agonists or TLR7 agonist administered systemicallyv References: 1) Science 2018, 362, 6411 ; 2) Cancer Discov. 2018, 8, 1250-1257; 3) Curr
Top Med Chem 2013, 13, 857-866; 4) Cell Reports 2018, 25, 3074-3085; 5) Trends Immunol. 2016, 37, 855-865; 6) PNAS 1996, 93, 9730-9735
For more information please email: [email protected]
012345678
DMSO 0.4 3.7 33
[Compound] (µM)
%IF
Na-
posi
tive
pDC
s APR003R848
Apros Therapeutics, San Diego, CA
Andrew T. Miller, Evelyn Rodrigo, Manny Corpuz, David Plouffe, Tom Y.-H. Wu
Gastrointestinal/liver-targeted TLR7 agonist for treatment of colorectal and liver cancers
1. Introduction• Checkpoint inhibitors (PD-1/PD-L1
antibodies) have become the backbone of IO therapies, however, only a fraction of patients respond
• Current data suggest response rates are influenced by a myriad of mechanisms affecting the tumor microenvironment, including mutational burden and level of immune infiltrate (ref 1)
• Innate immune agonists have the capacity to convert “cold” immune quiescent tumors into “hot” infiltrated tumors, thus providing a complementary mechanism to checkpoint blockade
2. Toll-Like Receptor 7
• Expression: Human TLR7 expressed mainly in plasmacytoid dendritic cells (professional APC)
• Function: TLR7 activation elicits Type I interferon, upregulates costimulatory molecule (CD86), increases antigen processing/presentation (MHC), and drives greater T cell stimulation
• Druggability: One of the few innate immune receptors that can be activated by small molecule, which allows for fine tuning of ADME/PK properties using proven medchem design principles
• Examples: Intratumoral TLR7 agonists have demonstrated pre-clinical and early clinical efficacy in solid tumors (NKTR-262, MEDI-9197, LHC165)
3. APR003 is a GI/Liver-Targeted Oral TLR7 agonist
• Systemic administration leads to poor tolerability and potential immune tolerance induction• Intratumoral administration affords local immune priming of tumor antigens leading to
systemic (abscopal) immunity, but application limited to cutaneous accessible tumors• Oral GI/liver targeted TLR7 agonist can circumvent the limitations of both systemic and
intratumoral approaches to treat colorectal and liver cancers, and potentially other cancers with liver metastases
InflammationSystemic Intratumoral Oral GI/liver-
targeted
Dowling, ImmunoHorizons 2018, 2, 185-197
INNATE ADAPTIVE
4. GI/Liver Targeting Through OATP
0.5µMAPR003
5µMAPR003
5µMAPR003 + BSP
0.5µMAPR003
5µMAPR003
5µMAPR003
+ Rifampicin
OATP1A2(enterocytes)
OATP1B1(hepatocytes)
5. In vitro ActivityHEK-TLR7 assay
0.001 0.01 0.1 1 10 1000
20
40
60
80
100
Conc. (µM)
% M
axA
ct
HEK-TLR7
R848
APR003
GS-9620
0.001 0.01 0.1 1 10 1000
20
40
60
80
100
Conc. (µM)
% M
axA
ct
HEK-TLR8
APR003
GS-9620
R848
HEK-TLR8 assay
pDC IFNa assay hPBMC IP-10 assay
0.01 0.1 10
50
100
150
uM
% o
f A00
1 M
ax
APR003 (hPBMC)
APR003R848
GS-9620
0.01 0.1 10
50
100
150
uM
% o
f A00
1 M
ax
APR003 (hPBMC)
APR003R848
GS-9620
• Effective concentration at 50% of maximal response (EC50)are shown for sigmoidal dose response curves.
• Lowest effective concentration (LEC), defined as the lowest concentration of test compound that elicited at least 3-fold signal over vehicle control, are shown for bell-shaped dose response curves.
6. Pharmacokinetics
7. Pharmacodynamics
0 20 40 60 80 100 1201
10
Fold
ove
r ve
hicl
e
IFNb expression
Small Intestine
Mesenteric LN
Liver
Large Intestine
Time (min)
Primary Response (30mpk; PO):IFNb expression (<2hrs)
0 20 40 60 80 100 1201
10
100
1000
Fold
ove
r ve
hicl
e
IP-10 expression
Small Intestine
Mesenteric LN
Liver
Large Intestine
Time (min)
Primary target activation in GI, liver, MLN
Secondary Response (30mpk; PO):
0 20 40 60 80 100 1201
10
100
1000
Fold
ove
r ve
hicl
e
IP-10 expression
Small Intestine
Mesenteric LN
Liver
Large Intestine
Time (min)
IP-10 (<2hrs)
0 20 40 60 80 100 1201
10
100
1000
Fold
ove
r ve
hicl
e
IP-10 expression
Small Intestine
Mesenteric LN
Liver
Large Intestine
Time (min)Amplified secondary ISG response in target tissues
0.1 1 10 100 10001
10
100
100
1000
10000
[compound] mpk
ISG
15 (f
old
over
veh
icle
)
A221 (liver PD vs serum PD)
ISG15 (liver)
IP-10 (serum)
[IP-10] pg/m
L
Dose-dependency (5hrs)Secondary Response:
[APR003] mg/kg
Dose-dependent increase in liver and serum
Tissue Distribution in mice dose PO (1hr)
Plasma
HeartLive
r
SpleenLung
KidneyBrai
n
Stomach
Small In
testin
e
Large I
ntestin
e
Testi
cleOva
ry FatSkin
Skelet
al1
10
100
1000
10000
100000
Con
c (n
g/m
L)
• Pulsatile kinetics (ideal for in situ vaccination): High clearance, short elimination half-life, and low volume of distribution
• Tissue-restricted distribution: concentrates in the GI, liver, and kidney (consistent with transporter profile)
• Primary response (transient): IFNb expression elicited in GI, liver, mesenteric lymph node• Secondary response (amplified): interferon stimulated genes (ISG) in the target tissues
and interferon-inducible protein 10 (IP-10) in serum• Dose dependency: no bell-shape response observed over 1000-fold range
8. IP-10 Induction Over TNFa
0.1 1 10 10010
100
1000
10000
0
100
200
300
400
[compound] mpk
[IP10
] pg/
mL
GS-9620 (IP-10)
APR003 (TNFa)GS-9620 (TNFa)
APR003 (IP-10)
[TNFa] pg/m
L
PD dose response Body weight change after a single high dose
0 1 2 3 4 5 6 7-15
-10
-5
0
5
10
% c
hang
e in
bod
y w
eigh
t
% change in body weight from Day 0
Vehicle
A221 (300mpk)
GS-9620 (150mpk)
Days
APR003 (300mpk)
0.1 1 10 10010
100
1000
10000
0
100
200
300
400
[compound] mpk
[IP10
] pg/
mL
GS-9620 (IP-10)
APR003 (TNFa)GS-9620 (TNFa)
APR003 (IP-10)
[TNFa] pg/m
L
• APR003 induced stronger IP-10 response over TNFa compared to GS-9620 (oral TLR7 agonist, Phase 2 for HBV)
• GS-9620 caused more body weight loss at doses that produced similar IP-10 levels as APR003
9. Orthotopic Syngeneic Liver Tumor Model
10. CT26 Liver Tumor Model
11. CT26 Liver Tumor Model (Dose Response)
12. CT26 Colorectal Tumor Model
13. Local Immune Priming (CD103 dendritic cells)
14. Increased Tumor-Infiltrating CD8 T Cells
15. Tissue-Specific vs Systemic Administration
16. Summary
• Bioluminescence imaging allows non-invasive monitoring of tumor growth on internal organs• Cross-validation by gross examination, liver weights, and survival
0 10 20 304
6
8
10
Bio
lum
ines
ence
Log
10 (F
lux
p/s)
Veh
negative control
0 10 20 304
6
8
10
Bio
lum
ines
ence
Log
10 (F
lux
p/s)
aPDL1
negative control0 10 20 30
4
6
8
10
Bio
lum
ines
ence
Log
10 (F
lux
p/s)
A221 (30mpk) + anti-PDL1negative control
0 10 20 304
6
8
10
Bio
lum
ines
ence
Log
10 (F
lux
p/s)
A221 (30mpk)
negative control
Vehicle Anti-PDL1 APR003
0 10 20 30 40 50 600
20
40
60
80
100
Day
% s
urvi
val
Survival
Vehicle
aPDL1
A221A221 + aPDL1
Tumor free mice: re-challenged subQ on D68
Median Survival Time
41 days
43 days
52.5 days58.5 days
**
***
0 5 10 15 20 25 30 35
6
8
10
Mea
n bi
olum
ines
ence
Log
10 (p
h/s)
± S
EM
VehaPDL1A221 (30mpk)A221 (30mpk) + anti-PDL1negative control
*
Days post-implant
***
randomization and start of treatment
treatments
Tumor Burden Survival
SC tumor rechallengeof survivors
APR003 + Anti-PDL1
0 10 20 30 40 50 600
20
40
60
80
100
Day
% s
urvi
val
Survival
Vehicle
aPDL1
APR003APR003 + aPDL1
Tumor free mice: re-challenged subQ on D68
Median Survival Time
41 days
43 days
52.5 days58.5 days
**
***
Tumor Burden
0 5 10 15 20 250
500
1000
Tum
or v
olum
e (m
m3)
Day 10, 22 post-subQ rechallengeAge-matched Control
aPDL1
APR003
APR003 + anti-PDL1
Day post-subQ rechallenge
P-value* = <0.05** = <0.01*** = <0.001
Tumor burden was monitored weekly by bioluminescent imaging. Data on left show mean bioluminescence and individual animal traces below.
• In an orthotopic CT26 liver cancer model, APR003 (30 mg/kg) decreased tumor burden and increased survival as a single agent and effects were augmented in combo with anti-PDL1
• Survivors resistant to subcutaneous tumor re-challenge, suggesting adaptive systemic immunity
On Day 0, CT26-luc cells are surgically implanted into the right liver lobe of Balb/c mice. On Day 4, mice are imaged, randomized, and dosed 2x/wk for 4 wks
Re-challenge survivors subQ
0 7 14 21 35 68Day
Dose
12
18
25
33
Vehicle APR003 APR003 + Anti-PDL1Day Liver weights
28
Anti-PDL1
4
Image
• In an orthotopic CT26 colon cancer model, APR003 (30 mg/kg) decreased tumor burden and increased survival as single agent and effects were augmented in combo with anti-PDL1
• APR003 induced a greater frequency of activated CD103+ dendritic cells in liver draining lymph nodes, but not in distal non-draining lymph nodes
CD8
B220
CD3
5.6 9.7 8 13
CD8+
CD3+B220-
AH1-dextramer
Following 3 therapeutic doses, liver tumors were removed, and single cell suspensions were stained and analyzed by flow cytometry to assess TILs.
Vehicle Anti-PDL1 APR003APR003
+ anti-PDL1
• Combination treatment of APR003 on top of anti-PD-L1 further increased tumor-specific (AH1+) CD8+ T cells in the liver tumor
*
n.s.
Tumor Burden
0 10 20 30 40
6
8
10
Day post implant
Mea
n bi
olum
ines
ence
Log
10 (F
lux
p/s)
Exp035: CT26 IH
Vehicle control
Anti-PDL1
APR003 (SubQ) + aPDL1
APR003 (oral) + aPDL1
Negative control
treatments
randomization and start of treatment
0 10 20 30 40
6
8
10
Day post implant
Mea
n bi
olum
ines
ence
Log
10 (F
lux
p/s)
Exp035: CT26 IH
Vehicle control
Anti-PDL1
APR003 (SubQ) + aPDL1
APR003 (oral) + aPDL1
Negative control
treatments
randomization and start of treatment
Median Survival (d)4245>98 * n.s.
80
On Day 0, CT26-luc are surgically implanted into the right liver lobe of Balb/c mice. On Day 4, mice are imaged, randomized, and dosed 2x/wk for 4 wks
Vehicl
e contro
l
Anti-PDL1
APR003 (
oral)
+ aPDL1
APR003 (
subQ) +
aPDL1
100
1000
10000
[IP10
] pg/
mL
Serum IP-10 (post 5th dose)IP-10
Vehicl
e contro
l
Anti-PDL1
APR003 (
oral)
+ aPDL1
APR003 (
subQ) +
aPDL1
100
1000
[IL-6
] pg/
mL
Serum IL-6 (post 5th dose)IL-6
Vehicl
e contro
l
Anti-PDL1
APR003 (
oral)
+ aPDL1
APR003 (
subQ) +
aPDL1
10
100
[TN
Fa] p
g/m
L
Serum TNFa (post 5th dose)TNFa
Cytokine profile (5hr post 5th dose)
• Systemic administration (via subcutaneous injection) of APR003 is less efficacious compared to tissue-specific oral administration at comparable liver exposure
• However, despite similar levels of IP-10 induction, systemic administration (higher serum exposure) induced more serum IL-6 and TNFa, which were not essential for anti-tumor efficacy and can lead to poor tolerability
• Therefore, GI/liver-targeted oral administration is a more optimal way to deliver TLR7 agonist to colorectal and liver cancers over systemic administration
10 20 30 405
6
7
8
9
Day post implant
Bio
lum
ines
ence
Log
10 (F
lux
p/s)
10 20 30 405
6
7
8
9
Day post implant
Bio
lum
ines
ence
Log
10 (F
lux
p/s)
10 20 30 405
6
7
8
9
Day post implant
Bio
lum
ines
ence
Log
10 (F
lux
p/s)
10 20 30 405
6
7
8
9
Day post implant
Bio
lum
ines
ence
Log
10 (F
lux
p/s)
0 10 20 30 406
7
8
Day post implant
Bio
lum
ines
ence
Log
10 (F
lux
p/s)
+ S
EM
Vehicle
aPDL1
A221
A221 + aPDL1
enrollmentTumor Burden
APR003 + Anti-PDL1Vehicle Anti-PDL1 APR003
On Day 0, CT26-luc are surgically implanted into the cecum of Balb/c mice. On Day 3 mice are imaged and randomized, followed by 2x/wk dosing on Day 4 for 4 weeks. Tumor burden was monitored weekly by bioluminescent imaging. Data on left show mean bioluminescence and individual animal traces below.
**
*
****
0 10 20 30 40 50 60 700
20
40
60
80
100
Day post implant
% s
urvi
val
Survival
Vehicle
anti-PDL1
APR003
APR003 + aPDL1
Survival
0 10 20 30 40 50 60 700
20
40
60
80
100
Day post implant
% s
urvi
val
Survival
Vehicle
anti-PDL1
APR003
APR003 + aPDL1
MedianSurvival Time26.5 days
41 days36.5 days59.5 days *
*********
P-value* = <0.05** = <0.01*** = <0.001**** = < 0.0001
***********
On Day 0, 1e5 CT26-luc were surgically implanted into the right liver lobe of Balb/c mice. On Day 5, mice were imaged, randomized, and dosed twice perweek starting on Day 5. Tumor burden was monitored weekly by bioluminescent imaging.
Efficacy in Dose Response (D29)
0 10 20 30
6
8
10
Mea
n bi
olum
ines
ence
Log
10 (F
lux
p/s)
+/-
SEM
CT26 IH model
Vehicle
anti-PDL1
A221 (1mpk) + anti-PDL1
A221 (3mpk) + anti-PDL1
A221 (10mpk) + anti-PDL1
A221 (30mpk) + anti-PDL1
A221 (100mpk) + anti-PDL1
A221 (300mpk) + anti-PDL1
Negative control
randomization and start of treatment
Days post implant
Tumor Burden
Vehicl
e
Anti-PDL1 1 3 10 30 100 300
A221 [mpk] + Anti-PDL1- ctrl
Vehicl
e
anti-
PDL1
A221 (
1mpk)
+ an
ti-PDL1
A221 (
3mpk)
+ an
ti-PDL1
A221 (
10m
pk) +
anti-
PDL1
A221 (
30m
pk) +
anti-
PDL1
A221 (
100m
pk) +
anti-
PDL1
A221 (
300m
pk) +
anti-
PDL1
Negat
ive co
ntrol
5
6
7
8
9
10
Mea
n bi
olum
ines
ence
Log
10 (F
lux
p/s)
+/-
SE
M
Mean - Day 29P-value
* = <0.05** = <0.01*** = <0.001**** = <0.0001
• APR003 exhibited anti-tumor efficacy over a wide dose range (10 – 300 mg/kg) in combination with anti-PDL1
BSP and rifampicin are inhibitors of OATP1A2 and OATP1B1, respectively
Cellular Assay R848 GS9620 APR003
TLR7 EC50 (µM) 0.14 0.21 0.23
TLR8 EC50 (µM) 2 >30 4.4
THP1 (TLR2/4/8) EC50 (µM) 9.7 >30 >30
hu PBMC IP-10 LEC (µM) 0.05 0.05 0.14
mk PBMC IP-10 LEC (µM) 0.14 0.14 0.41
ms Spleno IP-10 LEC (µM) <0.02 0.14 <0.02
AACR 2020Poster #684
• Target selectivity: APR003 is >10-fold selective for TLR7 over TLR8• Cellular activity: Active in plasmacytoid dendritic cells, but not in THP-1 monocytes• Species cross reactivity: Active across mouse, monkey, and human cells
TLR7 activation
Type I IFN(transient)
IP-10, ISG(amplified)
General Protocol: On Day 0, CT26-luc cells were surgically implanted into the right liver lobe of Balb/c mice. On Day 4, mice were imaged, randomized, and dosed twice-weekly for 4 weeks (APR003 and/or anti-PDL1). Tumor burden were monitored by bioluminescence imaging, and the statistical significance was calculated by 2-way ANOVA with multi-group comparison. Animal survival was tracked, and the statistical significance was calculated by log-rank test of Kaplan-Meier curves.
On Day 0, CT26-luc were surgically implanted into the right liver lobe of Balb/c mice. On Day 11, mice were imaged, randomized, and dosed on Day 11, 15, and 18, and then sacrificed on Day 19 to assess the frequency of activated CD103+ dendritic cells (cDC1) in the liver draining LNs (celiac, portal, and first mesenteric) versus non-draining LNs (axillary/brachial) by staining for MHCII and CD86.
Liver draining lymph nodes
Axillary/Brachial lymph nodes
CD45
MH
C II
Live/singlet gated
CD103
CD
86
Liver Tumor draining LNs
Vehicle
APR003
Vehicl
e
anti-P
DL1A22
1
Combo
Vehicl
e
anti-P
DL1A22
1
Combo0.0
0.5
1.0
1.5
2.0
%C
D45
+ M
HC
IIhi C
D10
3+ C
D86
+
Frequency of activated cDC1
Vehicle
anti-PDL1
A221
Combo
Draining LNs Non-draining LNs
**
CD103+ dendritic cells (cDC1s) are known to transport antigens to the lymph nodes and cross-present to tumor-specific CD8+T cells (ref 5)
On Day 0, CT26-luc were surgically implanted into the right liver lobe of Balb/c mice. Following 3 therapeutic doses, liver tumors were removed, and single cell suspensions were stained and analyzed by flow cytometry to assess TILs.
On Day 0, CT26-luc cells were surgically implanted into cecum of Balb/c mice. On Day 3, mice are imaged, randomized, and dosed twice-weekly for 4 weeks (APR003 and/or anti-PDL1).
On Day 0, CT26-luc cells were surgically implanted into the right liver lobe of Balb/c mice. On Day 4, mice were imaged, randomized, and dosed twice-weekly for 4 weeks with APR003 (either PO or SC) and anti-PDL1.
AH1 is a known antigen in the CT26 tumor cells (ref 6)
• As clinical proof-of-concept, intratumoral TLR9 agonists have shown promising anti-tumor responses in combination with checkpoint inhibitors; however, successful clinical applications have been limited to cutaneous-accessible tumor types (ref 2)
• APR003 was designed using medicinal chemistry principles of liver-targeting drugs, including transporter uptake properties (ref 3)
Route PK Parameters Mouse Monkey
IV
Dose (mg/kg) 3 1
t1/2 (h) 2.92 1.38
CL (mL/min/kg) 99.6 21.6
Vdss (L/kg) 1.88 0.688
Oral
Dose (mg/kg) 10 5
Tmax (h) 0.25 0.58
Cmax (ng/mL) 94.2 104
AUC0–t (ng·h/mL) 76.5 178
F (%) 4.6 4.2
PKLiver Serum
AUC (ng*h/mL)
PO (30mpk) 5000 310
SC (100μg) 4400 1800
TNFa is not required for T cell mediated anti-tumor efficacy and is associated with poor tolerability at high levels (ref 4)
LOCAL IMMUNE PRIMING LEADS TO SYSTEMIC ANTI-TUMOR IMMUNITY
http://www.aprostx.com/